Article

Liquid Surface-Enhanced Raman Spectroscopy (SERS) Sensor-Based Au-Ag Colloidal Nanoparticles for Easy and Rapid Detection of Deltamethrin Pesticide in Brewed Tea

1
Department of Physics, FMIPA, Universitas Indonesia, Kampus UI Depok, Jakarta 16424, Indonesia
2
Research Center for Physics, National Research and Innovation Agency, Kawasan PUSPIPTEK Building 442, Tangerang Selatan 15314, Indonesia
*
Author to whom correspondence should be addressed.
Crystals 2022, 12(1), 24; https://doi.org/10.3390/cryst12010024
Submission received: 17 November 2021 / Revised: 11 December 2021 / Accepted: 22 December 2021 / Published: 24 December 2021

Abstract

:
Deltamethrin pesticides can cause inflammation, nephrotoxicity and hepatotoxicity as well as affect the activity of antioxidant enzymes in tissues. As a result of this concern, there is a rising focus on the development of fast and reliable pesticide residue testing to minimise potential risks to humans. The goal of this study is to use Au-Ag colloid nanoparticles as liquid surface-enhanced Raman spectroscopy (SERS) to improve the Raman signal in the detection of deltamethrin pesticide in a brewed tea. The liquid SERS system is fascinating to study due to its ease of use and its unlikeliness to cause several phenomena, such as photo-bleaching, combustion, sublimation and even photo-catalysis, which can interfere with the Raman signal, as shown in the SERS substrate. Our liquid SERS system is simpler than previous liquid SERS systems that have been reported. We performed the detection of pesticide analyte directly on brewed tea, without diluting it with ethanol or centrifuging it. Femtosecond laser-induced photo-reduction was employed to synthesise the liquid SERS of Au, Au-Ag, and Ag colloidal nanoparticles. The SERS was utilised to detect deltamethrin pesticide in brewed tea. The result showed that liquid SERS-based Ag NPs significantly enhance the Raman signal of pesticides compared with liquid SERS-based Au NPs and Au-Ag Nanoalloys. The maximum residue limits (MRLs) in tea in Indonesia are set at 10 ppm. Therefore, this method was also utilised to detect and improve, to 0.01 ppm, the deltamethrin pesticide Limit of Detection (LOD).

1. Introduction

Tea is a refreshing beverage that the Indonesians have long recognised as an important part of their culture. Tea is also widely used for medicine and cosmetics. In Indonesia, tea is one of the most important plantation products, and it is widely exported. Indonesia is the world’s sixth largest producer and exporter of tea [1]. The export of tea leaves has been hampered in recent years due to pesticide residue on the leaves. According to trade data, deltamethrin pesticide residues were discovered in Indonesian tea exported to 28 major importing countries from 2001 to 2014 [2]. Deltamethrin has been used as pest prevention for aphids, red spiders, and grubs. Eating food containing deltamethrin residue could cause disease, including immune system disorders and blood diseases [3]. Deltamethrin pesticide is a type of pyrethroid used in controlling activity against insect-borne disease that has a half-life in the blood plasma of 11.5 h. Deltamethrin caused negative effects in the human neuronal system, reproductive system, and immune system and induced oxidative stress in skeletal muscles [4,5]. Methods used to determine residual deltamethrin pesticides include gas chromatography [6,7], high-performance liquid chromatography (HPLC) [8,9], capillary electrophoresis [10,11] and fluorescence quantification [12,13]. However, these techniques are time-consuming and necessitate access to complex and expensive laboratory facilities, particularly for sample preparation and clean-up [14,15]. Therefore, creating a simple, cost-effective, quick and sensitive approach for the detection of deltamethrin pesticides in food is critical.
Raman spectroscopy is a technique that uses the vibrational spectrum for the chemical bonds in a molecule while also being sensitive to changes in its environment [16,17]. As a result, Raman spectroscopy is a useful technique for chemical and physical analysis. The Raman spectrum provides information specific to a given compound, making molecule detection possible [18,19]. In addition, Raman spectroscopy requires a simple sample preparation [20]. Raman signals are frequently weak and can be considerably improved when molecules are adsorbed on a roughened metal surface or metal nanoparticles. This method is called surface-enhanced Raman spectroscopy (SERS). Electromagnetic enhancement (EM) and chemical enhancement (CM) are the most widely recognized in explaining the phenomenon of SERS [21,22]. The electromagnetic mechanism (EM) has been reported to be more crucial than CM [23]. The EM is based mainly on localised surface plasmon in a metal nanostructure [24,25]. The interaction between electromagnetic waves and plasmonic (Au, Ag or Cu) nanostructures will enhance the Raman signal in the EM mechanism [26,27].
The detection and determination of pesticides and other contaminants on food using SERS have been widely reported, particularly using solid substrate SERS, where one or more types of nanoparticles have been integrated into various substrates, such as paper or filter paper [28], adhesive tape [29], poly (dimethylsiloxane) (PDMS) film [30] and poly (ethylene terephthalate) covered with a layer of indium tin oxide (ITO) as flexible SERS [31]. SERS is generally divided into two categories: solid and liquid SERS [32]. Solid SERS substrate platforms provide substantially stronger signals than metal colloids. However, solid SERS has significant limitations because analyte molecules are always the same where the laser beam is focused on a specific region of the substrate. There is a constraint in the laser energy and density of the sample. This condition can cause several phenomena, such as photo-bleaching, combustion, sublimation and even photo-catalysis [33]. Integrating these platforms into on-line devices is difficult.
Applications of the colloidal nanoparticle platform have been reported for ultrasensitive detection of DNA and RNA, small proteins, enzymes, living organisms and in vivo cell studies, where on-line monitoring is required and a solid SERS substrate platform is not available. A new approach, a liquid colloidal nanoparticle platform, is being developed to allow detection in urine, saliva, blood and other bio-fluids. The prospect of combining the liquid colloidal and solid film platforms as sensor elements for SERS is currently under study [34]. The colloidal platforms are also employed in Raman flow cytometry [35] and microfluidics [36]. Therefore, further study into the liquid SERS platform is worthwhile.
Liquid SERS uses a solution of nanoparticles directly, without embedding the nanoparticles into the substrate. It is easier to prepare liquid SERS than solid substrate SERS. Several previous investigations have reported that the process of detecting an analyte using liquid SERS is not straightforward. The Rhodamine 6 G analyte solution is dissolved and centrifuged into ethanol [37], and liquid milk containing melamine is diluted, centrifuged and delaminated before being mixed with the colloidal nanoparticles, which are measured using a Raman Spectrometer [14]. In this experiment, we developed the liquid SERS method in a more straightforward and easier manner than previous experiments. We performed the detection of pesticide analyte directly on brewed tea, without diluting it with ethanol or centrifuging it. Tea containing pesticides was dropped directly into colloidal nanoparticles to measure the SERS spectra.
In this research, a liquid SERS sensor based on Au-Ag nanoparticles was utilised to demonstrate the detection of deltamethrin pesticides in a brewed tea. To the best of our knowledge, few studies have involved the detection of deltamethrin in tea using the SERS based Au-Ag NPs method. Previous reports on deltamethrin pesticide detection in soil using Au NPs [38] and in strawberries [39] have been published. The combination of Au and Ag into Au-Ag is fascinating to observe due to the possibility of combining the properties of Au NPs and Ag NPs. With this combination, the optical, electrical and catalytic properties of the mixture can be modified to match those of pure elements [40]. A femtosecond laser-induced photochemical reduction was previously used to synthesise Au-Ag nanoparticles. This study used Au-Ag as liquid SERSs. Raman spectroscopy was used to evaluate cuvettes containing a mixture of tea and colloidal nanoparticles. From the result of SERS signal-based Au NPs, Au-Ag nanoalloys and AgNPs, we determined which liquid SERS substantially impacted the enhancement of the Raman signal from deltamethrin pesticide.
In Indonesia, the maximum residue limit (MRL) allowable in tea is 10 ppm. It is necessary to determine whether our liquid SERS can detect the lowest levels of pesticide in brewed tea.

2. Materials and Methods

2.1. Chemicals

Deltamethrin (C22H19Br2NO3, 98.6% purity), potassium gold (III) chloride (KAuCl4, 98% purity), silver nitrate (AgNO3, 99.9% purity), liquid ammonia (NH4OH, 25 v/v%) and polyvinylpyrrolidone (PVP, 99.9% purity) were acquired from Sigma-Aldrich and utilised as received. Technical grade pesticide containing 25 mg/L of deltamethrin was obtained from Bayer Indonesia. We prepared a diluted technical pesticide at 500 ppm, 300 ppm, 100 ppm, 10 ppm, 5 ppm, 1 ppm, 0.1 ppm and 0.01 ppm for a stock solution. The brewed tea was made by adding 100 mL of boiling distilled water with a tea bag of Indonesian commercial black tea for 5 min brewing time. The stock solutions were stored in the refrigerator before use to avoid degradation.

2.2. Preparation and Synthesis of Au-Ag Nanoparticles

Nanoparticles were synthesised from the solutions of gold and silver ions prepared separately from dilution of KAuCl4 and AgNO3 in a water medium with the same concentration of 5 × 10⁻⁴ M. A trace amount of ammonia was added into the AgNO3 solution to improve the production of Ag nanoparticles and then mixed with 0.01 wt% PVP as a capping agent required to stabilise nanoparticles. Gold and silver ion solution was added individually into a quartz cuvette (10 mm × 10 mm × 45 mm dimension) with a total volume of 3 mL and irradiated by a femtosecond laser for 5 min to produce Au100Ag0 and Au0Ag100 nanoparticles. For Au50Ag50 nanoparticles, we combined the gold and silver ions in a volume ratio of 1:1 into a quartz cuvette and we irradiated the mixture with a femtosecond laser for 5 min. The experimental set-up is shown in Figure 1.
A Ti-sapphire femtosecond laser (SpitfireAce 100-F, Spectra-Physics, Irvine, CA, USA) was used in this experiment. The femtosecond laser has a laser power of 2.1 W, a fundamental wavelength of 800 nm, 100 fs full-width-half-maximum pulses and a repetition rate of 1 kHz. The laser beam was focused using an aspheric lens directly to the glass cuvette. An aspheric lens has a focusing length of 8 mm (NA = 0.5). Following irradiation, each sample was characterised by UV-Vis spectrophotometry (MayaPro 2000, Ocean Optics, Orlando, FL, USA) to observe the absorption spectra within the 300–800 nm range and reveal the localised surface plasmon resonance (LSPR) of nanoparticles. A transmission electron microscope (TEM, FEI Tecnai 20G S-Twin 200 kV) and X-ray diffractometer (Smartlab, Rigaku, Tokyo, Japan) were employed to explore the morphology and lattice crystal of nanoparticles.

2.3. Detection of Deltamethrin Residue in Tea Using Liquid SERS

We investigated the detection of deltamethrin contained in a brewed tea using a liquid SERS sensor considering Au-Ag nanoparticles. We employed colloidal Au0Ag100, Au50Ag50 and Au100Ag0 nanoparticles as a liquid SERS. The colloidal nanoparticles were deliberately made aggregate by storing for two weeks to form hot spots. First, the Raman spectra of pure deltamethrin, a technical pesticide from an Indonesian local brand and a brewed tea without deltamethrin were estimated. The Raman shifts of these materials were used as blank samples for comparison purposes in SERS detection of deltamethrin in a brewed tea.
Afterwards, we measured the Raman spectra of a brewed tea containing a technical pesticide. The tea-containing pesticide and the nanoparticles were then added into a glass cuvette with a total volume of 3 mL and a volume ratio of 1:2 and mixed, and their SERS spectra were measured using a Raman spectrometer. Raman spectroscopy was conducted using a modular-confocal micro-Raman spectrometer (HR550, Horiba Jobin Yvon, Tokyo, Japan) employing a 532 nm laser as an excitation source, a laser power of 250 mW, a selected grating of 1800 groove per mm and a magnification of 10×.

3. Results

Deltamethrin pesticides of the molecular formula C22H19Br2NO3 comprised C-H, C-Br, C=C, C=O, C=N, benzene ring and N-H group. Each chemical bond had a vibration position represented by a wave function in the Raman spectra. Theoretically, the vibration form of the chemical bond could be calculated using Gaussian v. 09 software. The assignment of Raman peaks of deltamethrin was calculated by Tao Dong et al. [39]. Experimentally, Raman spectra of deltamethrin could be obtained from Raman shift measurements using a Raman spectrometer. However, signal Raman spectra from standard Raman spectroscopy are quite weak. For enhancing the Raman signal, the development of liquid SERS as a sensing technique could be done using colloidal Au-Ag nanoparticles.

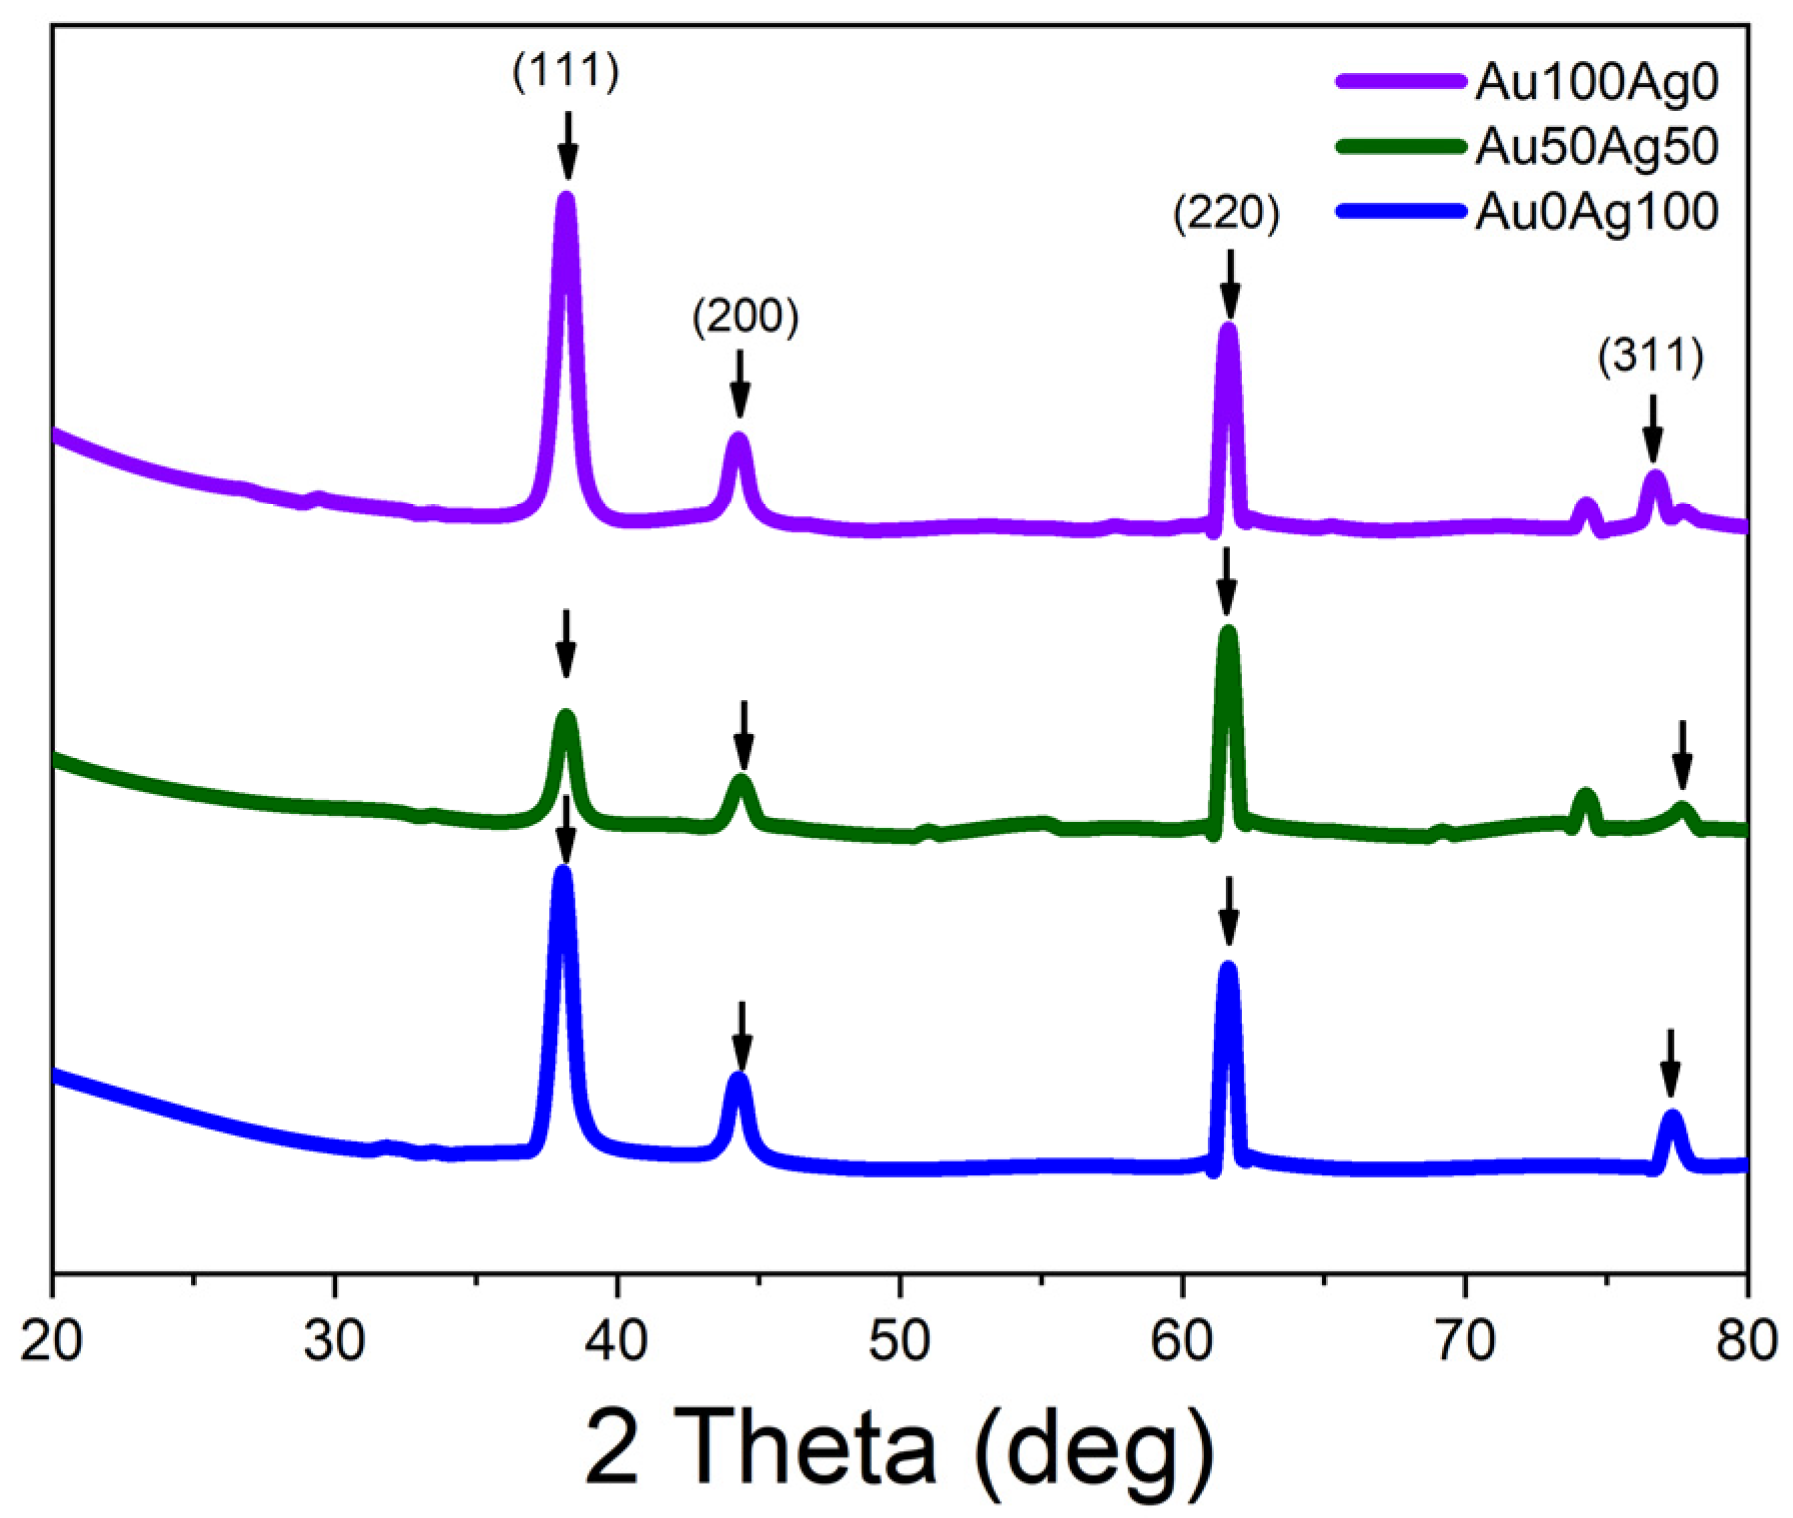
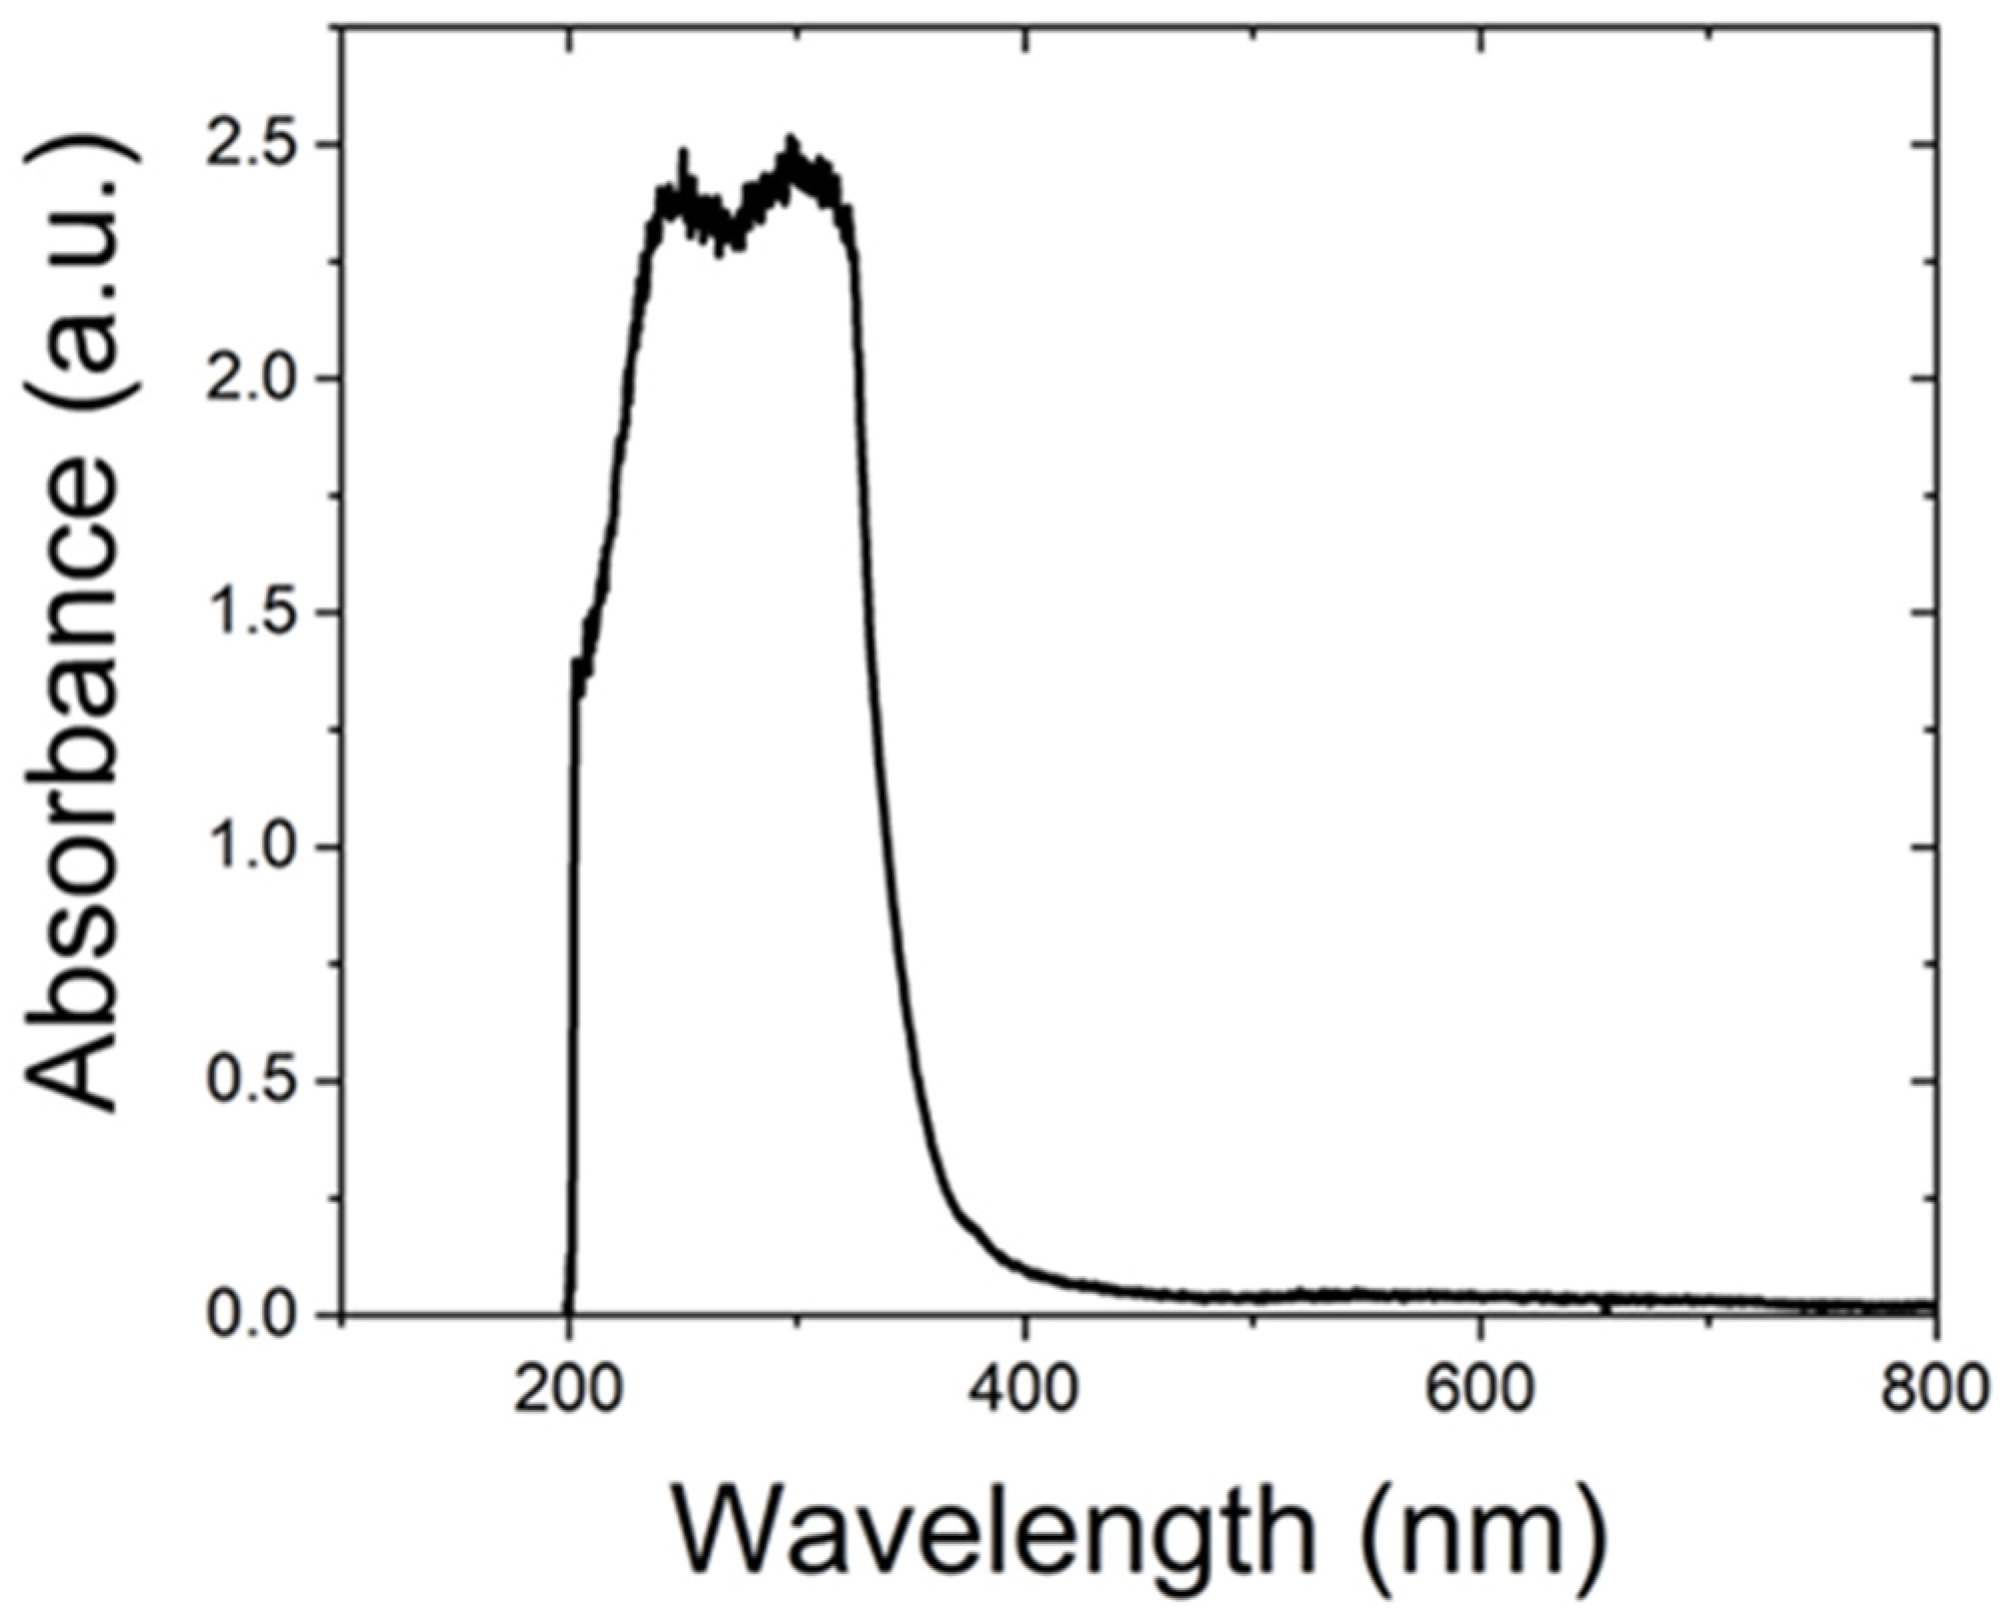
3.1. The Characterization of Au-Ag Colloidal Nanoparticles

The absorption spectra, lattice crystal, morphology, and size distribution of Au-Ag nanoparticles are illustrated in Figure 2, Figure 3 and Figure 4. Our Au-Ag nanoparticles synthesised with the femtosecond laser were labelled Au0Ag100, Au50Ag50 and Au100Ag0 as well as had LSPR at 409.06, 451.27 and 531.84 nm, respectively. We also validated that Au50Ag50 nanoparticles did not produce a new crystal lattice, since it is purely a 1:1 combination between gold nanoparticles (Au100Ag0) and silver nanoparticles (Au0Ag100), without any remarkable contamination. The Au50Ag50 crystal structure is the same as those of Au100Ag0 and Au0Ag100 nanoparticles with an fcc crystal structure at (111), (200), (220) and (311) hkl (see Figure 3). In addition, it was confirmed that the particle size of Au50Ag50 nanoparticles was (8.15 ± 5.53), (8.85 ± 5.55) and (7.17 ± 3.62), as depicted in Figure 4.

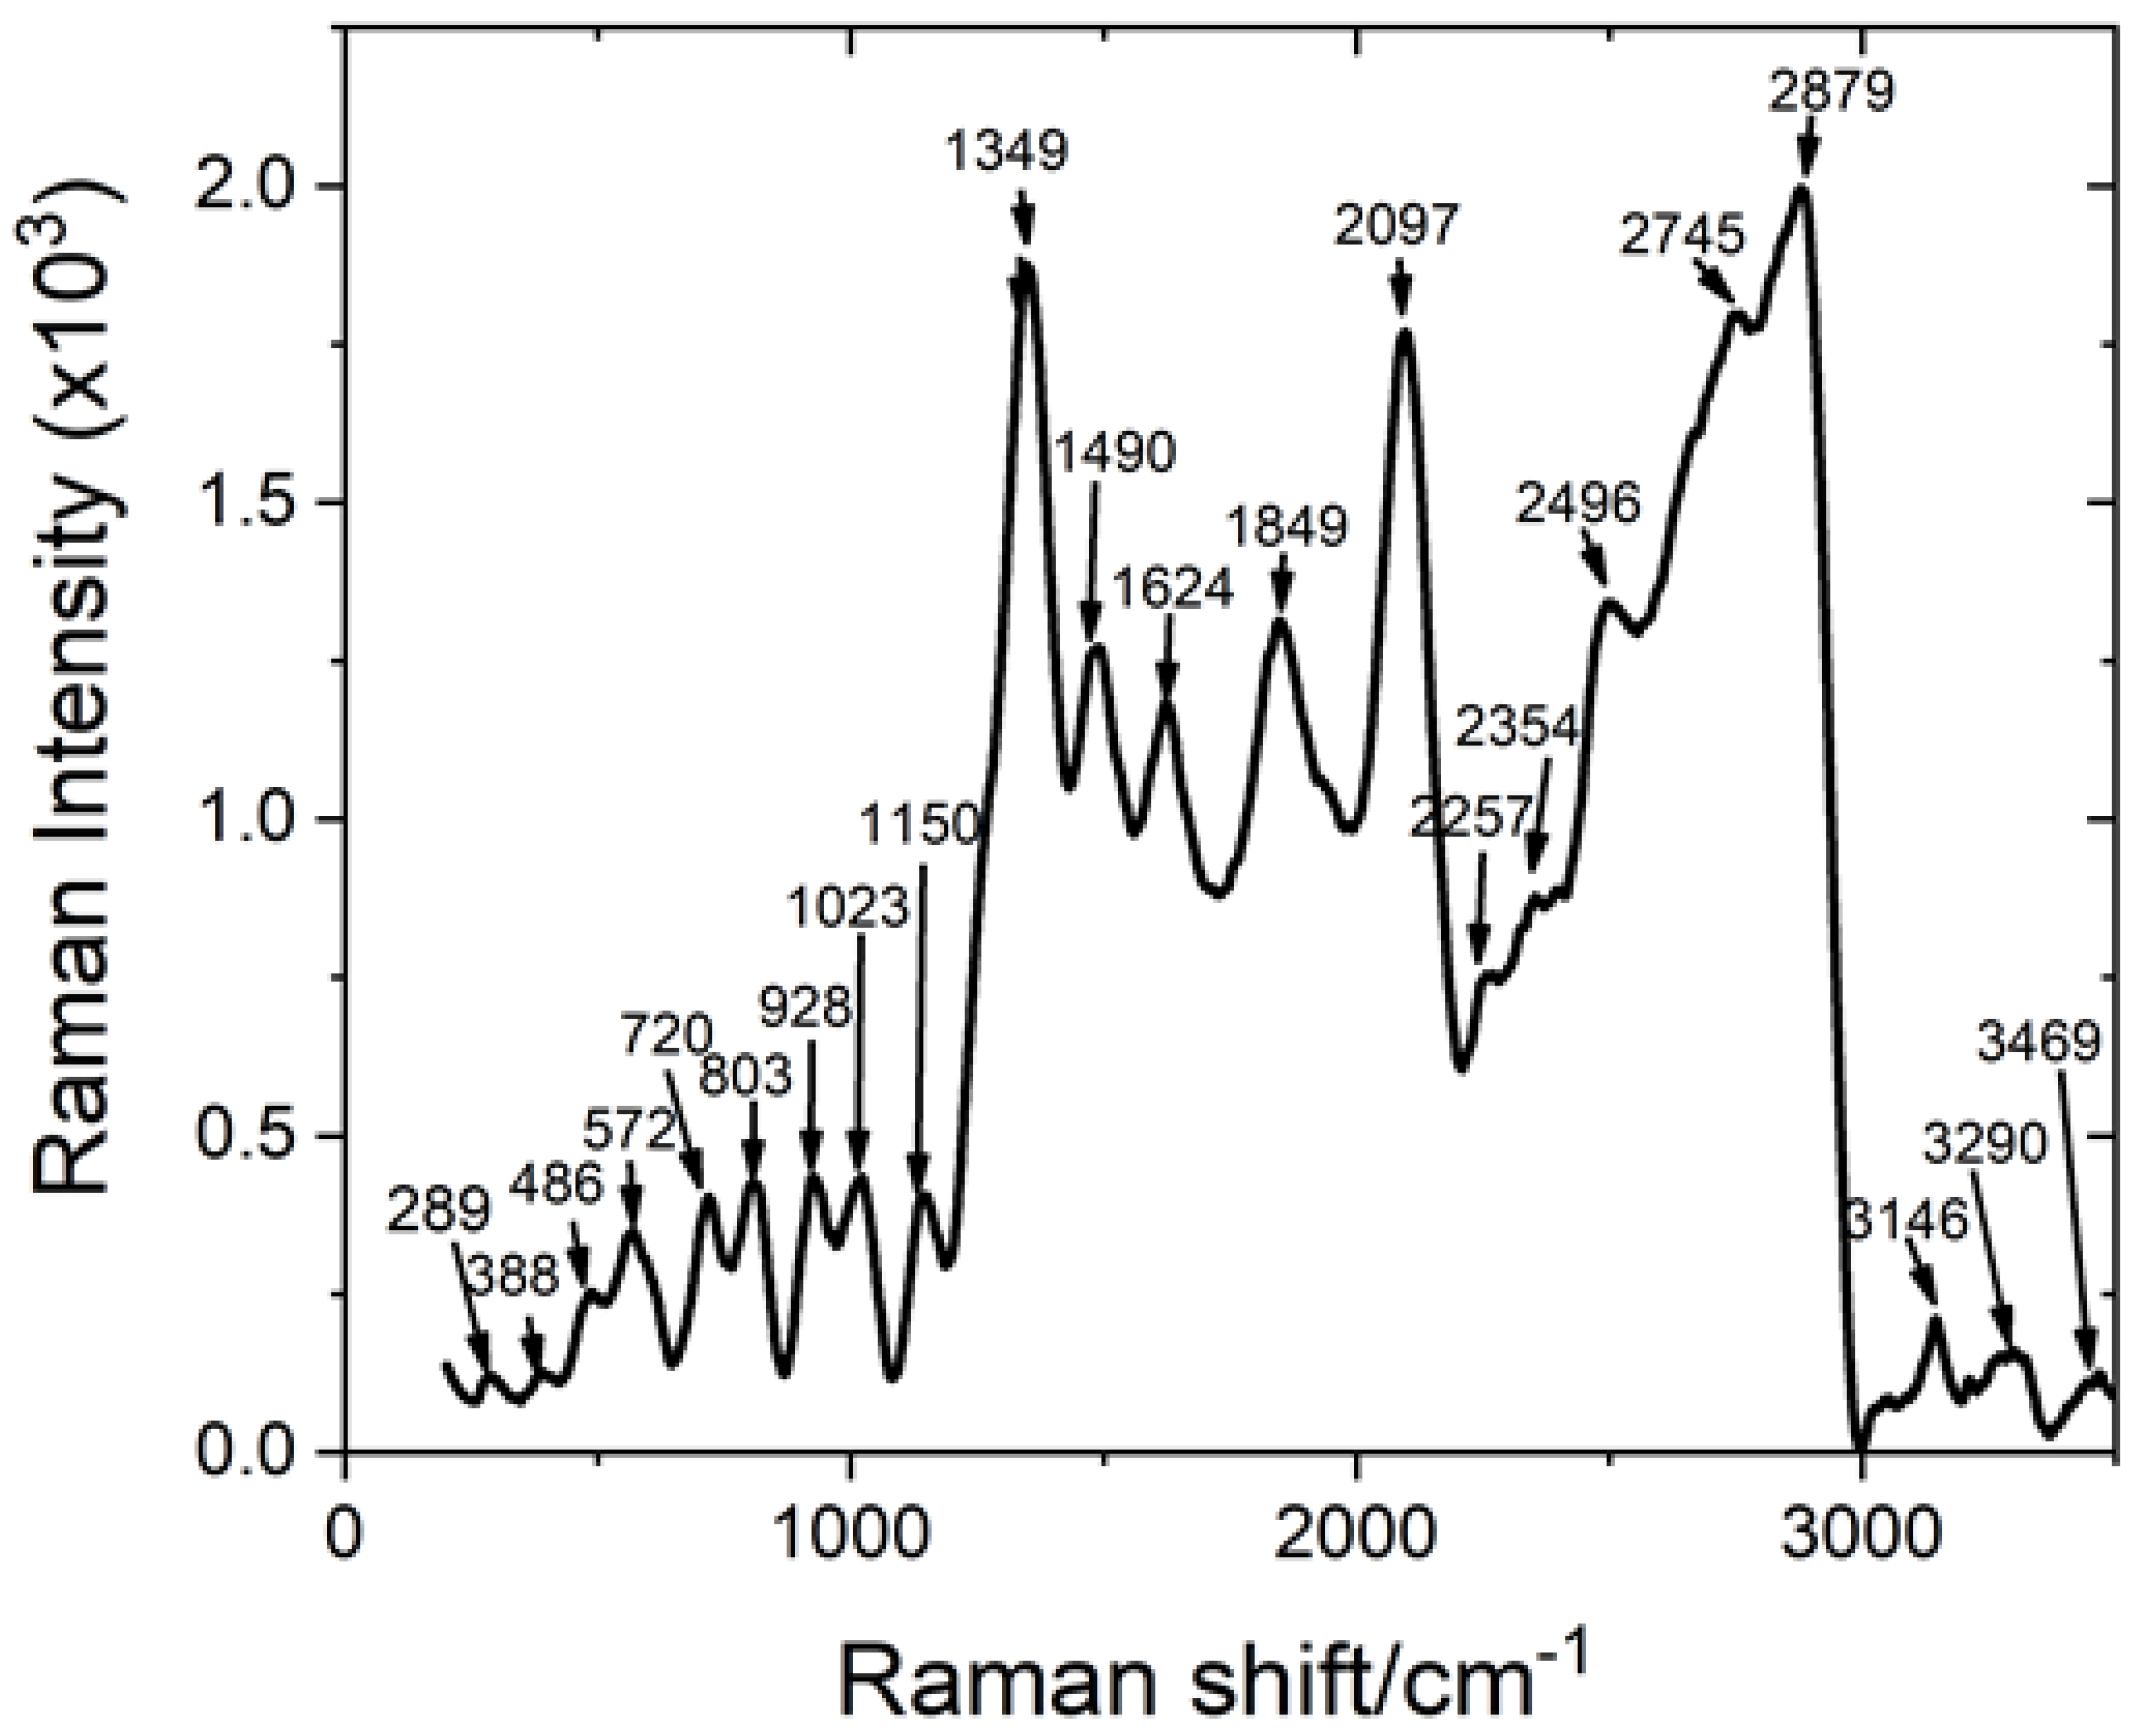
3.2. The Detection of Deltamethrin in a Brewed Tea Using Liquid SERS

The colloidal nanoparticles were applied as liquid SERS sensors for enhancing the Raman signal of deltamethrin-containing pesticide. Before measuring the deltamethrin pesticide in a brewed tea using a liquid SERS system, the absorbance of the deltamethrin pesticide was first measured with UV-Vis, and the Raman peak was measured using Raman spectroscopy. The absorbance result of the deltamethrin pesticide shows the range of 200–400 nm, as depicted in Figure 5. The selection of the 532 laser source in the Raman measurement is considered the most appropriate due to the fact that it is close to the absorbance area of the deltamethrin pesticide. The measurement results for the peak Raman from technical deltamethrin pesticide from Bayer Indonesia are shown in Figure 6.
Technical deltamethrin pesticide, as depicted in Figure 6, contains not only deltamethrin pesticide but also other unspecified compositions. We need to distinguish the deltamethrin peak from other peaks. The deltamethrin peak was taken from the measurement of the standard deltamethrin pesticide from Sigma-Aldrich as reference, and assignment of Raman peaks of deltamethrin was calculated by Tao Dong et al. [39].
To distinguish between the Raman peak of the pesticide deltamethrin and tea, brewed tea without pesticides was also measured by Raman spectroscopy, as depicted in Figure 7.
A brewed tea containing 500 ppm of pesticide and AuxAgy nanoparticles was mixed in the cuvette with a 1:2 volume ratio in a total volume of 3 mL before SERS measurement. Figure 8 indicates the SERS spectra of a brewed tea containing pesticide using Au100Ag0, Au50Ag50 and Au0Ag100 nanoparticles as compared with their correlated normal Raman spectra of a brewed tea without pesticide. As expected, adding nanoparticles into tea-containing pesticides improved the Raman signal for pesticides. From the measurement, it can be seen that Au0Ag100 nanoparticles were the most significant in the enhancement of the Raman signal of pesticides. The intensity enhancement of the Raman signal for pesticides using liquid SERS is listed in Table 1.
Figure 8 depicts the detection of 500 ppm pesticide in a brewed tea using the liquid SERS technique with Raman spectroscopy. Table 1 presents the intensity of the Raman signal; Au0Ag100 nanoparticles were the best liquid SERS-based nanoparticles for enhancing the Raman signal, surpassing both Au50Ag50 and Au0Ag100 nanoparticles. The Raman spectra of a brewed tea containing 500 ppm pesticide were detected, though no nanoparticles were added into the tea. However, the Raman signal of deltamethrin was weak. Gold nanoparticles added into tea as SERS Au100Ag0 could not enhance the Raman signal of deltamethrin, whereas a mixture of gold and silver nanoparticles enhanced the Raman signal, but not significantly. Added silver nanoparticles (Au0Ag100) enhanced the Raman signal remarkably, at 10 times the ordinary Raman intensity.
The colloidal nanoparticles were deliberately made aggregate to form hot spots, as presented in the TEM Figure 4. When analyte molecule deltamethrin pesticides are absorbed into liquid and interact with hot spots, the electromagnetic field will increase and enhance the Raman signals. The strong electromagnetic fields are affected by the hot spot areas, which occur as very small spatial regions between nanoparticles; SERS signals are stronger in the tiny hot spots.
There are two mechanisms in the SERS effect, the combination of an EM and a chemical mechanism (CM), which can simultaneously enhancement the Raman signal. The electromagnetic enhancement is influenced by the local increase of electric field in the vicinity of the NPs, due to LSPR. The CM arises from charge-transfer interaction between electronic states of the molecule and the surface of the nanoparticles, which will also increase Raman signals. As a result, the CM depends on the Raman-active molecule and its interaction with the surface of nanoparticles, whereas the EM depends on the surface plasmon resonance [41].
SERS Au0Ag100 improved Raman signals more than SERS Au100Ag0 and Au50Ag50. This result was influenced by the high electric field of Ag NPs. From the numerical simulation, the electromagnetic field distribution of Ag NPs is stronger than Au NPs and Au-Ag NPs, which increases the EM in the SERS effect [42]. Figure 2 shows that Ag NPs have the sharpest, narrowest and highest intensity of LSPR; therefore, Ag NPs generally indicate better plasmonic performance than other noble metals. Narrower plasmonic width will affect their characteristic of possessing a higher molar extinction coefficient [43]. In this experiment, the CM does not contribute to increasing the SERS effect, because the interaction between the Raman and the molecule investigated is the same.

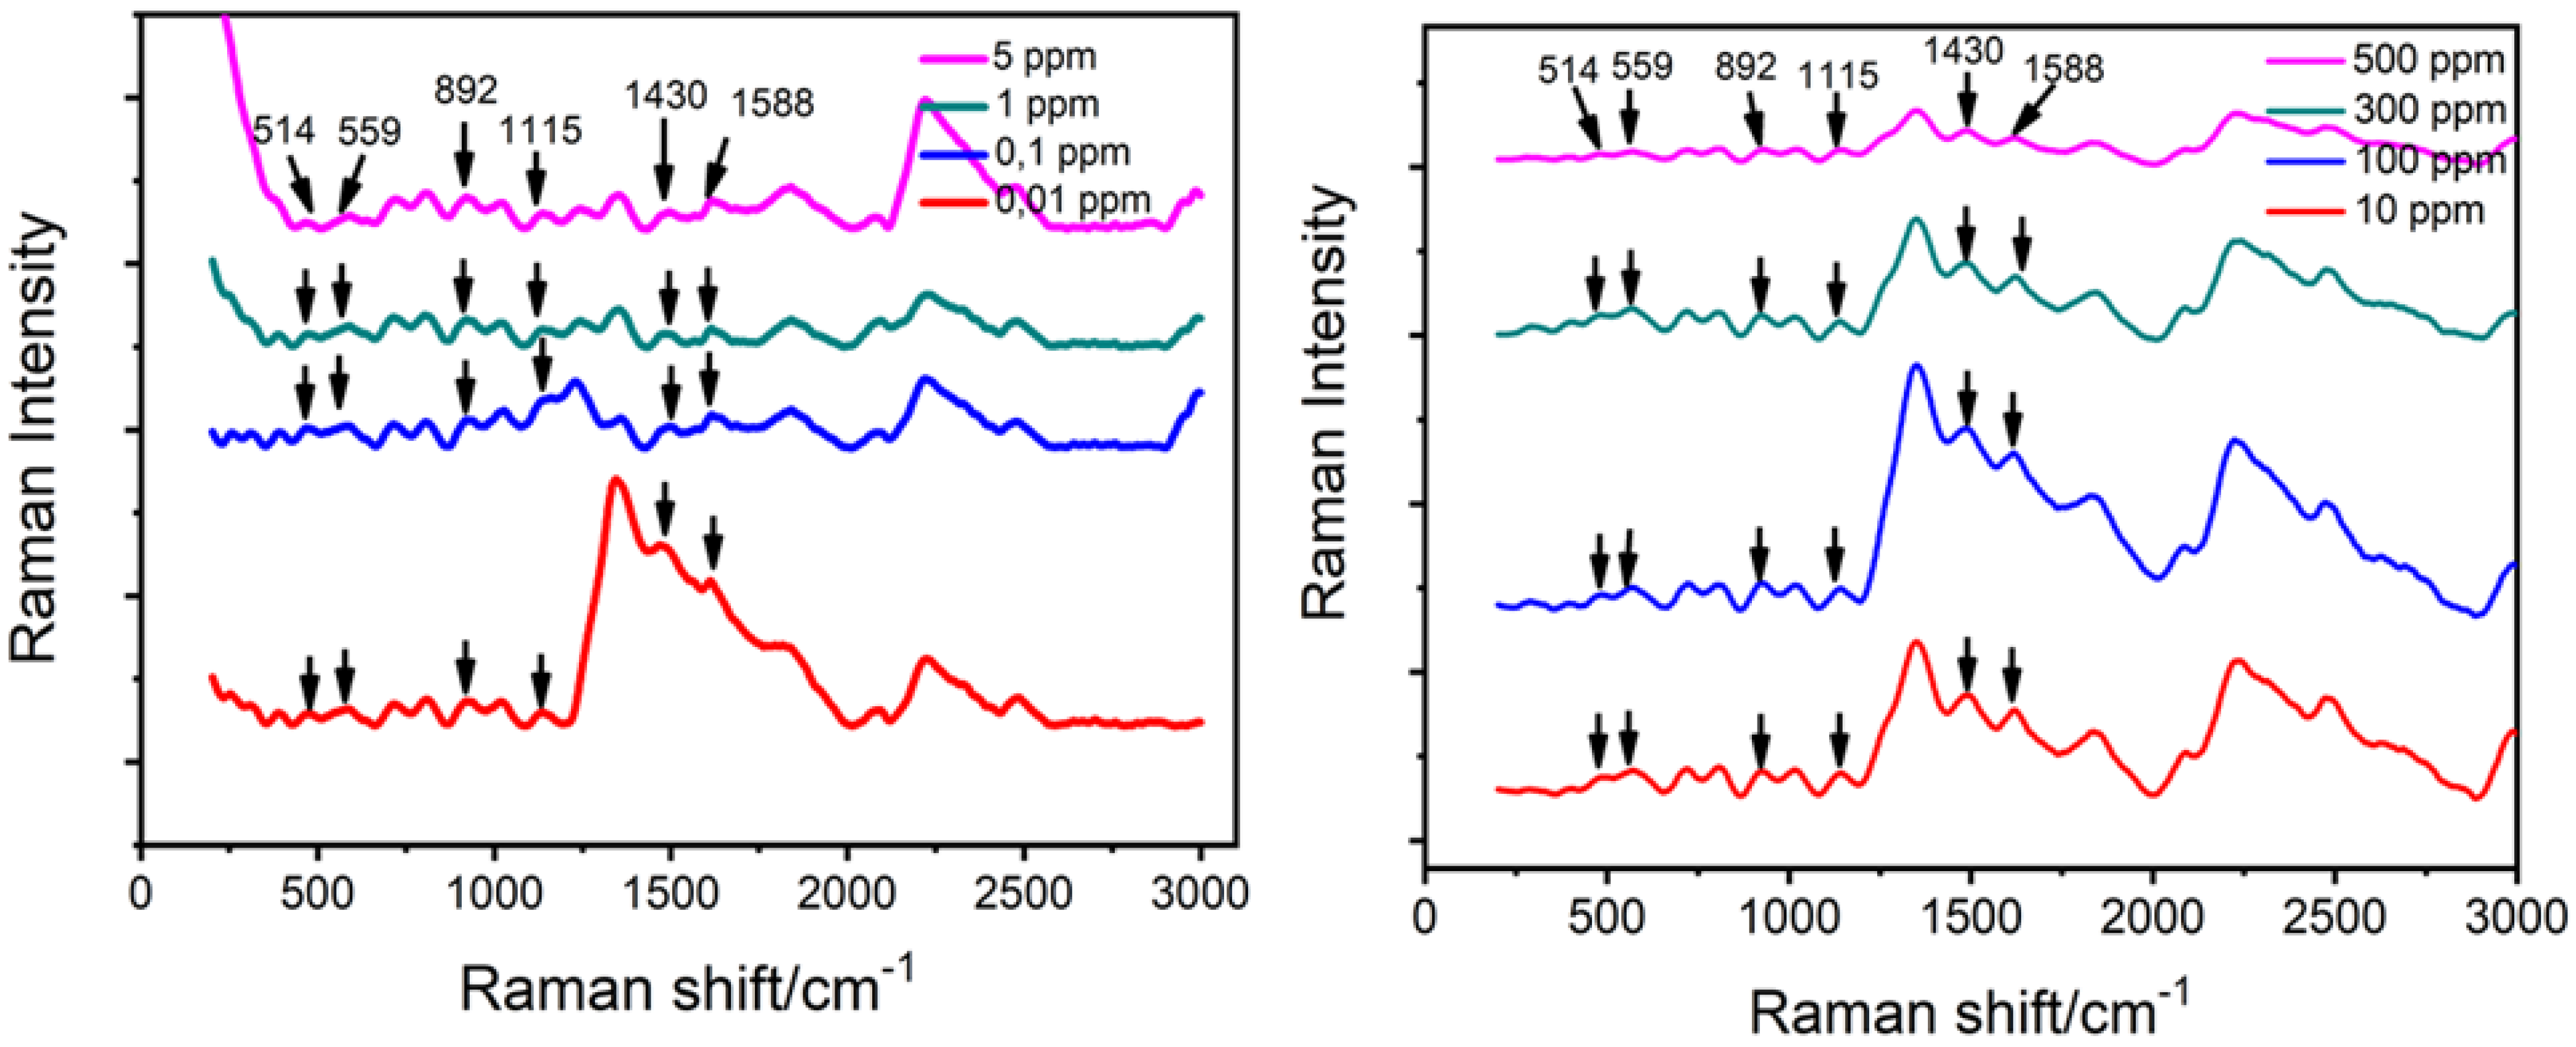
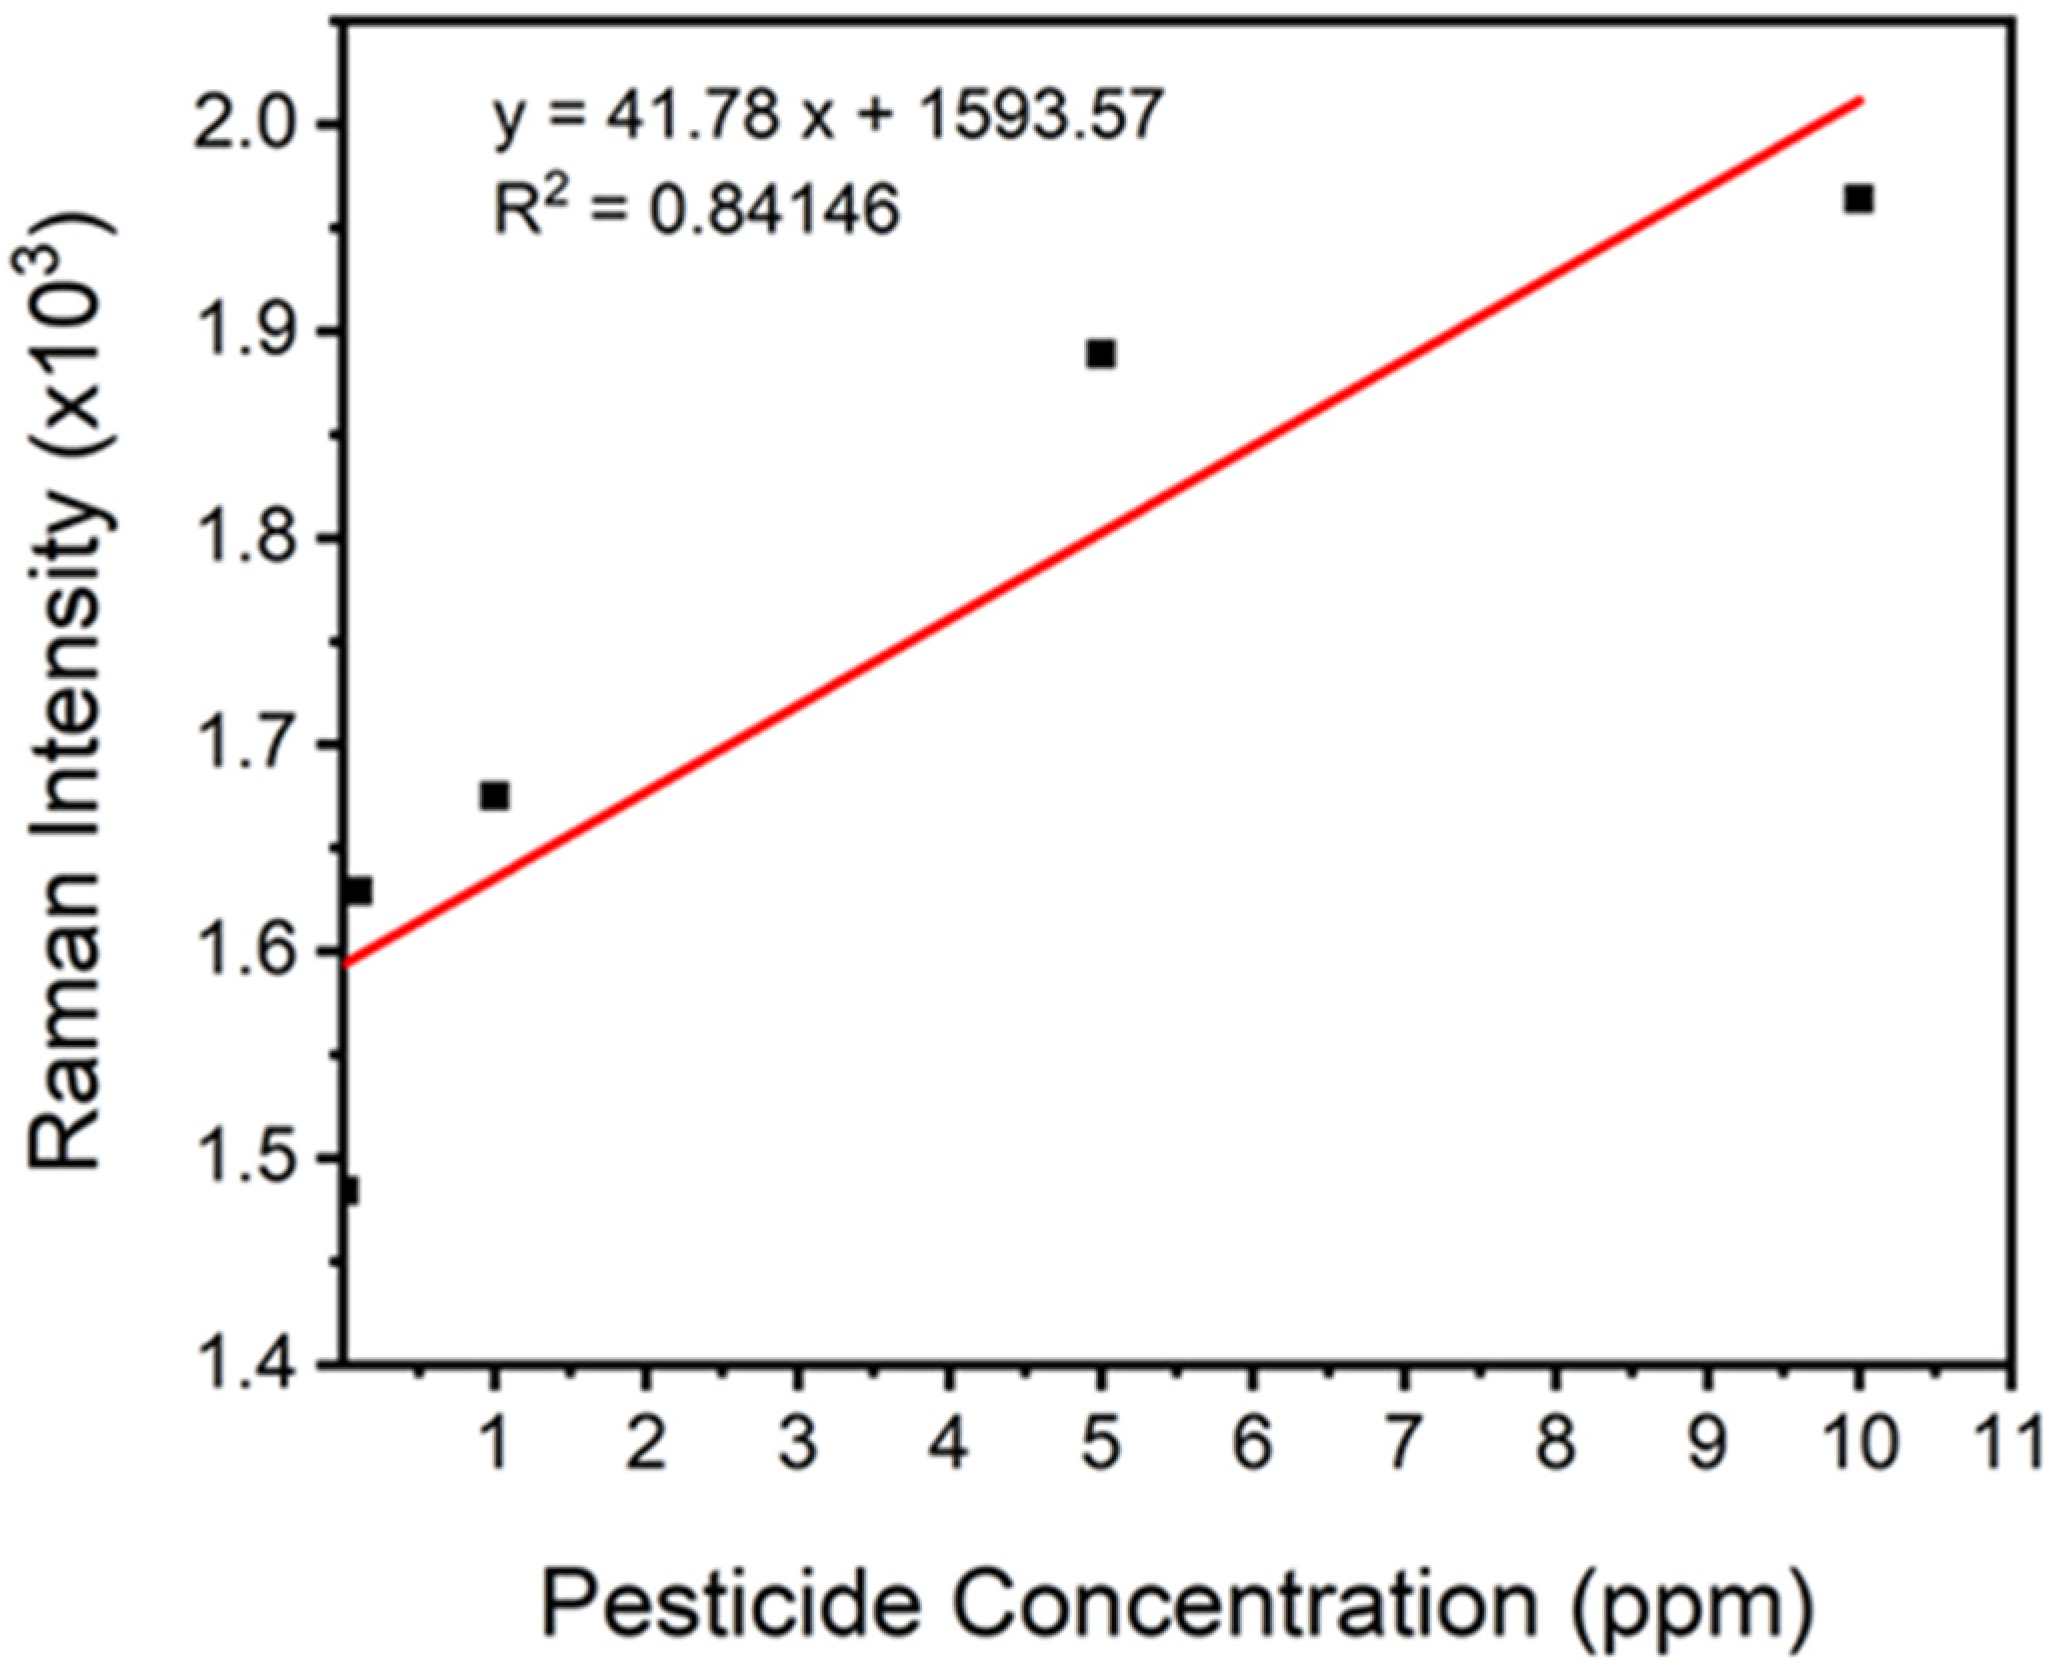
3.3. The Limit of Detection (LOD) of Deltamethrin Pesticide in Tea Using Au0Ag100 Liquid SERS

Previous findings showed that Au0Ag100 nanoparticles could enhance the Raman signal more than those of Au50Ag50 and Au100Ag0 nanoparticles in the detection of 500 ppm deltamethrin pesticide in a brewed tea. Therefore, we continued to use this technique to test a lower concentration of pesticide to determine the sensor.
Figure 9 shows the SERS spectra of deltamethrin pesticide in a brewed tea for a pesticide concentration ranging from 500 ppm down to 0.01 ppm using liquid SERS-based silver nanoparticles (Au0Ag100). In the SERS method, nanoparticles enhance the Raman signal through the value known as the enhancement factor (EF). The EF value provides information regarding the quality of our SERS technique. From Figure 9, the peaks of deltamethrin pesticide can be detected from 500 ppm up to 0.01 ppm concentration. Every peak was increased by liquid SERS based on Au0Ag100 nanoparticles but was not constantly high. We tested our liquid SERS method in a broad range of concentrations of pesticides, from 500 ppm to 0.01 ppm. The peak intensity curve for pesticide concentration in brewed tea for the standard curve was calculated only from 0.01 to 10 ppm, as depicted in Figure 10.
In the SERS method, the vibration mode of a given analyte in the normal Raman signal is influenced by the enhancement factor (EF). The EF depends directly on the intensity of the local electromagnetic field, which is called a hot spot. This hot spot can be regarded as a distance between one nanoparticle and another. The hotspot cannot be clearly identified since our SERS substrate was in the form of liquid, where the Brownian motion existed. In our data, the inconsistent enhancement of the deltamethrin pesticide peak in Figure 6 was influenced by unstable hot spots [44].

4. Conclusions

We investigated the detection of deltamethrin pesticides in tea using liquid SERS based on colloidal Au-Ag nanoparticles. We employed three Au-Ag nanoparticles for this study, including Au0Ag100, Au50Ag50 and Au100Ag0. The femtosecond laser was used to synthesise nanoparticles from gold and silver ions. The result for 500 ppm of deltamethrin pesticide demonstrated that liquid SERS-based Au0Ag100 enhanced the Raman signal more than liquid SERS-based Au100Ag0 and Au50Ag50. We continued with this method to detect deltamethrin pesticides in other concentrations lower than 500 ppm to determine the LOD. The LOD results showed that this technique can detect and enhance the Raman signal of deltamethrin pesticides to 0.01 ppm, but it was inconsistent with the enhancement of Raman signal. Future research is needed to determine the stability and consistency of the liquid SERS method.

Author Contributions

Conceptualisation, A.N.H.; methodology, A.N.H.; software, A.N.H.; validation, A.N.H., R.S., D.T. and Y.H.; formal analysis, A.N.H. and Y.H.; investigation, A.N.H. and D.T.; resources, Y.H.; data curation, A.N.H.; writing—original draft preparation, A.N.H.; writing—review and editing, Y.H.; visualisation, Y.H.; supervision, R.S., D.T. and Y.H.; project administration, A.N.H.; funding acquisition, D.T. All authors have read and agreed to the published version of the manuscript.

Funding

This research was funded by HIBAH Q3_FMIPA UI Nomor: NKB-012/UN2.F3/HKP.05.00/2021 and National priority program IPT LIPI Nomor: 26/A/DT/2021.

Data Availability Statement

The data presented in this study are available on request from the corresponding author.

Acknowledgments

The authors would like to thank Agung Beny Saputra for arrangement data of Raman of SERS AgNPs from 500 ppm until 10 ppm.

Conflicts of Interest

The authors declare no conflict of interest.

References

  1. Khaliqi, M.; Gurning, H.R.H.; Novanda, R.R.; Simamora, O.N. Competitiveness Indonesia tea in international market. In IOP Conference Series: Earth and Environmental Science, Proceedings of the International Conference on Agriculture, Environment and Food Security (AEFS) 2019, Medan, Indonesia, 10 October 2019; IOP Publishing: Bristol, UK, 2020; Volume 454, p. 012039. [Google Scholar]
  2. Hendriadi, A.; Sulistiyorini, S.; Devilana, M.R. Pesticides residues in Fresh Food of plant origin: Case study in Indonesia. AGRIVITA J. Agric. Sci. 2021, 43, 285–299. [Google Scholar] [CrossRef]
  3. Rodríguez, R.; Picó, Y.; Font, G.; Mañes, J. Analysis of thiabendazole and procymidone in fruits and vegetables by capillary electrophoresis-electrospray mass spectrometry. J. Chromatogr. A 2002, 949, 359–366. [Google Scholar] [CrossRef]
  4. World Health Organization (WHO). Pesticide Evaluation Scheme, Vector Ecology and Management; World Health Organization: Geneva, Switzerland, 2016. [Google Scholar]
  5. Chrustek, A.; Hołyńska-Iwan, I.; Dziembowska, I.; Bogusiewicz, J.; Wróblewski, M.; Cwynar, A.; Olszewska-Słonina, D. Current research on the safety of pyrethroids used as insecticides. Medicina 2018, 54, 61. [Google Scholar] [CrossRef] [PubMed] [Green Version]
  6. Hugli, T.E.; Moore, S. Determination of the tryptophan content of proteins by ion-exchange chromatography of alkaline hydrolysates. J. Biol. Chem. 1972, 247, 2828–2834. [Google Scholar] [CrossRef]
  7. Wu, J.; Liu, Y.; Zhao, R.; Xu, R. Fast pesticide multiresidue analysis in American ginseng (Panax quinquefolium L.) by gas chromatography with electron capture detection. J. Nat. Med. 2011, 65, 406–409. [Google Scholar] [CrossRef] [PubMed]
  8. Rong, T.; Yang, R.; Young, J.C.; Zhu, H. Polyphenolic profiles in eight apple cultivars using high-performance liquid chromatography (HPLC). J. Agric. Food Chem. 2003, 51, 6347–6353. [Google Scholar]
  9. Jaabiri, I.; Belhaj, D.; Turki, N.; Kallel, M.; Ayadi, H.; Ksantini, M.; Bouzid, J.; Gargouri, R. Development and method validation for determination of Deltamethrin residue in olive oil using a reversed-phase high-performance liquid chromatography. OSR J. Appl. Chem 2013, 6, 1–8. [Google Scholar] [CrossRef]
  10. Kasicka, V. Recent developments in capillary electrophoresis and capillary electrochromatography of peptides. Electrophoresis 2006, 27, 142–175. [Google Scholar] [CrossRef]
  11. Chang, P.L.; Hsieh, M.M.; Chiu, T.C. Recent advances in the determination of pesticides in environmental samples by capillary electrophoresis. Int. J. Environ. Res. Public Health 2016, 13, 409. [Google Scholar] [CrossRef] [Green Version]
  12. Yi, L.; Li, H.; Sun, L.; Liu, L.; Zhang, C.; Xi, Z. A highly sensitive fluorescence probe for fast thiol-quantification assay of glutathione reductase. Angew. Chem. 2009, 48, 4034–4037. [Google Scholar] [CrossRef]
  13. Cserhati, T.; Szogyi, M. Chromatographic determination of pesticides in foods and food products. J. Nutr. Food Sci. 2012, 2, 2. [Google Scholar] [CrossRef] [Green Version]
  14. Zou, M.; Zhang, X.; Qi, X.; Liu, F. Scattering liquid sensor for quantitative detection of trace melamine in dairy products. In State of the Art in Biosensors: Environmental and Medical Applications; Rinken, T., Ed.; IntechOpen: London, UK, 2013; Available online: https://www.intechopen.com/chapters/43589 (accessed on 6 May 2021).
  15. Yande, L.; Yuxiang, Z.; Haiyang, W.; Bing, Y. Detection of pesticides on navel orange skin by surface-enhanced Raman spectroscopy coupled with Ag nanostructures. Int. J. Agric. Biol. Eng. 2016, 9, 179. [Google Scholar]
  16. Durickovic, I. Using Raman spectroscopy for characterization of aqueous media and quantification of species in aqueous solution. In Applications of Molecular Spectroscopy to Current Research in the Chemical and Biological Sciences; Stauffer, M., Ed.; Intech: Rijeka, Croatia, 2016. [Google Scholar]
  17. Li, Y.S.; Church, J.S. Raman spectroscopy in the analysis of food and pharmaceutical nanomaterials. J. Food Drug Anal. 2014, 22, 29–48. [Google Scholar] [CrossRef] [Green Version]
  18. Vašková, H. A powerful tool for material identification: Raman spectroscopy. Int. J. Math. Models Methods Appl. Sci. 2011, 5, 1205–1212. [Google Scholar]
  19. Moreira, L.M.; Junior, L.S.; Santos, F.V.; Lyon, J.P.; Rocha, R.; Zângaro, R.A.; Villaverde, A.B.; Pachec, M.T.T. Raman spectroscopy: A powerful technique for biochemical analysis and diagnosis. J. Spectrosc. 2008, 22, 1–191. [Google Scholar] [CrossRef]
  20. Cyrankiewicz, M.; Wybranowski, T.; Kruszewski, S. Study of SERS efficiency of metallic colloidal systems. In Journal of Physics: Conference Series, Proceedings of the XIII International Seminar on Physics and Chemistry of Solids, Ustron, Poland, 10–13 June 2007; IOP Publishing: Bristol, UK, 2007; Volume 79, p. 01203. [Google Scholar]
  21. Zhang, Y.; Mi, X.; Tan, X.; Xiang, R. Recent Progress on Liquid Biopsy Analysis using Surface-Enhanced Raman Spectroscopy. Theranostic 2019, 9, 491–525. [Google Scholar] [CrossRef]
  22. Fromm, D.P.; Sundaramurthy, A.; Kinkhabwala, A.; Schuck, P.J.; Kino, G.S.; Moerner, W.E. Exploring the chemical enhancement for surface-enhanced Raman scattering with Au bowtie nanoantennas. J. Chem. Phys. 2006, 124, 61101. [Google Scholar] [CrossRef] [Green Version]
  23. Davies, R.A.; Chong, N.S.; Ooi, B.G. Chemical enhancement of the surface enhanced Raman scattering signals of anilines via their Ortho-substituents. Opt. Photonics J. 2013, 3, 13–23. [Google Scholar] [CrossRef]
  24. Ding, S.Y.; You, E.M.; Tian, Z.Q.; Moskovits, M. Electromagnetic theories of surface-enhanced Raman spectroscopy. Chem. Soc. Rev. 2017, 46, 4042–4076. [Google Scholar] [CrossRef]
  25. Wang, J.; Lin, W.; Cao, E.; Xu, X.; Liang, W.; Zhang, X. Surface plasmon resonance sensors on Raman and fluorescence spectroscopy. Sensors 2017, 17, 2719. [Google Scholar] [CrossRef] [Green Version]
  26. Ling, Y.; Zhuo, Y.; Huang, L.; Mao, D. Using Ag-embedded TiO2 nanotubes array as recyclable SERS substrate. Appl. Surf. Sci. 2016, 388, 169–173. [Google Scholar] [CrossRef]
  27. Roguska, A.; Kudelski, A.; Pisarek, M.; Opara, M.; Janik-Czachor, M. Surface-enhanced Raman scattering (SERS) activity of Ag, Au and Cu nanoclusters on TiO2-nanotubes/Ti substrate. Appl. Surf. Sci. 2011, 257, 8182–8189. [Google Scholar] [CrossRef]
  28. Wang, K.; Huang, M.; Chen, J.; Lin, L.; Kong, L.; Liu, X.; Wang, H.; Lin, M. A ‘drop-wipe-test’ SERS method for rapid detection of pesticide residues in fruits. J. Raman Spectrosc. 2018, 49, 493–498. [Google Scholar] [CrossRef]
  29. Jiang, J.; Zou, S.; Ma, L.; Wang, S.; Liao, J.; Zhang, Z. SERS detection of pesticide residues using transparent adhesive tape and coated silver nanorod. ACS Appl. Mater. Interfaces 2018, 10, 9129–9135. [Google Scholar] [CrossRef] [PubMed]
  30. Wei, W.; Du, Y.; Zhang, L.; Yang, Y.; Gao, Y. Improving SERS hot spots for on-site pesticide detection by combining silver nanoparticles with nanowires. J. Mater. Chem. C 2018, 6, 8793–8803. [Google Scholar] [CrossRef]
  31. Nowicka, A.B.; Czaplicka, M.; Kowalska, A.A.; Szymborski, T.; Kamínska, A. Flexible PET/ITO/Ag SERS platform for label-free detection of pesticides. Biosensors 2019, 9, 111. [Google Scholar] [CrossRef] [Green Version]
  32. Zhang, X.F.; Zou, M.; Qi, X.H.; Liu, F.; Zhu, X.H.; Zhao, B.H. Detection of melamine in liquid milk using surface-enhanced Raman scattering spectroscopy. J. Raman Spectrosc. 2010, 41, 1655–1660. [Google Scholar] [CrossRef]
  33. Pieczonka, N.P.W.; Aroca, R.F. Inherent complexities of trace detection by surface-enhanced Raman scattering. ChemPhysChem 2005, 6, 2473–2484. [Google Scholar] [CrossRef]
  34. Alvarez-Puebla, R.A.; Liz-Marzán, L.M. SERS-based diagnosis and biodetection. Small 2010, 6, 604–610. [Google Scholar] [CrossRef]
  35. Watson, D.A.; Brown, L.O.; Gaskill, D.F.; Naivar, M.; Graves, S.W.; Doorn, S.K.; Nolan, J.P. A flow cytometer for thr measurement of Raman spectra. Cytom. Part A. 2008, 73A, 119–128. [Google Scholar] [CrossRef]
  36. Piorek, B.D.; Andreou, C.; Moskovits, M.; Meinhart, C.D. Discrete free-surface millifluidics for rapid capture and analysis of airborne molecules using surface-enhanced Raman spectroscopy. Anal. Chem. 2014, 86, 1061–1066. [Google Scholar] [CrossRef] [PubMed]
  37. Stamplecoskie, K.G.; Scaiano, J.C.; Tiwari, V.S.; Anis, H. Optimal size of silver nanoparticles for surface-enhanced Raman spectroscopy. J. Phys. Chem. C 2011, 115, 1403–1409. [Google Scholar] [CrossRef]
  38. He, Y.; Xiao, S.; Dong, T.; Nie, P. Gold nanoparticles for qualitative detection of deltamethrin and carbofuran residues in soil by surface enhanced Raman scattering (SERS). Int. J. Mol. Sci. 2019, 20, 1731. [Google Scholar] [CrossRef] [PubMed] [Green Version]
  39. Dong, T.; Lin, L.; He, Y.; Nie, P.; Qu, F.; Xiao, S. Density functional theory analysis of deltamethrin and its application in strawberry by surface-enhanced Raman spectroscopy. Molecules 2018, 23, 1458. [Google Scholar] [CrossRef] [PubMed] [Green Version]
  40. Wang, A.Q.; Chang, C.M.; Mou, C.Y. Evolution of catalytic activity of Au-Ag bimetallic nanoparticles on mesoporous support for CO oxidation. J. Phys. Chem. B 2005, 109, 18860–18867. [Google Scholar] [CrossRef] [PubMed]
  41. Valley, N.; Greeneltch, N.; Van Duyne, R.P.; Schatz, G.C. A look at the origin and magnitude of the chemical contribution to the enhancement mechanism of surface-enhanced Raman spectroscopy (SERS): Theory and experiment. J. Phys. Chem. Lett. 2013, 4, 2599–2604. [Google Scholar] [CrossRef]
  42. Caro, C.; Quaresma, P.; Pereira, E.; Franco, J.; Pernia Leal, M.P.; García-Martín, M.L.; Royo, J.L.; Oliva-Montero, J.M.; Merkling, P.J.; Zaderenko, A.P.; et al. Synthesis and characterization of elongated-shaped silver nanoparticles as a biocompatible anisotropic SERS probe for Intracellular Imaging: Theoretical modeling and experimental verification. Nanomaterials 2019, 9, 256. [Google Scholar] [CrossRef] [Green Version]
  43. Han, Q.; Zhang, C.; Gao, W.; Han, Z.; Liu, T.; Li, C.; Wang, Z.; He, E.; Zheng, H.H. Ag-Au alloy nanoparticles: Synthesis and in situ monitoring SERS of plasmonic catalysis. Sens. Actuators Part B 2016, 231, 609–614. [Google Scholar] [CrossRef] [Green Version]
  44. Plieth, W.; Dietz, H.; Anders, A.; Sandmann, G.; Meixner, A.; Weber, M.; Kneppe, H. Electrochemical preparation of silver and gold nanoparticles: Characterization by confocal and surface enhanced Raman microscopy. Surf. Sci. 2005, 597, 119–126. [Google Scholar] [CrossRef]
Figure 1. The schematic set-up of the nanoparticle synthesis.
Crystals 12 00024 g001
Figure 2. The result of UV-Vis absorption spectra of Au0Ag100, Au50Ag50 and Au100Ag0 nanoparticles following irradiation of a femtosecond laser for 5 min. Inset: the photograph of their colloidal nanoparticles in room light.
Crystals 12 00024 g002
Figure 3. The XRD pattern of Au-Ag nanoalloys.
Crystals 12 00024 g003
Figure 4. TEM images of (a) Au100Ag0, (b) Au50Ag50 and (c) Au0Ag100 of nanoparticles at 5 min irradiation time.
Crystals 12 00024 g004
Figure 5. The result of UV-Vis absorption spectra of deltamethrin pesticides.
Crystals 12 00024 g005
Figure 6. The Raman peak of technical deltamethrin pesticides from an Indonesian local brand.
Crystals 12 00024 g006
Figure 7. The Raman peak of brewed tea without deltamethrin pesticides.
Crystals 12 00024 g007
Figure 8. SERS spectra of brewed tea containing pesticides using colloidal Au100Ag0, Au50Ag50 and Au0Ag100 nanoparticles, in comparison with those without nanoparticles.
Crystals 12 00024 g008
Figure 9. The SERS spectra of deltamethrin pesticide in a brewed tea using liquid SERS-based Au0Ag100 as a function of pesticide concentration ranging from 500 to 0.01 ppm.
Crystals 12 00024 g009
Figure 10. Standard curve of pesticide in brewed tea from 0.01 to 10 ppm.
Crystals 12 00024 g010
Table 1. The intensity of the Raman signal for deltamethrin pesticides.
Raman Shift
(cm−1)
Raman Intensity (a.u.)Peak Assignment [39]
Tea and PesticideAu100Ag0Au50Ag50Au0Ag100
514135.1538.0698.00432.16υ (C-Br) ip
559164.3347.40121.22527.63υ (C-Br) ip + υ (C-C)
892154.7559.48132.32858.09 δ (C-H) oop
111595.1580.3080.30927.50δ (C-H) oop
143094.5724,88290.761600.19δ (C-H) oop
158875.575.03229.031321.27υ (C=C) ip
Publisher’s Note: MDPI stays neutral with regard to jurisdictional claims in published maps and institutional affiliations.

