Introduction
Agricultural economies are controlled by the markets for crops and the products from their processing. Based on a relation between supply and demand for foodstuffs and fodder, in developed countries official limits for agricultural production are quite commonplace. Fairly randomly, crops are utilized for non-nutritional purposes, although such an approach could intensify agricultural production by increasing the demand levels. The impact of such a utilization of crops was given in the form of an outlook of the European Community in the area of resources for the chemical industry up to 2040 [
1]. It should also be mentioned that such trends permit the utilization of crops whose poor quality would prohibit its consumption as foodstuffs. Among the various possibilities for crop utilization the complexes of polysaccharides with proteins have received considerable attention due to their functional properties and biodegrability [
2,
3,
4]. Selection of the sources of protein used depends on their availability. In some countries soy protein is readily available and in the others, milk and whey could be the principal protein sources.
The choice of polysaccharides for the complexation with proteins has some limits. For binding to proteins the polysaccharide must be of an anionic nature [
2,
3,
4]. Potato starch is the most widely available natural anionic polysaccharide. These circumstances have already been utilized practically by the authors [
5,
6] who, in their former papers, described the complexation of potato starch with casein in milk. However, in several areas throughout the world potato starch is not the principal starch variety and corn, cassava, or rice starches are more abundant. These starches are non-ionic. In contact with proteins they only form blends, as shown by Korolczuk
et al. [
7] for cornstarch co-precipitated with milk proteins. In those blends, gelatinised starch and protein formed independent gel structures.
There are several enzymatic (phosphorylation, oxidation) and chemical methods [
8] for transformation of non-ionic polysaccharides into ionic ones. They may involve oxidation, sulfation, phosphation, and carboxymethylation of the starches. Among the chemical procedures leading to anionic starches, phosphation seems to be particularly simple and the most readily controllable [
8]. Thus, in this paper phosphation of cornstarch and waxy cornstarch are described, their application in the formation of complexes with casein in milk is presented and selected functional properties of resulting complexes are characterized. The resulting complexes differ in their physical properties and functionality from complexes similarly designed from milk casein and potato starch [
5,
6], the latter being a natural starch phosphate. Differences between complexes of phosphates of both starches result from several factors. For instance, potato starch can readily be purified from natural contaminants, mainly proteinic in nature, and, therefore, the commercial product is fairly pure. In contrast, cornstarch cannot be purified from residual lipids occupying channels of the native amylose – lipid inclusion complexes. The size of starch granules is essential for their functionality. Potato starch granules range in size from between 20 to 150 μm and are thus, approximately, 10 times larger than the size of cornstarch granules [
9]. This affects, among other things, their susceptibility to swelling and, hence, their chemical and enzymatic reactivity [
8]. Potato starch granules swell at the rate which higher is by several orders of magnitude than that of cornstarch granules [
10].
Results and Discussion
Addition of hydrochloric acid to milk in which the sodium salt of potato starch phosphate was suspended resulted in precipitation of a solid material. Granular phosphated cornstarch (GPCS), being anionic to a higher extent than pasted phosphated cornstarch (PPCS), precipitated in higher yield only in the casein deficient mixture (where the casein to starch ratio was 1:2). Otherwise, PPCS, although less anionic, provided higher yields of complexes (
Table 1). In contrast to cornstarch, waxy cornstarch was better phosphated when pasted. Less anionic granular waxy cornstarch (GPWCS) always provided lower yields of the complexes than the more anionic phosphated pasted waxy cornstarch (PPWCS).
Table 1.
Properties and yields of casein (C), GPCS, PPCS, GPWCS and PPWCS and their complexes with casein
Table 1.
Properties and yields of casein (C), GPCS, PPCS, GPWCS and PPWCS and their complexes with casein
| Speciesa | Propertyb |
| Nitrogen Contentc, % | Moisture content, % | Yield, % |
| Casein (C) | 12.9 | 0.05 | 84.8 |
| GPCS | 0.70d | 7.3 | 86.2 |
| C:GPCS 2:1 | 11.91 (8.84) | 6.9 | 71.1 |
| C:GPCS 1:1 | 8.83 (6.81) | 6.3 | 66.4 |
| C:GPCS 1:2 | 5.86 (4.77) | 8.1 | 95.1 |
| PPCS | 0.61 | 7.8 | 78.6 |
| C:PPCS 2:1 | 9.57 (8.81) | 5.5 | 99.0 |
| C:PPCS 1:1 | 6.16 (6.76) | 6.3 | 100.0 |
| C:PPCS 1:2 | 4.82 (4.71) | 5.3 | 94.4 |
| GPWCS | 0.42e | 7.2 | 85.3 |
| C:GPWCS 2:1 | 8.60 (8.75) | 6.3 | 78.3 |
| C:GPWCS 1:1 | 6.58 (6.67) | 6.6 | 85.5 |
| C:GPWCS 1:2 | 4.71 (4.58) | 5.9 | 83.9 |
| PPWCS | 0.31 | 8.7 | 61.5 |
| C:PPWCS 2:1 | 9.90 (8.71) | 11.2 | 100.0 |
| C:PPWCS 1:1 | 7.49 (6.61) | 9.4 | 100.0 |
| C:PPWCS 1:2 | 5.55 (4.51) | 9.8 | 95.0 |
The overall yields of the precipitated product were high, making this a useful process from a practical point of view. The yields of complexes with pasted starches were higher. Analyses for nitrogen content (
Table 1) revealed that products made from GPCS and casein had slightly higher contents of nitrogen than the theoretical values corresponding to a selection of different component proportions, this is, 2:1, 1:1, and 1:2. In other words, the complexes had more casein than that anticipated for a given component proportion. Complexes made of PPCS contained practically the intended amount of casein. An opposite trend was noted for phosphated waxy cornstarches. Thus, GPWCS trapped the amount of casein as intended by selection of the proportion of the reaction blends whereas PPWCS trapped more casein, to the same extent as GPCS did. These findings likely depended on the accessibility of the phosphate groups differently distributed on the surface and hidden in the matrices of both starch varieties.
Phosphation of both granular starches significantly increased their solubility in water at 60 and 80°C. As shown in
Table 2, the aqueous solubility (AS) of native granular cornstarch increased by a factor of 4.7 times when the temperature was increased from 60 to 80°C. Certainly pasting of that starch had some impact on this result. However, after phosphation, only a 1.5-fold increase in AS was noted under such circumstances. After complexation with casein the corresponding increase in AS rose up to 1.8-2.1 times. The AS values for particular complexes were distinctly lower than those for non- complexed phosphated cornstarch. These data clearly pointed to the complexation. Additionally, the experimental AS were always lower than the theoretical AS calculated from the AS for the particular components of complexes at a given temperature. For example, the AS of PPCS at 60°C was 3.8 times lower than the AS of GPCS due to higher degree of substitution with the phosphate groups which, to a higher extent, crosslinked starch. A lower uptake of casein by PPCS as deduced from a lower nitrogen content (
Table 1) in complexes of that starch with casein than in the casein – GPCS complexes confirmed this opinion. Complexes of PPCS with casein dissolved in water at 60°C slightly better than non-complexed starch and this experimental solubility was also higher than the theoretical one. The effect of complexation was more clearly visible at 80°C. After complexation the AS was lower by a factor of 3.6 to 5.2 than that of non-complexed starch and lower by a half than the theoretical AS.
Native granular waxy cornstarch was much more water-soluble than native granular cornstarch. Therefore, complexes of GPWCS and pasted PPWCS with casein were also more water-soluble than the corresponding complexes with GPCS and PPCS. Trends in AS changes due to phosphation were similar in both starches, but the AS of complexes of GPWCS and PPWCS were practically insensitive to increases in temperature.
The water binding capacity (WBC) of native granular waxy cornstarch was higher than that of native cornstarch. Phosphation of those starches significantly increased the WBC and to a higher extent in granular starches than in pasted starches. Complexation of phosphated starches with casein strongly decreased the WBC. It was higher for complexes of waxy cornstarch than for cornstarch (
Table 3).
Table 2.
Solubility of GPCS, PPCS, GPWCS and PPWCS and their casein complexes in water [g/100g H2O] at 60 °C and 80°C.
Table 2.
Solubility of GPCS, PPCS, GPWCS and PPWCS and their casein complexes in water [g/100g H2O] at 60 °C and 80°C.
| Speciesa,b | Solubility at |
| 60°C | 80°C |
| Found | Calculatedc | Found | Calculatedc |
| GPCS | GPWCS | GPCS | GPWCS | GPCS | GPWCS | GPCS | GPCWS |
| PPCS | PPCWS | PPCS | PPWCS | PPCS | PPWCS | PPCS | PPWCS |
| Phosphated | 12.8 | | 10.4 | | 18.9 | | 10.6 | |
| Starch | 3.4 | | 30.6 | | 30.4 | | 32.3 | |
| 2:1 | 2.4 | 7.3 | 5.8 | 5.0 | 5.0 | 6.5 | 7.3 | 4.5 |
| Complex | 3.1 | 8.1 | 2.7 | 11.8 | 5.8 | 10.6 | 11.1 | 11.8 |
| 1:1 | 4.0 | 9.5 | 7.6 | 6.4 | 8.4 | 10.6 | 10.2 | 6.0 |
| Complex | 3.9 | 18.3 | 2.9 | 16.5 | 6.3 | 20.1 | 15.9 | 16.9 |
| 1:2 | 6.3 | 11.6 | 9.3 | 7.7 | 11.4 | 21.4 | 13.1 | 7.5 |
| Complex | 5.8 | 21.8 | 3.0 | 21.2 | 8.5 | 24.6 | 20.8 | 22.0 |
Table 3.
Water binding capacity of GPCS, PPCS, GPWCS and PPWCS and their casein complexes [g/g of dry residue] at 60°C.
Table 3.
Water binding capacity of GPCS, PPCS, GPWCS and PPWCS and their casein complexes [g/g of dry residue] at 60°C.
| Speciesa,b | GPCS | GPWCS |
| PPCS | PPWCS |
| Found | Calculatedc | Found | Calculatedc |
| Phosphated | 73.6 | | 30.0 | |
| starch | 41.8 | | 13.7 | |
| 2:1 Complex | 5.0 | 12.5 | 13.3 | 27.1 |
| 5.3 | 7.1 | 9.7 | 16.5 |
| 1:1 Complex | 7.3 | 16.9 | 18.0 | 38.7 |
| 5.7 | 8.7 | 11.9 | 22.8 |
| 1:2 Complex | 13.1 | 21.3 | 26.7 | 50.3 |
| 6.8 | 10.4 | 16.2 | 21.1 |
Solubility tests with 7 M aqueous urea showed that all the complexes did not dissolve in that solvent but rather strongly swelled instead. Thus, one could assume that the partners in the complexes were chemically bound to one another. Analysis of the IR spectra of complexes provided arguments supporting this point of view. Also, the covalent bonding of the partners involved was documented in previous studies [
5,
6,
11] on complexes of casein with potato starch. The complexation of casein with phosphated corn and waxy corn starches led to spectral changes dependent on the starch and on whether they were granular or pasted. The IR spectra of original casein and phosphated GPCS, PPCS, GPWCS, and PPWCS together with band assignments are given in
Table 4.
Table 4.
IR spectral characteristics of casein, GPCS, PPCS, GPWCS and PPWCS
Table 4.
IR spectral characteristics of casein, GPCS, PPCS, GPWCS and PPWCS
| Casein | Phospated starch |
| Banda,b | Banda,b |
| Position , cm-1 | Assignment | Position, cm-1 | Assignment |
| 3402 vs | νNH intramol. H-bond | 3418vs, 3393vs | νOH intramol. H- |
| | | 3459 vs, 3369vs | bond |
| 2947 m, 2924 m | νCH | 2934 m, 2934, 2893m | νCH |
| | | 2934m, 2934m | |
| 2879 vw | νCH | | |
| 1652 vs | νC=O amide | 1648m, 1631 m | νC-O hemiacetal |
| | | 1648m, 1639m | |
| 1545 s, 1522 s | δOH, νC-N | | |
| 1455 m | δCH | 1451m, 1434m | δCH |
| | | 1451m, 1467m | |
| | | 1410m, 1393m | δOH |
| | | 1418m, 1414m | |
| 1394 w | δCH | 1361m, 1393m | νP=O |
| | | 1373m, 1348m | |
| 1250 w | δNH, δC-N | | |
| 1076 w, 1068 w | δC-OH | 1160s, 1139s | δOH,COC,C-OH |
| | | 1172s, 1139 s |
| | | 1082s, 1073s |
| | | 1066s, 1057 s |
| | | 1024vs, 998vs, 1024vs |
| | | 1024vs, 987vs, 1024vs |
| 924vs | δC-C | |
Definitely, because of the low degree of starch phosphation, the vibrations of random covalent bonds between casein and starches could not be seen. Due to complexation, spectral changes could be anticipated around 3400 cm
-1 (ν
OH in starch and ν
NH in casein), 1650 cm
-1 (ν
CO in casein and starch), 1545 and 1520 cm
-1 (δ
NH and δ
CN in casein), 1410 and 1160-980 cm
-1 (δ
OH in starch), 1390-1360 cm
-1 (ν
PO in starch), and 1250 cm
-1 (δ
NH and δ
CN in casein) (
Table 4). Indeed, in all spectra, strong changes in the region of 3400 cm
-1 could be observed, showing involvement of the corresponding groups in the interactions. Some of them could result from changes in the starch macrostructure leading to cancellation and/or reconstruction of intramolecular hydrogen bonds. Consequently, shifts and changes in the pattern of the δ
OH,COC,COH could be noted. Changes in the position of the ν
CO band were difficult to interpret because the corresponding bands in the spectra of both components appeared in approximately the same spectral region (
Table 5).
Table 5.
IR spectral characteristics of casein complexes with GPCS, PPCS, GPWCS and PPWCS
Table 5.
IR spectral characteristics of casein complexes with GPCS, PPCS, GPWCS and PPWCS
| Band positionsa,b, cm-1 |
| 2:1 | 1:1 | 1:2 |
| GPCS | GPWCS | GPCS | GPWCS | GPCS | GPWCS |
| PPCS | PPWCS | PPCS | PPWCS | PPCS | PPWCS |
| 3393 | 3402 | 3402 | 3362 | 3393 | 3410 |
| 3377 | 3418 | 3410 | 3418 | 3426 | 3421 |
| 1658 | 1658 | 1658 | 1658 | 1652 | 1652 |
| 1652 | 1652 | 1652 | 1652 | 1652 | 1652 |
| 1530 | 1517 | 1530 | 1517 | 1524 | 1511 |
| 1524 | 1516 | 1517 | 1513 | 1517 | 1525 |
| 1395 | 1390 | 1402 | 1395 | 1389 | 1390 |
| 1389 | 1393 | 1389 | 1393 | 1377 | 1390 |
| 1242 | 1242 | 1242 | 1241 | 1242 | 1243 |
| 1241 | 1230 | 1246 | 1247 | 1248 | 1242 |
| 1163 | 1165 | 1165 | 1156 | 1158 | 1158 |
| 1158 | 1152 | 1158 | 1165 | 1158 | 1158 |
| 1081 | 1087 | 1081 | 1081 | 1081 | 1088 |
| 1087 | 1081 | 1081 | 1081 | 1081 | 1081 |
| 1042 | 1056-1043 | 1024 | 1030 | 1024 | 1027 |
| 1024 | 1036 | 1024 | 1029 | 1024 | 1024 |
| 927 | 926 | 906 | 927 | 927 | 934 |
| 927 | 927 | 934 | 934 | 927 | 926 |
As anticipated, vibrations in the amide group in casein and the phosphate group in phosphated starches were considerably shifted towards lower wave numbers. Such changes suggested that in the complexes, aside from covalent bonds between casein and phosphated starches, postulated based on the solubility of complexes in aqueous urea solution, electrostatic and polar interactions were also involved.
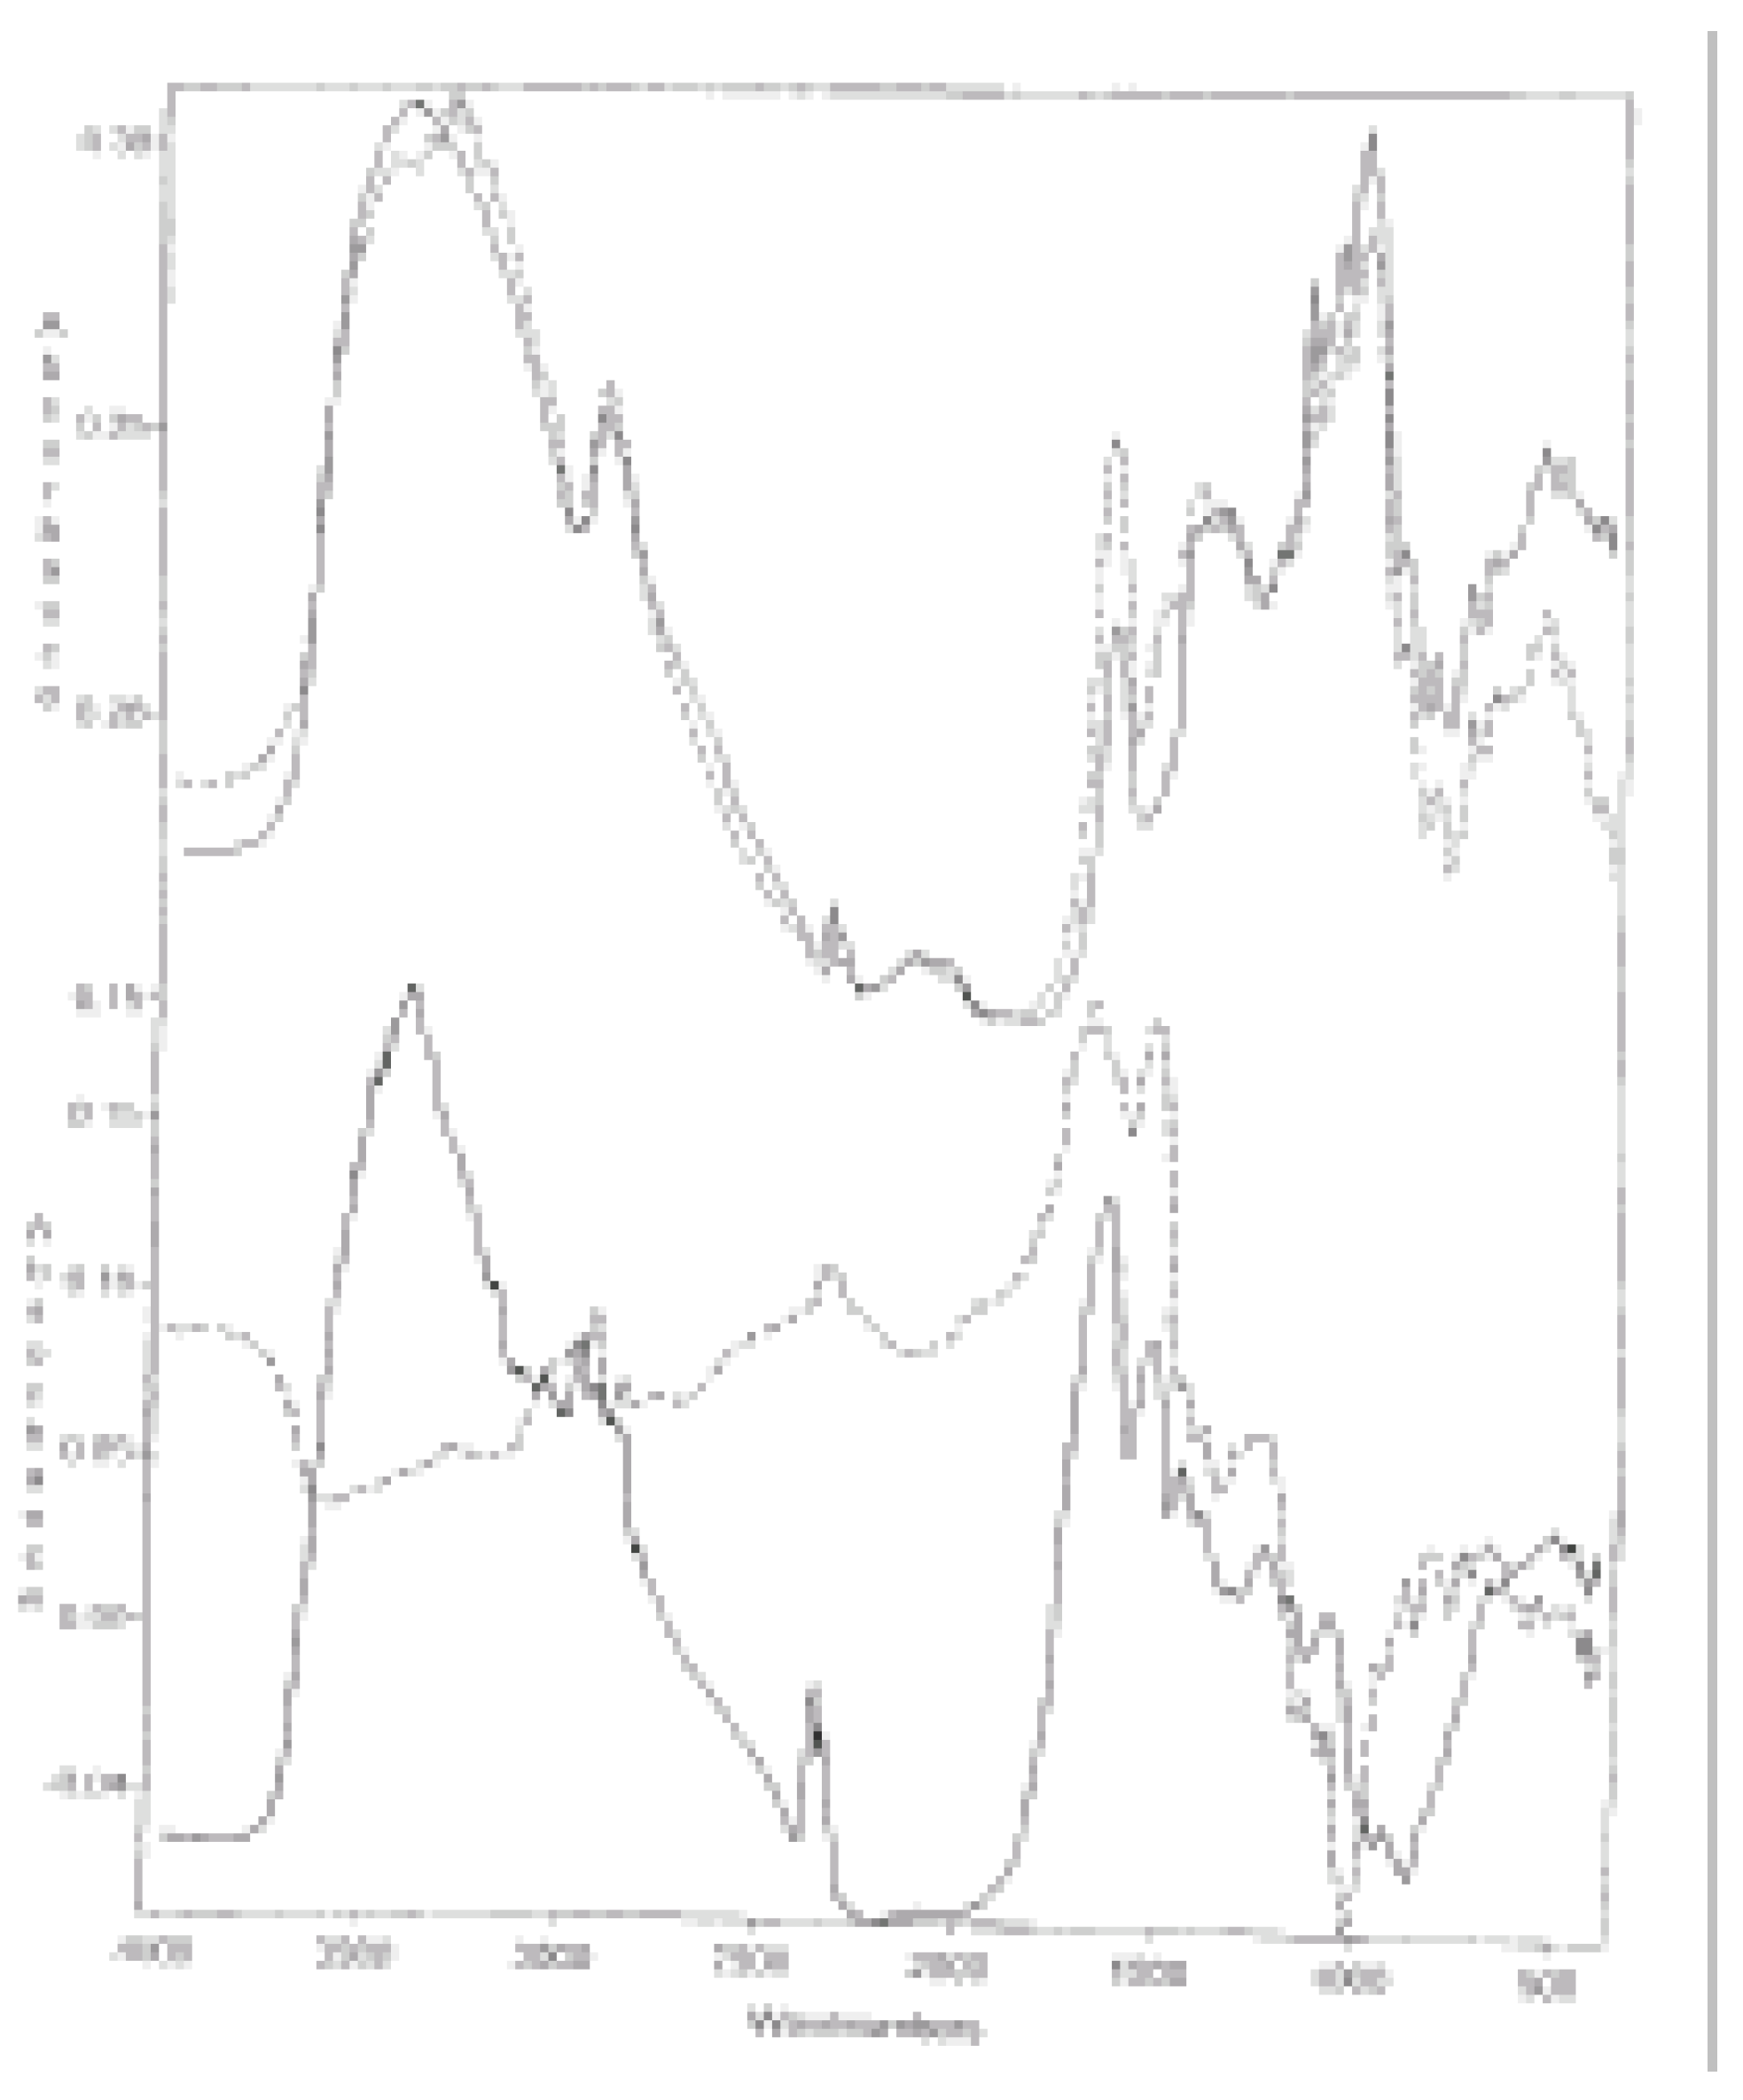
Differential spectra provided evidence for binding between the complex components in a covalent manner. The differential spectra for casein : GPCS = 2:1, casein : GPWCS = 1:1, and casein : PPWCS = 1:2 complexes were selected to exemplify all cases. Spectra for all other complexes looked similar although they differed from one another in details of the patterns of particular bands.
Figure 1.
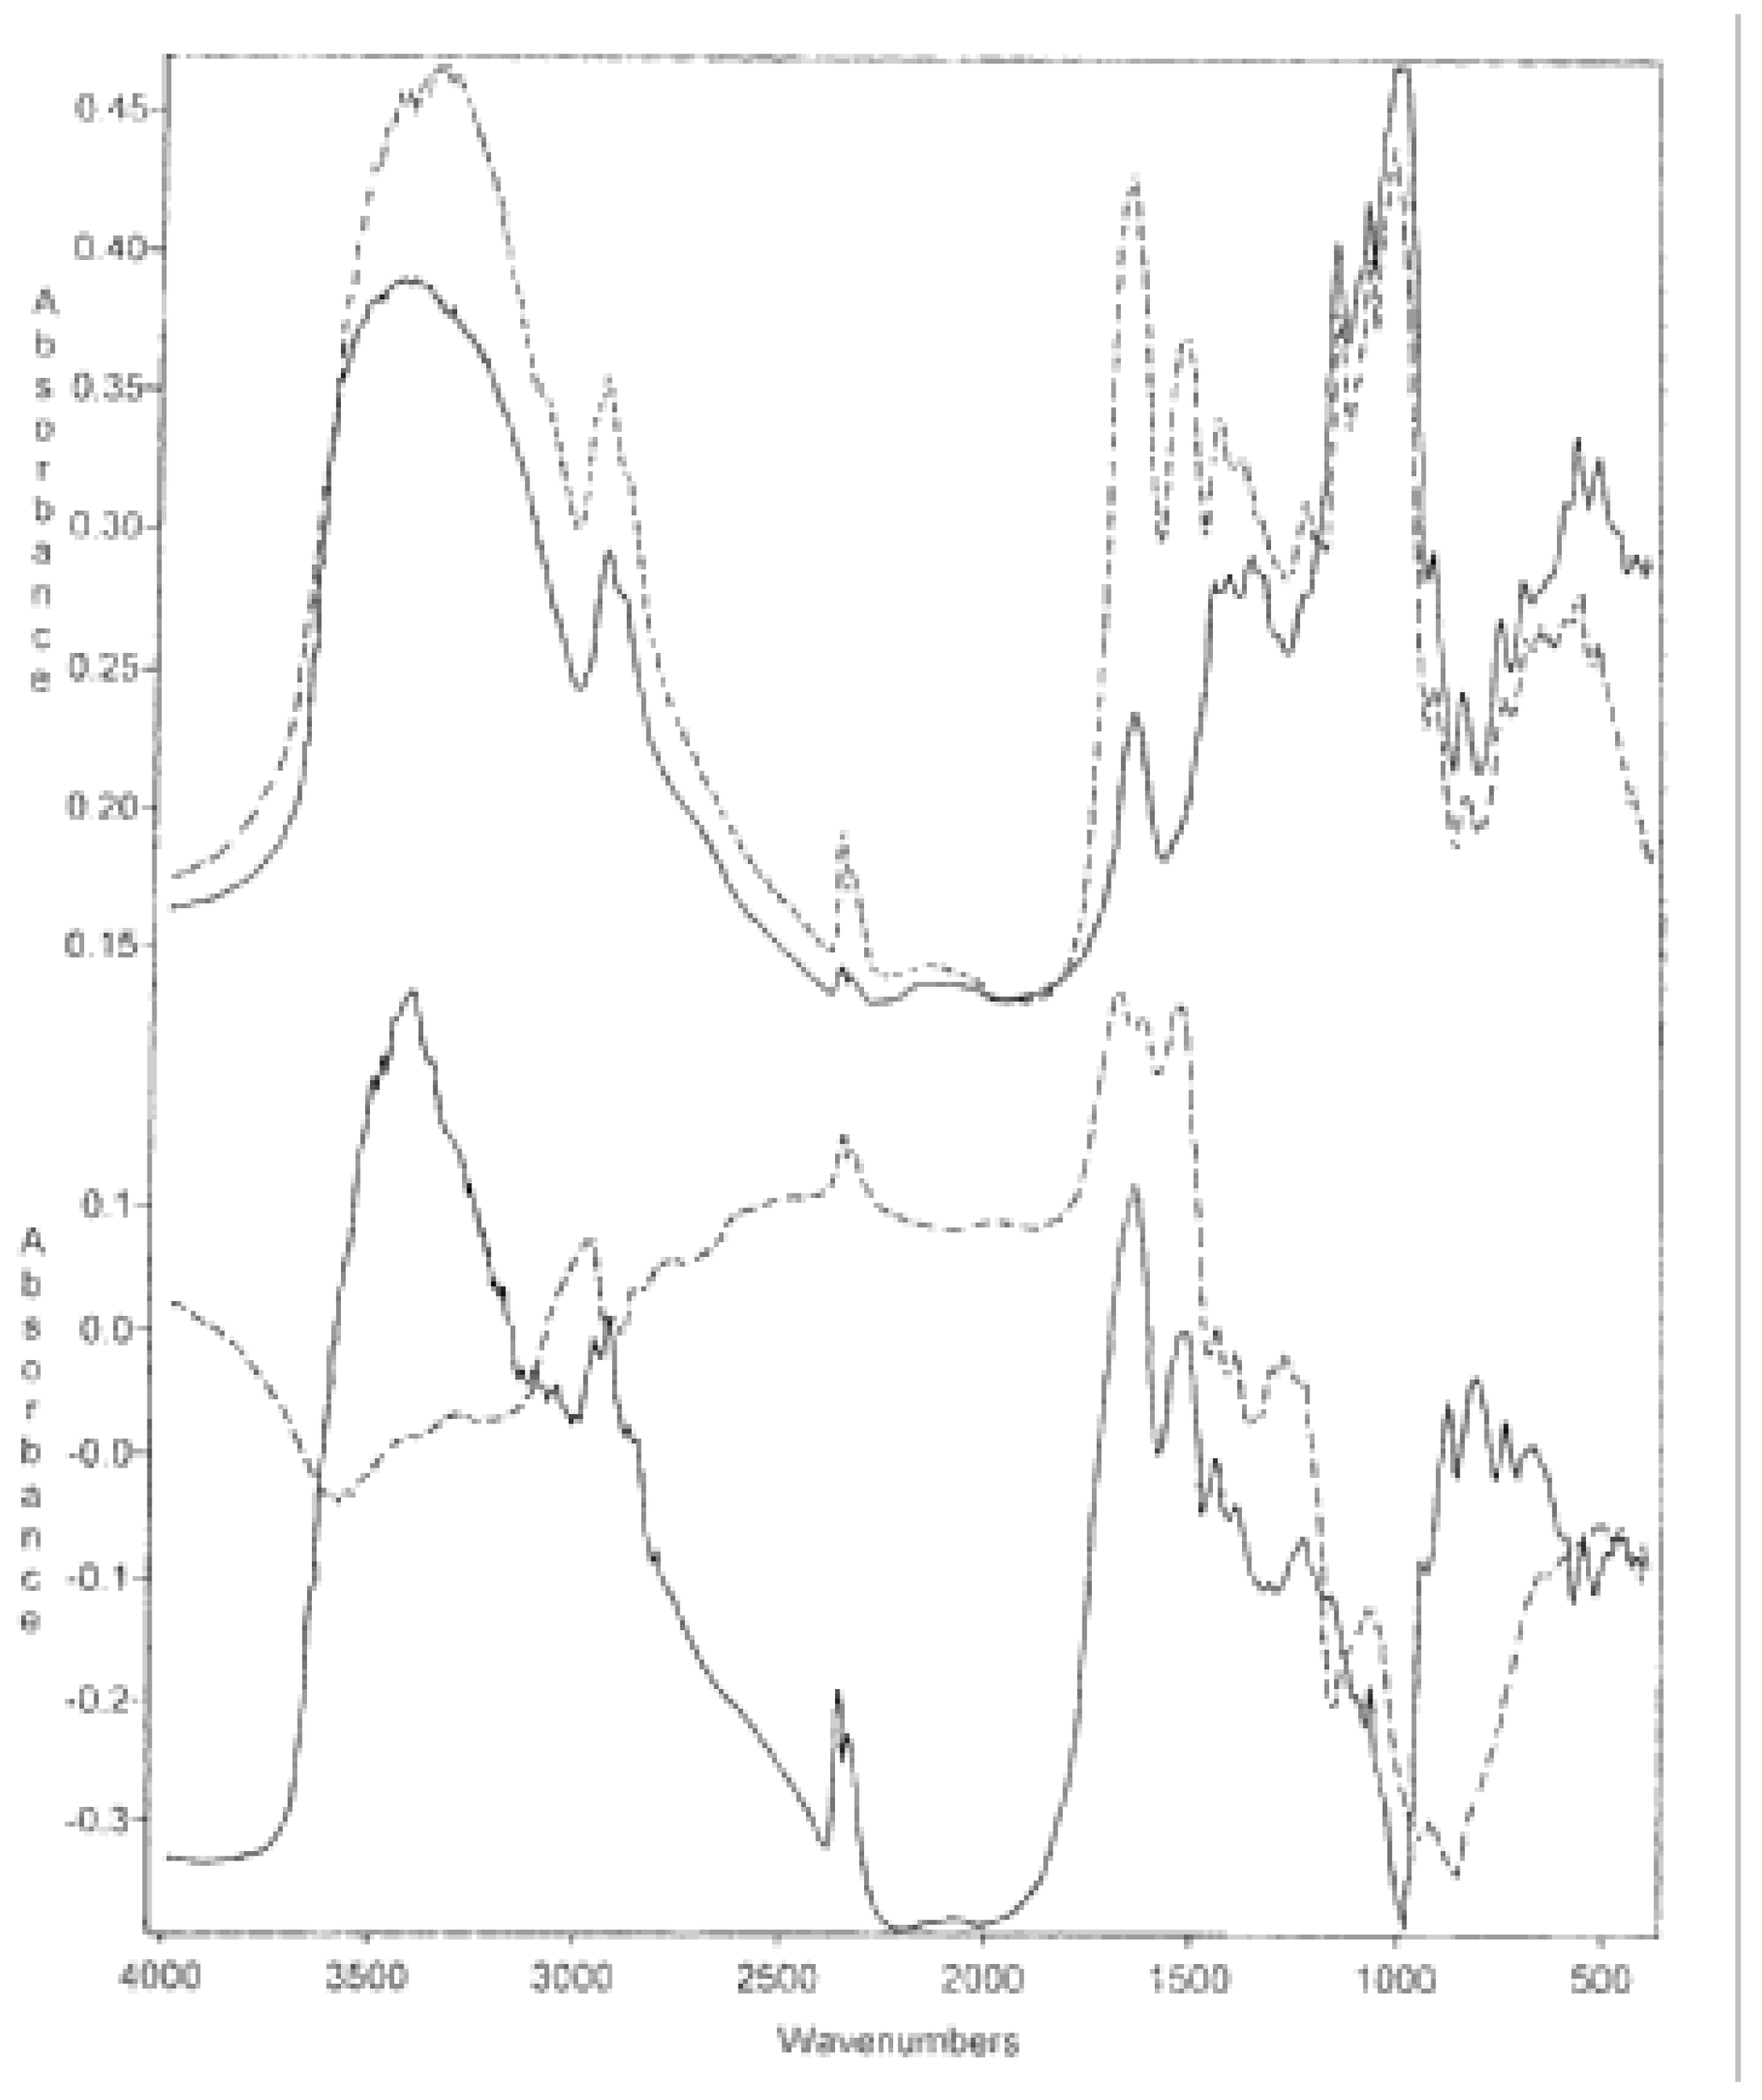
(1) Differential FTIR spectra of casein/GPWCS 2:1 complex from which (a) the spectrum of GPWCS was subtracted and (b) the spectrum of casein was added for comparison; (2) Differential FTIR spectrum of the same complex from which (a) the spectrum of casein was subtracted and (b) the spectrum of GPWCS added for comparison.
Figure 1.
(1) Differential FTIR spectra of casein/GPWCS 2:1 complex from which (a) the spectrum of GPWCS was subtracted and (b) the spectrum of casein was added for comparison; (2) Differential FTIR spectrum of the same complex from which (a) the spectrum of casein was subtracted and (b) the spectrum of GPWCS added for comparison.
Figure 1.1 presents the spectrum of the casein/GPWCS 2:1 complex from which the spectrum of casein was subtracted. The spectrum of casein is also added for comparison. One can see essential differences between the spectra in the 1650, 1250, and 1000 cm
-1 range.
Figure 1.2 presents the spectrum of the same complex from which the spectrum of GPWCS was subtracted and the spectrum of GPWCS added for comparison. Also in this case, both spectra differed from one another in the spectral pattern around 1550 cm
-1 and 1400 cm
-1.
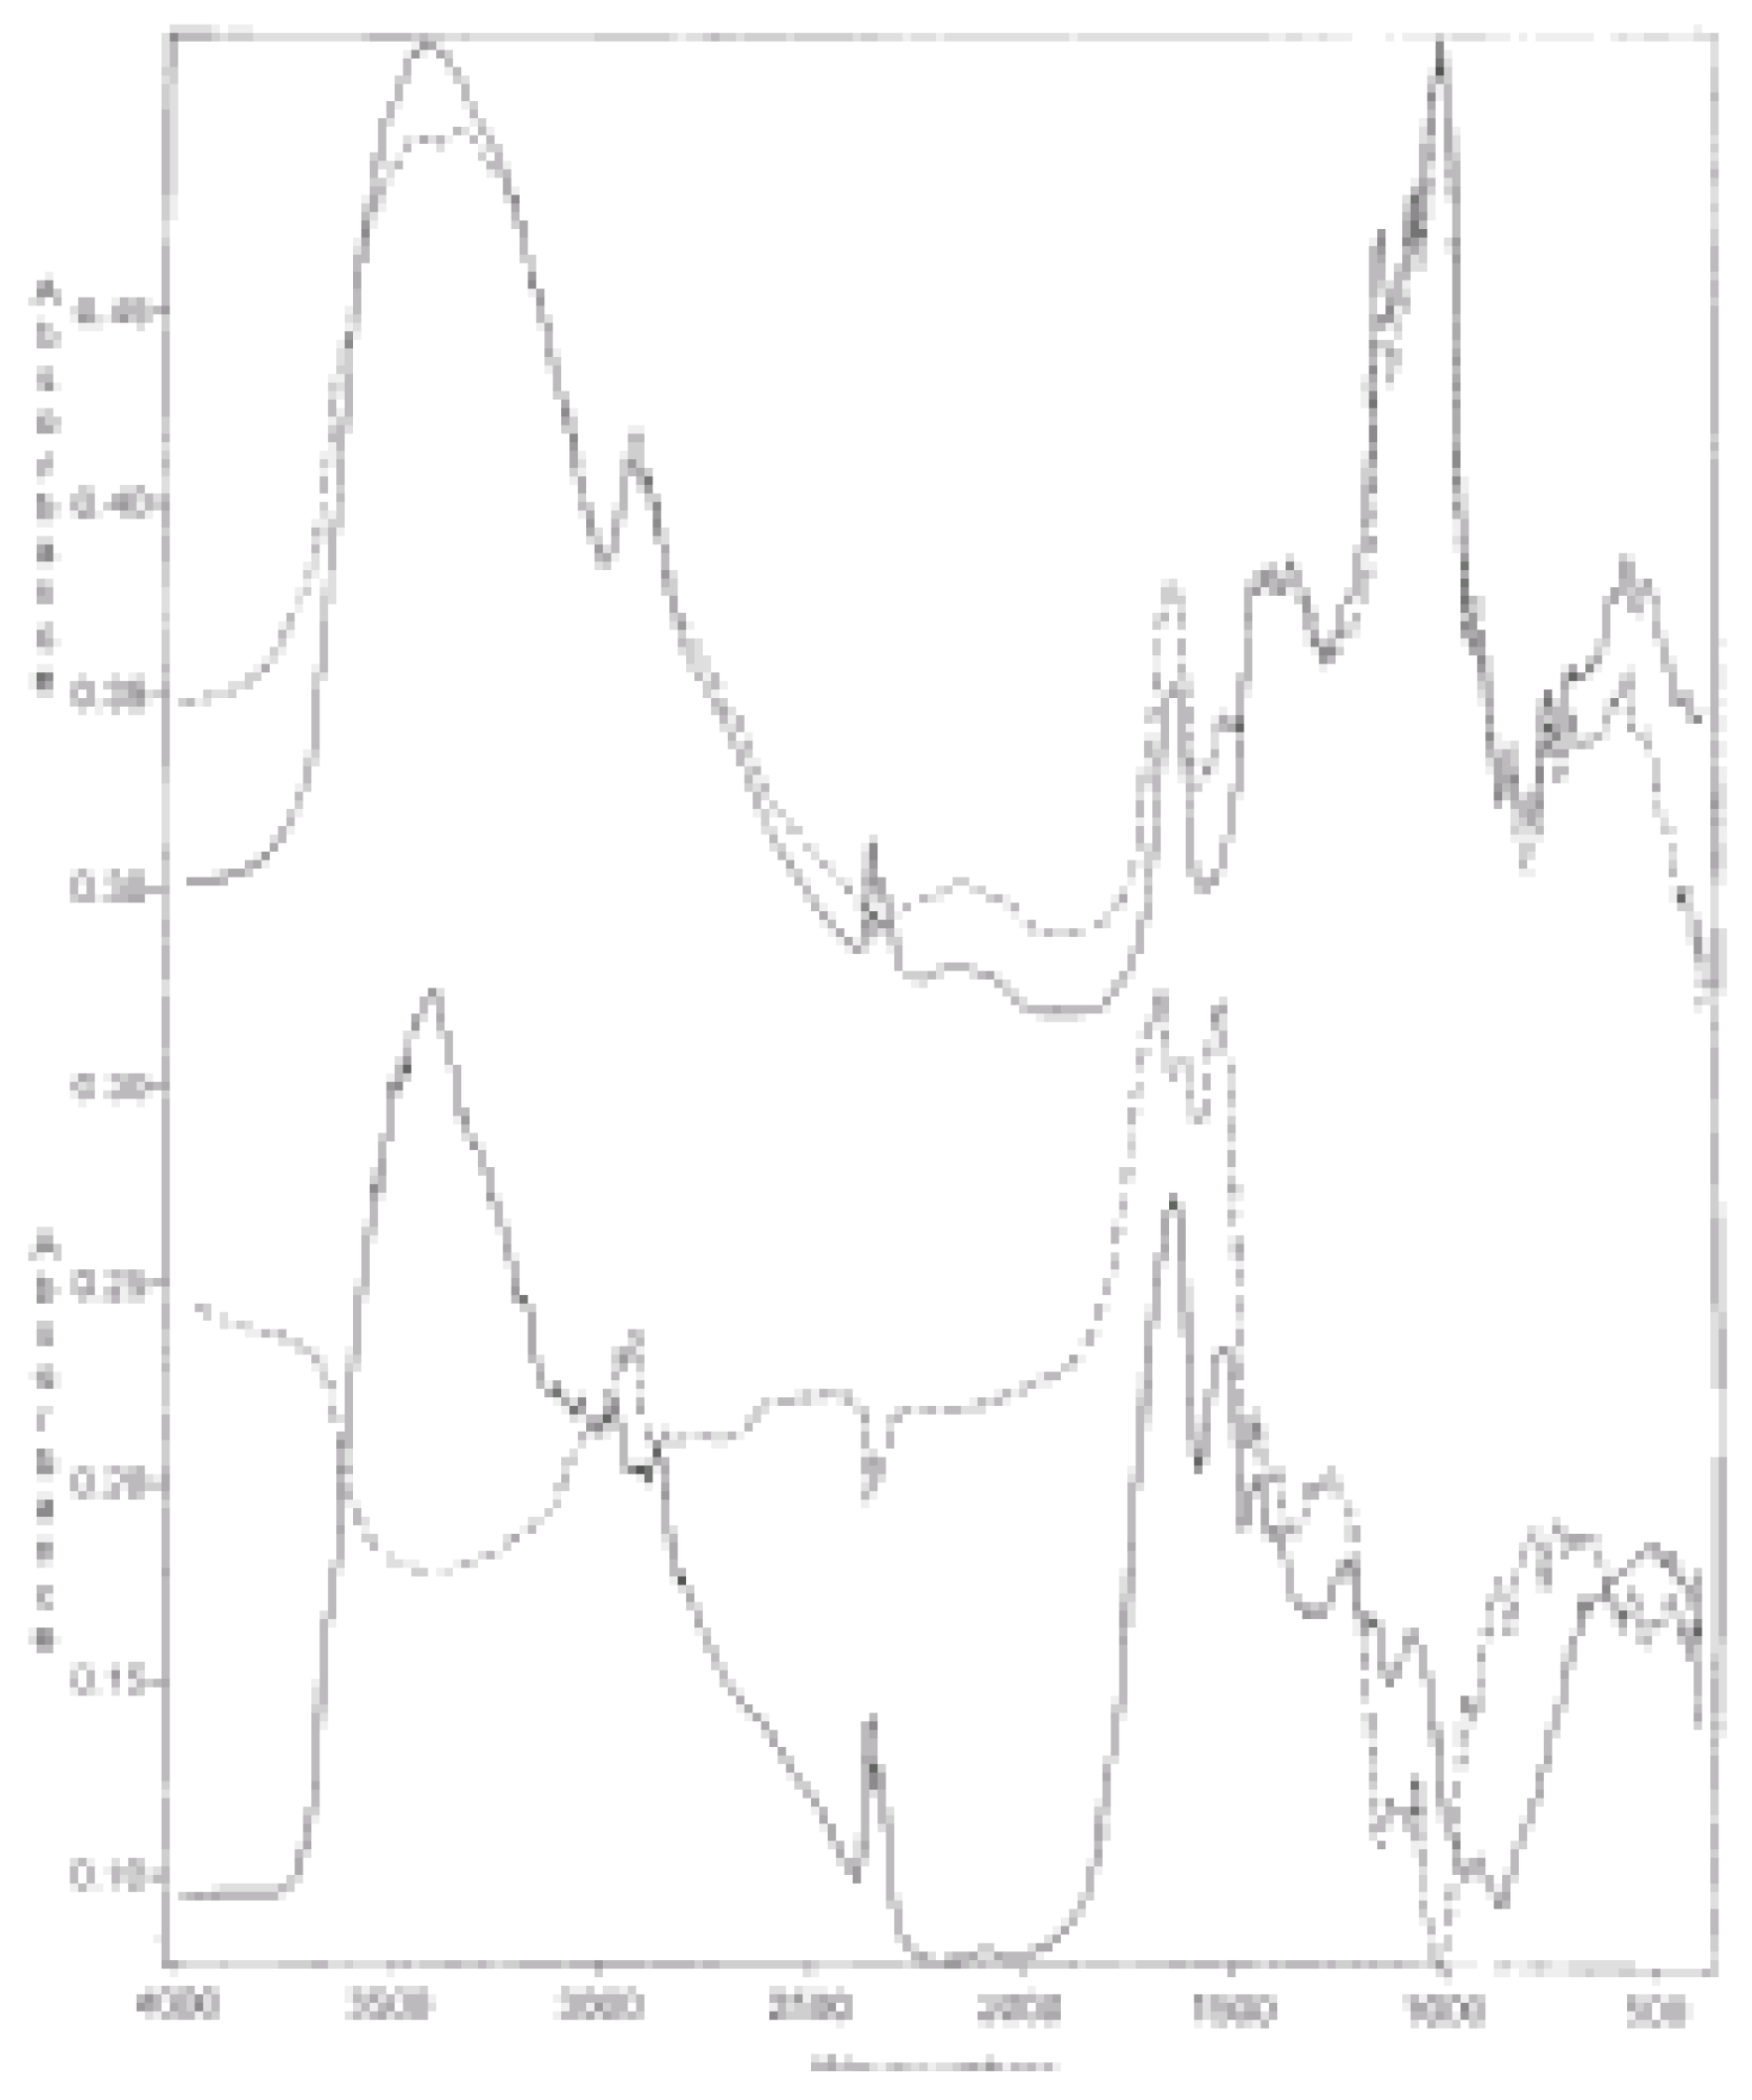
Figure 2.
(1) Differential FTIR spectra of casein/GPCS 1:1 complex from which (a) the spectrum of GPCS was subtracted and (b) the spectrum of casein was added for comparison; (2) Differential FTIR spectrum of the same complex from which spectrum of casein was subtracted (a) and spectrum of GPCS (b) added for comparison.
Figure 2.1 and
Figure 2.2 present the spectra of the casein/ GPCS 1:1 complex from which spectra of casein and GPCS were subtracted, respectively. Again in these cases similar distinguishing details could be observed. Also similar differences can be observed in
Figure 3.1 and
Figure 3.2 which are collections of the casein/PPWCS 1:2 complex differential spectra from which spectra of casein and PPWCS were subtracted, respectively.
Figure 3.
(1) Differential FTIR spectra of casein/PPWCS 1:2 complex from which (a) the spectrum of PPWCS was subtracted and (b) the spectrum of casein was added for comparison; (2) Differential spectrum of the same complex from which spectrum of casein was (a) subtracted and (b) the spectrum of PPWCS added for comparison.
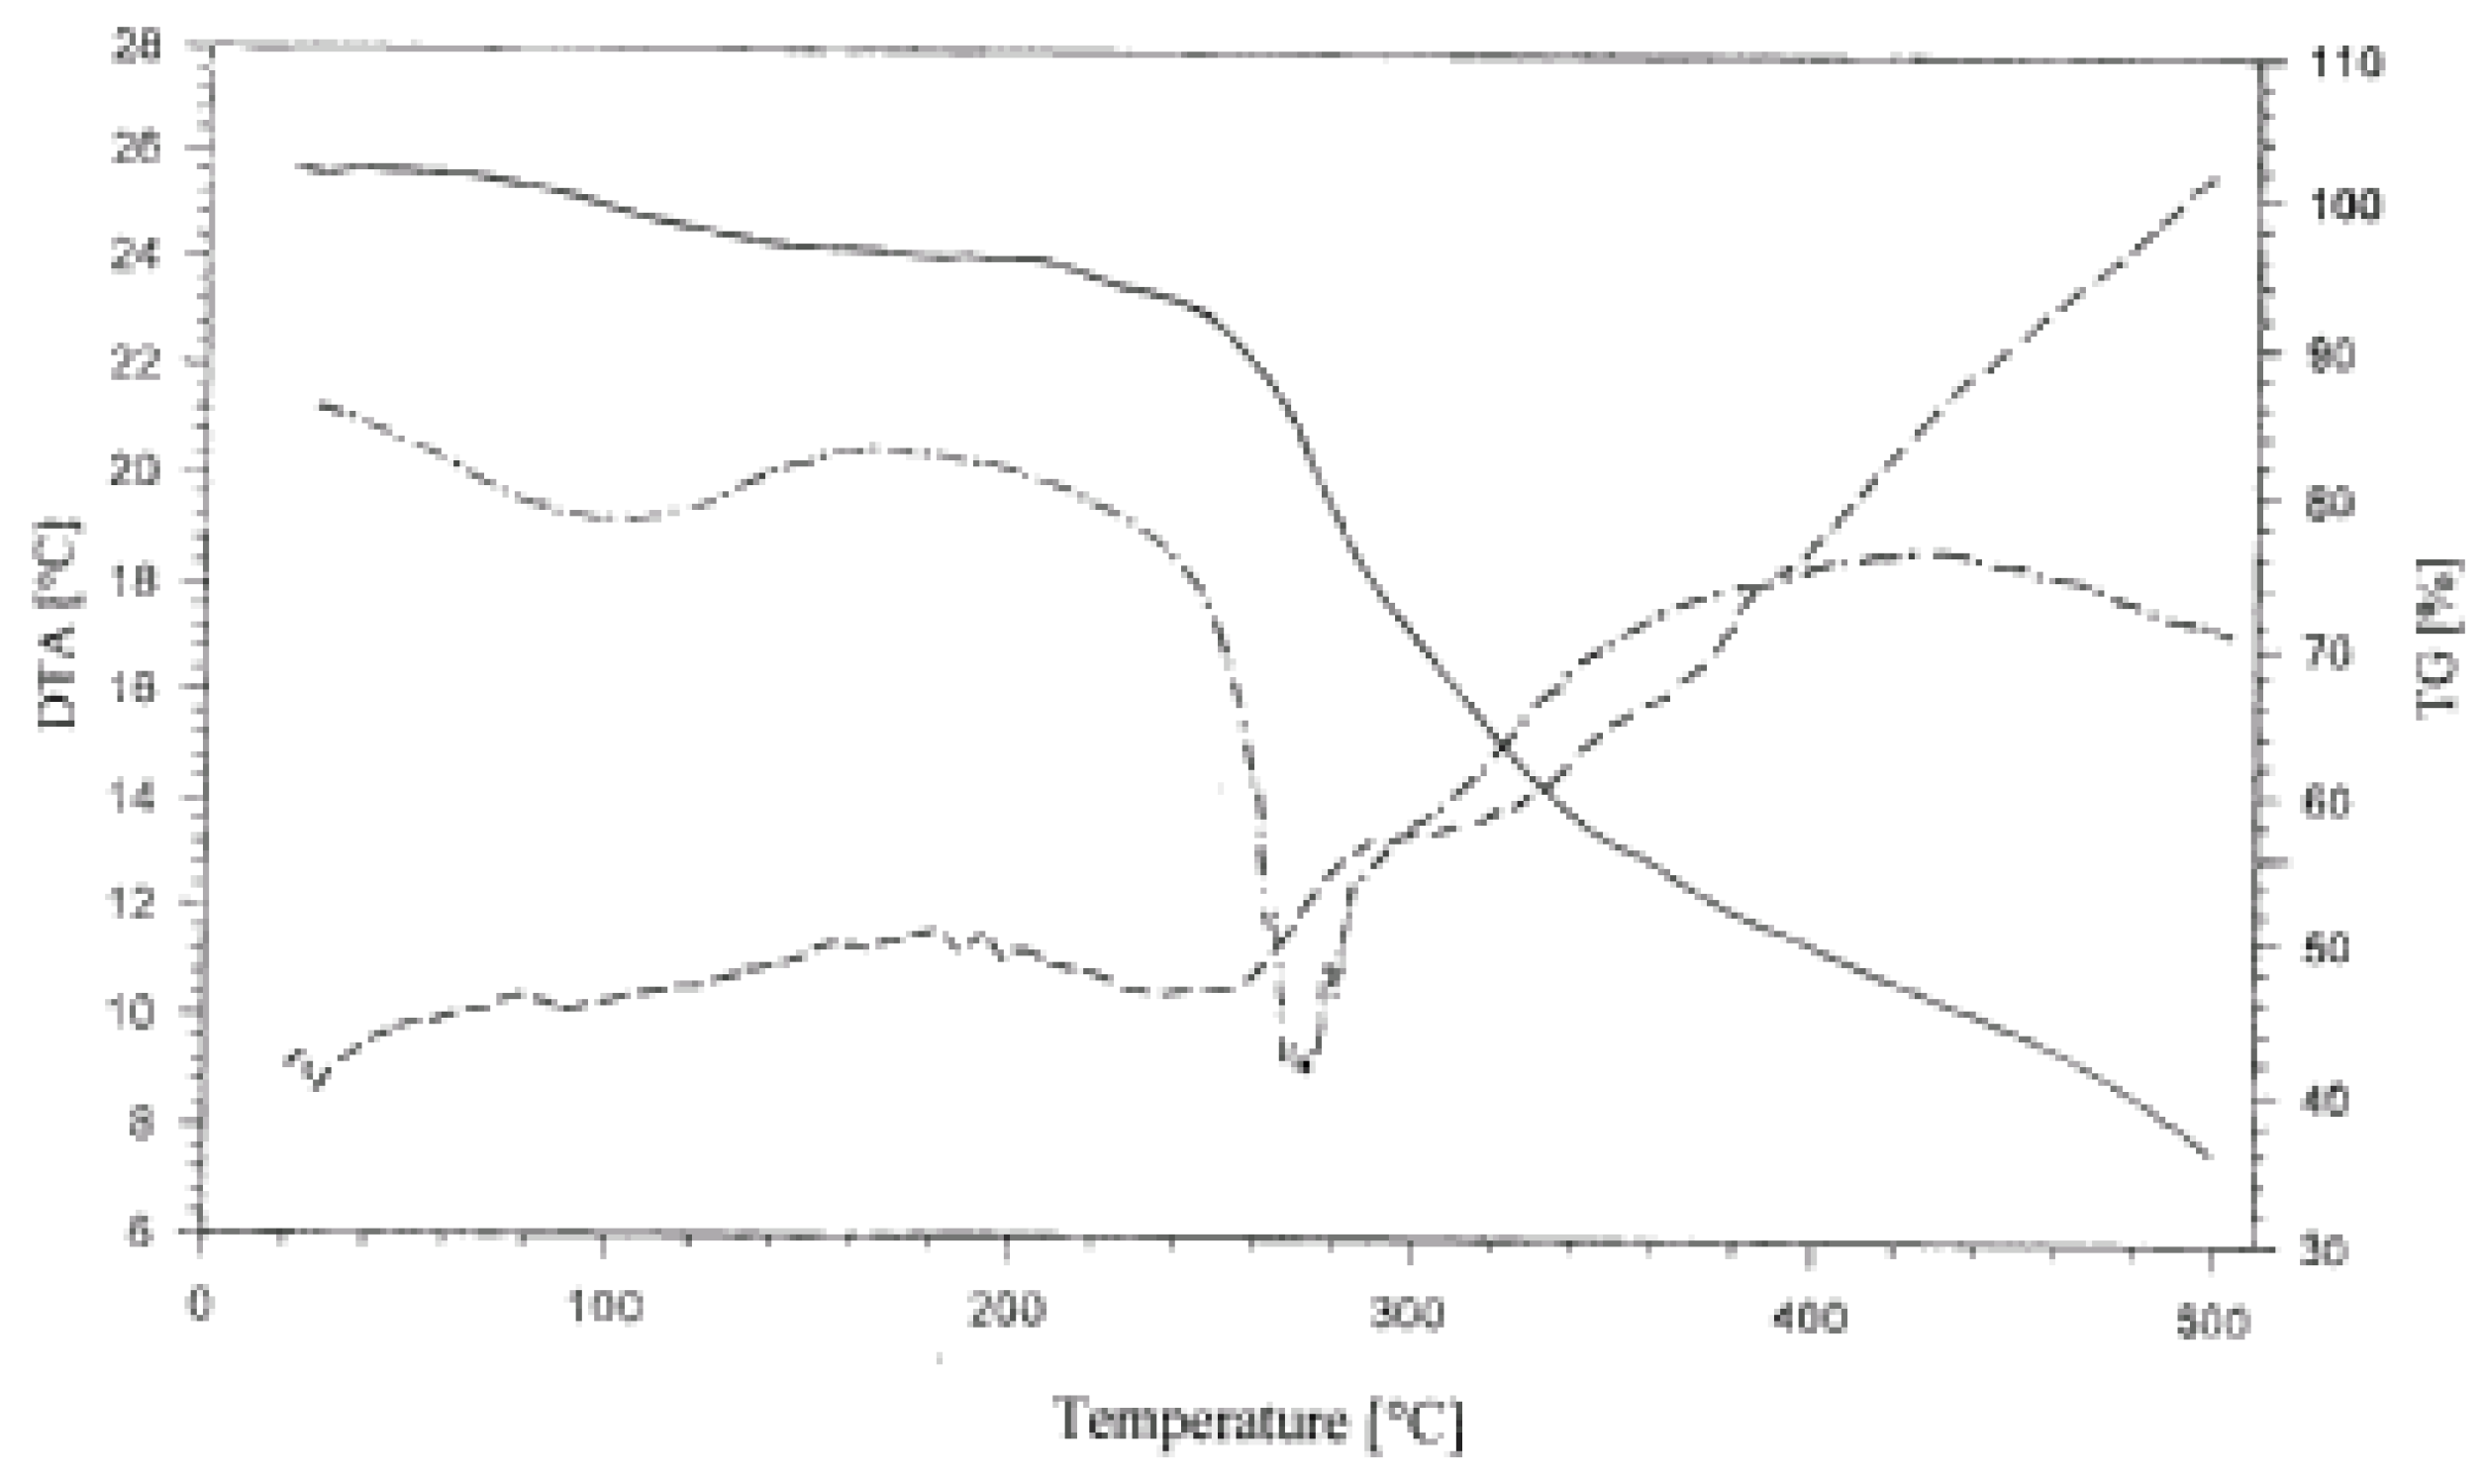
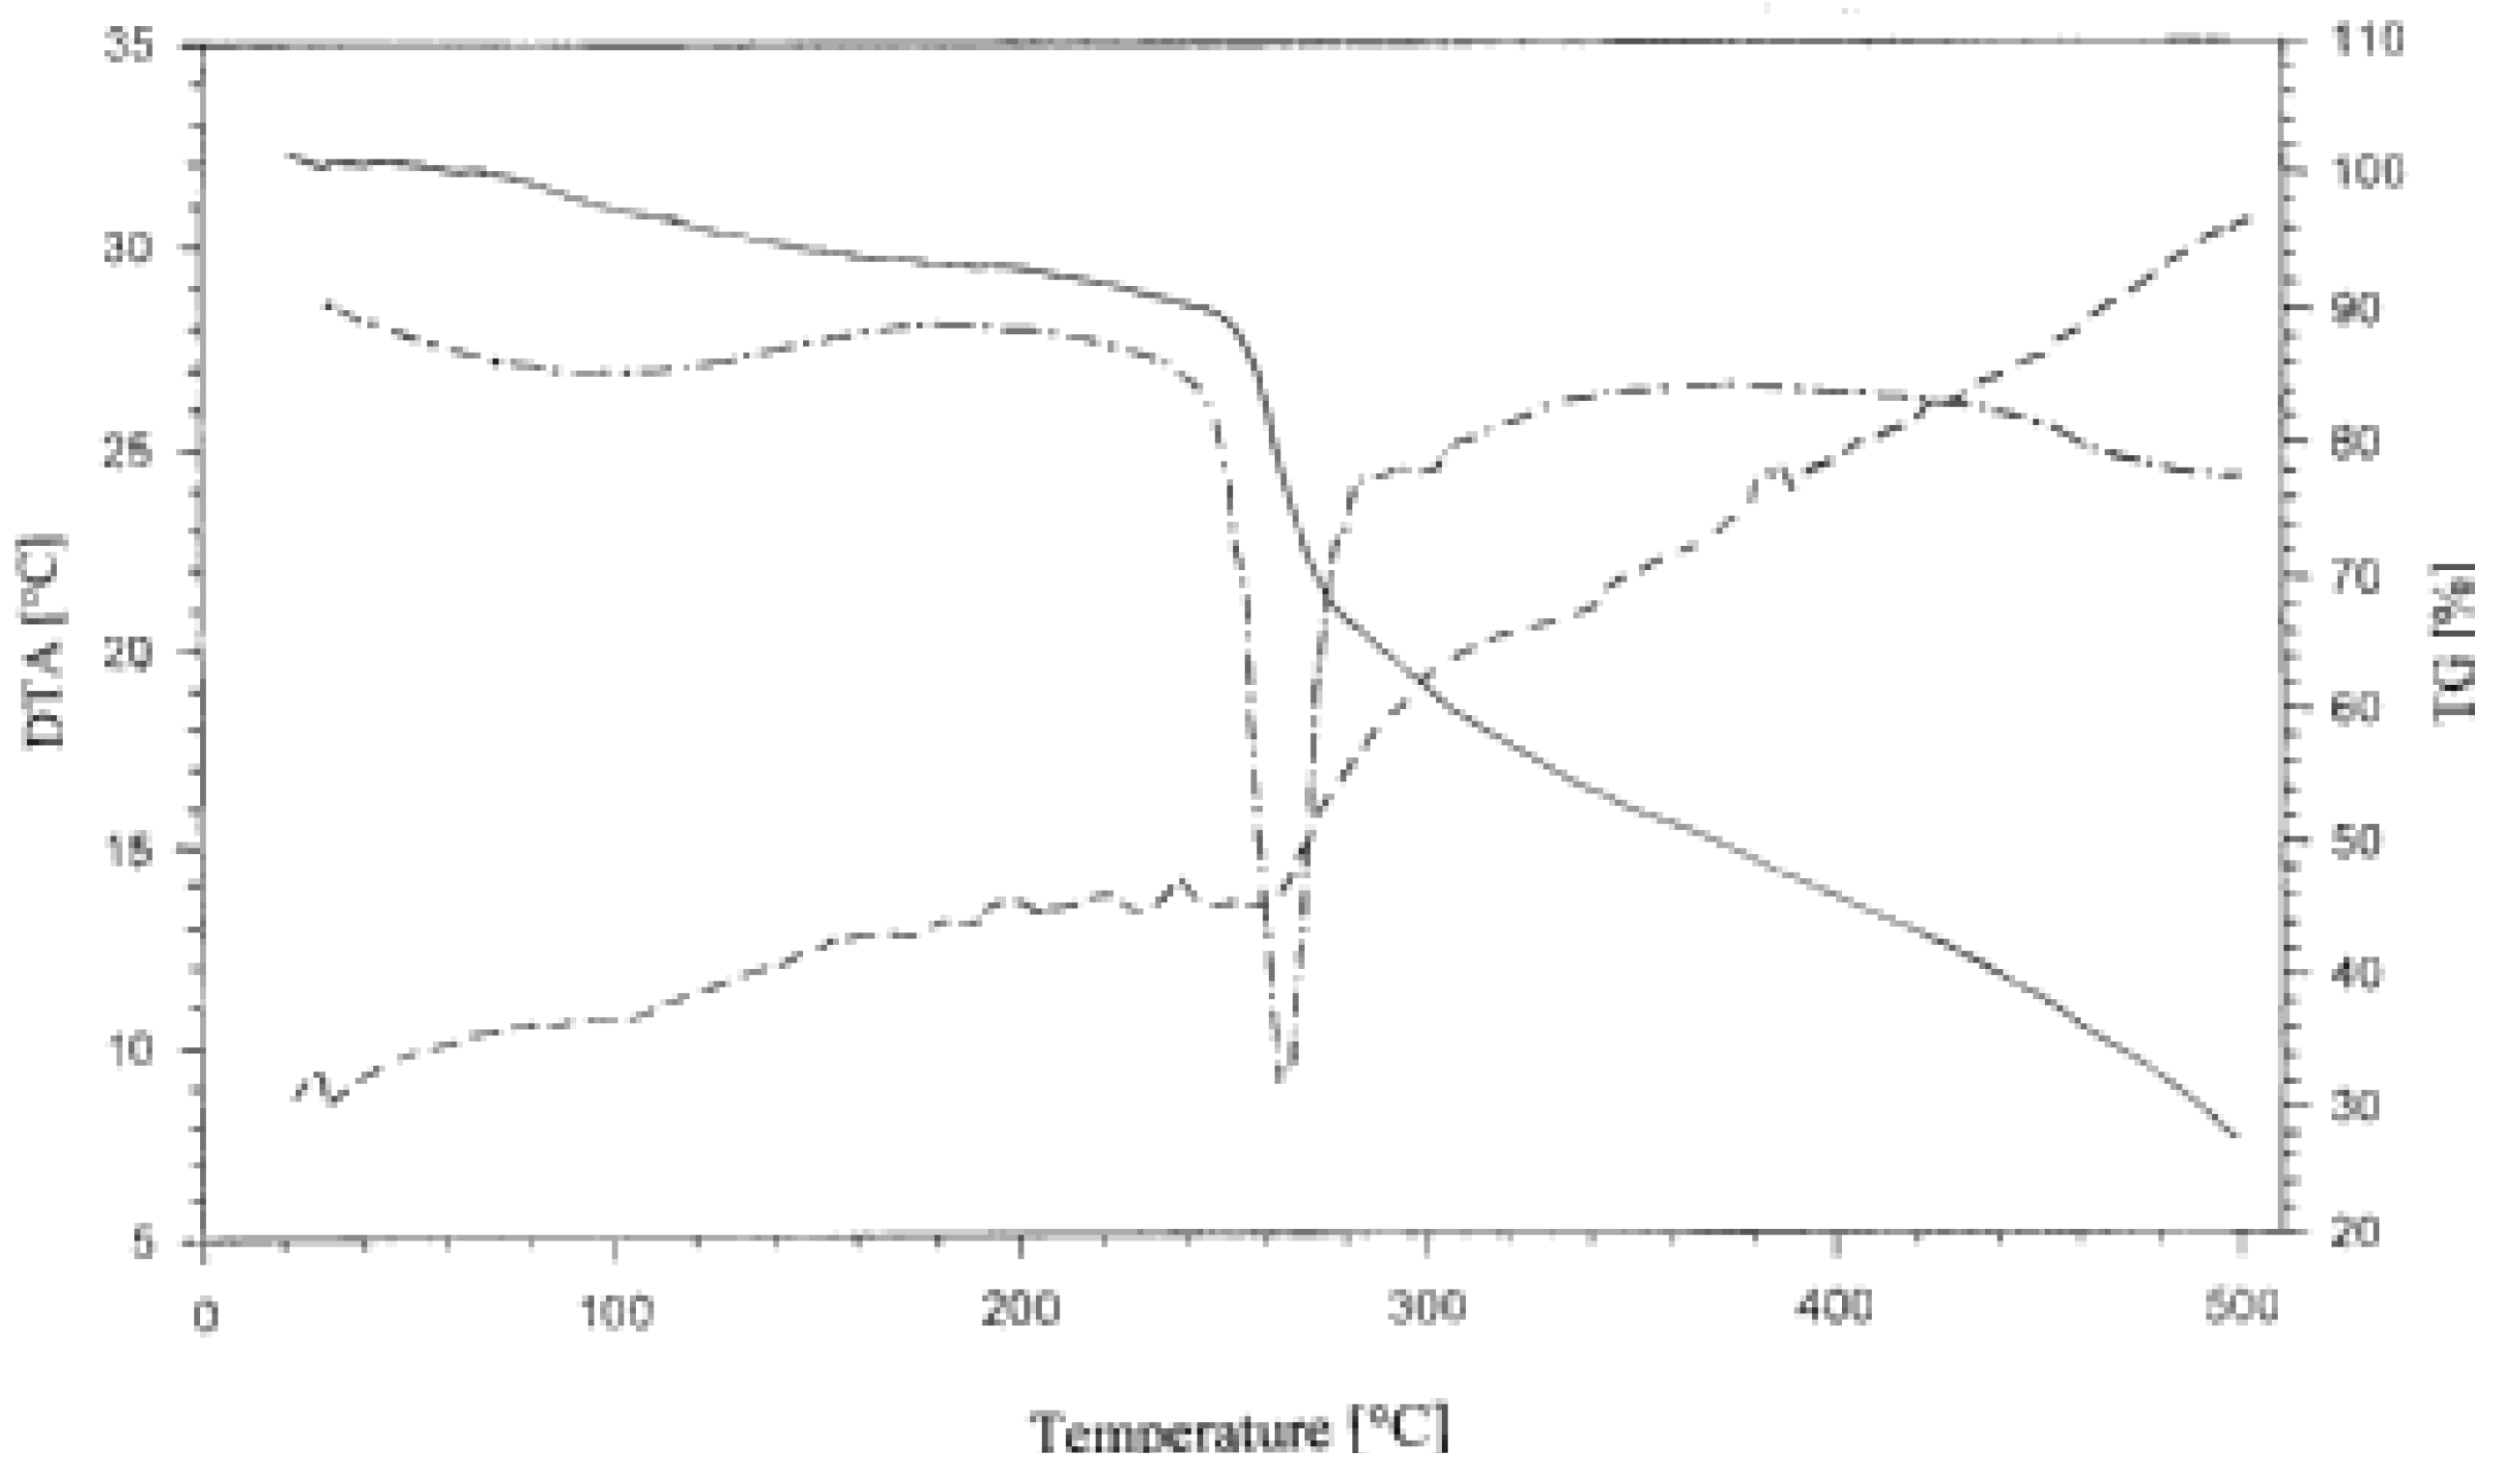
Thermogravimetric studies delivered further information on complexes formed. Regardless the starch variety and method of their phosphation, their thermal decomposition to 500°C as presented in
Figure 4 by the pattern of the thermogravimetric (TG) line proceeded in three consecutive steps.
Figure 4.
Thermogram (TG, DTG, DTA) of GPWCS in the 25-500 °C range.
Figure 4.
Thermogram (TG, DTG, DTA) of GPWCS in the 25-500 °C range.
In the first step, included and sorbed water were removed. In the second step starch decomposed in a fast process followed by a third, by now slow decomposition. On the differential thermogravimetric (DTG) diagram, a shallow, broad peak related to the first step, a strong fairly sharp and symmetric peak reflected the second step and no effect was seen in that diagram corresponding to the third step. The differential thermal analysis diagram was typical for decomposition of polysaccharides. There was a series of small peaks showing complex transformations without accompanying decomposition as there was no related weight loss on the TG line. Because the further part of the DTA presented a continuum it pointed to a complex path of decomposition.
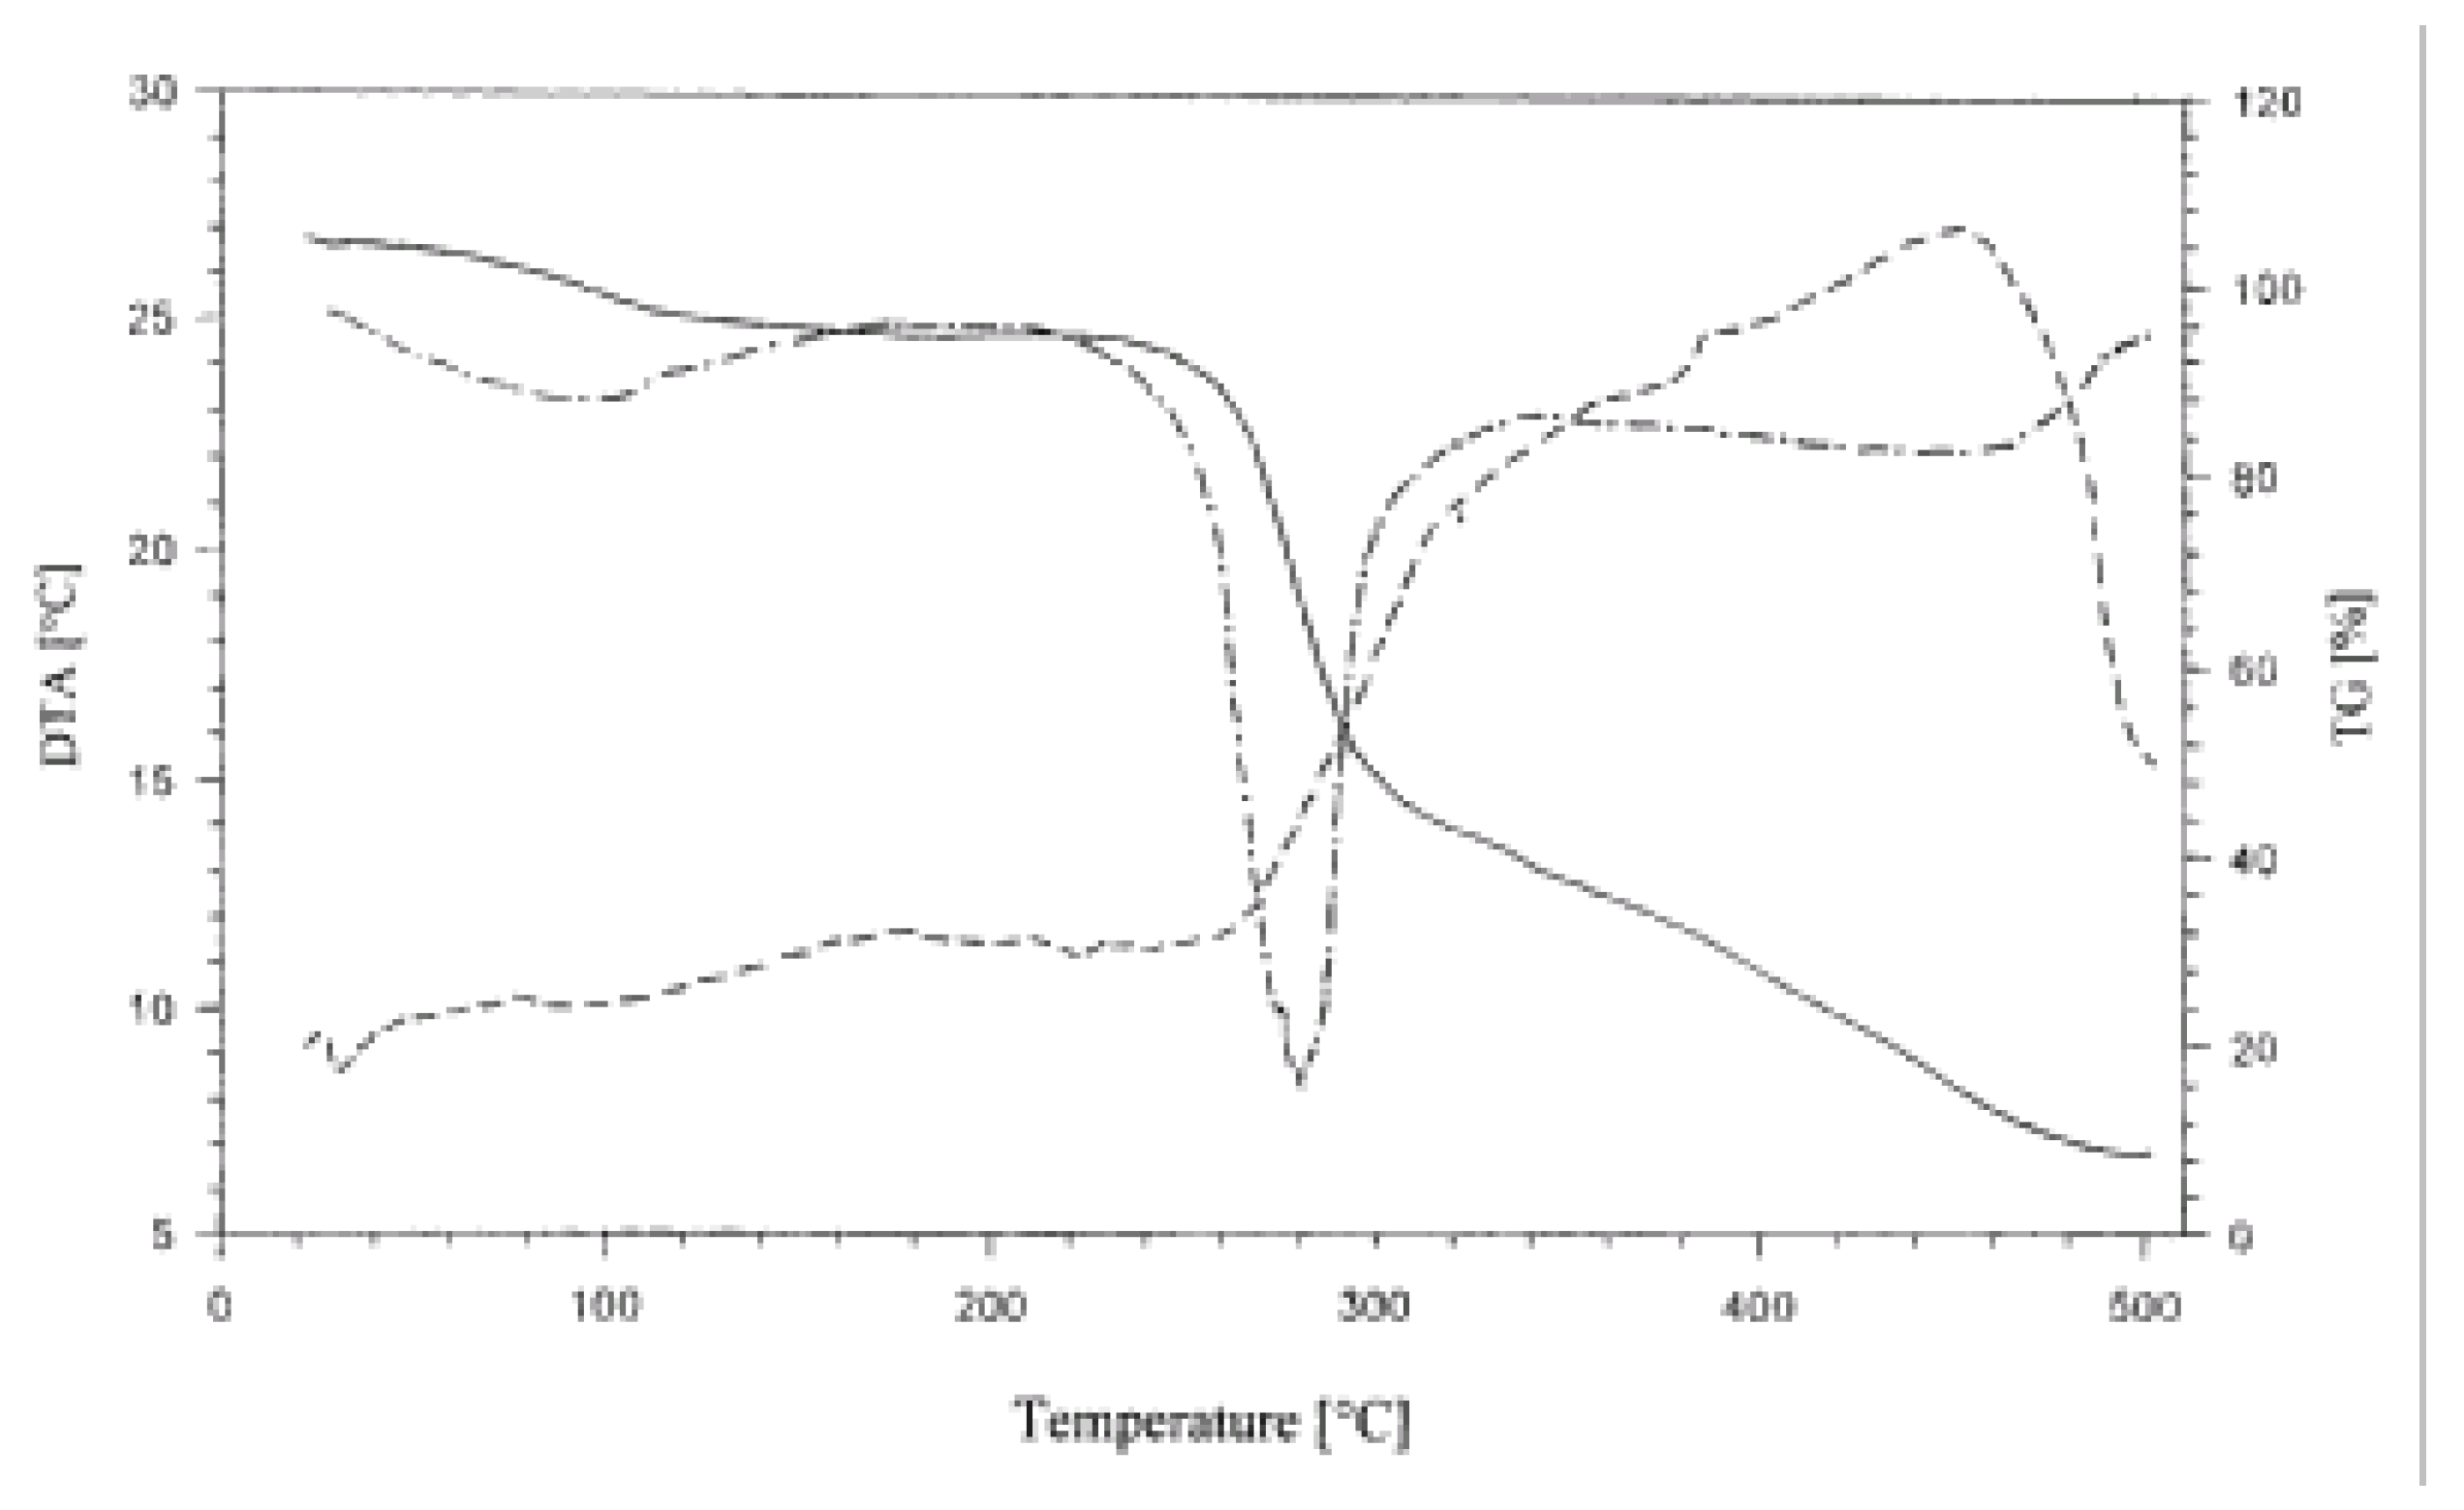
Again, regardless of the type of phosphated starch complexed with casein and the casein to starch proportions, all complexes, except two, decomposed in five steps as manifested by the TG lines of the corresponding diagrams. The first step corresponded to the evolution of water. The second, slow step preceded the main fast decomposition step. Two subsequent steps reflected further subsequent slowing down of the decomposition of the products. In the DTG lines for complexes in which casein dominated (intended casein/starch = 2:1) two peaks could be distinguished (
Figure 5). The first and second peaks could be ascribed to the decompositions of the complex and excessive casein, respectively.
Figure 5.
Thermogram (TG, DTG, DTA) of casein/PPCS 2:1 complex in the 25-500 °C range.
Figure 5.
Thermogram (TG, DTG, DTA) of casein/PPCS 2:1 complex in the 25-500 °C range.
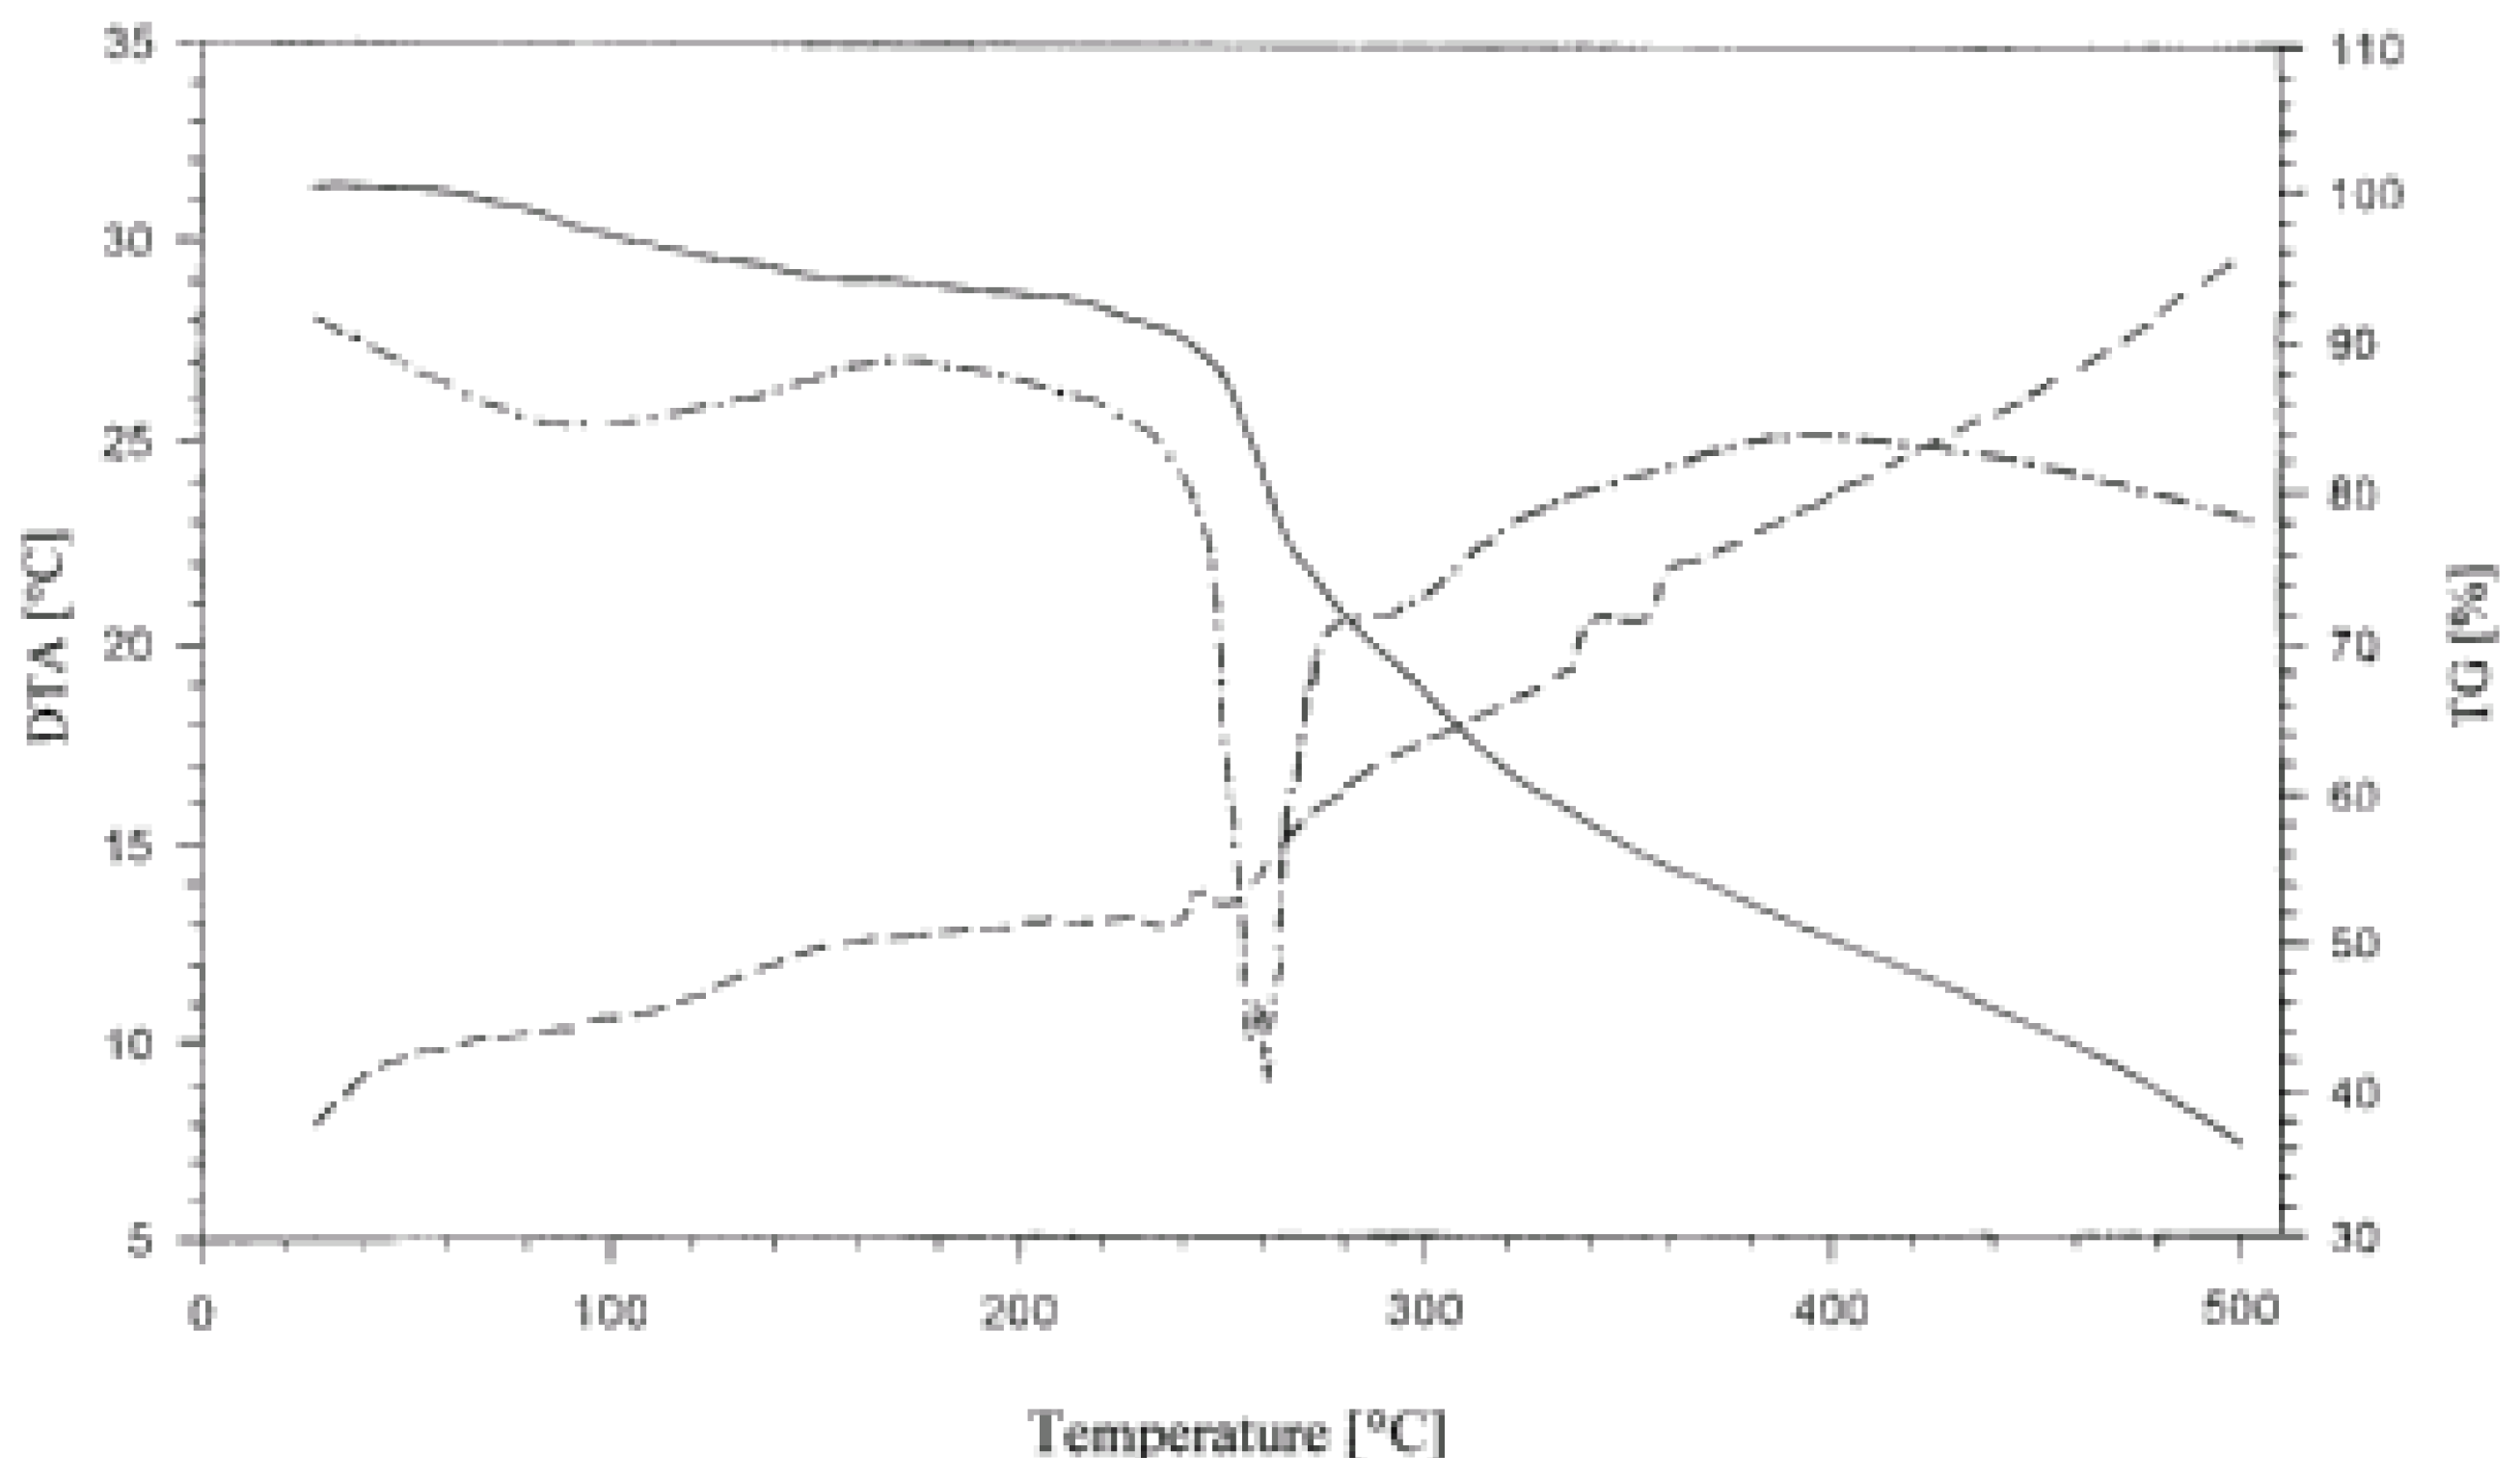
In the relevant thermograms of the complex of intended 1:1 composition, the first decomposition peak on the DTG line was accompanied by a small peak reflecting, presumably, decomposition of excess casein in the complex (
Figure 6). Such an assumption implied that the correct, “stoichiometric” composition of the complex required an excess of phosphated polysaccharide.
Figure 6.
Thermogram (TG, DTG, DTA) of casein/GPCS 1:1 complex in the 25-500°C range.
Figure 6.
Thermogram (TG, DTG, DTA) of casein/GPCS 1:1 complex in the 25-500°C range.
In the diagrams for the complexes in which phosphated starches dominated (intended 1:2 compositions), the main DTG peaks were sharp and no signs of the peaks, which could be related to decomposition of casein, could be observed (
Figure 7).
Figure 7.
Thermogram (TG, DTG, DTA) of casein/GPCS 1:2 complex in the 25-500°C range.
Figure 7.
Thermogram (TG, DTG, DTA) of casein/GPCS 1:2 complex in the 25-500°C range.
It should also be noted that the transition usually denoted as the second step in the TG lines of such complexes were either be barely distinguishable or, in two cases, they were absent.
In
Table 6 the thermal characteristics of the complex components and complexes are given. One could observe that phosphated starches were always less thermally stable than original starches.
Table 6.
Shortened thermal (TG/DTG) characteristics of casein, native corn (NCS) and waxy corn (NWCS) starches, phosphated granular corn (GPCS) and pasted corn (PPCS), granular waxy corn (GPWCS) and pasted waxy corn (PPWCS) starches and their casein complexes.
Table 6.
Shortened thermal (TG/DTG) characteristics of casein, native corn (NCS) and waxy corn (NWCS) starches, phosphated granular corn (GPCS) and pasted corn (PPCS), granular waxy corn (GPWCS) and pasted waxy corn (PPWCS) starches and their casein complexes.
| Species | Moisture content, % | Slope of TG line in particular stagesa, tg α | DTG peaks, °C |
| II | III | IV | V | Main | Sideb |
| Casein | 5.0 | 0.09 | 0.63 | 0.29 | 0.11 | 291 | 340s |
| NCS | 12.0 | | 2.73 | 0.13 | | 282 | |
| NWCS | 14.0 | | 5.25 | 0.15 | | 282 | |
| GPCS | 10.0 | | 1.20 | 0.17 | | 278 | |
| PPCS | 9.0 | | 1.17 | 0.15 | | 270 | |
| GPWCS | 7.5 | | 1.42 | 0.18 | | 280 | |
| PPWCS | 9.0 | | 1.43 | 0.15 | | 270 | |
| GPCS | | | | | | | |
| complexes | | | | | | | |
| 2:1 | 5.0 | 0.09 | 0.39 | 0.10 | | 268 | |
| 1:1 | 7.0 | 0.38 | 0.62 | 0.30 | 0.11 | 262 | 298 |
| 1:2 | 7.5 | 0.08 | 1.17 | 0.25 | 0.13 | 264 | 290s |
| PPCS | | | | | | | |
| complexes | | | | | | | |
| 2:1 | 5.0 | 0.08 | 0.61 | 0.31 | 0.08 | 272 | 300s |
| 1:1 | 6.0 | | 0.84 | 0.27 | 0.12 | 270 | 305s |
| 1:2 | 6.0 | | 0.94 | 0.17 | | 262 | |
| GPWCS | | | | | | | |
| complexes | | | | | | | |
| 2:1 | 7.0 | 0.08 | 0.82 | 0.29 | 0.13 | 270 | |
| 1:1 | 8.0 | 0.06 | 0.83 | 0.25 | 0.13 | 262 | |
| 1:2 | 6.5 | | 2.17 | 0.21 | 0.14 | 255 | |
| PPWCS | | | | | | | |
| complexes | | | | | | | |
| 2:1 | 12.0 | 0.06 | 0.42 | 0.16 | | 280 | 300s |
| 1:1 | 11.5 | 0.06 | 0.54 | 0.31 | 0.09 | 274 | 300s |
| 1:2 | 10.0 | 0.10 | 0.80 | 0.24 | 0.10 | 262 |
Complexes were less thermally stable than free non-complexed phosphated starches. The complexation reduced the moisture content as compared to non-complexed polysaccharides. Among all complexes, these precipitated with PPWCS contained the highest levels of moisture (8-9%). Examination of the data in
Table 6 reveals that the main decomposition step of normal cornstarch (tg α = 5.25) was approximately twice as fast as the relevant step for waxy cornstarch (tg α = 2.73). Phosphation of granular as well as pasted starches led to products which almost uniformly decomposed two times slower than did native waxy cornstarch (tg α = 1.17 – 1.43). Undoubtedly, casein complexation of those starches resulted in a preliminary, slow decomposition step. Complex composition had a practically negligible effect on the rate of that step. Except for 1:2 complexes with GPWCS and PPWCS where the TG-grams of such a step could not be observed, tg α varied between 0.1 and 0.06. The second decomposition steps were faster by approximately one order of magnitude than the latter and there were no trends relating the rate of that step and composition of the complexes.
Studies were conducted to determine the degradability of starch, phosphated starches, and their casein complexes by means of maltogenic amylase. Native waxy cornstarch was more susceptible to the enzyme (
Table 7). Phosphation of starches increased their digestibility by amylase to a higher extent in case of normal cornstarch. Casein complexes with phosphated starches were, generally less susceptible to the enzyme. Starch complexes phosphated after pasting were digested with more difficulty than those phosphated in the granular state. This could be rationalized by more uniform phosphation of pasted starches and, hence, more compact structures of complexes with such starches.
Table 7.
Biodegradability of native corn (NCS), waxy corn (NWCS), phosphated granular corn (GPCS) and pasted corn (PPCS), granular waxy corn (GPWCS) and pasted waxy corn (PPWCS) starches and their complexes with casein
Table 7.
Biodegradability of native corn (NCS), waxy corn (NWCS), phosphated granular corn (GPCS) and pasted corn (PPCS), granular waxy corn (GPWCS) and pasted waxy corn (PPWCS) starches and their complexes with casein
| Species | Change in the maltose content [mg/100 g complex] after |
| 6 h | 14 h | 24 h | 30 h | 48 h |
| Casein | +0.5 | 0.0 | +1.0 | 0.0 | +0.3 |
| NCS | 0.0 | 0.0 | +26.0 | 0.0 | +211.0 |
| GPCS | +15.0 | +49.0 | +198.3 | +61.0 | 0.0 |
| PPCS | +63.0 | +533.0 | +44.0 | +146.8 | +554.0 |
| GPCS complexes | | | | | |
| 2:1 | +61.5 | +34.5 | +8.0 | +4.5 | +5.0 |
| 1:1 | +92.5 | +86.0 | +87.5 | +21.3 | +33.0 |
| 1:2 | +132.0 | +133.3 | +30.0 | +19.0 | +16.3 |
| PPCS complexes | | | | | |
| 2:1 | +89.3 | +69.0 | +15.0 | +3.3 | +4.0 |
| 1:1 | +94.5 | +143.3 | +152.0 | +16.5 | +38.5 |
| 1:2 | +136.0 | +161.0 | +14.5 | +8.5 | +17.0 |
| NWCS | +26.5 | +49.0 | +198.3 | +61.0 | 0.0 |
| GPWCS | +0.8 | +62.5 | +40.5 | +3.0 | +54.5 |
| PPWCS | +275.5 | +483.5 | +481.0 | +110.0 | +306.0 |
| GPWCS complexes | | | | | |
| 2:1 | +229.0 | +243.0 | +145.5 | +135.0 | +56.5 |
| 1:1 | +107.5 | +302.8 | +335.5 | +58.5 | +13.0 |
| 1:2 | +414.5 | +497.5 | +463.5 | +465.5 | +432.5 |
| PPWCS complexes | | | | | |
| 2:1 | +153.0 | +172.3 | 0.0 | -7.5 | -43.3 |
| 1:1 | +95.5 | +198.5 | +160.0 | -22.0 | +89.3 |
| 1:2 | +249.5 | +341.5 | +106.5 | +135.5 | -122.0 |

