

Phenolic Compounds in Flowers and Herb of Achillea millefolium L.: Histochemical and Phytochemical Studies

 , , , and
Abstract
1. Introduction
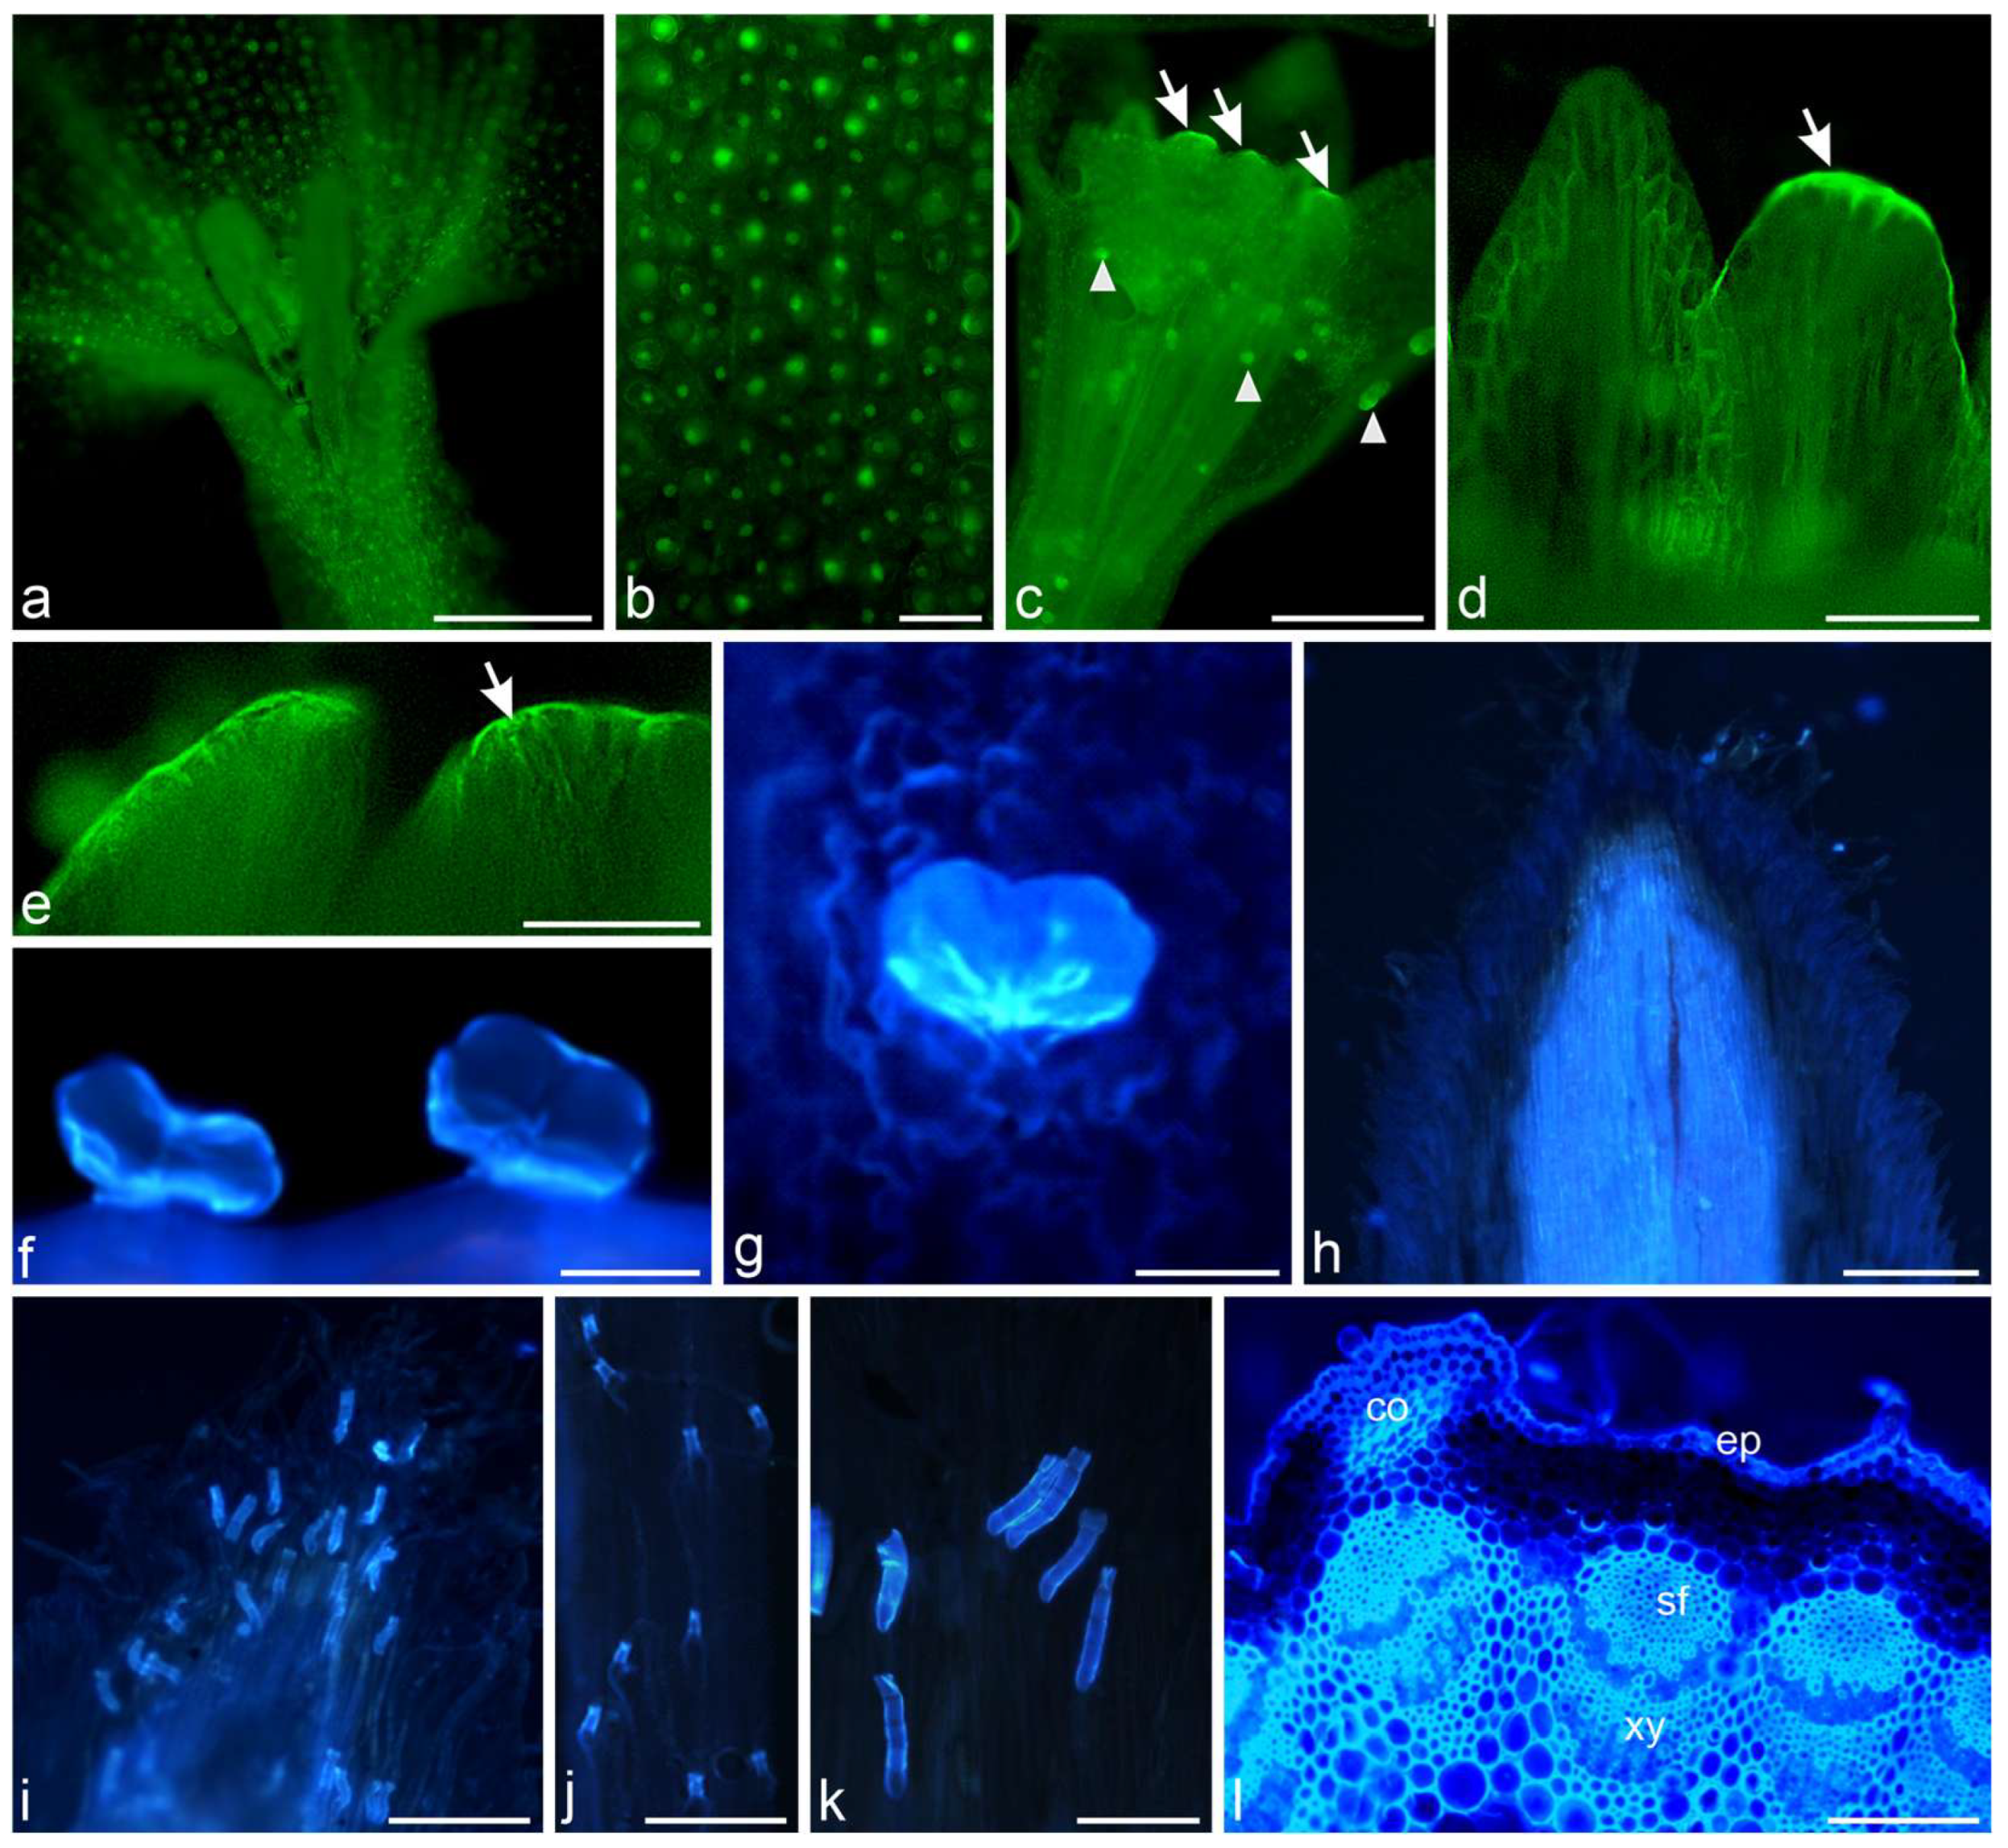
2. Results
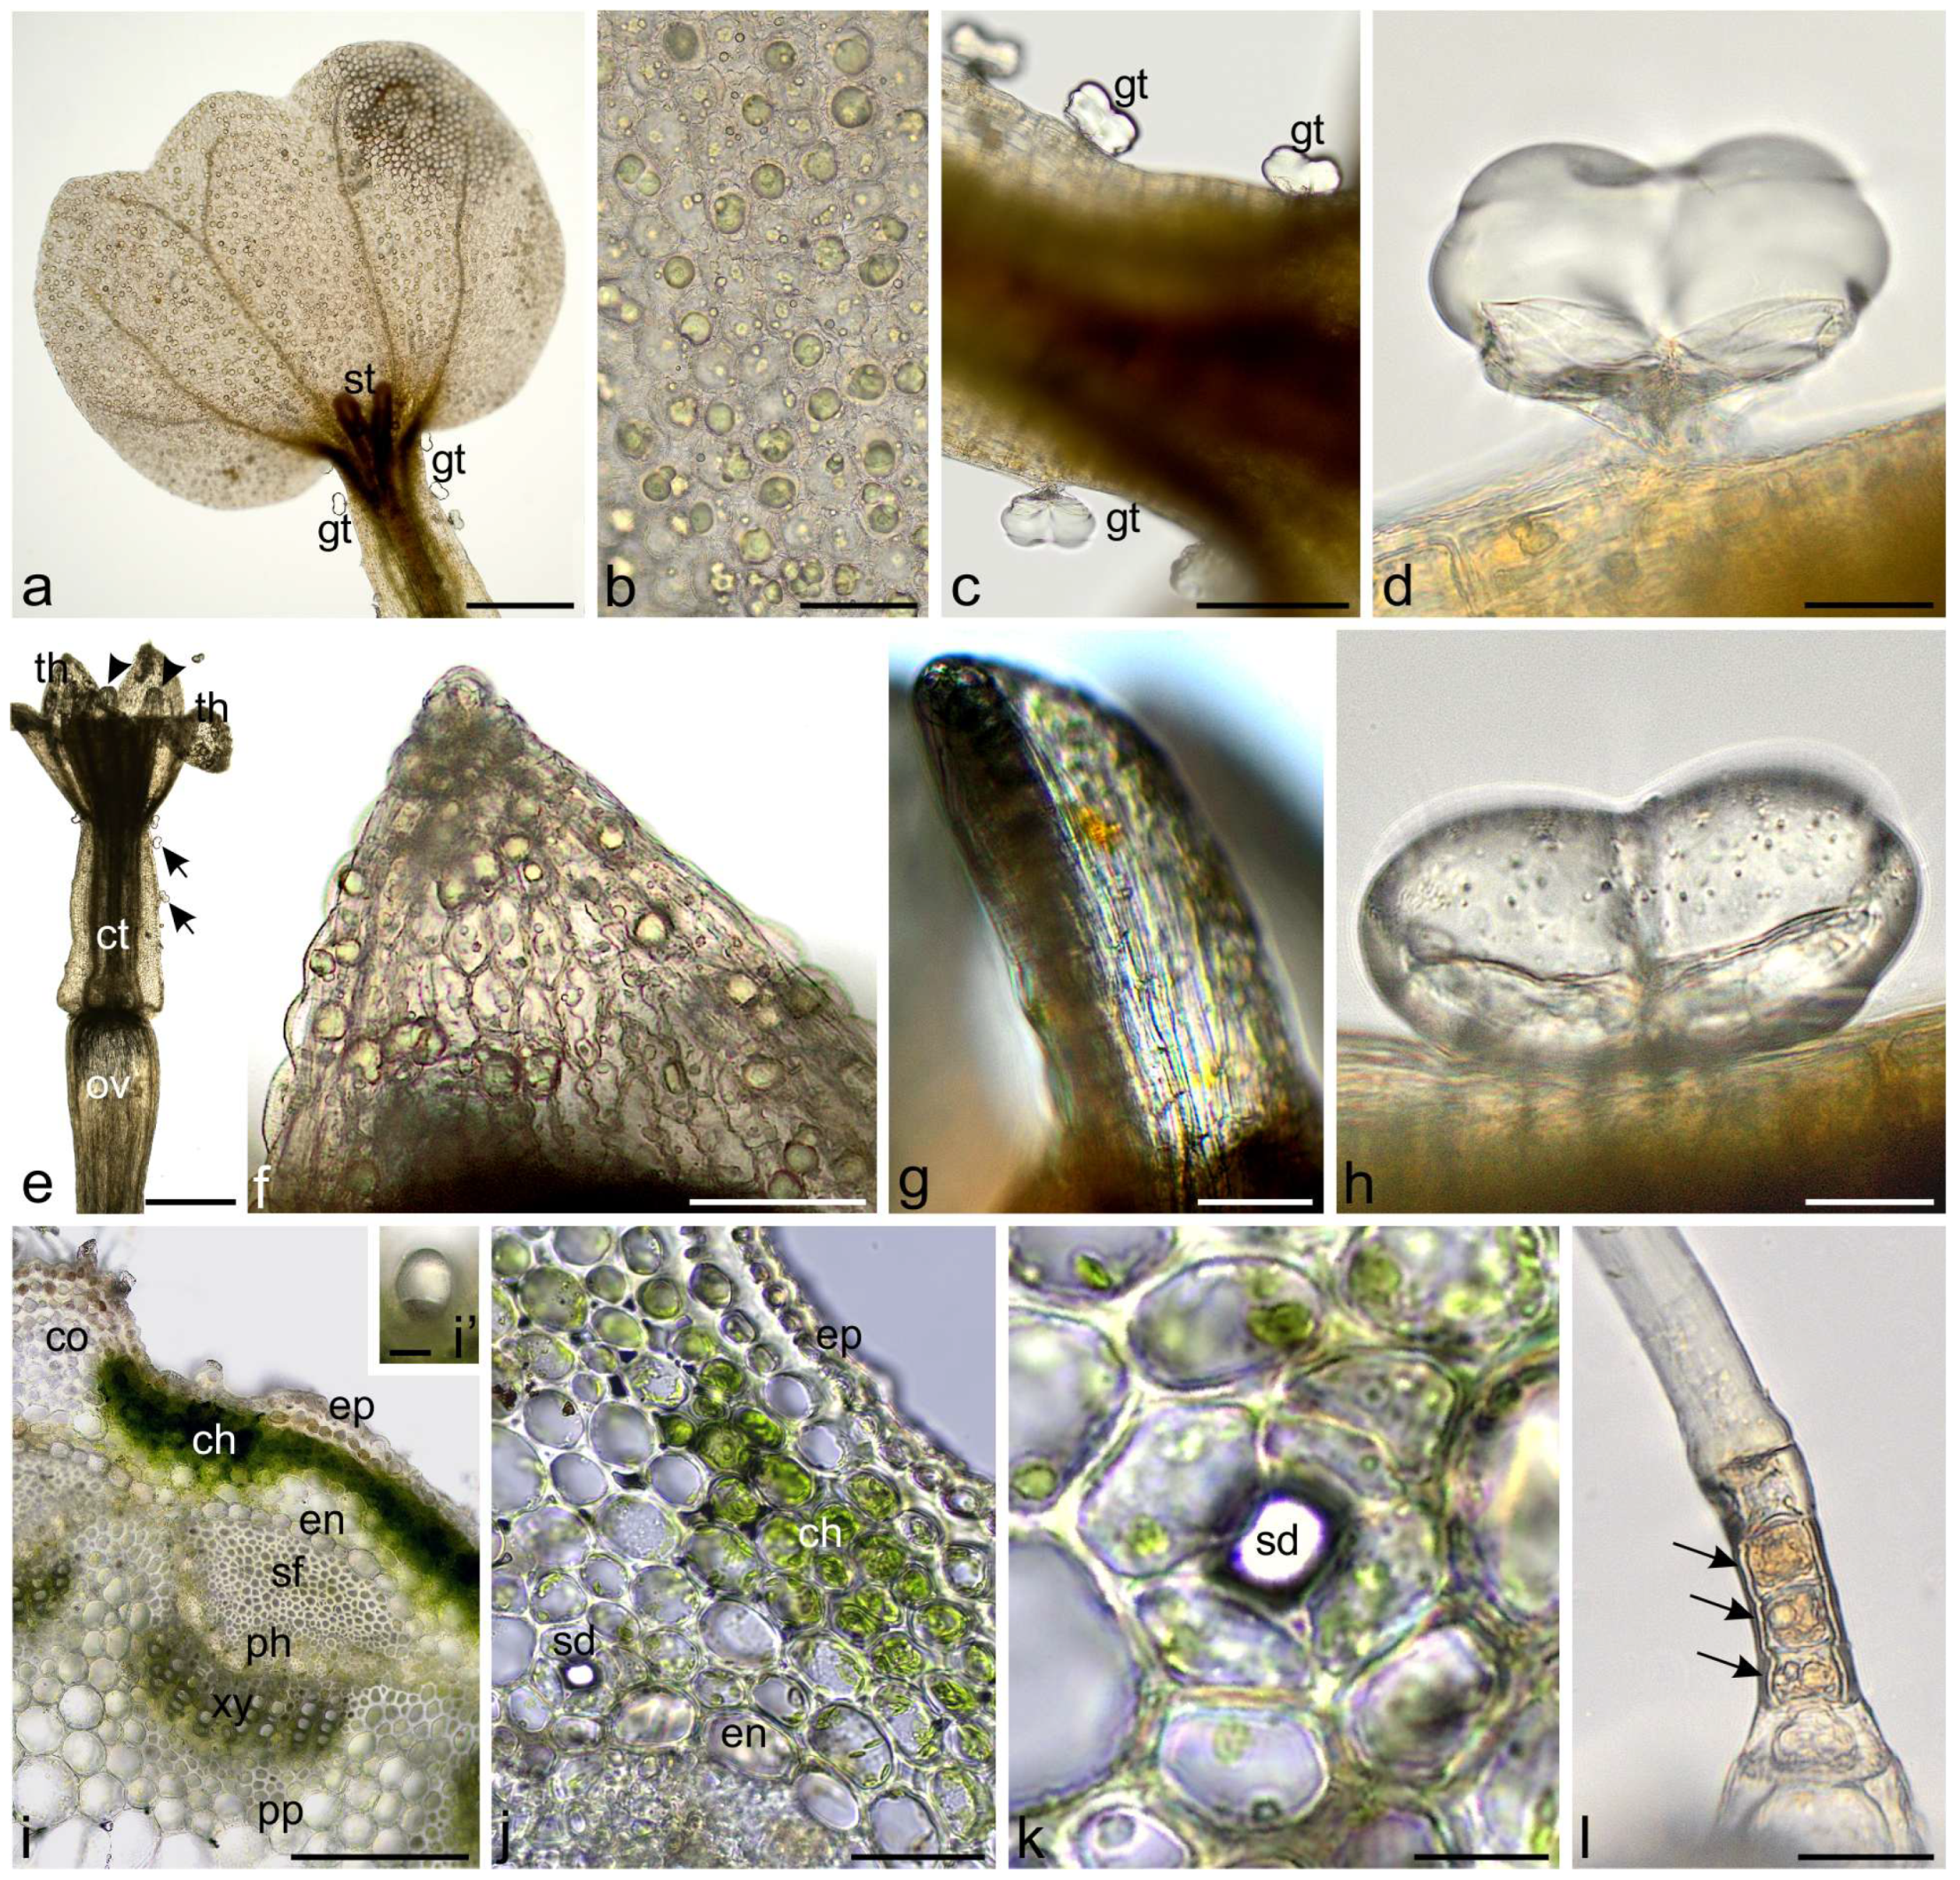
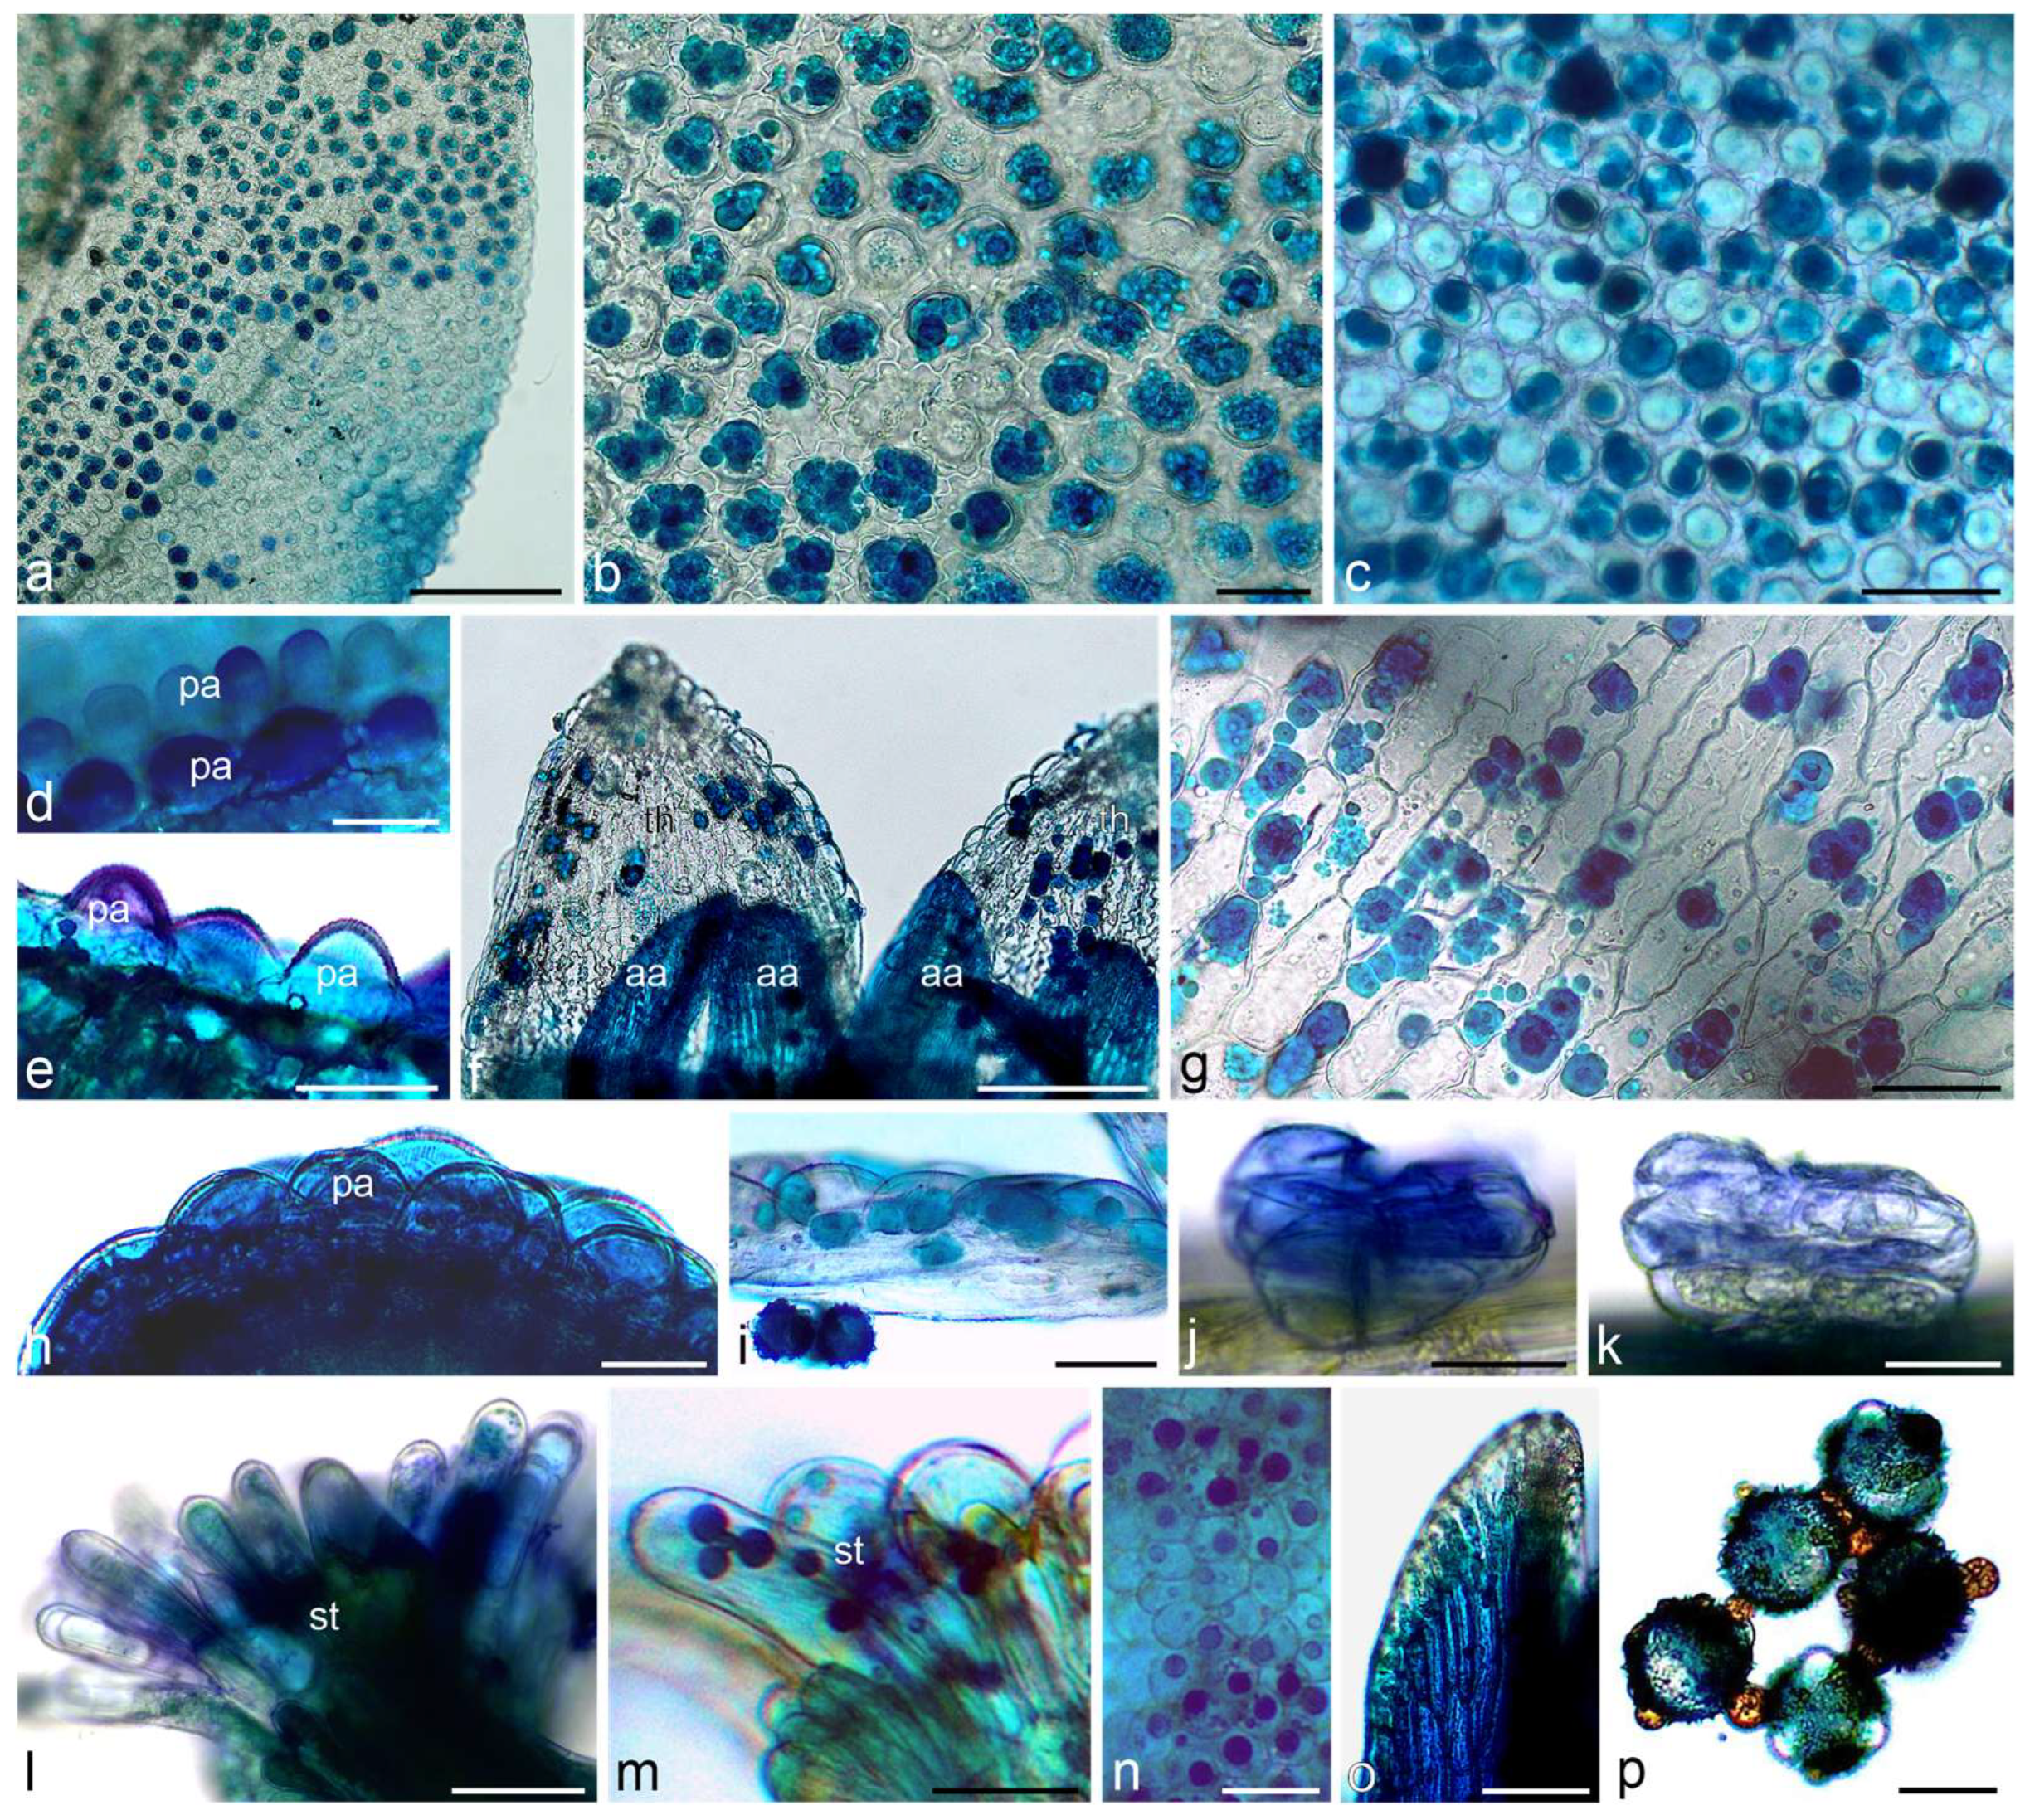
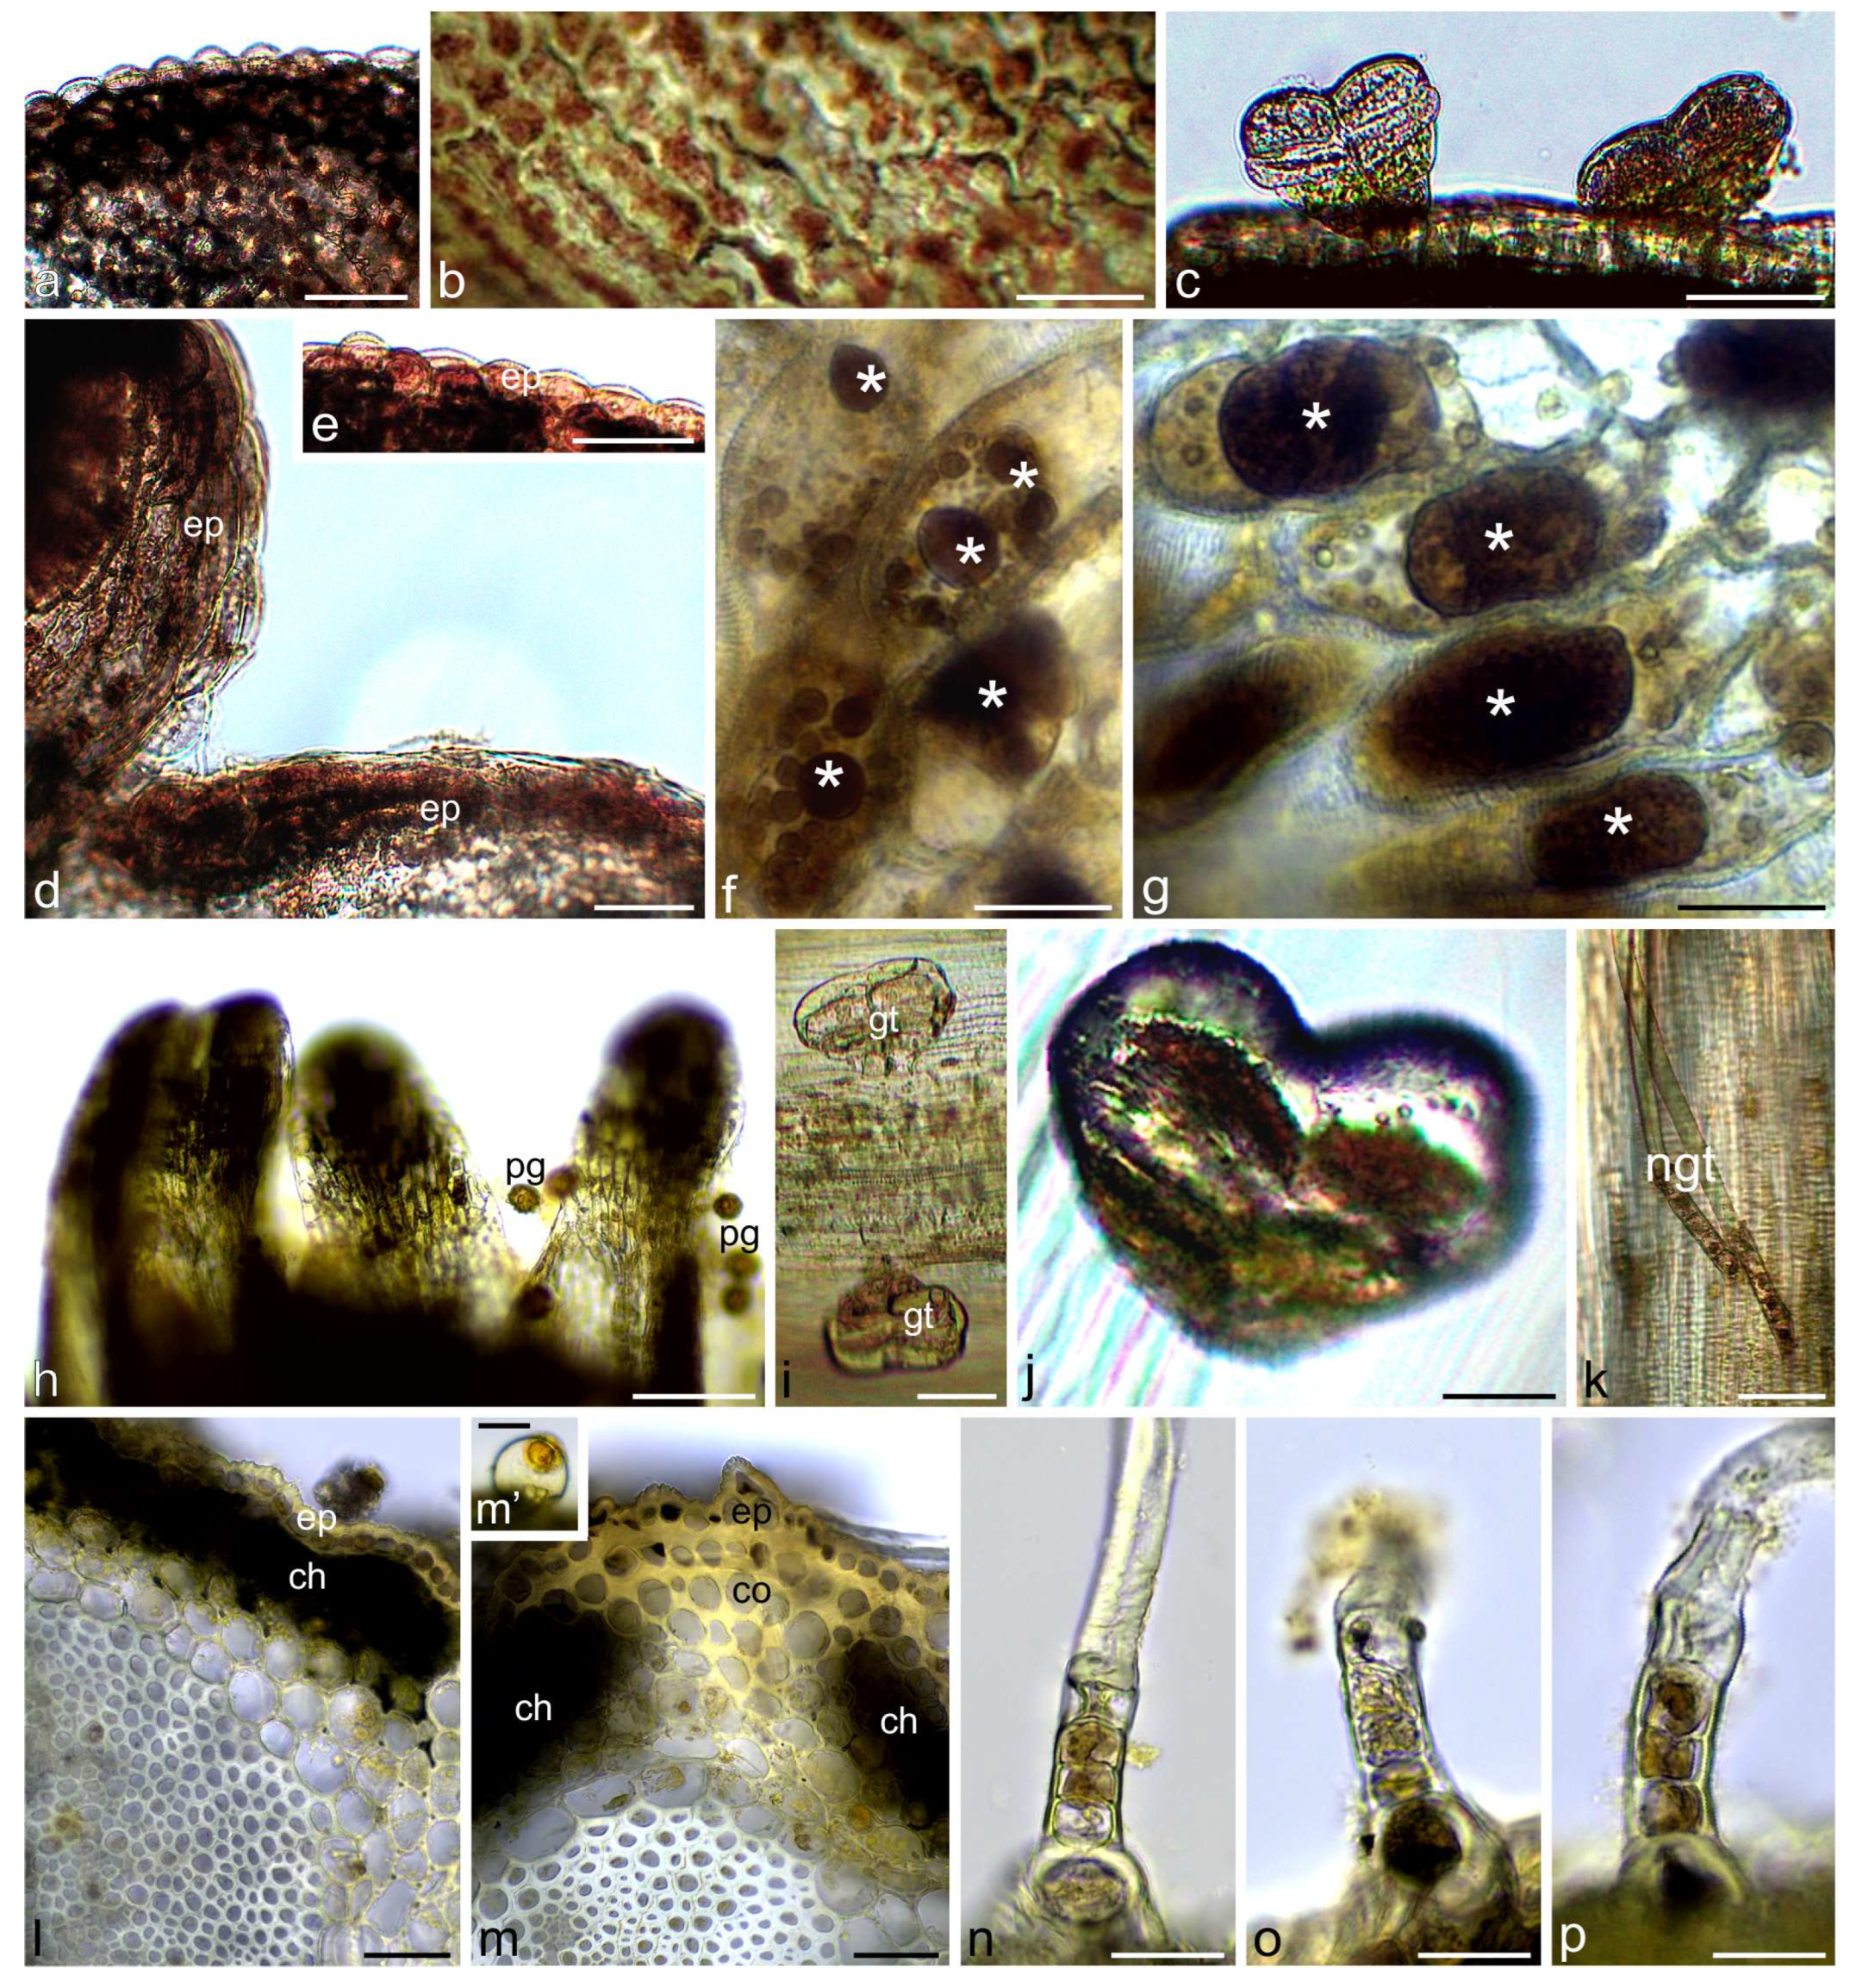
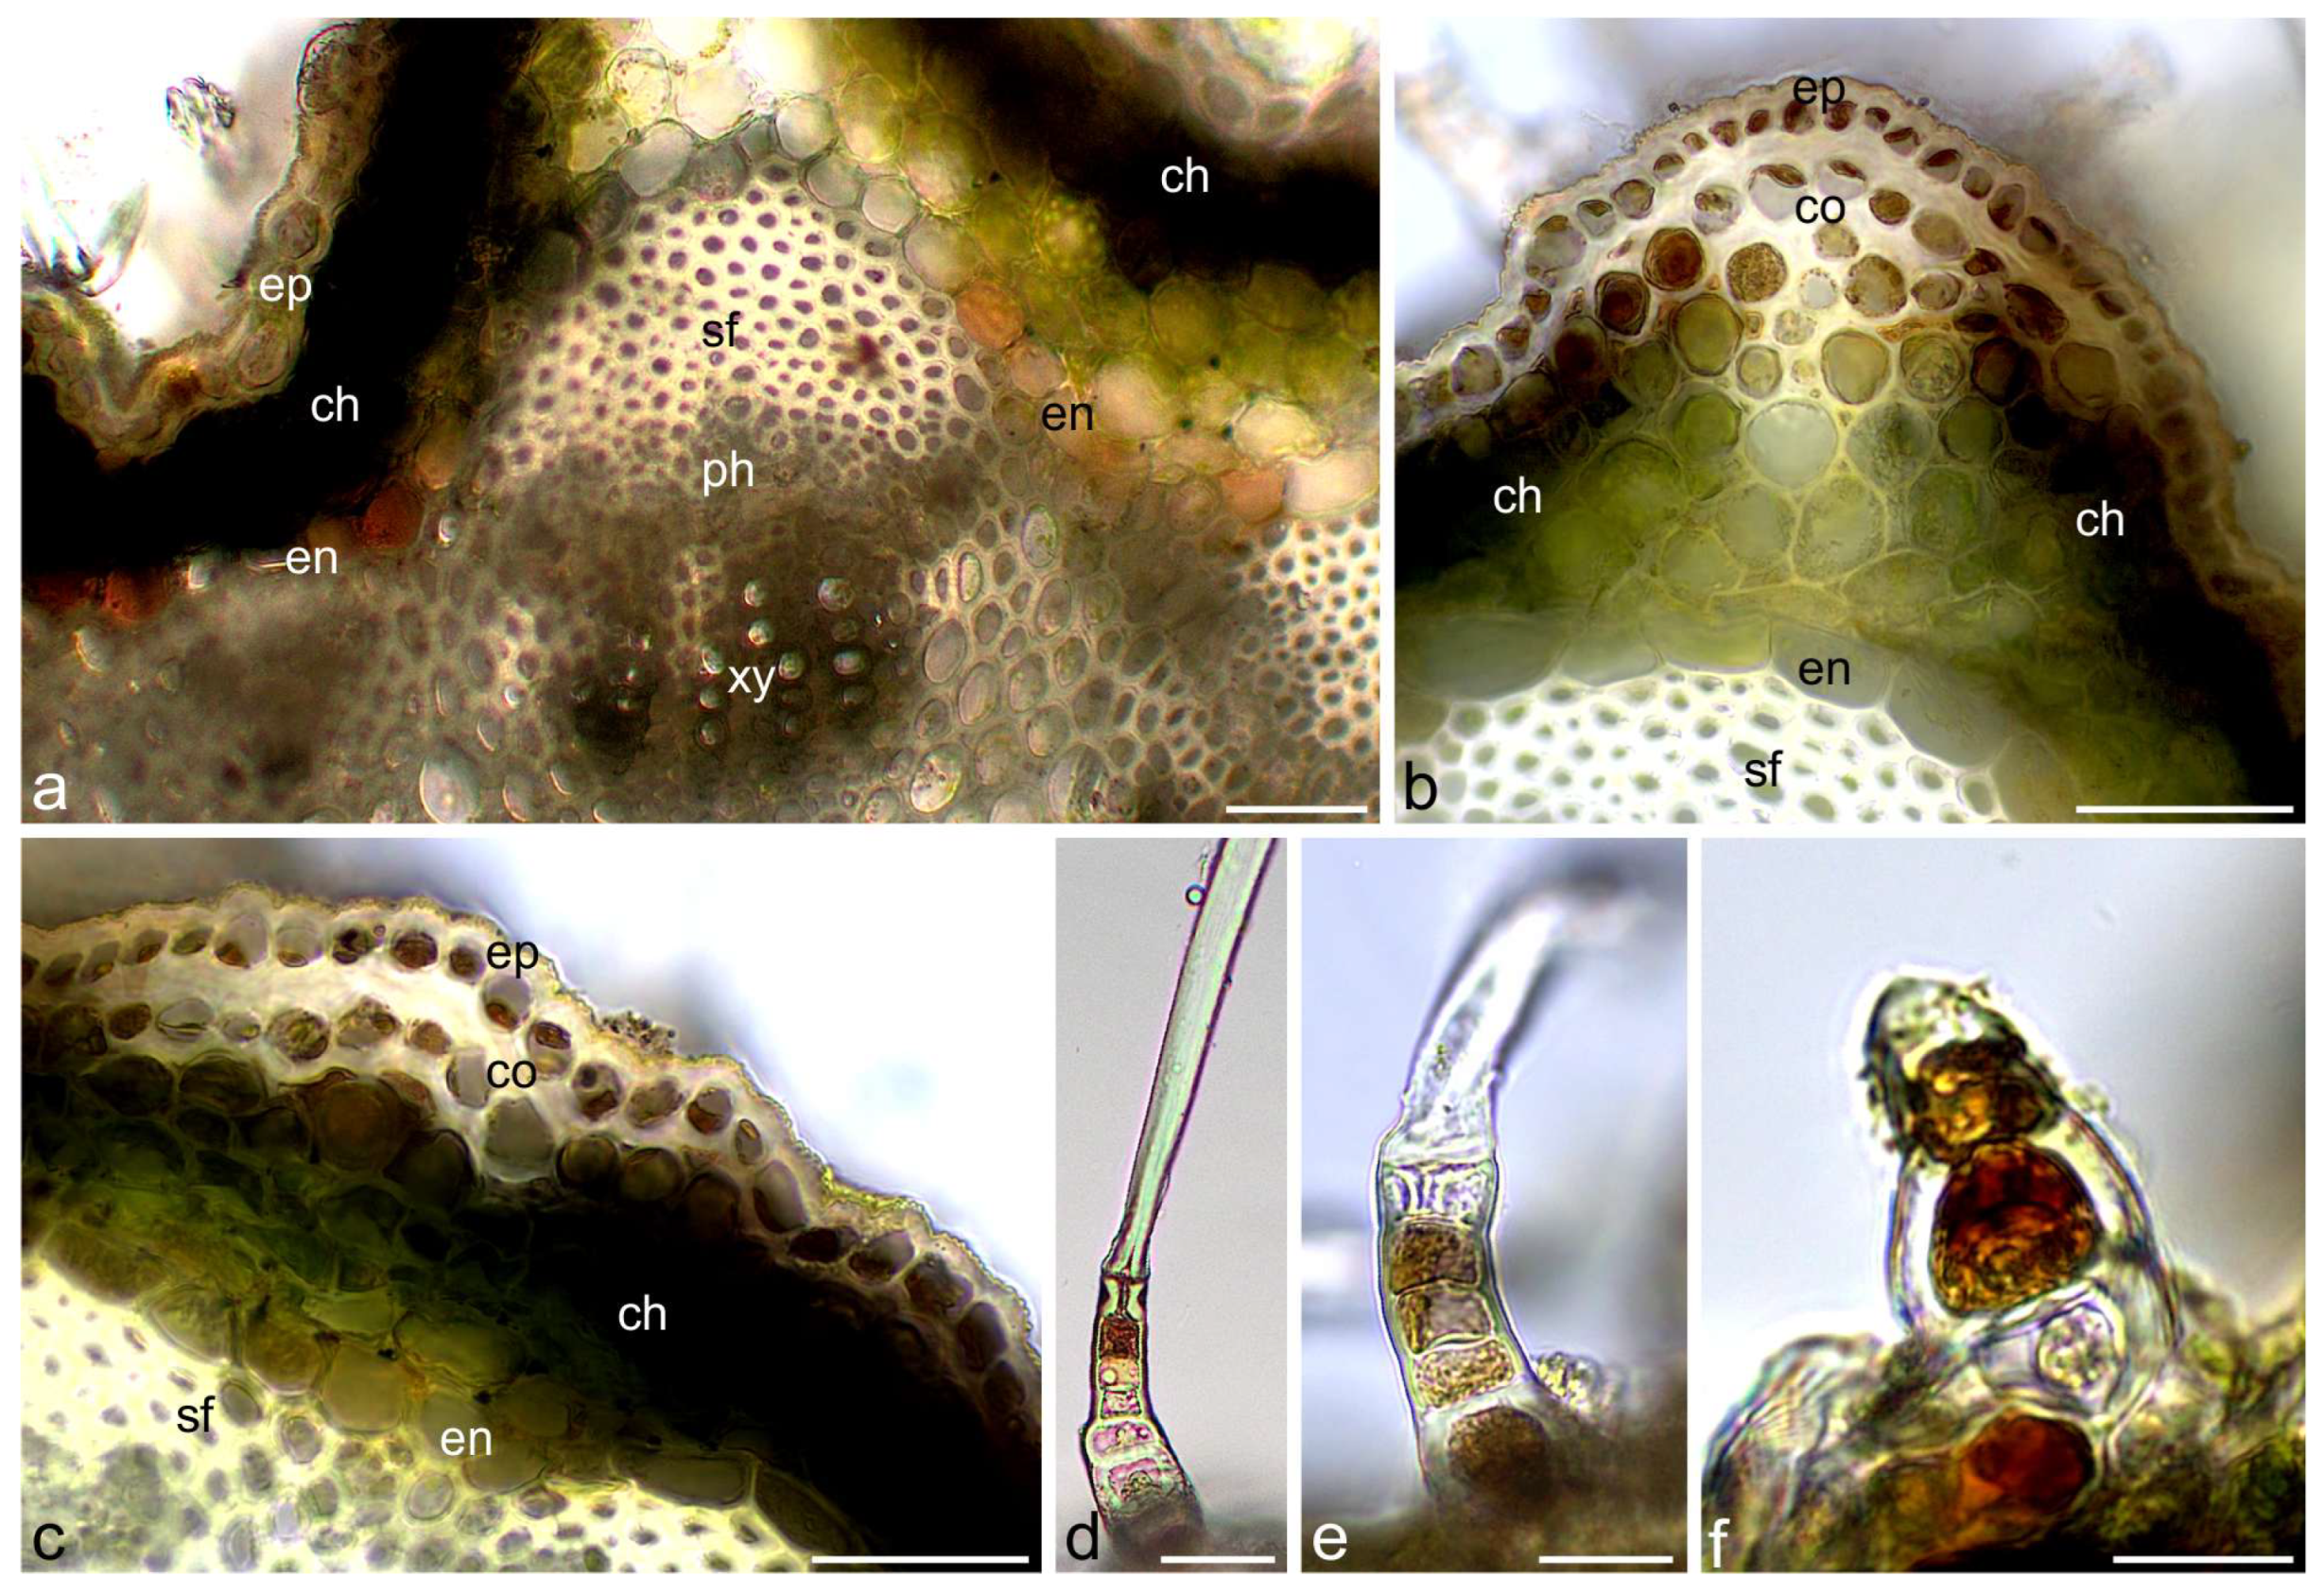
2.1. Histochemical Assays
2.2. Effects of Phytochemical Analyses
2.2.1. Qualitative Analysis

| No. | RT | Tentative Identification | Formula | M/Z | Flowers | Herb | Refs. |
|---|---|---|---|---|---|---|---|
| (Min) | |||||||
| 1 | 1.77 | Caffeic acid 3-glucoside | C15H18O9 | 343.1021 | + | + | |
| 2 | 1.99 | Salicylic acid | C7H6O3 | 139.0395 | + | + | |
| 3 | 2.71 | Chlorogenic acid | C16H18O9 | 355.1027 | + | + | Standard [5,34,35] |
| 4 | 3.64 | Myricetin 3-O-rutinoside | C27H30O17 | 627.1559 | + | − | |
| 5 | 3.69 | Quercetin 3-O-rutinoside-7-O-Gluc | C33H40 O21 | 773.213 | + | + | |
| 6 | 3.77 | p-Coumaroyl quinic acid | C16H18O8 | 339.1077 | + | + | [5,34] |
| 7 | 4.01 | Kaempferol 3,7-O-diglucoside | C27H30O16 | 611.1618 | + | + | |
| 8 | 4.07 | Quercetin 3-O-xylosyl-rutinoside | C32H38O20 | 743.2036 | + | − | |
| 9 | 4.09 | 3-Feruloylquinic acid | C17H20O9 | 369.1199 | + | + | |
| 10 | 4.14 | Isorhamnetin 3-O-rutinoside | C28H32O16 | 478.1111 | − | + | |
| 11 | 4.21 | Cyanidin 3-O-rutinoside | C27H31O15 | 596.1695 | + | + | |
| 12 | 4.25 | Kaempferol 3-O-rutinoside | C27H30O15 | 595.1658 | + | − | [5,34] |
| 13 | 4.29 | Apigenin7-O-apiosylglucoside | C26H28O14 | 565.1562 | + | + | |
| 14 | 4.34 | Caffeic acid | C9H8O4 | 181.0507 | + | + | Standard [35] |
| 15 | 4.52 | Quercetin 3-O-galactoside | C21H20O12 | 465.1052 | + | + | Standard |
| 16 | 4.52 | Rutin | C27H30O16 | 611.1616 | + | − | Standard [5,34,35] |
| 17 | 4.54 | Kaempferol 3-O-xylosyl-glucoside | C26H28O15 | 581.1513 | + | + | |
| 18 | 4.54 | Kaempferol 3, 7-O-diglucoside | C27H30O16 | 611.1627 | − | + | |
| 19 | 4.56 | Cyanidin 3, 5-O-diglucoside | C27H31O16 | 612.1679 | − | + | |
| 20 | 4.54 | 3, 4 Dimethoxycinnamic acid | C11H12O4 | 209.0819 | + | − | |
| 21 | 4.57 | Apigenin 6-C-glucoside | C21H20O10 | 433.1135 | + | + | |
| 22 | 4.59 | Apigenin 6,8-di-C-glucoside | C27H30O15 | 595.1667 | + | + | [5] |
| 23 | 4.63 | Quercetin 3-O-glucoside | C21H20O12 | 465.1052 | + | + | Standard [34,35] |
| 24 | 4.65 | Luteolin 6-C-glucoside | C21H20O11 | 449.1085 | + | + | Standard [5] |
| 25 | 4.67 | Delphinidin 3-O-glucoside | C21H21O12 | 466.1093 | − | + | |
| 26 | 4.68 | Quercetin 3′-O-glucuronide | C21H18O13 | 479.0835 | − | + | |
| 27 | 4.84 | Quercetin 3-O-(6″-malonyl-Gluc) | C24H22O15 | 551.1055 | + | + | |
| 28 | 4.88 | Cyanidin 3-O-galactoside | C21H21O11 | 450.1135 | − | + | |
| 29 | 4.92 | Apigenin7-O-rutinoside | C27H30O14 | 579.1716 | + | + | |
| 30 | 4.95 | Quercetin | C15H10O7 | 303.0502 | + | + | Standard [35] |
| 31 | 4.99 | Isorhamnetin-3-O-glucoside | C22H22O12 | 479.1201 | + | − | [5,34] |
| 32 | 5.01 | Apigenin-7-O-glucoside | C21H20O10 | 433.1135 | + | − | Standard [5,34,35] |
| 33 | 5.04 | Luteolin 7-O-glucoside | C21H20O11 | 449.1085 | + | + | Standard [34,35] |
| 34 | 5.09 | Apigenin 7-O-glucuronide | C21H18O11 | 447.0934 | + | − | [34] |
| 35 | 5.12 | 3,4-Dicaffeoylquinic acid | C25H24O12 | 517.1366 | + | + | [34] |
| 36 | 5.17 | Ferulic acid | C10H10O4 | 195.0665 | − | + | Standard |
| 37 | 5.18 | Chrysoeriol 7-O-glucoside | C22H22O11 | 463.1233 | + | + | |
| 38 | 5.21 | Quercetin 3-(6″-acetylglucoside) | C23H22O13 | 507.1145 | − | + | |
| 39 | 5.39 | Quercetin 3-O-rhamnoside | C21H20O11 | 449.1076 | + | − | [35] |
| 40 | 5.42 | Isorhamnetin | C16H12O7 | 317.0658 | + | − | |
| 41 | 5.62 | Cyanidin 3-O-(6″-acetylglucoside) | C23H23O12 | 492.1286 | − | + | |
| 42 | 5.75 | Genistein | C15H10O5 | 271.0604 | + | − | |
| 43 | 5.86 | Luteolin | C15H10O6 | 287.0552 | + | + | Standard [5,34,35] |
| 44 | 5.91 | Naringenin 7-O-glucoside | C21H22O10 | 435.1277 | − | + | |
| 45 | 6.17 | 6″-O-Acetylgenistin | C23H22O11 | 475.124 | + | − | |
| 46 | 6.27 | Glycitein 7-O-glucoside | C22H22O10 | 447.1297 | + | + | |
| 47 | 6.59 | Apigenin | C15H10O5 | 271.0603 | + | + | Standard [5,34,35] |
| 48 | 6.89 | Rosmarinic acid | C18H16O8 | 361.0922 | + | + | Standard [16] |
2.2.2. Quantitative Analysis
3. Discussion
3.1. Histochemistry
3.2. Phytochemistry
4. Materials and Methods
4.1. Characteristics of Experimental Material
4.2. Microscopic Preparation and Anatomical Analyses
4.2.1. Light Microscopy (LM), Histochemical Assays
4.2.2. Fluorescence Microscopy (FM)
4.3. Phytochemical Analysis
4.3.1. Quantitative and Qualitative Analysis of Total Phenols and Flavonoids
4.3.2. Liquid Chromatography-Mass Spectrometry (LC-MS) Analysis
4.3.3. Total Phenolic Compounds
4.3.4. Total Flavonoids
4.3.5. High-Performance Liquid Chromatography (HPLC) Analysis
4.4. Statistical Analysis
5. Conclusions
Supplementary Materials
Author Contributions
Funding
Institutional Review Board Statement
Informed Consent Statement
Data Availability Statement
Conflicts of Interest
References
- Vitalini, S.; Beretta, G.; Iriti, M.; Orsenigo, S.; Basilico, N.; Dall’Acqua, S.; Iorizzi, M.; Fico, G. Phenolic compounds from Achillea millefolium L. and their bioactivity. Acta Biochim. Pol. 2011, 58, 203–209. [Google Scholar] [CrossRef] [PubMed]
- Kumar, G.; Jalaluddin, M.; Rout, P.; Mohanty, R.; Dileep, C.L. Emerging trends of herbal care in dentistry. J. Clin. Diagn. Res. 2013, 7, 1827–1829. [Google Scholar] [CrossRef] [PubMed]
- European Pharmacopoeia 11. Yarrow. Millefolii herba. 2023. Available online: https://www.edqm.eu/en/european-pharmacopoeia-ph.-eur.-11th-edition (accessed on 20 July 2024).
- Dias, M.I.; Barros, L.; Dueñas, M.; Pereira, E.; Carvalho, A.M.; Alves, R.C.; Oliveira, M.B.P.P.; Santos-Buelga, C.; Ferreira, I.C.F.R. Chemical composition of wild and commercial Achillea millefolium L. and bioactivity of the methanolic extract, infusion and decoction. Food Chem. 2013, 141, 4152–4160. [Google Scholar] [CrossRef]
- Salomon, L.; Lorenz, P.; Bunse, M.; Spring, O.; Stintzing, F.; Kammerer, D. Comparison of the phenolic compound profile and antioxidant potential of Achillea atrata L. and Achillea millefolium L. Molecules 2021, 26, 1530. [Google Scholar] [CrossRef]
- Edreva, A.; Vitkova, A.; Gesheva, E. Field-Cultivated plants from Achillea millefolium group: Total flavonoid content, antiradical and antioxidant activities in stems and leaves, and ratio of plant parts. Plant Physiol. 2019, 9, 3–10. [Google Scholar]
- Farhadi, N.; Babaei, K.; Farsaraei, S.; Moghaddam, M.; Pirbalouti, A.G. Changes in essential oil compositions, total phenol, flavonoids and antioxidant capacity of Achillea millefolium at different growth stages. Ind. Crops Prod. 2020, 152, 112570. [Google Scholar] [CrossRef]
- Grigore, A.; Colceru-Mihul, S.; Bazdoaca, C.; Yuksel, R.; Ionita, C.; Glava, L. Antimicrobial activity of an Achillea millefolium L. Proceedings 2020, 57, 34. [Google Scholar] [CrossRef]
- Khan, A.U.; Gilani, A.H. Blood pressure lowering, cardiovascular inhibitory and bronchodilatory actions of Achillea millefolium. Phytother Res. 2011, 25, 577–583. [Google Scholar] [CrossRef]
- Castro, M.M.; Demarco, D. Phenolic compounds produced by secretory structures in plants: A brief review. Nat. Prod. Commun. 2008, 2, 1273–1284. [Google Scholar] [CrossRef]
- Yoshitama, K. Recent advances in secondary metabolism research: Regulation of biosynthesis and physiological functions of flavonoids and some phenolics. J. Plant Res. 2000, 113, 285. [Google Scholar] [CrossRef]
- Laoué, J.; Fernandez, C.; Ormeño, E. Plant flavonoids in mediterranean species: A focus on flavonols as protective metabolites under climate stress. Plants 2022, 11, 172. [Google Scholar] [CrossRef] [PubMed]
- Taiz, L.; Zeiger, E. Plant Physiology, 3rd ed.; Sinauer Associates Inc. Publishers: Sunderland, MA, USA, 2002. [Google Scholar]
- Zhan, X.; Chen, Z.; Chen, R.; Shen, C. Environmental and genetic factors involved in plant protection-associated secondary metabolite biosynthesis pathways. Front. Plant Sci. 2022, 13, 877304. [Google Scholar] [CrossRef] [PubMed]
- Alami, M.M.; Guo, S.; Mei, Z.; Yang, G.; Wang, X. Environmental factors on secondary metabolism in medicinal plants: Exploring acelerating factors. Med. Plant Biol. 2024, 3, e016. [Google Scholar] [CrossRef]
- Mekinić, I.; Skroza, D.; Ljubenkov, I.; Krstulović, L.; Smole Možina, S.; Katalinić, V. Phenolic acids profile, antioxidant and antibacterial activity of chamomile, common yarrow and immortelle (Asteraceae). Nat. Prod. Commun. 2014, 9, 1745–1748. [Google Scholar] [CrossRef]
- Mekinić, I.; Burčul, F.; Blažević, I.; Skroza, D.; Kerum, D.; Katalinić, V. Antioxidative / acetylcholinesterase inhibitory activity of some Asteraceae plants. Nat. Prod. Commun. 2013, 8, 471–474. [Google Scholar] [CrossRef]
- Valyova, M.S.; Dimitrova, M.A.; Ganeva, Y.A.; Kapchina-Toteva, V.M.; Yordanova, Z.P. Evaluation of antioxidant and free radical scavenging potential of Lamium album L. growing in Bulgaria. J. Pharm. Res. 2011, 4, 945–947. [Google Scholar]
- Oluwole, O.; Fernando, W.B.; Lumanlan, J.; Ademuyiwa, O.; Jayasena, V. Role of phenolic acid, tannins, stilbenes, lignans and flavonoids in human health—A review. Int. J. Food Sci. Technol. 2022, 57, 6326–6335. [Google Scholar] [CrossRef]
- Dmitruk, M.; Sulborska, A.; Żuraw, B.; Stawiarz, E.; Weryszko-Chmielewska, E. Sites of secretion of bioactive compounds in leaves of Dracocephalum moldavica L.: Anatomical histochemical, and essential oil study. Rev. Bras. Bot. 2019, 42, 701–715. [Google Scholar] [CrossRef]
- Sulborska, A.; Konarska, A.; Matysik-Woźniak, A.; Dmitruk, M.; Weryszko-Chmielewska, E.; Skalska-Kamińska, A.; Rejdak, R. Phenolic constituents of Lamium album L. subsp. album flowers: Anatomical, histochemical, and phytochemical study. Molecules 2020, 25, 6025. [Google Scholar] [CrossRef]
- El Babili, F.; Rey-Rigaud, G.; Rozon, H.; Halova-Lajoie, B. State of knowledge: Histolocalisation in phytochemical study of medicinal plants. Fitoterapia 2021, 150, 104862. [Google Scholar] [CrossRef]
- Sun, S.; Shen, X.; Li, Y.; Li, Y.; Wang, S.; Li, R.; Zhang, H.; Shen, G.; Guo, B.; Wei, J.; et al. Single-cell RNA sequencing provides a high-resolution roadmap for understanding the multicellular compartmentation of specialized metabolism. Nat. Plants 2023, 9, 179–190. [Google Scholar] [CrossRef] [PubMed]
- de Oliveira, R.C.; Vasconcelos Filho, S.C.; Bastos, A.V.S.; Vasconcelos, J.M.; Rodrigues, A.A. Anatomical and histochemical analysis of vegetative organs of Vernonia ferruginea Less. (Asteraceae). Afr. J. Biotechnol. 2015, 14, 2734–2739. [Google Scholar] [CrossRef]
- Souza, D.M.F.; Sá, R.D.; Araújo, E.L.; Randau, K.P. Anatomical, phytochemical and histochemical study of Solidago chilensis Meyen. An. Da Acad. Bras. De Ciências 2018, 90 (Suppl. S1), 2107–2120. [Google Scholar] [CrossRef]
- Almeida, V.P.; Heiden, G.; Raman, V.; Novatski, A.; Bussade, J.E.; Farago, P.V.; Manfron, J. Microscopy and histochemistry of leaves and stems of Baccharis subgenus Coridifoliae (Asteraceae) through LM and SEM-EDS. Microsc. Microanal. 2021, 27, 1273–1289. [Google Scholar] [CrossRef]
- Demétrio, A.M.; Rodrigues, A.V.; de Athayde, A.E.; Biavatti, M.W.; Oliveira, F.M.C.; Garcia, F.L.; Lusa, M.G. Structural, histochemical, and phytochemical characterization of Mikania cordifolia (L. f.) Willd. (Asteraceae) in a coastal dune environment. Flora 2023, 305, 152318. [Google Scholar] [CrossRef]
- Elshorbagy, A.M.; El-Banna, M.F.; Fayed, M.A.A.; Sallam, A.; Badria, F.A. Phytochemical, anatomical, and histochemical investigation of Felicia abyssinica: A chemical analysis of tissues in relation to their structural organization. J. Adv. Med. Pharm. Res. 2024, 5, 15–21. [Google Scholar] [CrossRef]
- Dorly, D.; Wiryo, B.A.; Nurfaizah, I.; Nidyasari, R.S. Secretory structure and histochemistry tests of Asteraceae family members of medicinal plants in Walat Mountain Educational Forest. Proceeding Biol. Educ. Conf. Biol. Sci. Enviromental Learn. 2015, 12, 667–673. [Google Scholar]
- Muravnik, L.E.; Kostina, O.V.; Mosina, A.A. Morphology, histochemistry and ultrastructure of the floral glandular trichomes in three Doronicum species (Asteraceae). Protoplasma 2025, 1–22. [Google Scholar] [CrossRef] [PubMed]
- Bottoni, M.; Baron, G.; Gado, F.; Milani, F.; Santagostini, L.; Colombo, L.; Colombo, P.S.; Caporali, E.; Spada, A.; Biagi, M.; et al. Achillea moschata Wulfen: From ethnobotany to phytochemistry, morphology, and biological activity. Molecules 2022, 27, 8318. [Google Scholar] [CrossRef]
- Asadullaeva, Z.M.; Ishmuratova, M.Y.; Atazhanova, G.A.; Smagulov, M.K. The macroscopic, microscopic and histochemical analyses of aerial parts of Achillea salicifolia growing in the Republic of Kazakhstan. Res. J. Pharm. Technol. 2024, 17, 5463–5468. [Google Scholar] [CrossRef]
- Štrbac, F.; Bosco, A.; Amadesi, A.; Rinaldi, L.; Stojanović, D.; Simin, N.; Orčić, D.; Pušić, I.; Krnjajić, S.; Ratajac, R. In vitro ovicidal activity of two chemotypes of the yarrow (Achillea millefolium L.) essential oil against ovine gastrointestinal nematode eggs. Arhiv Vet. Med. 2020, 13, 59–76. [Google Scholar] [CrossRef]
- Radušiene, J.; Karpavičiene, B.; Raudone, L.; Vilkickyte, G.; Çırak, C.; Seyis, F.; Yayla, F.; Marksa, M.; Rimkiene, L.; Ivanauskas, L. Trends in phenolic profiles of Achillea millefolium from different geographical gradients. Plants 2023, 12, 746. [Google Scholar] [CrossRef] [PubMed]
- Apel, L.; Lorenz, P.; Urban, S.; Sauer, S.; Spring, O.; Stintzing, F.C.; Kammerer, D.R. Phytochemical characterization of different yarrow species (Achillea sp.) and investigations into their antimicrobial activity. Z. Naturforsch. 2021, 76, 55–65. [Google Scholar] [CrossRef] [PubMed]
- Pagni, A.M.; Orlando, R.; Masini, A.; Ciccarelli, D. Secretory structures of Santolina ligustica Arrigoni (Asteraceae), an Italian endemic species. Isr. J. Plant Sci. 2003, 51, 185–192. [Google Scholar] [CrossRef]
- Haratym, W.; Weryszko-Chmielewska, E.; Konarska, A. Microstructural and histochemical analysis of aboveground organs of Centaurea cyanus used in herbal medicine. Protoplasma 2020, 257, 285–298. [Google Scholar] [CrossRef]
- Karabourniotis, G.; Liakopoulos, G. Phenolic compounds in plant cuticles: Physiological and ecological aspects. Adv. Plant Phys. 2005, 8, 33–47. [Google Scholar]
- Karabourniotis, G.; Liakopoulos, G.; Nikolopoulos, D.; Bresta, P.; Stavroulaki, V.; Sumbele, S. Carbon gain vs. water saving, growth vs. defence: Two dilemmas with soluble phenolics as a joker. Plant Sci. 2014, 227, 21–27. [Google Scholar] [CrossRef]
- Ferreres, F.; Taveira, M.; Gil-Izquierdo, A.; Oliveira, L.; Teixeira, T.; Valentão, P.; Simões, N.; Andrade, P.B. High performance liquid chromatography diode array detection electrospray ionization multi-stage mass spectrometric screening of an insect/plant system: The case of Spodoptera littoralis/Lycopersicon esculentum phenolics and alkaloids. Rapid Commun. Mass Spectrom. 2011, 25, 1972–1980. [Google Scholar] [CrossRef]
- Gopfert, J.; Conrad, J.; Spring, O. 5-Deoxynevadensis, a novel flavone in sunflower and aspects of biosynthesis during trichome development. Nat. Prod. Commun. 2006, 1, 935–940. [Google Scholar] [CrossRef]
- Heinrich, G.; Pfeifhofer, H.; Stabentheiner, E.; Sawidis, T. Glandular hairs of Sigesbeckia jorullensis Kunth (Asteraceae): Morphology, histochemistry and composition of essential oil. Ann. Bot. 2002, 89, 459–469. [Google Scholar] [CrossRef]
- Feucht, W.; Dithmar, H.; Polster, J. Nuclei of tea flowers as targets for flavanols. Plant Biol. 2004, 6, 696–701. [Google Scholar] [CrossRef]
- Agati, G.; Brunetti, C.; Ferdinando, M.D.; Ferrini, F.; Pollastri, S.; Tattini, M. Functional roles of flavonoids in photoprotection: New evidence, lessons from the past. J. Plant Physiol. Biochem. 2013, 72, 35–45. [Google Scholar] [CrossRef]
- Georgieva, L.; Gadjalova, A.; Mihaylova, D.; Pavlov, A. Achillea millefolium L.—Phytochemical profile and in vitro antioxidant activity. Int. Food Res. J. 2015, 22, 1347–1352. [Google Scholar]
- Benetis, R.; Radušienė, J.; Janulis, V. Variability of phenolic compounds in flowers of Achillea millefolium wild populations in Lithuania. Medicina 2008, 44, 775–781. [Google Scholar] [CrossRef]
- Melillo de Magalhăes, P.; Dupont, I.; Hendrickx, A.; Joly, A.; Raas, T.; Dessy, S.; Sergent, T.; Schneider, Y.J. Anti-inflammatory effect and modulation of cytochrome P450 activities by Artemisia annua tea infusions in human intestinal Caco-2 cells. Food Chem. 2012, 134, 864–871. [Google Scholar] [CrossRef] [PubMed]
- Bonetti, A.; Faraloni, C.; Venturini, S.; Baini, G.; Miraldi, E.; Biagi, M. Characterization of phenolic profile and antioxidant activity of the leaves of the forgotten medicinal plant Balsamita major grown in Tuscany, Italy, during the growth cycle. Plant Biosyst. 2021, 155, 908–913. [Google Scholar] [CrossRef]
- Asghari, B.; Mafakheri, S.; Zengin, G.; Dinparast, L.; Bahadori, M.B. In-depth study of phytochemical composition, antioxidant activity, enzyme inhibitory and antiproliferative properties of Achillea filipendulina: A good candidate for designing biologically-active food products. J. Food Meas. Charact. 2020, 14, 2196–2208. [Google Scholar] [CrossRef]
- Benedec, D.; Vlase, L.; Oniga, I.; Mot, A.; Damian, G.; Hanganu, D.; Duma, M.; Silaghi-Dumitrescu, R. Polyphenolic composition, antioxidant and antibacterial activities for two Romanian subspecies of Achillea distans Waldst. et Kit. ex Willd. Molecules 2013, 18, 8725–8739. [Google Scholar] [CrossRef]
- Miyamae, Y.; Kurisu, M.; Han, J.; Isoda, H.; Shigemori, H. Structure activity relationship of caffeoylquinic acids on the accelerating activity on ATP production. Chem. Pharm. Bull. 2011, 59, 502–507. [Google Scholar] [CrossRef]
- Li, G.; Wang, X.; Xu, Y.; Zhang, B.; Xia, X. Antimicrobial effect and mode of action of chlorogenic acid on Staphylococcus aureus. Eur. Food Res. Technol. 2014, 238, 589–596. [Google Scholar] [CrossRef]
- Villalva, M.; Silvan, J.M.; Alarcón-Cavero, T.; Villanueva-Bermejo, D.; Jaime, L.; Santoyo, S.; Martinez-Rodriguez, A.J. Antioxidant, anti-inflammatory, and antibacterial properties of an Achillea millefolium L. extract and its fractions obtained by supercritical anti-solvent fractionation against Helicobacter pylori. Antioxidants 2022, 11, 1849. [Google Scholar] [CrossRef]
- Liu, W.; Li, J.; Zhang, X.; Zu, Y.; Yang, Y.; Li, W.; Xu, Z.; Gao, H.; Sun, X.; Jiang, X.; et al. Current advances in naturally occurring caffeoylquinic acids: Structure, bioactivity, and synthesis. J. Agric. Food Chem. 2020, 68, 10489–10516. [Google Scholar] [CrossRef] [PubMed]
- Zhao, Y.; Ren, Y.; Liu, Z.; Wang, Z.; Liu, Y. The metabolite profiling of 3,4-dicaffeoylquinic acid in Sprague–Dawley rats using ultra-high performance liquid chromatography equipped with linear ion trap-Orbitrap MS. Biomed. Chromatogr. 2022, 36, 5276. [Google Scholar] [CrossRef]
- Ali, S.I.; Gopalakrishnan, B.; Venkatesalu, V. Pharmacognosy, phytochemistry and pharmacological properties of Achillea millefolium L.: A Review. Phytother. Res. 2017, 31, 1140–1161. [Google Scholar] [CrossRef] [PubMed]
- Baker, J.R. Cytological Technique, 5th ed.; Methven: London, UK, 1966. [Google Scholar]
- Gutmann, M. Improved staining procedures for photographic documentation of phenolic deposits in semithin sections of plant tissue. J. Microsc. 1995, 179, 277–281. [Google Scholar] [CrossRef]
- Gahan, P.B. Plant Histochemistry and Cytochemistry; Academic Press: London, UK, 1984. [Google Scholar]
- Gabe, M. Techniques Histologiques; Masson: Paris, France, 1968. [Google Scholar]
- Ruzin, S.E. Plant Microtechnique and Microscopy; Oxford University Press: New York, NY, USA, 1999. [Google Scholar]
- Charriáère-Ladreix, Y. Rèpartition intracellulaire du secrétat flavonique de Populus nigra L. Planta 1976, 29, 167–174. [Google Scholar] [CrossRef]
- Mujic, I.; Šertovic, E.; Jokic, S.; Saric, Z.; Alibabic, V.; Vidovic, S.; Živkovic, J. Isoflavone content and antioxidant properties of soybean seeds. Croat. J. Food Sci. Technol. 2011, 3, 16–20. Available online: https://api.semanticscholar.org/CorpusID:27857715 (accessed on 28 December 2024).
- Chang, C.C.; Yang, M.H.; Wen, H.M.; Chern, J.C. Estimation of total flavonoid content in propolis by two complementary colorimetric methods. J. Food Drug Anal. 2002, 10, 178–182. [Google Scholar]


| Analyzed Parameters | Herb | Flower |
|---|---|---|
| Total phenolic content (mg gallic acid/g) | 194.59 b* ± 3.36 | 230.89 a ± 3.36 |
| Flavonoid content (mg quercetin/g) | 9.30 b ± 0.23 | 11.13 a ± 0.55 |
| Major phenolic compounds (HPLC) (mg/g): | ||
| 5.992 b ± 0.042 | 7.612 a ± 0.015 |
| 0.045 b ± 0.001 | 0.087 a ± 0.001 |
| 0.029 b ± 0.001 | 0.355 a ± 0.003 |
| 0.555 a ± 0.001 | 0.472 b ± 0.001 |
| 5.631 a ± 0.005 | 1.693 b ± 0.031 |
| 0.460 b ± 0.001 | 0.841 a ± 0.002 |
| 0.179 b ± 0.001 | 0.039 a ± 0.001 |
| 0.375 a ± 0.002 | 0.443 a ± 0.001 |
| 1.530 b ± 0.004 | 12.602 a ± 0.012 |
| 6.871 b ± 0.005 | 15.778 a ± 0.031 |
| 0.014 b ± 0.001 | 0.959 a ± 0.005 |
| 0.768 b ± 0.001 | 9.939 a ± 0.025 |
| Total | 22.45 | 50.82 |
Disclaimer/Publisher’s Note: The statements, opinions and data contained in all publications are solely those of the individual author(s) and contributor(s) and not of MDPI and/or the editor(s). MDPI and/or the editor(s) disclaim responsibility for any injury to people or property resulting from any ideas, methods, instructions or products referred to in the content. |
© 2025 by the authors. Licensee MDPI, Basel, Switzerland. This article is an open access article distributed under the terms and conditions of the Creative Commons Attribution (CC BY) license (https://creativecommons.org/licenses/by/4.0/).
Share and Cite
Konarska, A.; Weryszko-Chmielewska, E.; Materska, M.; Sulborska-Różycka, A.; Dmitruk, M.; Chilczuk, B. Phenolic Compounds in Flowers and Herb of Achillea millefolium L.: Histochemical and Phytochemical Studies. Molecules 2025, 30, 2084. https://doi.org/10.3390/molecules30092084
Konarska A, Weryszko-Chmielewska E, Materska M, Sulborska-Różycka A, Dmitruk M, Chilczuk B. Phenolic Compounds in Flowers and Herb of Achillea millefolium L.: Histochemical and Phytochemical Studies. Molecules. 2025; 30(9):2084. https://doi.org/10.3390/molecules30092084
Chicago/Turabian StyleKonarska, Agata, Elżbieta Weryszko-Chmielewska, Małgorzata Materska, Aneta Sulborska-Różycka, Marta Dmitruk, and Barbara Chilczuk. 2025. "Phenolic Compounds in Flowers and Herb of Achillea millefolium L.: Histochemical and Phytochemical Studies" Molecules 30, no. 9: 2084. https://doi.org/10.3390/molecules30092084
APA StyleKonarska, A., Weryszko-Chmielewska, E., Materska, M., Sulborska-Różycka, A., Dmitruk, M., & Chilczuk, B. (2025). Phenolic Compounds in Flowers and Herb of Achillea millefolium L.: Histochemical and Phytochemical Studies. Molecules, 30(9), 2084. https://doi.org/10.3390/molecules30092084