2.1. Analysis of BGAP Rheological Properties
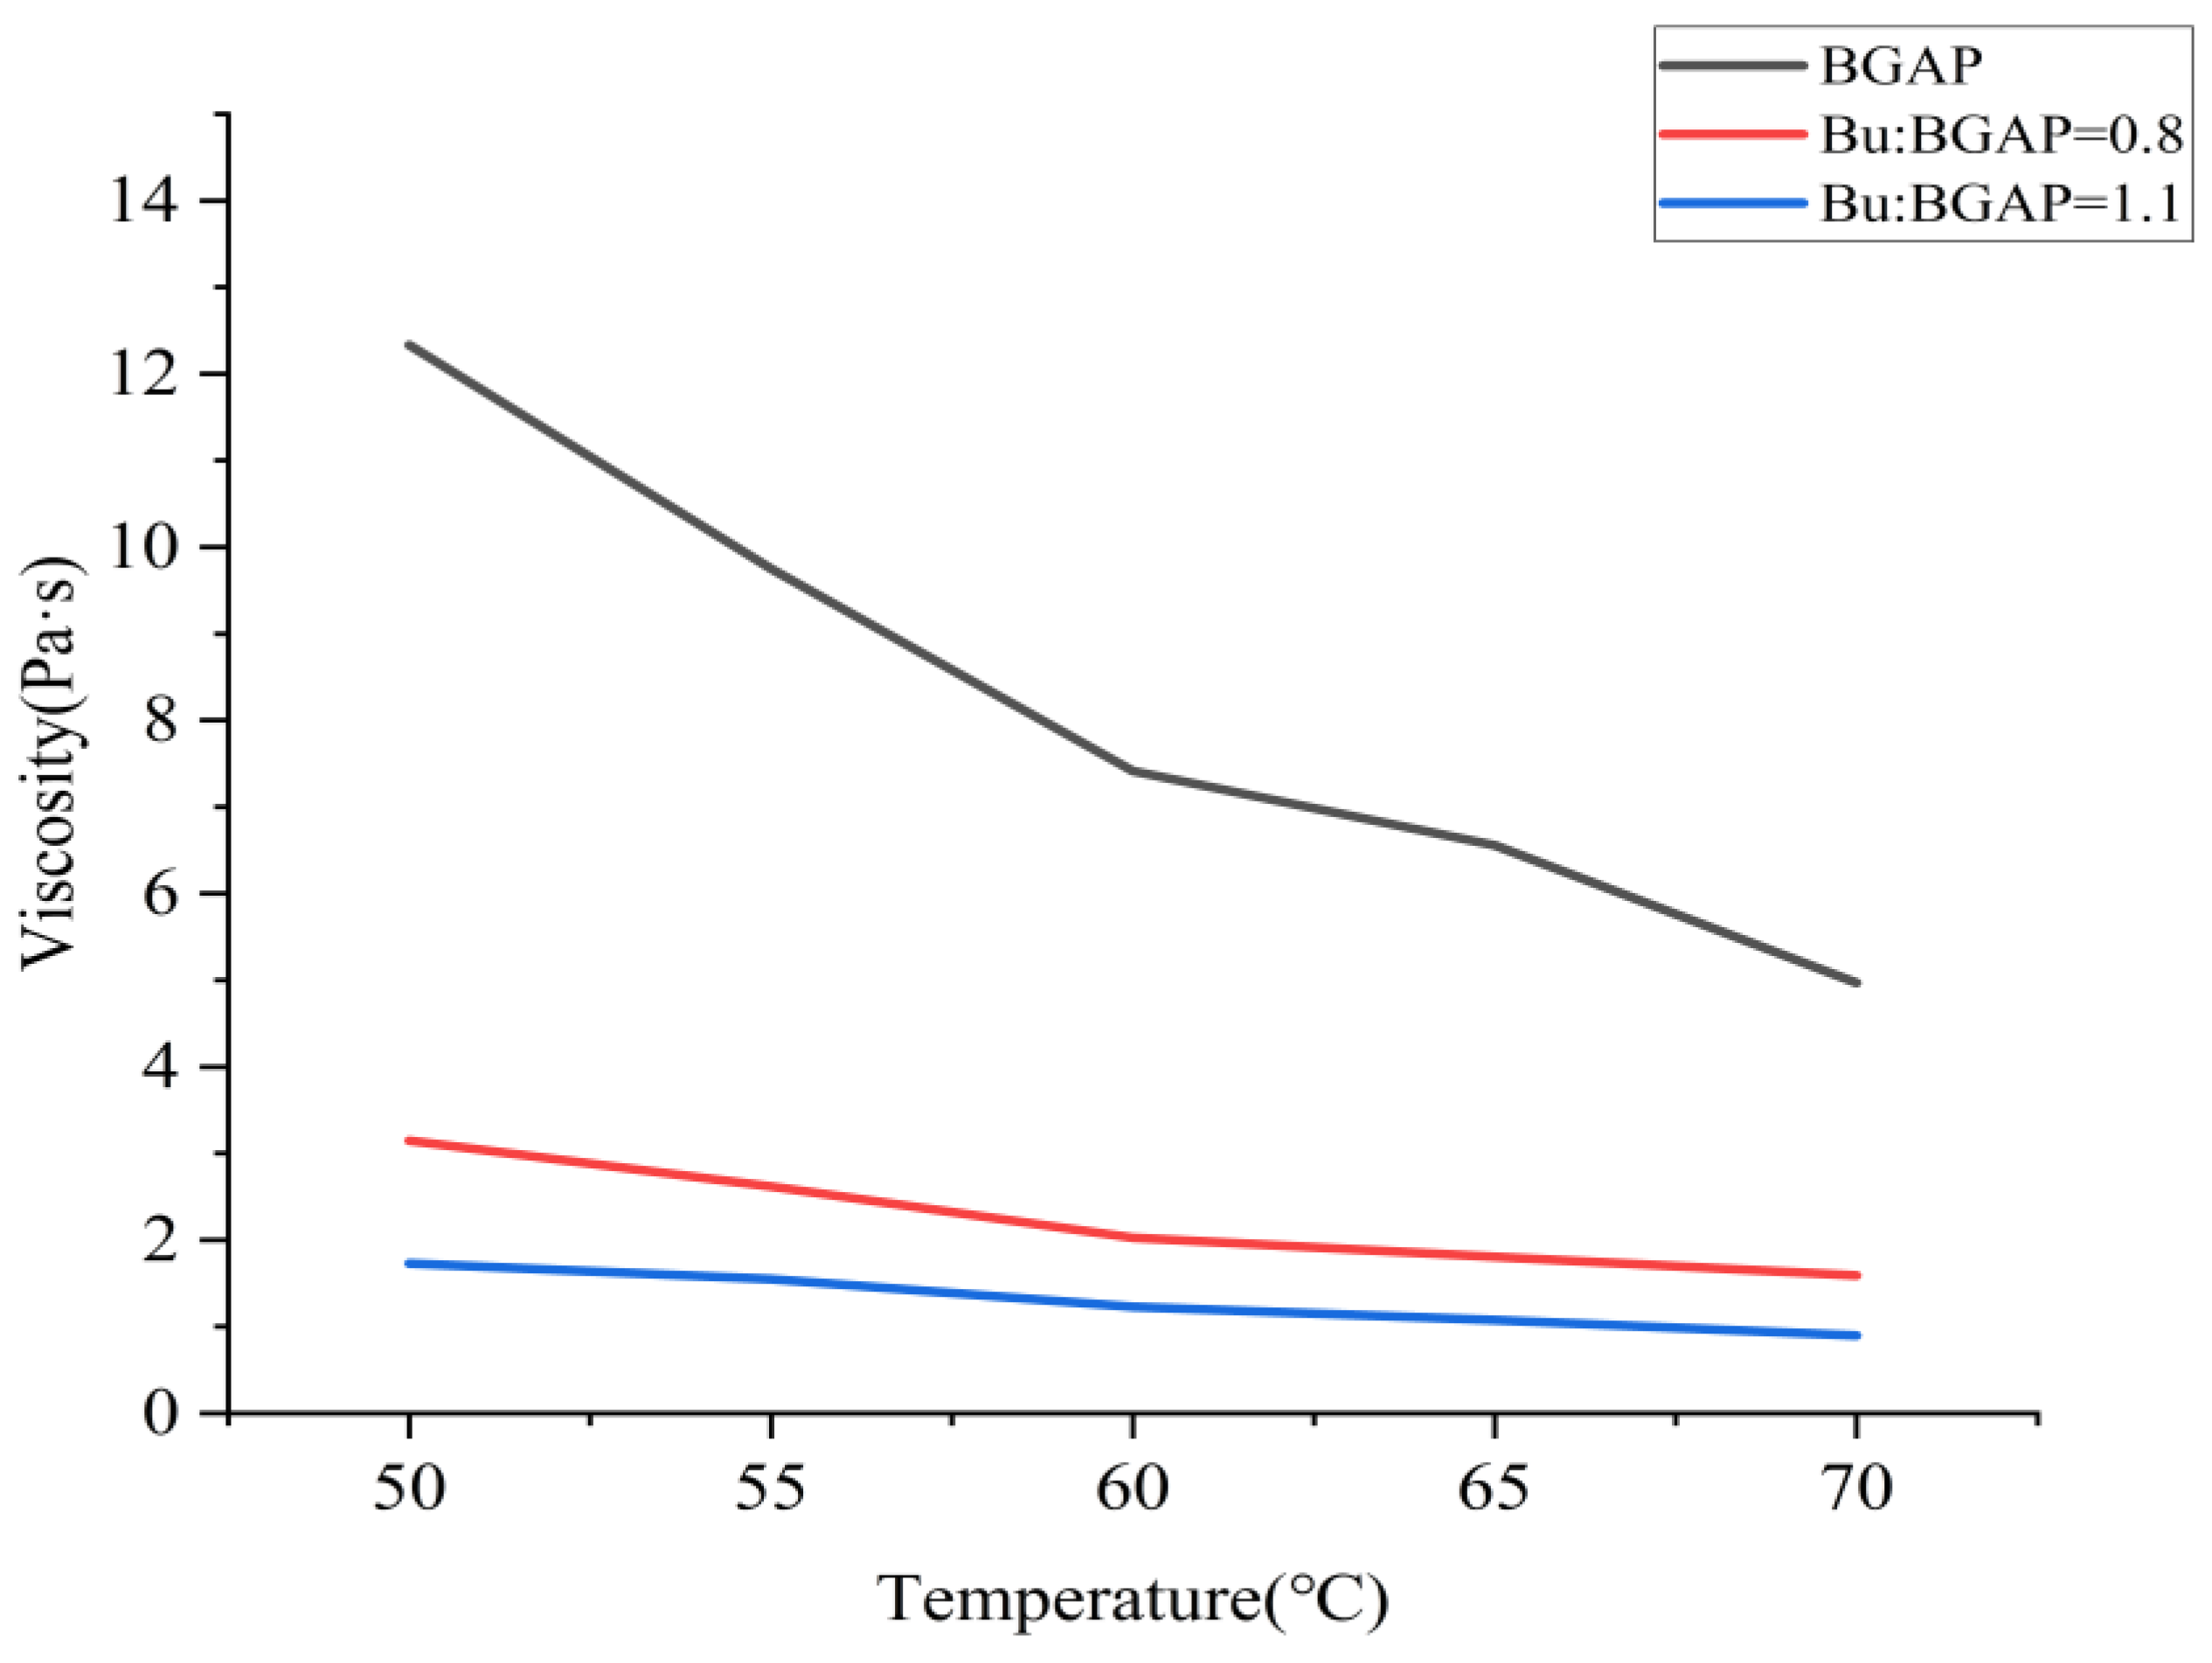
The apparent viscosity-temperature curve at a shear rate of 500 s
−1 after adding BGAP and Bu as a plasticizer is shown in
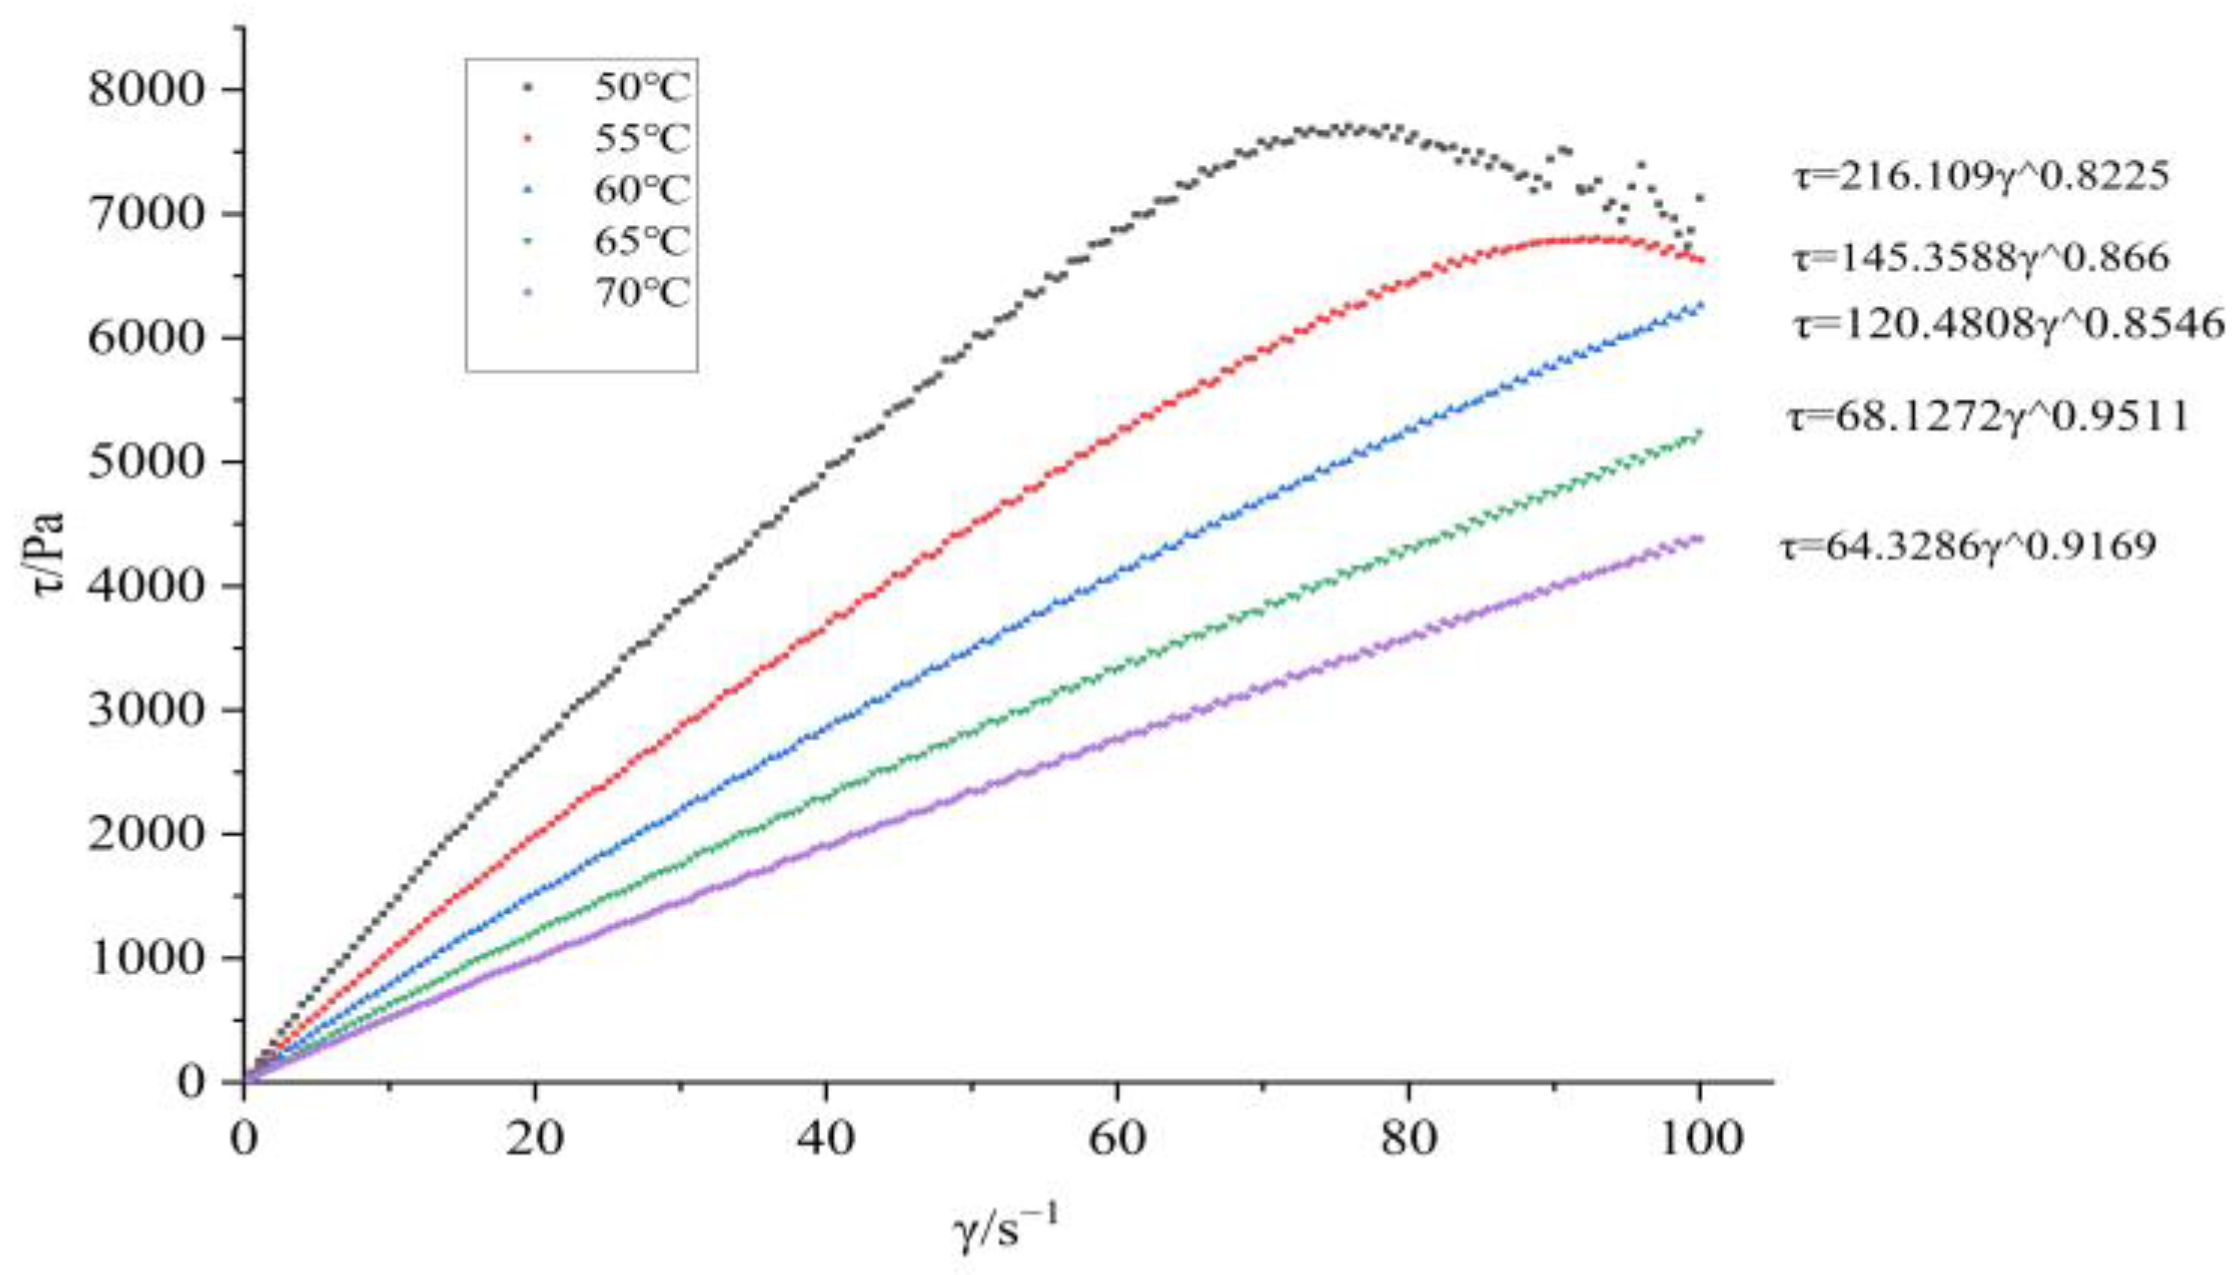
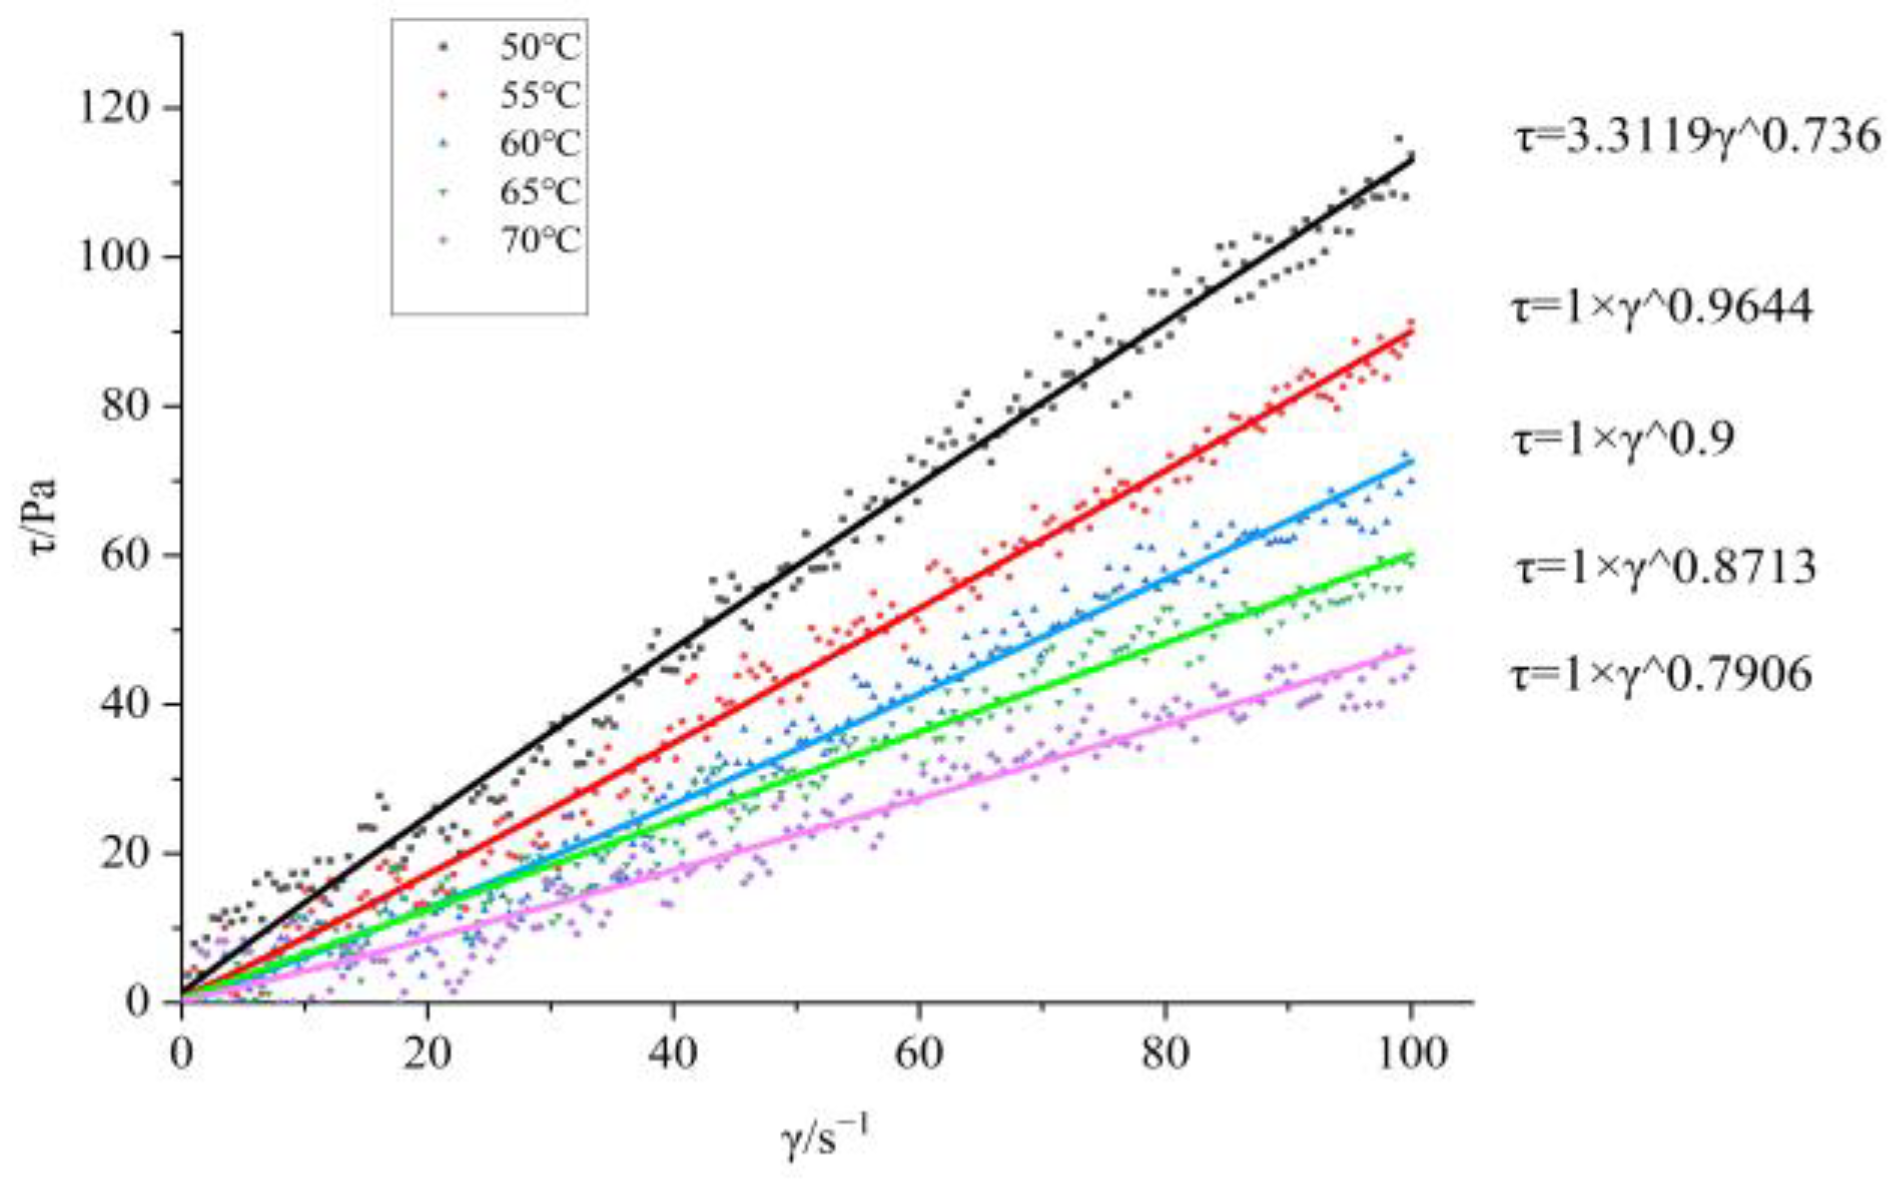
Figure 1; The shear force shear rate curves at different temperatures are shown in
Figure 2 and
Figure 3.
From
Figure 2, it can be seen that the plasticizer Bu can significantly improve the flowability of BGAP. The larger the plasticization ratio, the better its flowability. Therefore, in practical production, adding Bu frequently to BGAP can not only improve its mechanical properties but also enhance its processability [
23]. According to the change in apparent viscosity, the activation energy of viscous flow can also be obtained at different plasticization ratios.
From
Figure 2 and
Figure 3, it can be seen that BGAP belongs to a pseudoplastic fluid before and after adding plasticizers. The relationship between apparent viscosity, shear rate, and temperature can be described using power-law equations (Equation (1)) and Arrhenius equations (Equation (2)) [
24]:
In the formula, τ is the shear force, Pa; K is the viscosity coefficient, with units varying with the exponent n; γ is the shear rate, s−1; n is a non-Newtonian index, dimensionless; η is the Apparent viscosity, Pa·s; A is the pre-exponential factor, s−1; Eη is the activation energy of viscous flow, kJ·mol−1; R is the gas constant, 8.314 J·mol−1·K−1; T is the testing temperature, K.
The flow equations of the adhesive at different temperatures can be obtained from Equation (1), as shown in
Table 1 and
Table 2.
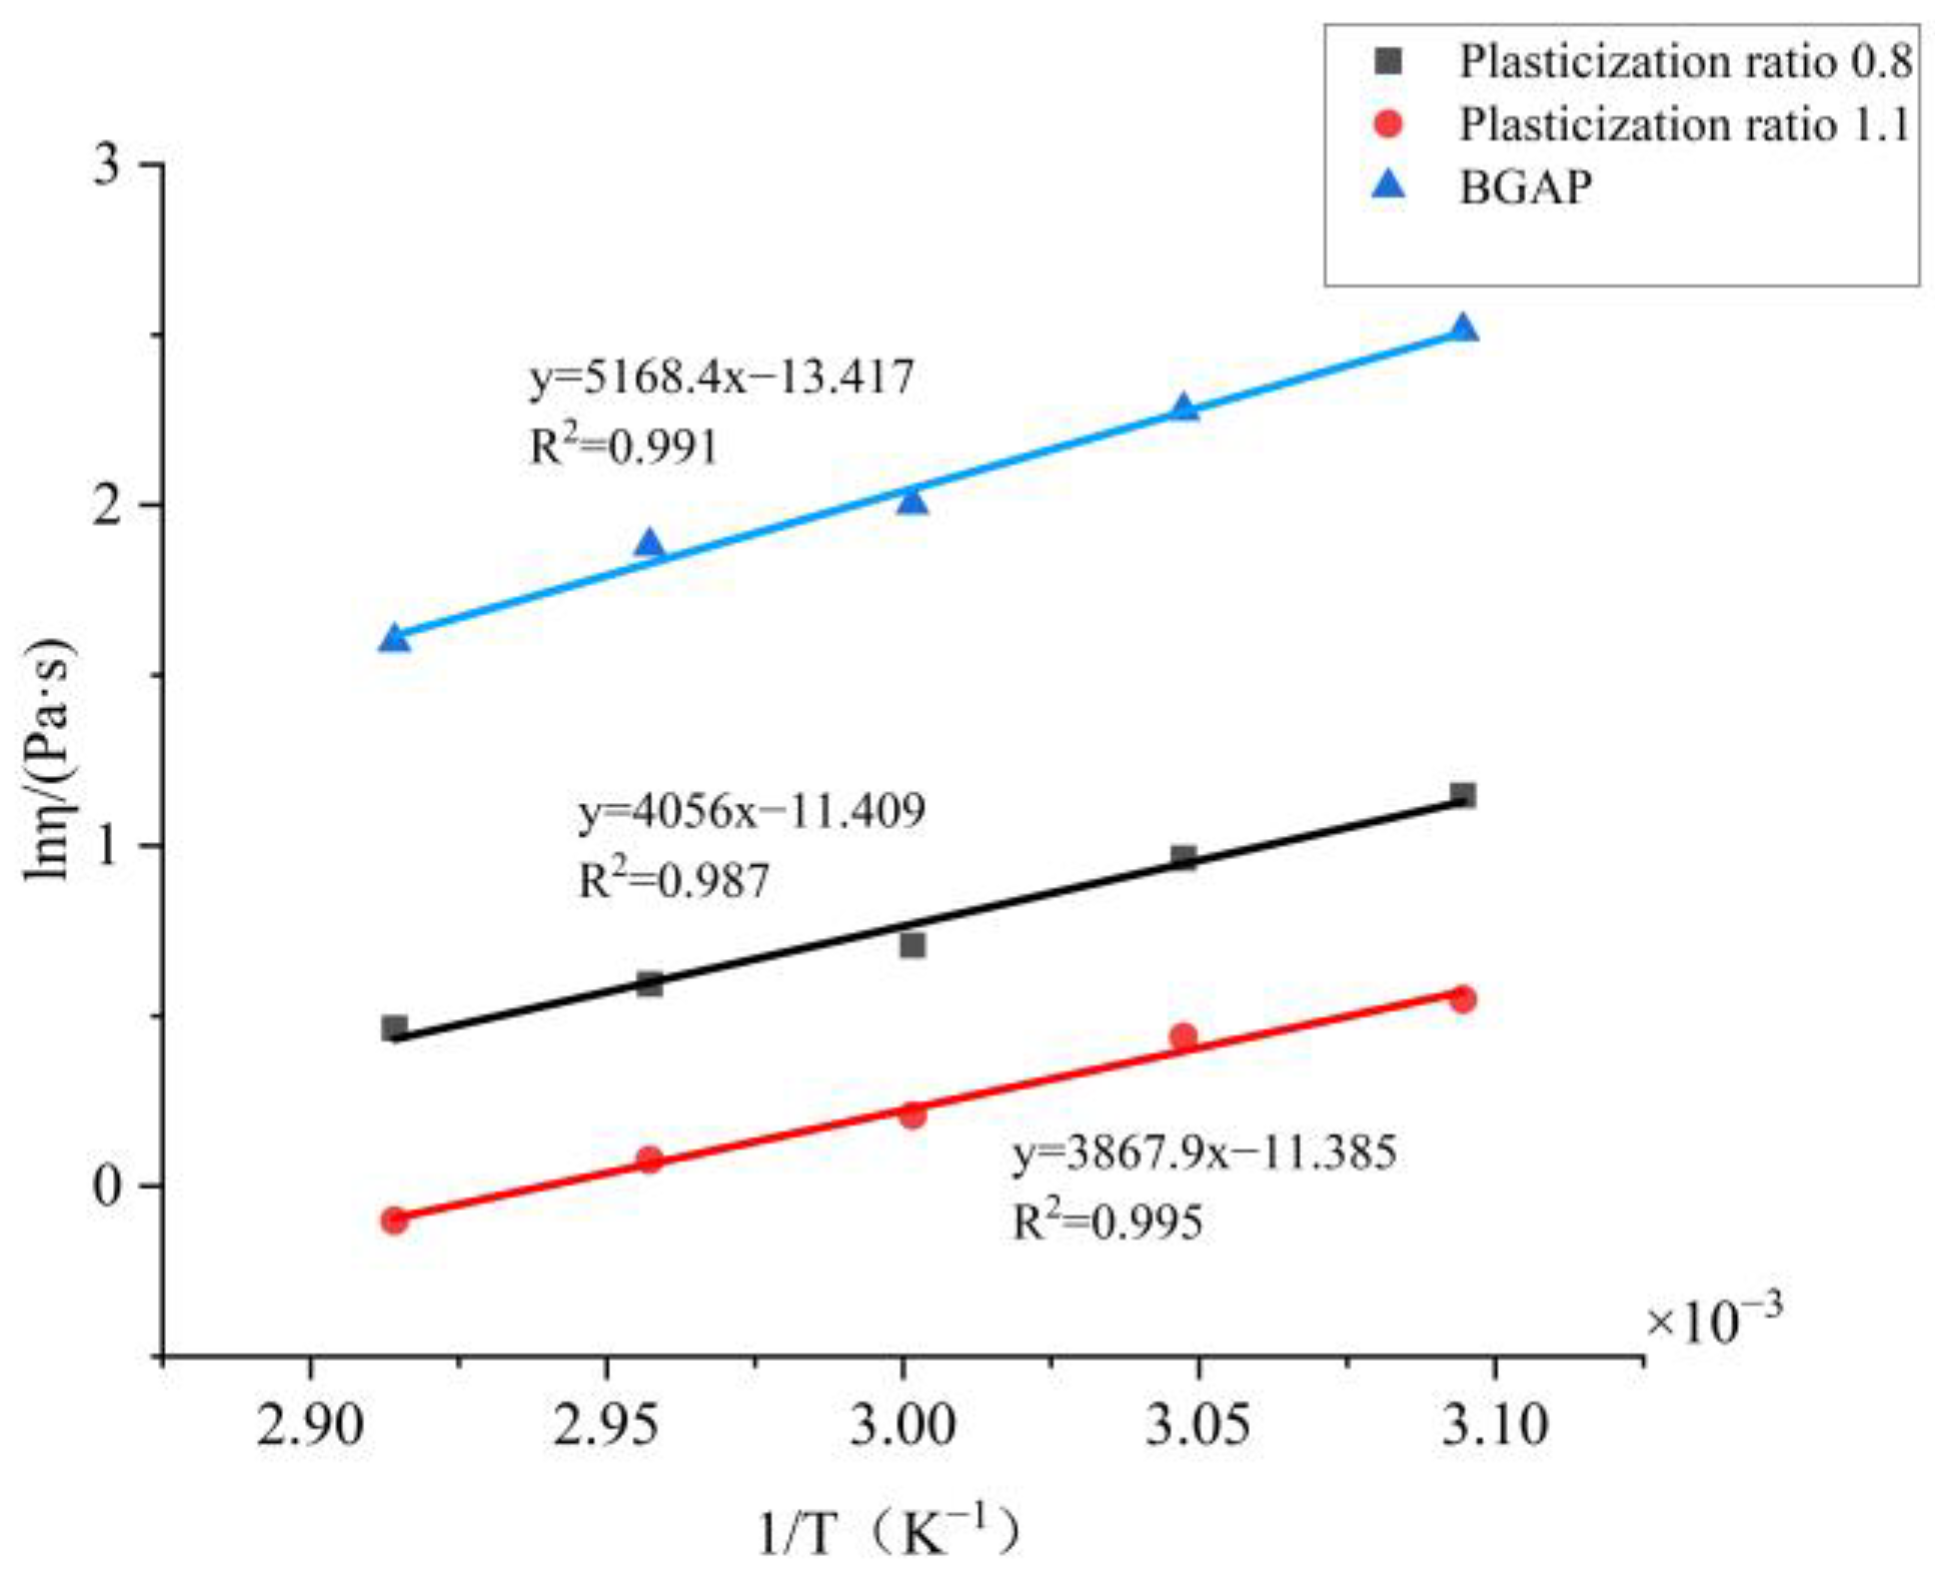
By taking the logarithm of Equation (2), we can obtain:
Based on this formula, plot BGAP and mixed solutions with plasticization ratios of 0.8 and 1.1 using ln η as the vertical axis and 1/T as the
x-axis like
Figure 4:
Based on the slope, the viscous flow activation energy E
η of each solution can be calculated as shown in
Table 3:
The viscous flow activation energy represents the minimum energy required for a BGAP solution segment to overcome a potential barrier and transition from its original position to a nearby “hole”. It reflects both the difficulty of material flow and the temperature sensitivity of the material’s apparent viscosity changes [
25]. After adding plasticizers, the solution flows more easily. According to the flow equation, it can be inferred from the viscosity coefficient K and non-Newtonian index n that the Apparent viscosity of BGAP is greatly affected by temperature, and the K value decreases significantly with increasing temperature. When Bu is added as a plasticizer, and the plasticization ratio is 1.1, the K value remains unchanged after the temperature exceeds 55 °C. Adding a plasticizer can improve the rheological properties of the adhesive, while the Apparent viscosity is more affected by temperature. According to the “lubrication theory”, plasticizers reduce the “friction” between polymers, so when the temperature increases and the molecular chain moves more vigorously, the “obstacles” to the free movement of the molecular chain are smaller.
2.2. Rheological Properties During the Solidification Process
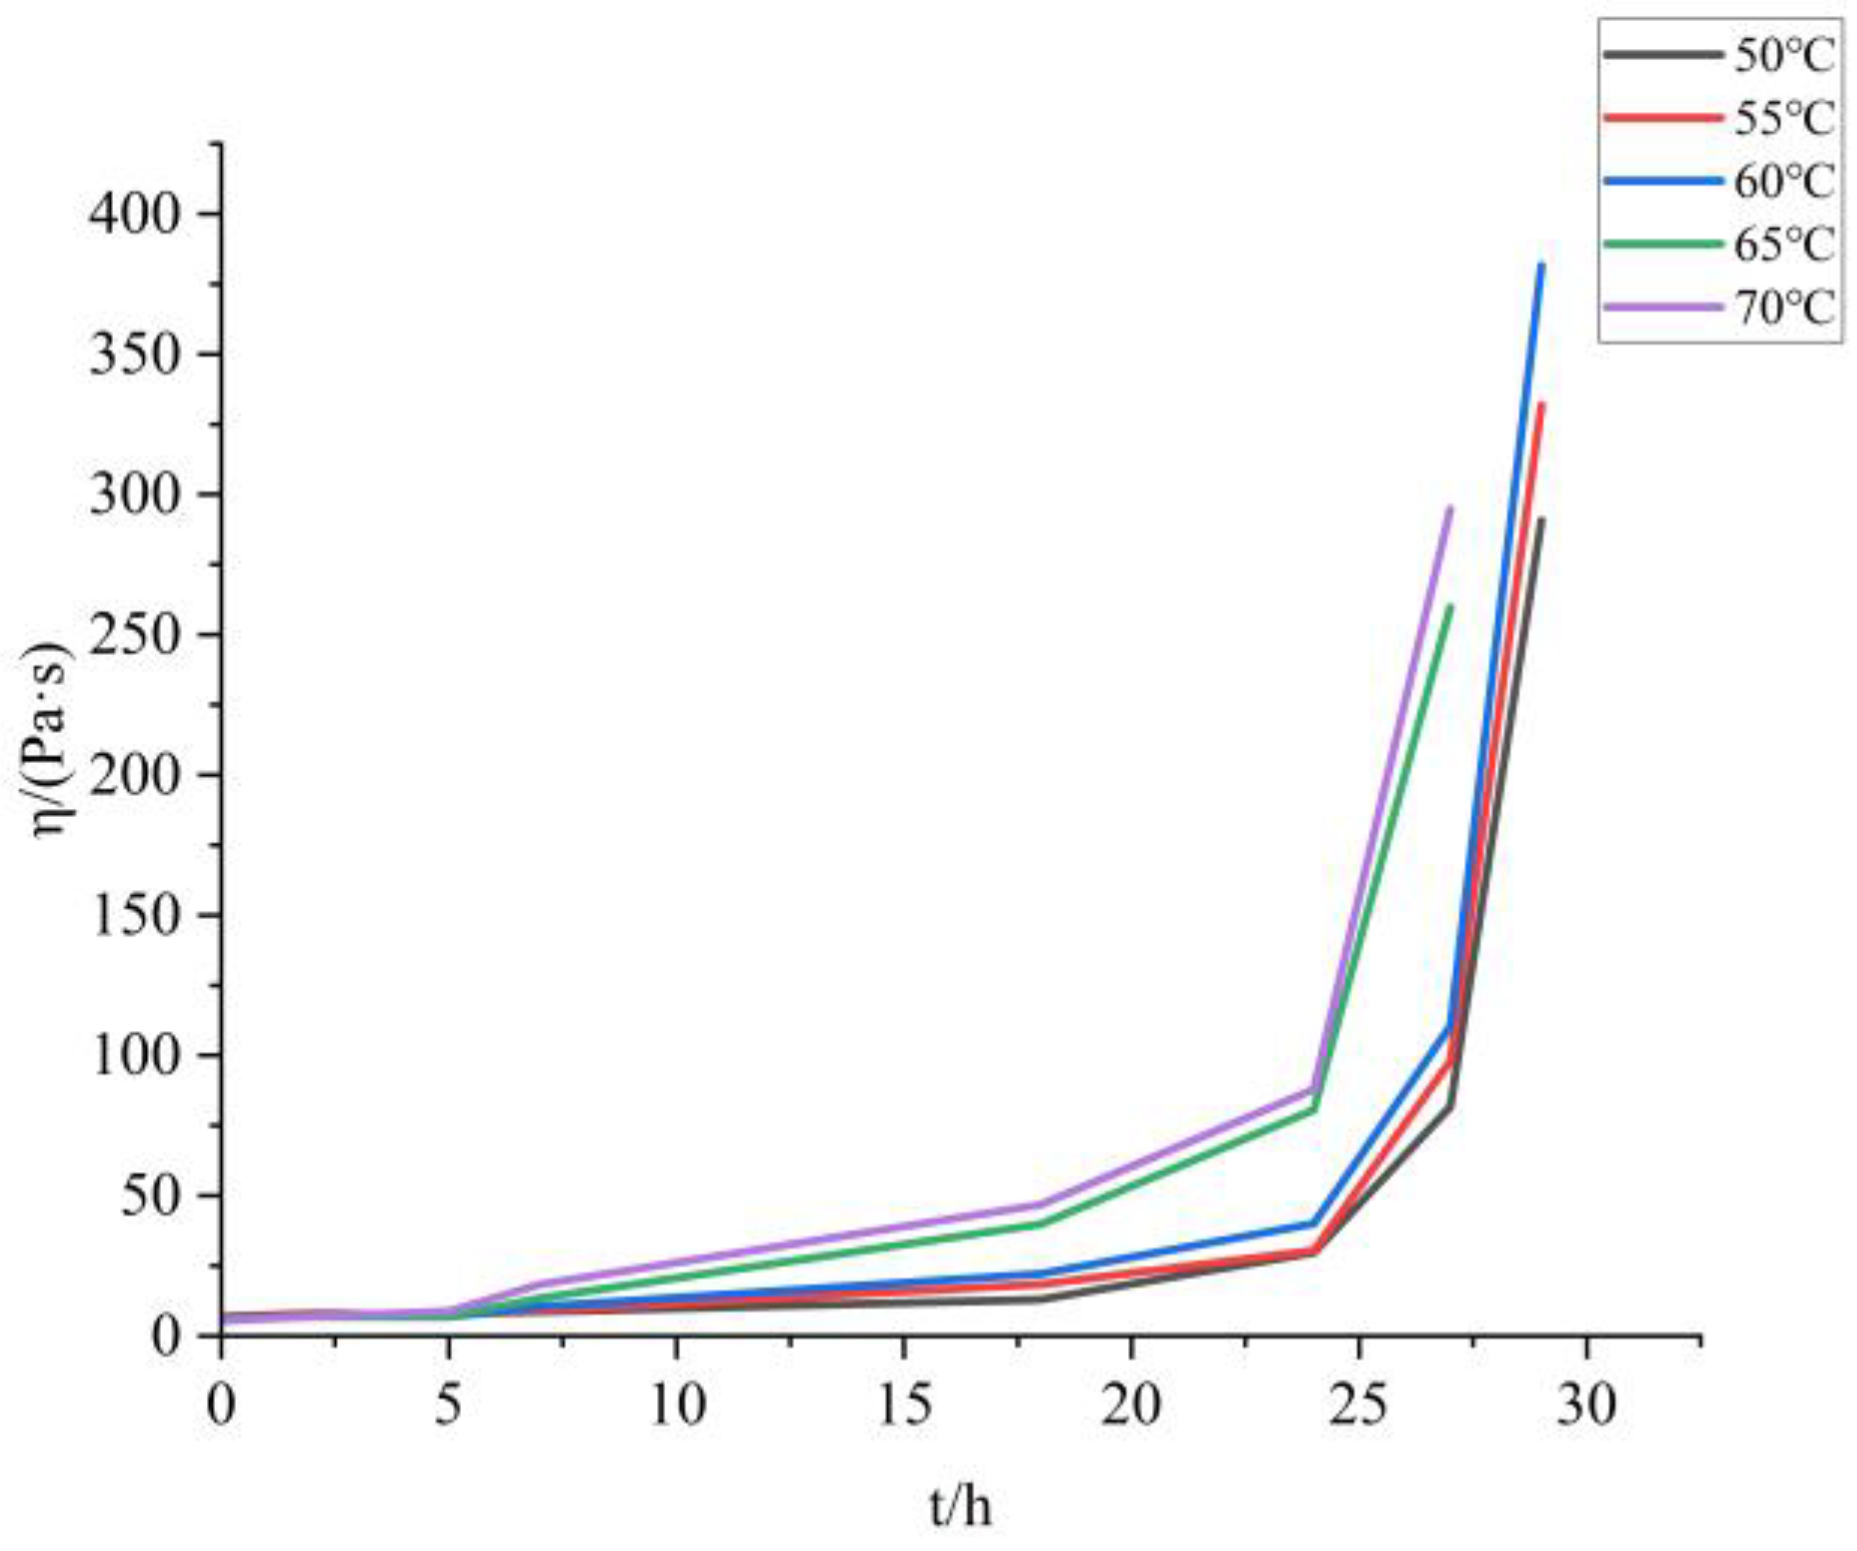
The apparent viscosity time curves of the samples with TDI and HDI added at different temperatures are shown in
Figure 5:
The apparent viscosity of BAP adhesive (molecular structure shown in
Figure 6) changes slowly in the early stage and even decreases with the progress of the curing reaction in the first 2 h. However, when the curing time exceeds a certain threshold, the apparent viscosity of the adhesive begins to rise sharply. This is because the reaction between hydroxyl -OH and isocyanate -NCO is a polyaddition reaction (as shown in
Figure 7), which belongs to a stepwise polymerization mechanism [
26]. They first form amino esters separately and then aggregate together to form macromolecules (as shown in
Figure 8), similar to a condensation reaction, rather than growing from a single polymer to a high polymer, like free radical polymerization. Therefore, initially, the polymerization of each molecule did not form a cross-linked network. As the degree of reaction increased, the molecules polymerized together to form a network, resulting in a sharp increase in apparent viscosity.
Within the temperature range selected for this experiment, the temperature has two effects on the apparent viscosity of the system: on the one hand, the higher the temperature, the faster the curing reaction; On the other hand, the higher the temperature, the lower the apparent viscosity of the pseudoplastic fluid. Due to the fact that both the adhesive curing system and the propellant slurry curing process belong to pseudoplastic fluids, the same chemical rheological method can be used to calculate the curing reaction kinetics. The comprehensive effects of curing reaction and temperature can be expressed by the following equation:
In Equation (4), η0 represents the apparent viscosity of the slurry during discharge; k is the reaction rate constant, which conforms to the Arrhenius equation.
In Equations (5) and (6), η∞ is the lowest apparent viscosity of the slurry when the curing degree is zero, and the temperature tends to infinity; Eη is the viscous flow activation energy of the solidification system; k∞ is the pre-exponential factor; Ek is the activation energy of the curing reaction; R is the gas constant; T is the testing temperature.
By substituting Equations (5) and (6) into Equation (4), the equation for the change of apparent viscosity of the drug slurry with time and temperature can be obtained [
27]:
Taking the logarithm of Equation (7) yields the double Arrhenius formula:
That is, a linear fitting can be performed on the apparent viscosity time curve to determine the curing reaction kinetics. Due to the sharp increase in apparent viscosity during the later stage of curing, it is difficult to accurately measure the apparent viscosity. Therefore, the first five points were selected for calculation, as shown in
Figure 9.
After inputting the data, the parameters are shown in
Table 4:
In summary, the curing kinetics equation obtained by the chemical rheological method is:
Taking the above equation as 333 K for 10 h and substituting it, the apparent viscosity is 9.764 Pa·s, which is very close to the actual measured value of 10.046 Pa·s. Before the apparent viscosity sharply increases, other measurement points also basically agree. Therefore, the above equation is the curing kinetics equation for the BGAP curing system measured by the rheological method.
When the curing temperature is 50 °C, it was found that the rheological equation of the adhesive still conforms to the power-law equation (as shown in
Table 5) when tested at a shear rate of 1–100 s
−1 within 100 s before 29 h. When the apparent viscosity sharply increases, R
2 decreases and cannot be considered as a pseudoplastic fluid anymore, and the power-law equation fails. Similarly, samples with temperatures of 60 °C, 65 °C, and 70 °C can no longer be considered as pseudoplastic fluids at 27 h.
2.3. Rheological Properties Analysis of BGAP Propellant During Solidification Process
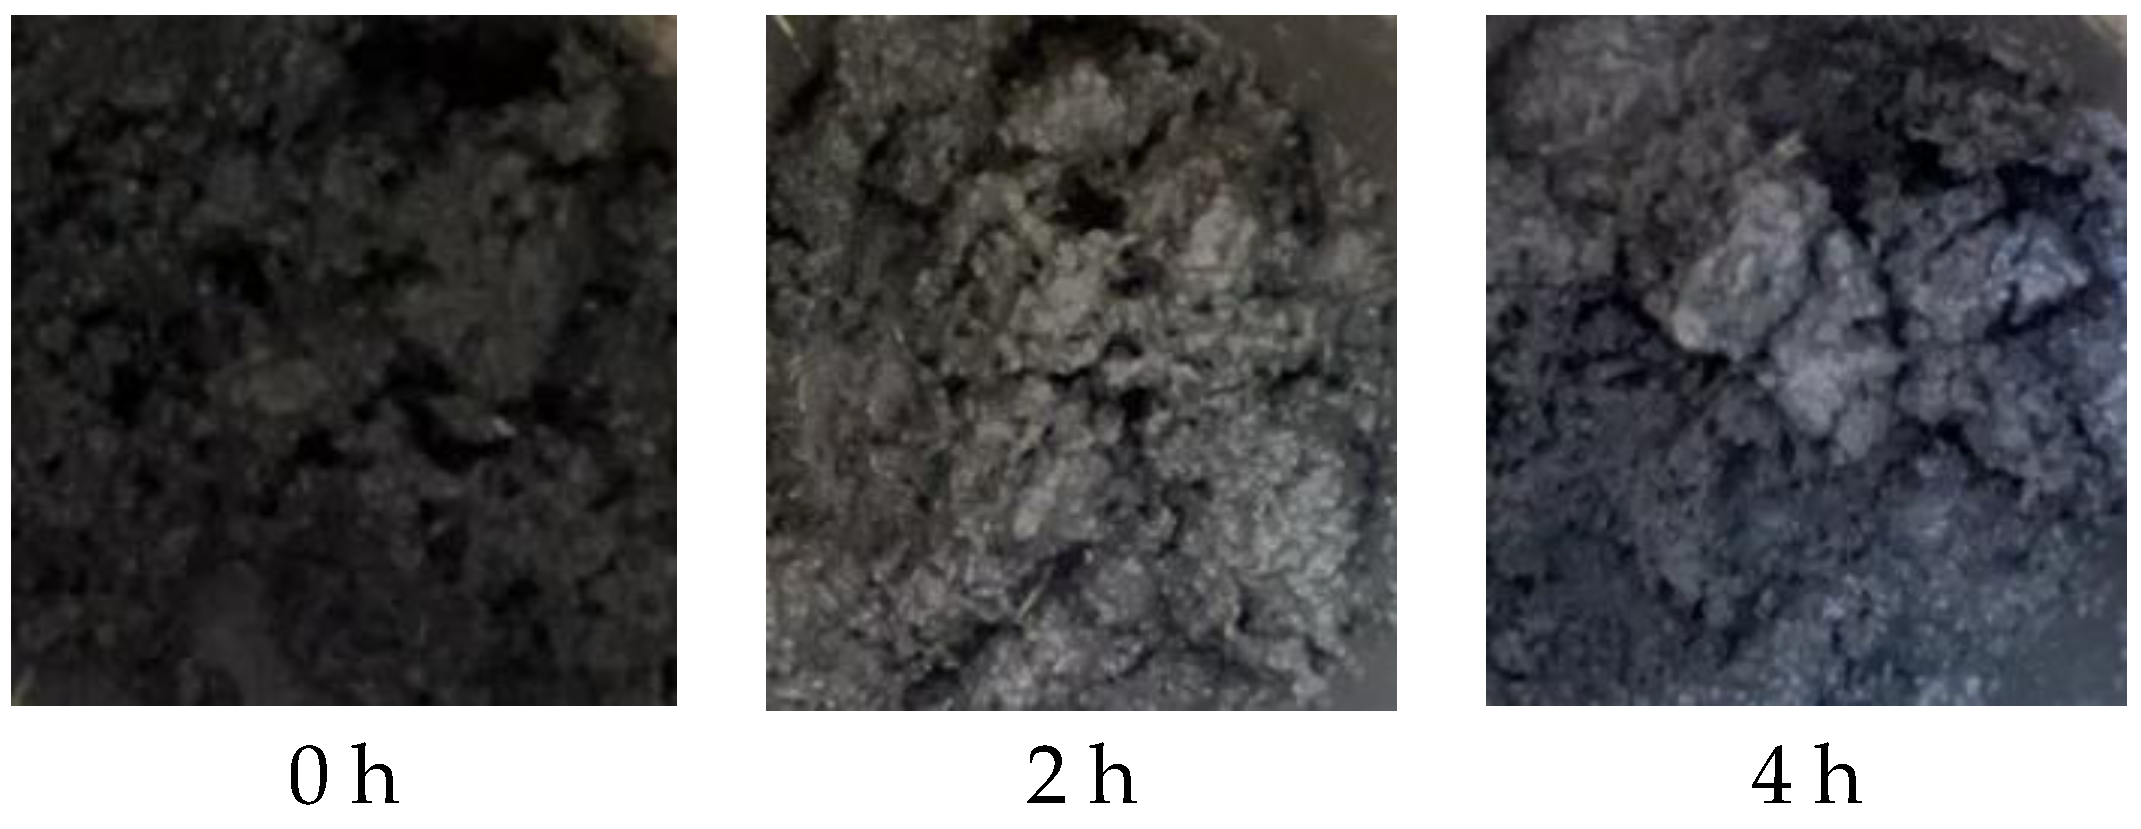
When the particle size of Al powder is 200 nm, it aggregates with other components and cannot form a flowable slurry (as shown in
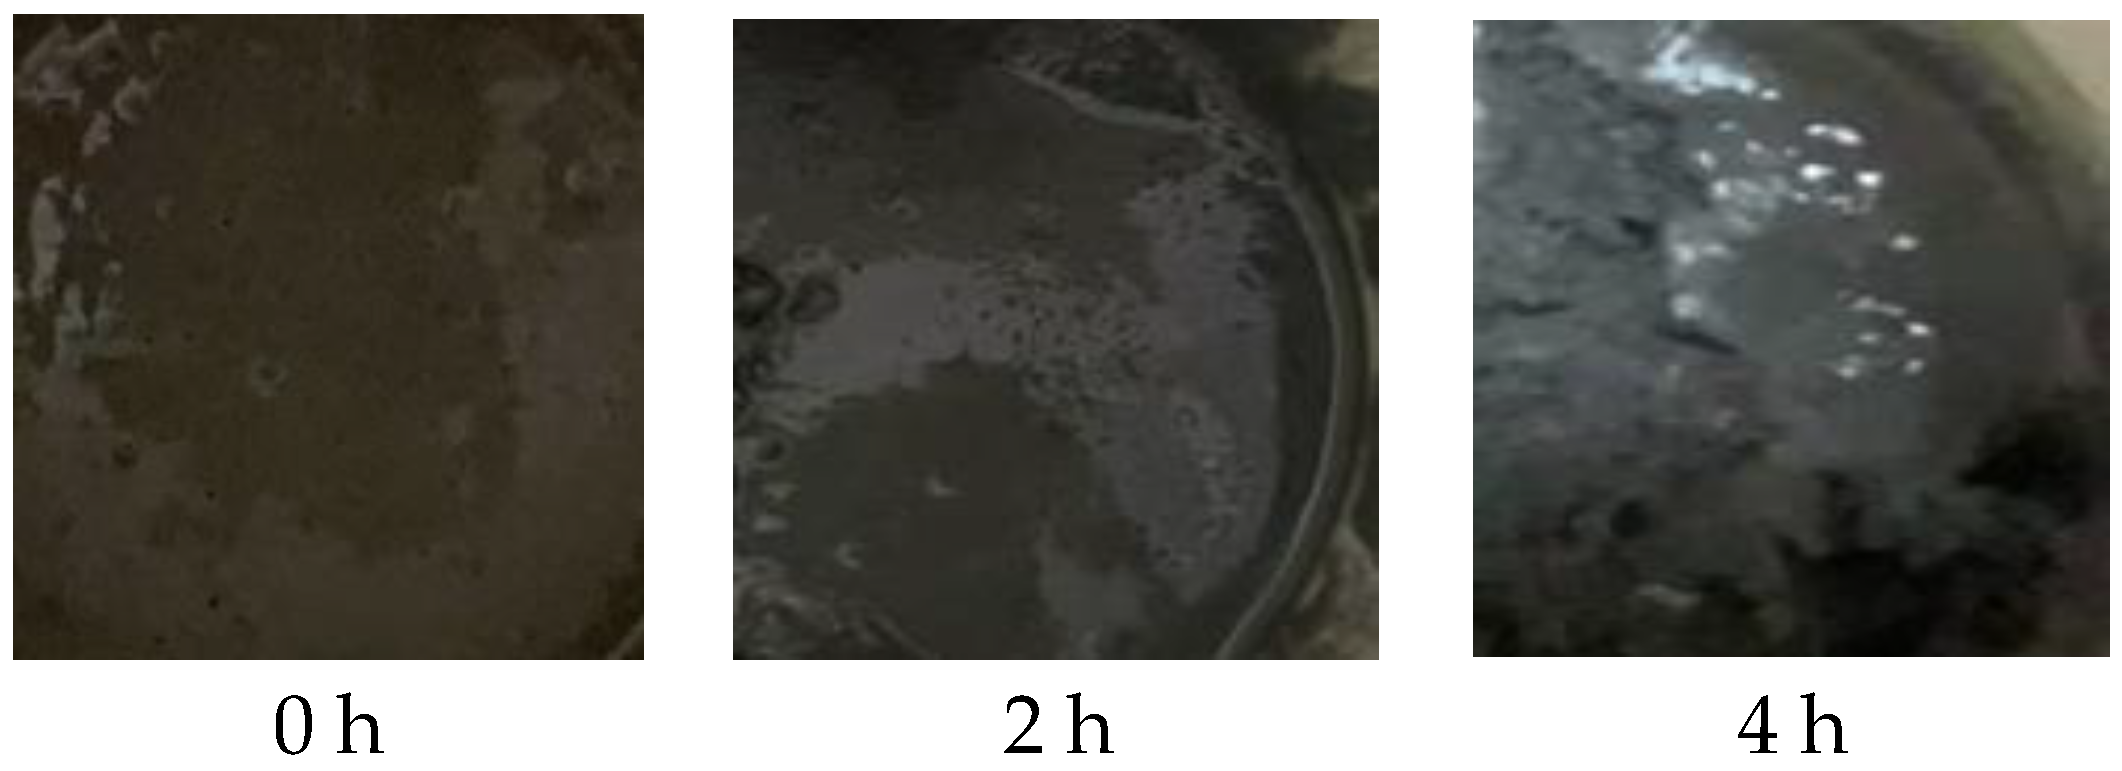
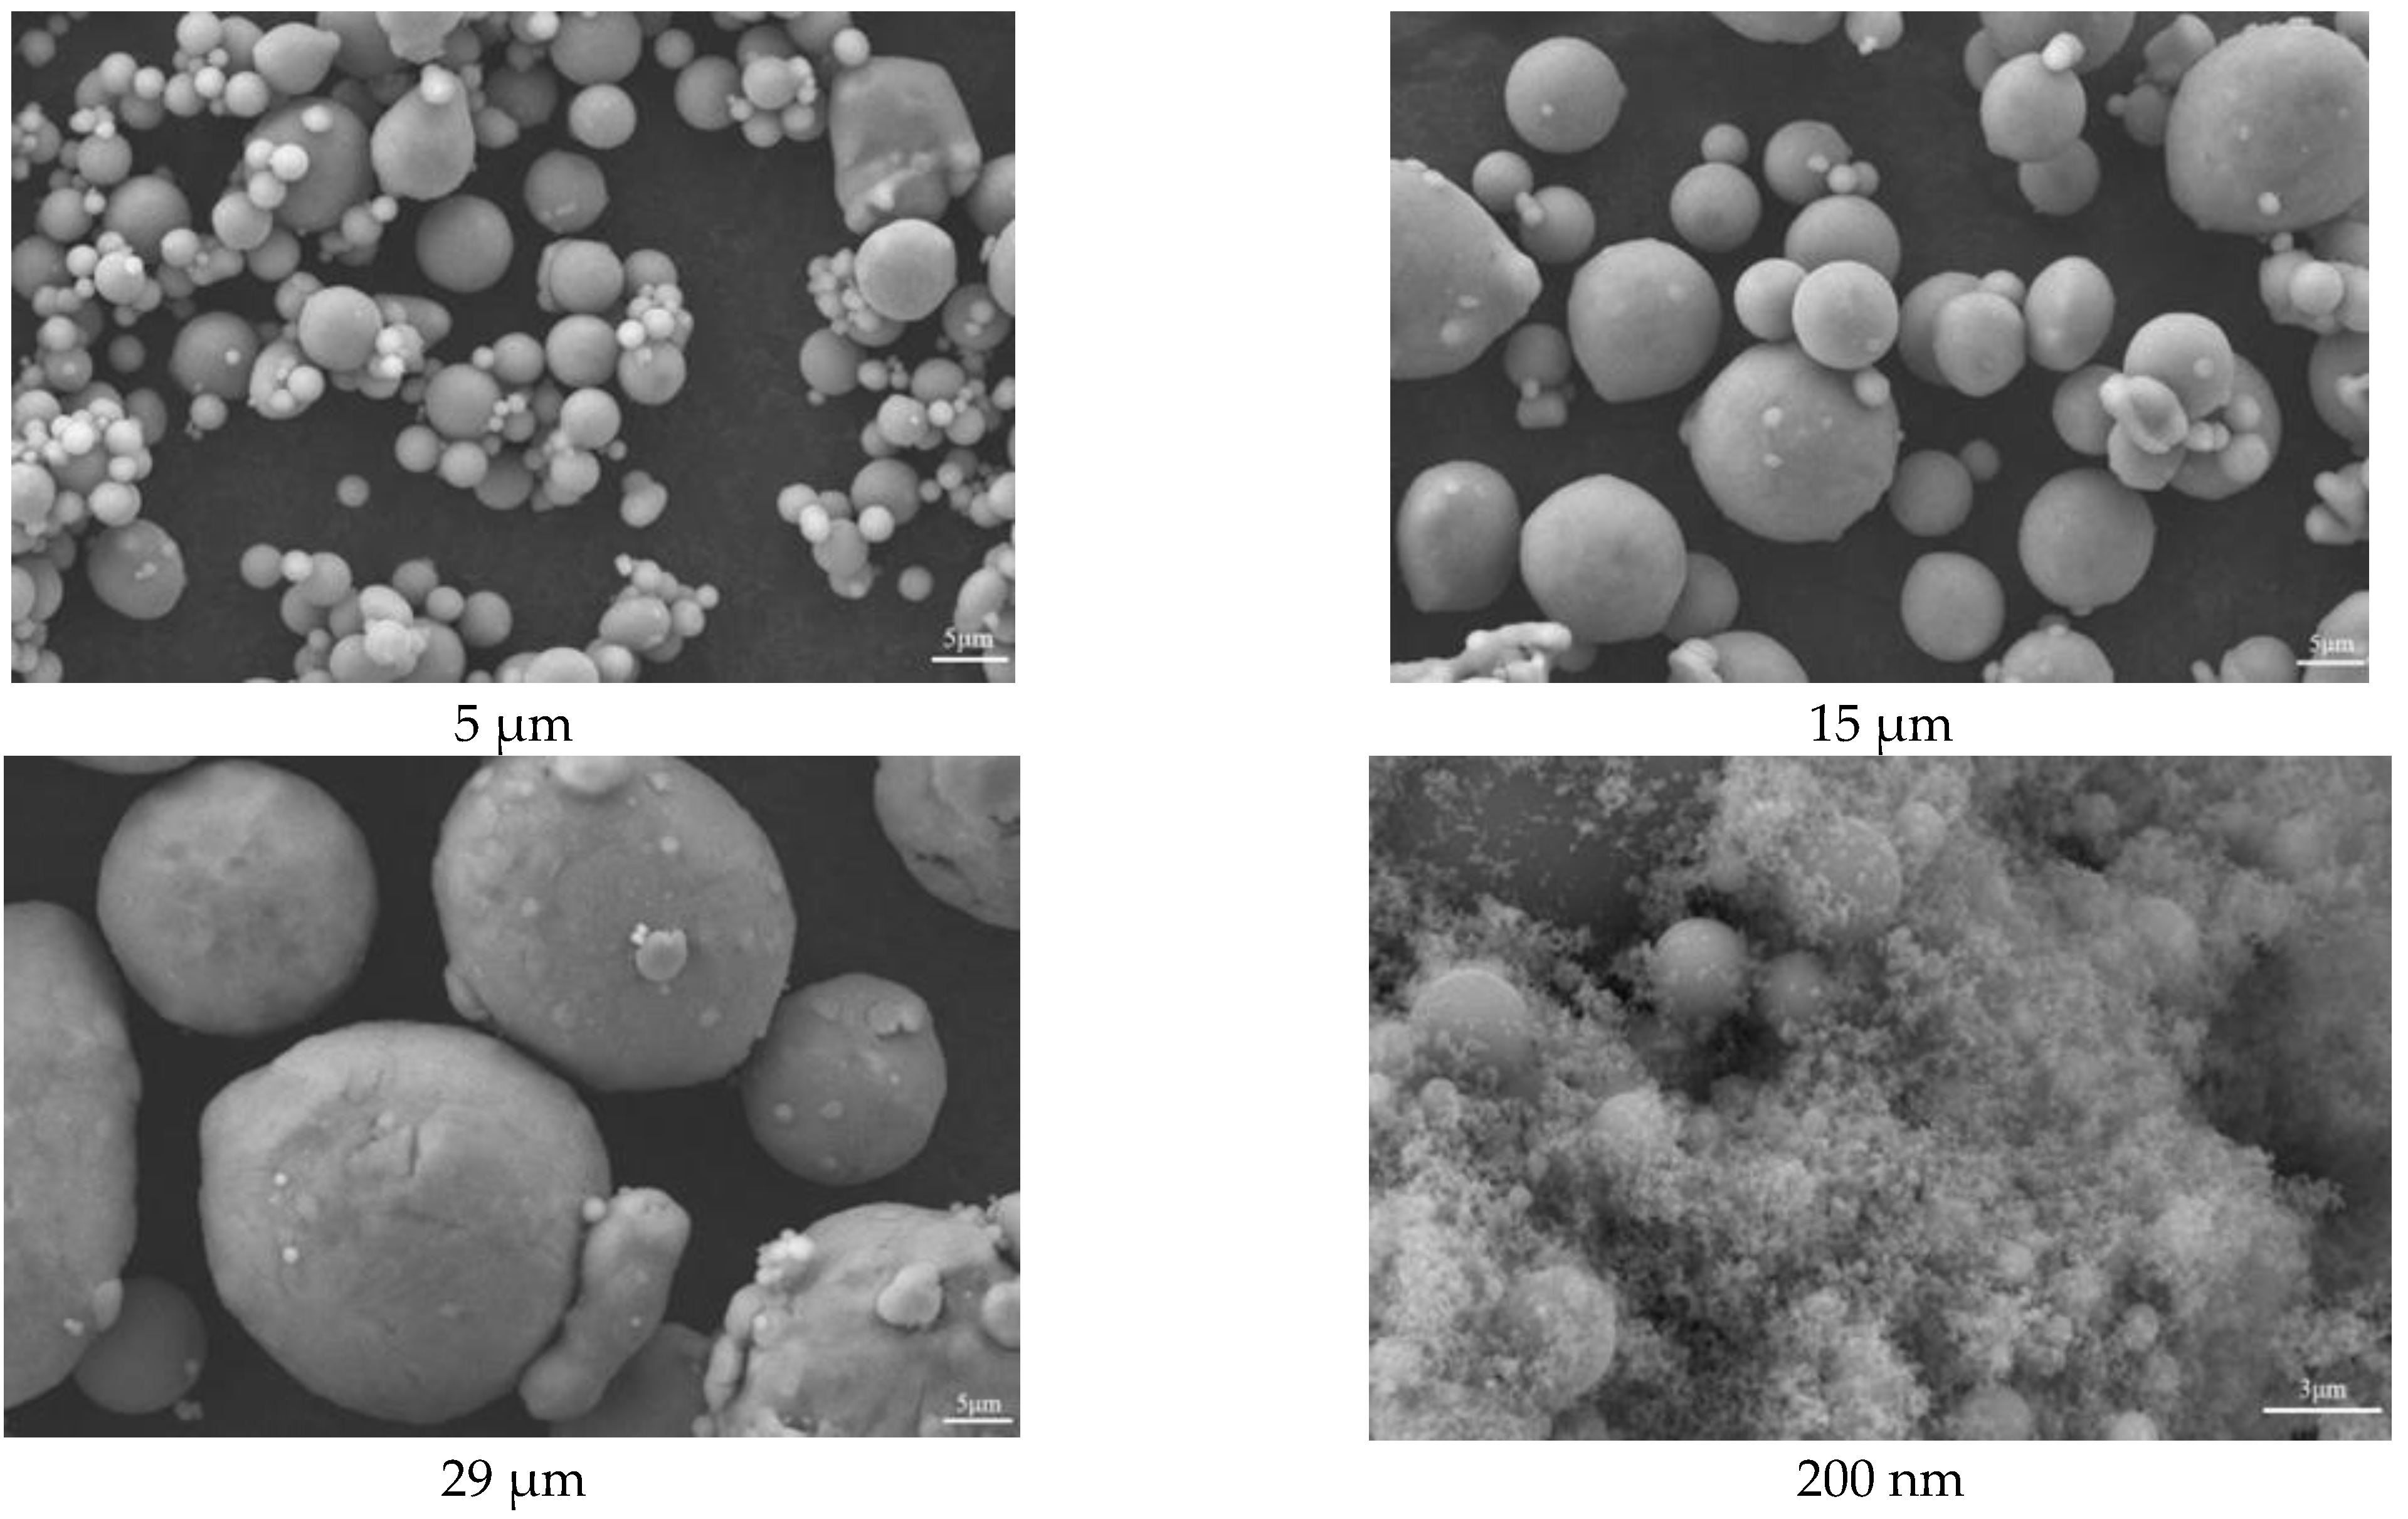
Figure 10). This is because the smaller the particle size of Al powder, the larger its specific surface area, and the more adhesive is required. Therefore, this formula is not suitable for using 200 nm Al powder. Micro-sized aluminum powder with a larger particle size can be used to create a flowable slurry (as shown in
Figure 11). Perform apparent viscosity testing on the slurry composed of Al powder with particle sizes of 5 μm, 15 μm, and 29 μm.
The apparent viscosity of propellants composed of Al powder with different particle sizes was tested every 1 h, and the results are shown in
Figure 12:
Similarly, according to
Figure 11, using Equations (9)–(11), the same data curve can be obtained. To predict the apparent viscosity of later solidification, the points where the apparent viscosity continues to rise are selected for graphical calculation, as shown in
Figure 13. Based on this, the solidification kinetics equation of BGAP propellant represented by apparent viscosity under different Al particle sizes is calculated, as shown in
Table 6:
As the particle size of Al powder decreases, its specific surface area increases, surface energy increases, and more adhesive is adsorbed. Therefore, as the particle size of Al powder increases, the viscosity of the propellant slurry increases, and the activation energy of viscous flow increases. At the same time, due to the increase in adhesive around the Al powder, the contact area between the adhesive and the curing agent increases, accelerating the curing reaction and resulting in a decrease in the activation energy of the curing reaction.
In the initial stage of curing, due to the gradual polymerization of the adhesive system, small molecular substances react first rather than directly forming a polymer network. Therefore, in the initial stage of curing, the apparent viscosity of the propellant slurry will decrease to a certain extent. To predict the subsequent changes in apparent viscosity, it is necessary to select the point where the apparent viscosity continues to increase. The selected adhesive adopts a cross-linked network curing, which is a thermosetting polymer, so the propellant slurry under this formula also has thermosetting properties. As the curing time increases, the polymer adhesive continuously undergoes cross-linking reactions in the system and the internal friction force of the slurry increases during shearing. The apparent viscosity of the propellant slurry also increases.
