
Development and Validation of an HPLC-MS/MS Method for the Simultaneous Quantification of Vitexin and Isovitexin in Rabbit Plasma: Pharmacokinetic Insights on a Microcapsule Formulation

 , , ,
, , ,  , , , ,
Abstract
1. Introduction
2. Results
2.1. LC-ESI-MS/MS Method Development
2.2. Method Validation
2.2.1. System Suitability
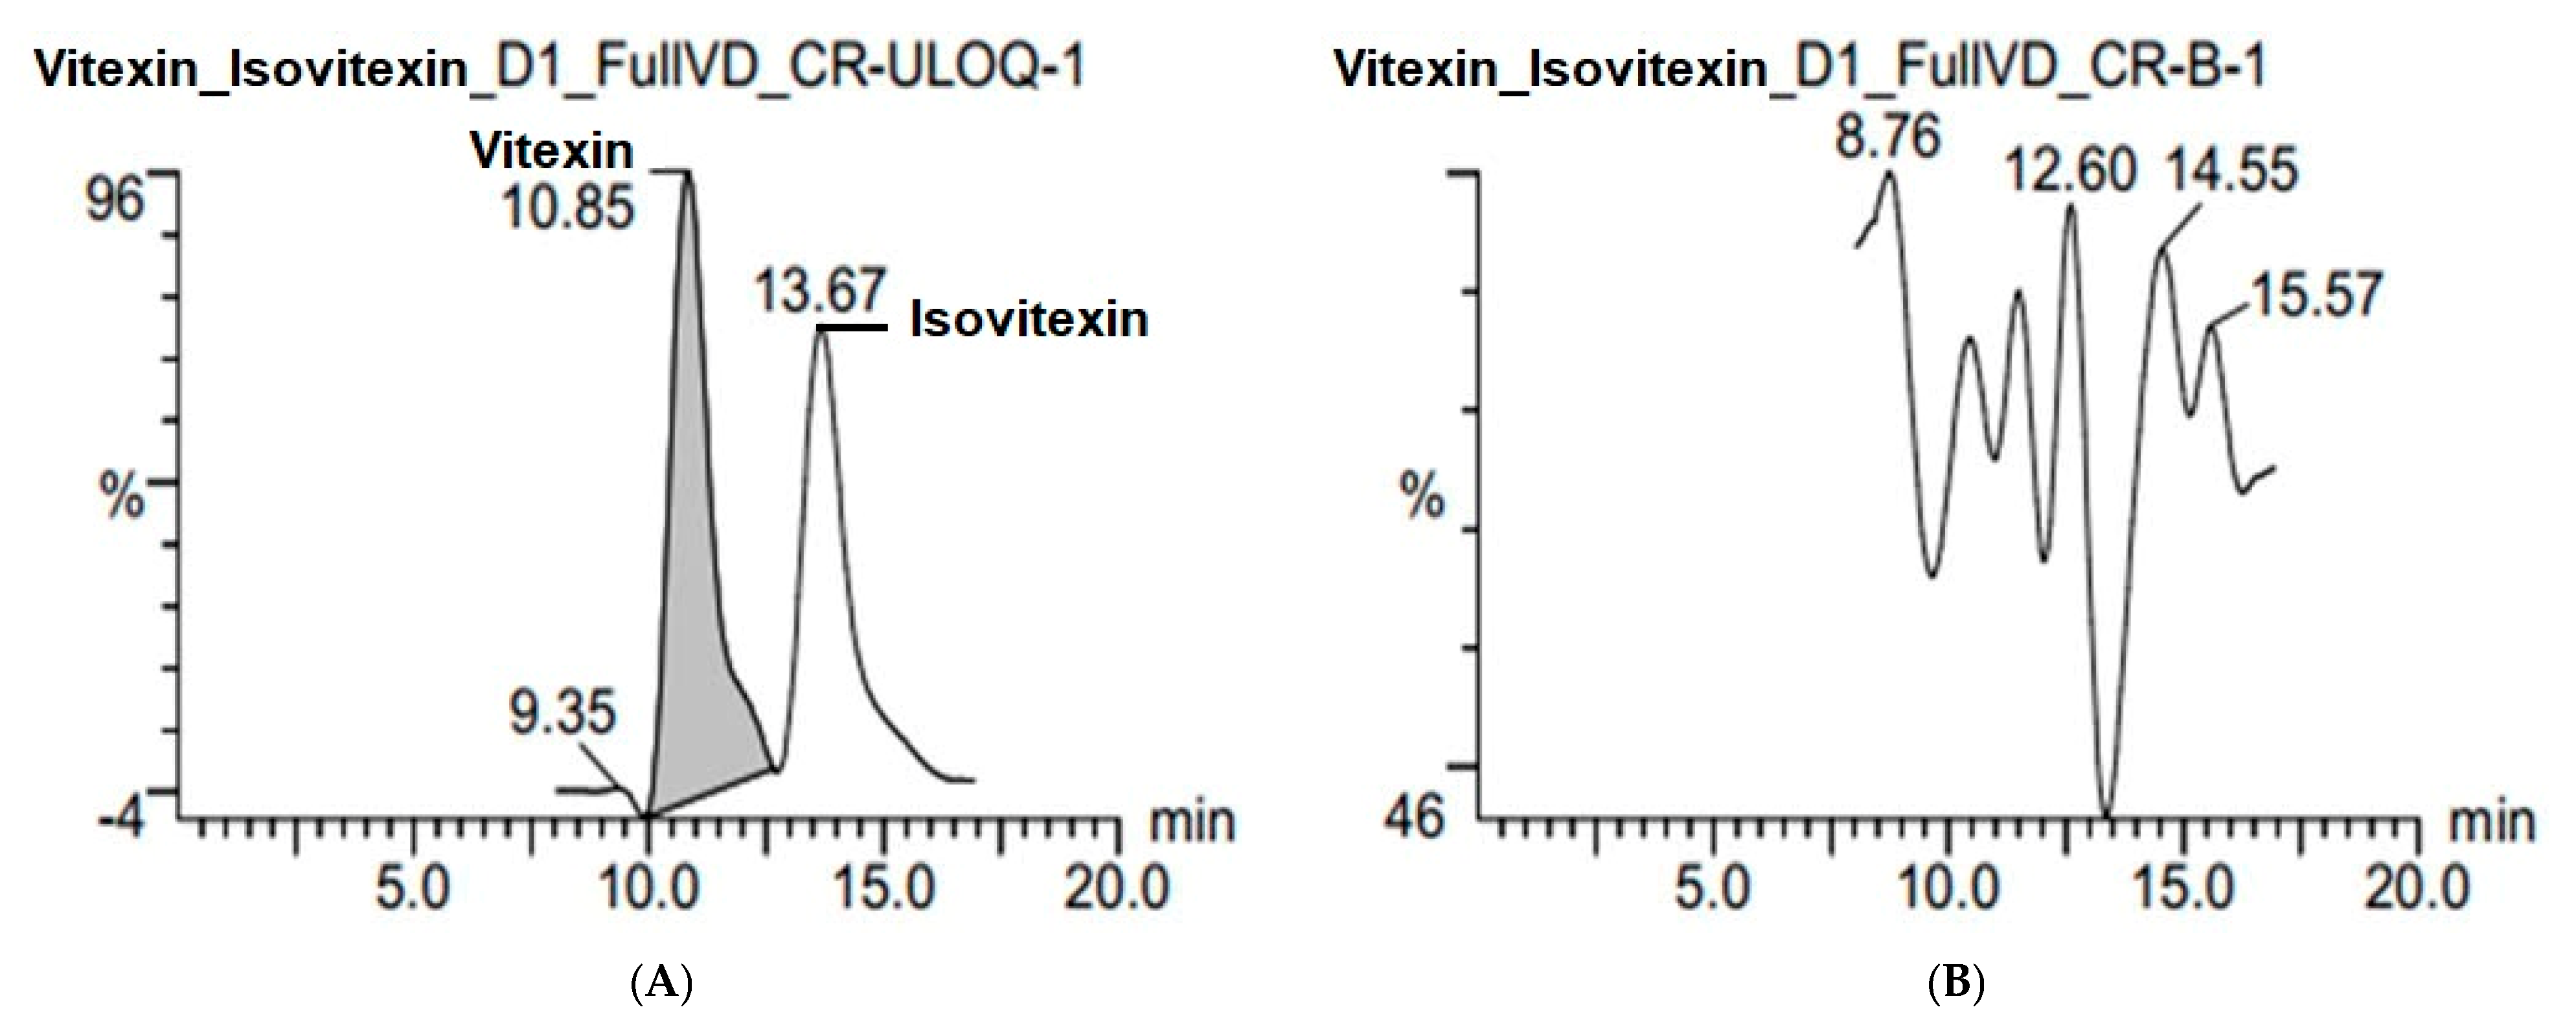
2.2.2. Specificity and Selectivity
2.2.3. Linearity
2.2.4. Accuracy and Precision
2.2.5. Extraction Efficiency and Matrix Effect
2.2.6. Carry-Over
2.2.7. Dilution Integrity
2.2.8. Stability
2.3. Application of the Method for Pilot Testing of Biological Samples
3. Discussion
4. Materials and Methods
4.1. Chemicals and Materials
4.2. Preparation of Chitosan-Coated Alginate Microcapsules
4.3. Instrumentation and Chromatographic Conditions
4.4. Plasma Sample Preparation
4.5. Quality Control (QC) Samples
4.6. Method Validation
4.6.1. System Suitability
4.6.2. Specificity, Selectivity
4.6.3. Linearity
4.6.4. Accuracy and Precision
4.6.5. Extraction Efficiency and Matrix Effect
4.6.6. Carry-Over
4.6.7. Dilution Integrity
4.6.8. Stability
4.7. Applications in Pharmacokinetic Study
5. Conclusions
Author Contributions
Funding
Institutional Review Board Statement
Informed Consent Statement
Data Availability Statement
Conflicts of Interest
Abbreviations
| AUC | Area under curve |
| CE | Collision energy |
| EMA | European medicines agency |
| ESI | Electrospray ionization |
| FDA | (Us) food and drug administration |
| HPLC | High performance liquid chromatography |
| HQC | High quality control |
| LC | Liquid chromatography |
| LLOQ | Lower limit of quantification |
| LQC | Low quality control |
| MQC | Middle quality control |
| MS | Mass spectrometry |
| RSD | Relative standard deviation |
| ULOQ | Upper limit of quantification |
| UV | Ultraviolet |
References
- Picerno, P.; Mencherini, T.; Lauro, M.R.; Barbato, F.; Aquino, R. Phenolic constituents and antioxidant properties of Xanthosoma violaceum leaves. J. Agric. Food Chem. 2003, 51, 6423–6428. [Google Scholar] [CrossRef] [PubMed]
- Fu, Y.; Zu, Y.; Liu, W.; Zhang, L.; Tong, M.; Efferth, T.; Kong, Y.; Hou, C.; Chen, L. Determination of vitexin and isovitexin in pigeonpea using ultrasonic extraction followed by LC-MS. J. Sep. Sci. 2008, 31, 268–275. [Google Scholar] [CrossRef]
- Yan, C.; Liu, H.; Lin, L. Simultaneous determination of vitexin and isovitexin in rat plasma after oral administration of Santalum album L. leaves extract by liquid chromatography tandem mass spectrometry. Biomed. Chromatogr. 2013, 27, 228–232. [Google Scholar] [CrossRef] [PubMed]
- Phung, P.T.K.; Binh, D.N.L.; Thu, N.T.A.; Ha, N.V.; Huyen, T.T.; Hien, K.M.; Nhu, M.H.; Duc, N.K.; Quan, L.M. Optimization of extraction parameters and anti-hyperglycemic assessment of standardized extract from Santalum album L. leaves. Pharmacol. Res.—Mod. Chin. Med. 2025, 14, 100577. [Google Scholar] [CrossRef]
- March, R.E.; Lewars, E.G.; Stadey, C.J.; Miao, X.-S.; Zhao, X.; Metcalfe, C.D. A comparison of flavonoid glycosides by electrospray tandem mass spectrometry. Int. J. Mass Spectrom. 2006, 248, 61–85. [Google Scholar] [CrossRef]
- Li, Y.; Zhang, W.; Zhang, J.; Xu, P.; Hao, M. Radioprotective effect and other biological benefits associated with flavonoids. Trop. J. Pharm. Res. 2016, 15, 1099–1108. [Google Scholar] [CrossRef]
- Peng, Y.; Gan, R.; Li, H.; Yang, M.; McClements, D.J.; Gao, R.; Sun, Q. Absorption, metabolism, and bioactivity of vitexin: Recent advances in understanding the efficacy of an important nutraceutical. Crit. Rev. Food Sci. Nutr. 2021, 61, 1049–1064. [Google Scholar] [CrossRef]
- Yoksan, R.; Noivoil, N. Fabrication, Characterization and In vitro Release of Vitexin-Loaded Chitosan Nanoparticles. J. Polym. Environ. 2024, 32, 1557–1572. [Google Scholar] [CrossRef]
- Che Zain, M.S.; Shaari, K.; Lee, S.Y.; Fakurazi, S. Development and Evaluation of Hydrogel-Thickened Nanoemulsion Containing Orientin, Isoorientin, Vitexin and Isovitexin as an Antioxidant Wound Dressing. J. Clust. Sci. 2024, 35, 635–656. [Google Scholar] [CrossRef]
- Peanparkdee, M.; Yooying, R.; Sae-Tan, S. Impact of food matrix components on the physicochemical properties, release properties and bioaccessibility of unencapsulated and encapsulated vitexin. Int. J. Food Sci. Technol. 2024, 59, 886–897. [Google Scholar] [CrossRef]
- Karim, N.A.; Muhamad, I.I.; Pae, N.; Aziz, R.A. Effect of spray drying conditions on the antioxidant and physicochemical properties of Clinacanthus nutans leaves extracts. Chem. Eng. Trans. 2017, 56, 961–966. [Google Scholar] [CrossRef]
- Costa, E.C.; Menezes, P.M.N.; de Almeida, R.L.; Silva, F.S.; de Araújo Ribeiro, L.A.; da Silva, J.A.; de Oliveira, A.P.; da Cruz Araújo, E.C.; Rolim, L.A.; Nunes, X.P. Inclusion of vitexin in β-cyclodextrin: Preparation, characterization and expectorant/antitussive activities. Heliyon 2020, 6, e05461. [Google Scholar] [CrossRef] [PubMed]
- Liu, Y.-Y.; Liu, C.-M.; Li, X.-P.; Kang, Y.; Chen, Y.-C.; Guo, S.-H.; Li, Y.-R.; Zhang, J.-T.; Liu, S.; Xue, T.; et al. Study on antibacterial and antioxidant activities of flavonoids from Trollius chinensis Bge. J. Pharm. Res. 2023, 42, 228–231. [Google Scholar] [CrossRef]
- Tong, M.; Liu, W.; Fu, Y.; Kong, Y.; Gu, C.; Zhang, L. Determination of Contents of Vitexin and Isovitexin in Pigeonpea by HPLC. Chem. Ind. For. Prod. 2008, 28, 34–38. [Google Scholar]
- Tong, C.L.; Liu, X.D. Pharmacokinitics of vitexin in rats. J. China Pharm. Univ. 2007, 38, 65–68. [Google Scholar]
- Li, Y.; Zhang, Y.; Yang, T.; Li, H.; Guo, J.; Zhao, Q.; Xie, J. Pharmacokinetics and tissue distribution study of Isovitexin in rats by HPLC-MS/MS. J. Chromatogr. B Anal. Technol. Biomed. Life Sci. 2015, 991, 13–20. [Google Scholar] [CrossRef]
- Wang, Y.; Han, C.; Leng, A.; Zhang, W.; Xue, H.; Chen, Y.; Ying, X. Pharmacokinetics of vitexin in rats after intravenous and oral administration. Afr. J. Pharm. Pharmacol. 2012, 6, 2368–2373. [Google Scholar] [CrossRef]
- Sun, D.; Dong, L.; Guo, P.; Yan, W.; Wang, C.; Zhang, Z. Simultaneous determination of four flavonoids and one phenolic acid in rat plasma by LC-MS/MS and its application to a pharmacokinetic study after oral administration of the Herba Desmodii Styracifolii extract. J. Chromatogr. B Anal. Technol. Biomed. Life Sci. 2013, 932, 66–73. [Google Scholar] [CrossRef]
- Zhang, S.; Xie, Y.; Wang, J.; Geng, Y.; Zhou, Y.; Sun, C.; Wang, G. Development of an LC-MS/MS method for quantification of two pairs of isomeric flavonoid glycosides and other ones in rat plasma: Application to pharmacokinetic studies. Biomed. Chromatogr. 2017, 31, e3972. [Google Scholar] [CrossRef]
- Kumar, P.V.; Maki, M.A.A.; Wei, Y.S.; Tatt, L.M.; Elumalai, M.; Cheah, S.C.; Raghavan, B.; Majeed, A.B.B.A. Rabbit as an Animal Model for Pharmacokinetics Studies of Enteric Capsule Contains Recombinant Human Keratinocyte Growth Factor Loaded Chitosan Nanoparticles. Curr. Clin. Pharmacol. 2019, 14, 132–140. [Google Scholar] [CrossRef] [PubMed] [PubMed Central]
- Bai, Y.; Zhang, Q.; Wang, B.; Zhang, M.; Xu, Y.; Li, S.; Zhao, Y.; Yu, Z. Plasma Pharmacokinetics, Bioavailability, and Tissue Distribution of Four C-Glycosyl Flavones from Mung Bean (Vigna radiata L.) Seed Extracts in Rat by Ultrahigh-Performance Liquid Chromatography-Tandem Mass Spectrometry. J. Agric. Food Chem. 2017, 65, 5570–5580. [Google Scholar] [CrossRef] [PubMed]
- Quan, L.M.; Nhat, T.T.; Han, D.H.; Chau, T.L.T.; Phi, N.C.; Hau, L.; Nghiem, L.Q. Preparation of sustained release naproxen sodium loaded microcapsules from alginate and chitosan through experimental design. Pharm. Sci. Asia 2025, 51, 44–54. [Google Scholar] [CrossRef]
- FDA. Guidance for Industry: Bioanalytical Method Validation; FDA: Silver Spring, MD, USA, 2018.
- EMA. Guideline on Bioanalytical Method Validation; EMA: Amsterdam, The Netherlands, 2015. [Google Scholar]
- Patel, D.S.; Sharma, N.; Patel, M.C.; Patel, B.N.; Shrivastav, P.S.; Sanyal, M. Development and validation of a selective and sensitive LC–MS/MS method for determination of cycloserine in human plasma: Application to bioequivalence study. J. Chromatogr. B 2011, 879, 2265–2273. [Google Scholar] [CrossRef] [PubMed]
- Reddy, S.D.; Rao, P.; Devaraj, V.C. A Highly Sensitive LC-Ms/Ms Method for Determination of Desvenlafaxine in Rabbit Plasma and its Application to Rabbit Pharmacokinetic Study. J. Anal. Bioanal. Tech. 2011, 2, 2–6. [Google Scholar] [CrossRef]


| Compound | Parent Ions (m/z) | Cone (V) | CE (V) | Daughter Ions (m/z) | |
|---|---|---|---|---|---|
| Quantitative Ions | Qualitative Ions | ||||
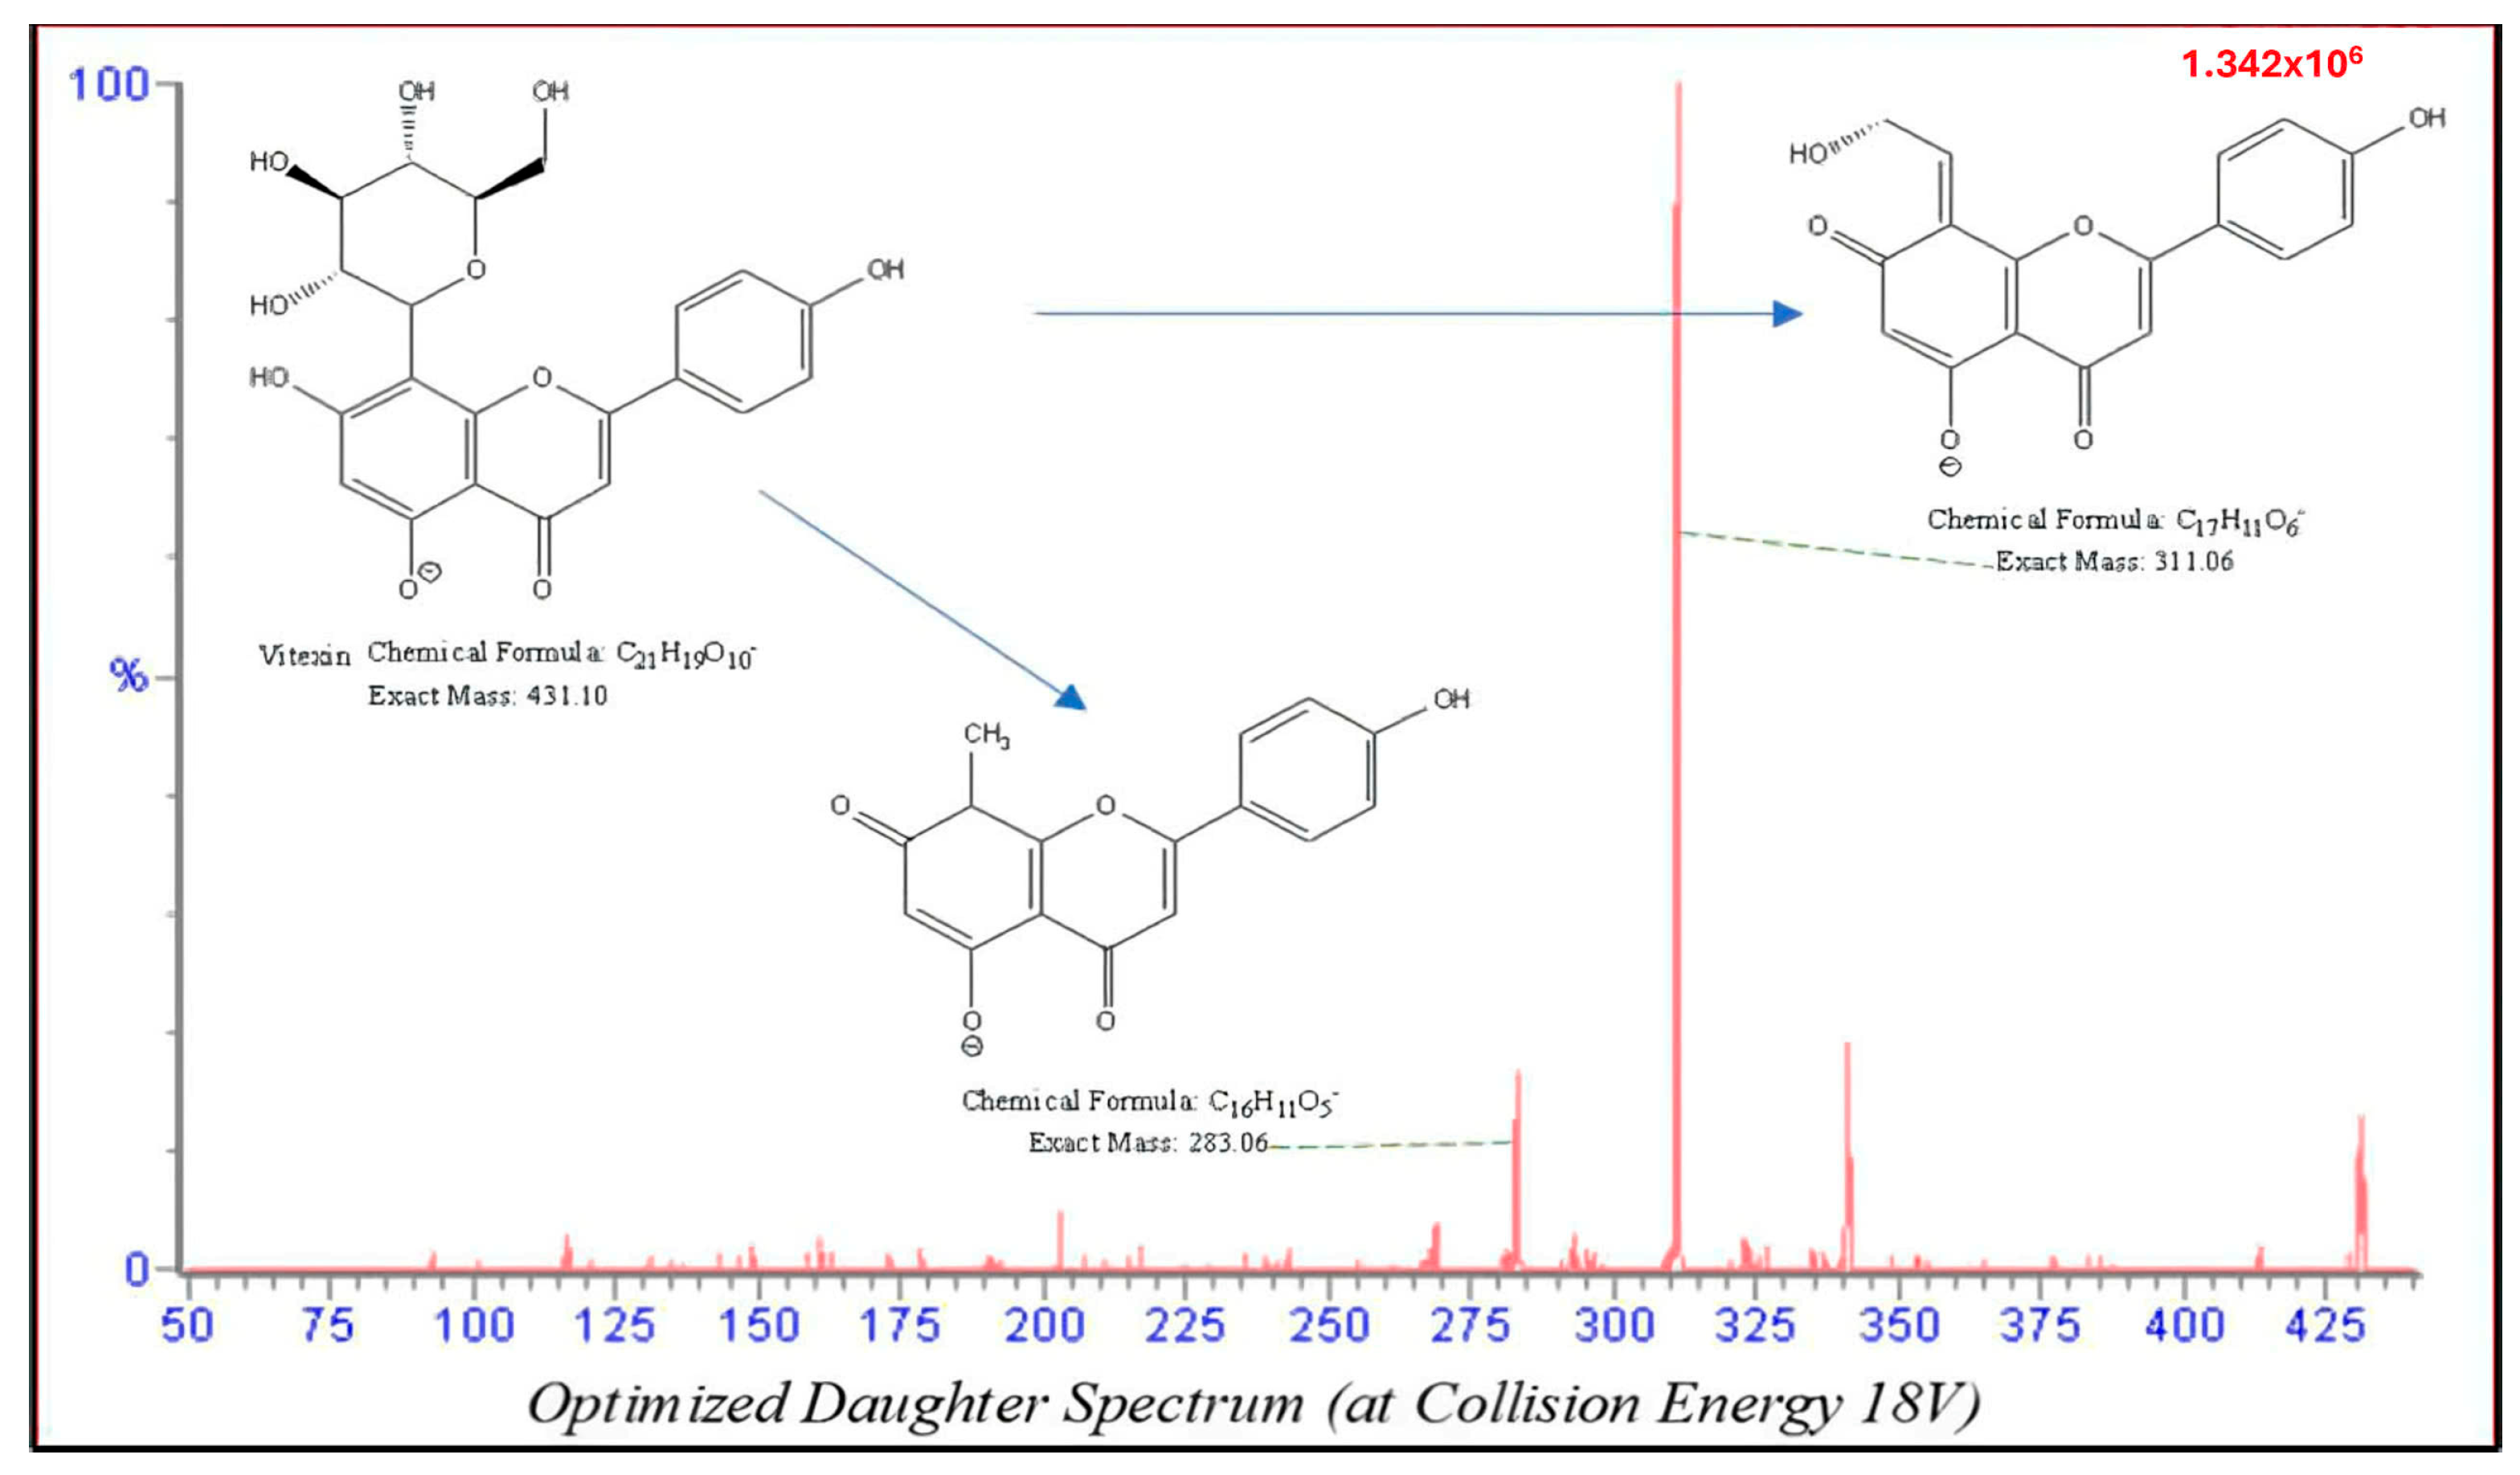
| Vitexin | 431 | 40 | 18 | 311 | 283 |
| Isovitexin | 431 | 40 | 18 | 311 | 283 |
| Salicylic acid (IS) | 137 | 6 | 20 | 93 | - |
| No. | Vitexin | Isovitexin | ||||
|---|---|---|---|---|---|---|
| Retention Time (min) | Ratio (Analyte/IS) | Retention Time (min) | Ratio (Analyte/IS) | |||
| Retention Time | Area | Retention Time | Area | |||
| 1 | 10.71 | 0.823 | 0.934 | 13.48 | 1.036 | 0.743 |
| 2 | 10.71 | 0.821 | 0.872 | 13.53 | 1.037 | 0.709 |
| 3 | 10.76 | 0.825 | 0.899 | 13.53 | 1.037 | 0.718 |
| 4 | 10.76 | 0.818 | 0.876 | 13.53 | 1.029 | 0.701 |
| 5 | 10.76 | 0.818 | 0.880 | 13.57 | 1.032 | 0.710 |
| 6 | 10.76 | 0.821 | 0.868 | 13.57 | 1.036 | 0.697 |
| Mean | 10.74 | 0.821 | 0.888 | 13.54 | 1.034 | 0.713 |
| SD | 0.03 | 0.00 | 0.02 | 0.03 | 0.00 | 0.02 |
| CV (%) | 0.24 | 0.31 | 2.79 | 0.25 | 0.31 | 2.30 |
| Range (ng/mL) | Equation y = ax + b, Weighting Factor 1/x2 | |||
|---|---|---|---|---|
| a | B | R2 | ||
| Vitexin | 2.0–200.0 | 0.0114 | −0.0027 | 0.9928 |
| Isovitexin | 2.0–200.0 | 0.0092 | −0.0043 | 0.9961 |
| Compound | Theoretical Concentration (ng/mL) | Accuracy (%) | Recovery (%) (n = 6) | Matrix Effect (n = 6) | ||
|---|---|---|---|---|---|---|
| Intraday (n = 6) | Interday (3 days, n = 18) | Matrix Factor (MF) (%) | IS-Normalized MF | |||
| Vitexin | 2.0 | 110.15 (3.22) | 106.36 (7.66) | |||
| 6.0 | 104.97 (6.29) | 103.28 (1.43) | 99.12 (10.72) | 100.06 (6.67) | 102.93 (5.71) | |
| 80.0 | 96.41 (3.2) | 95.06 (1.97) | 98.13 (2.15) | |||
| 160.0 | 101.98 (3.83) | 103.09 (3.22) | 97.53 (1.49) | 90.86 (1.52) | 93.48 (6.88) | |
| 320.0 (diluted × 2) | 92.38 (4.37) | - | - | - | - | |
| Isovitexin | 2.0 | 104.06 (8.7) | 101.52 (7.16) | - | - | - |
| 6.1 | 104.11 (5.28) | 102.35 (1.82) | 101.98 (6.75) | 90.38 (6.94) | 93.00 (6.53) | |
| 81.0 | 94.32 (2.41) | 94.5 (0.72) | 99.37 (2.29) | - | - | |
| 161.9 | 100.59 (3.44) | 102.98 (2.33) | 99.74 (1.59) | 97.74 (1.52) | 100.55 (6.88) | |
| 323.8 (diluted × 2) | 94.19 (3.87) | - | - | - | - | |
| Salicylic acid (IS) | - | - | 97.07 (2.04) | 97.46 (6.44) | - | |
| Compound | Conc. (ng/mL) | Plasma | Wet Extract | ||
|---|---|---|---|---|---|
| Bench-Top | Freeze-Thaw | Long-Term | Autosampler | ||
| (20–30 °C, 8 h) | (3 Cycles) | (<−20 °C, 30 Days) | (10 °C, 24 h) | ||
| Vitexin | 6.0 | 104.52 (7.26) | 96.46 (7.22) | 91.94 (2.13) | 102.34 (5.6) |
| 160.0 | 107.2 (5.24) | 103.92 (2.94) | 92.60 (2.39) | 101.02 (3.58) | |
| Isovitexin | 6.1 | 100.7 (6.56) | 94.48 (6.36) | 95.00 (7.36) | 102.57 (8.64) |
| 161.9 | 106.8 (5.6) | 106.38 (2.59) | 94.92 (2.43) | 101.02 (3.5) | |
| IS | 1000 | 108.16 (3.17) | 95.31 (3.72) | ||
Disclaimer/Publisher’s Note: The statements, opinions and data contained in all publications are solely those of the individual author(s) and contributor(s) and not of MDPI and/or the editor(s). MDPI and/or the editor(s) disclaim responsibility for any injury to people or property resulting from any ideas, methods, instructions or products referred to in the content. |
© 2025 by the authors. Licensee MDPI, Basel, Switzerland. This article is an open access article distributed under the terms and conditions of the Creative Commons Attribution (CC BY) license (https://creativecommons.org/licenses/by/4.0/).
Share and Cite
Nguyen, D.T.; Le, T.N.N.; Ngo, D.K.; Khuu, H.M.; Tran, K.T.; Le, H.T.; Tran, H.V.; Phan, T.-T.N.; Kim Khuyen, V.T.; Do, H.H.; et al. Development and Validation of an HPLC-MS/MS Method for the Simultaneous Quantification of Vitexin and Isovitexin in Rabbit Plasma: Pharmacokinetic Insights on a Microcapsule Formulation. Molecules 2025, 30, 1690. https://doi.org/10.3390/molecules30081690
Nguyen DT, Le TNN, Ngo DK, Khuu HM, Tran KT, Le HT, Tran HV, Phan T-TN, Kim Khuyen VT, Do HH, et al. Development and Validation of an HPLC-MS/MS Method for the Simultaneous Quantification of Vitexin and Isovitexin in Rabbit Plasma: Pharmacokinetic Insights on a Microcapsule Formulation. Molecules. 2025; 30(8):1690. https://doi.org/10.3390/molecules30081690
Chicago/Turabian StyleNguyen, Duc Tuan, Trung Nguyen Nguyen Le, Duc Kien Ngo, Hien Minh Khuu, Khang Thien Tran, Hoang Thanh Le, Hung Viet Tran, Truong-Thang Nguyen Phan, Vo Thi Kim Khuyen, Han Hoang Do, and et al. 2025. "Development and Validation of an HPLC-MS/MS Method for the Simultaneous Quantification of Vitexin and Isovitexin in Rabbit Plasma: Pharmacokinetic Insights on a Microcapsule Formulation" Molecules 30, no. 8: 1690. https://doi.org/10.3390/molecules30081690
APA StyleNguyen, D. T., Le, T. N. N., Ngo, D. K., Khuu, H. M., Tran, K. T., Le, H. T., Tran, H. V., Phan, T.-T. N., Kim Khuyen, V. T., Do, H. H., Mai, N. H., & Le, Q. M. (2025). Development and Validation of an HPLC-MS/MS Method for the Simultaneous Quantification of Vitexin and Isovitexin in Rabbit Plasma: Pharmacokinetic Insights on a Microcapsule Formulation. Molecules, 30(8), 1690. https://doi.org/10.3390/molecules30081690