Article

Ordered Mesopore Channels of SBA-15 for Contaminant Adsorption: Characterization, Kinetic, Equilibrium, and Thermodynamic Studies

by
Francisco Emanuel da Silva
1,
Marcela Pires Spaolonzi
2,
Melissa G. A. Vieira
2 and
Sibele B. C. Pergher
1,*
1
Institute of Chemistry, Universidade Federal do Rio Grande do Norte, Senador Salgado Filho Av., 3000, Natal 59078-970, RN, Brazil
2
School of Chemical Engineering, Universidade Estadual de Campinas, Albert Einstein Av., 500, Campinas 13083-872, SP, Brazil
*
Author to whom correspondence should be addressed.
Molecules 2025, 30(5), 1040; https://doi.org/10.3390/molecules30051040
Submission received: 28 January 2025 / Revised: 23 February 2025 / Accepted: 24 February 2025 / Published: 24 February 2025

Abstract

:
SBA-15 is used in various processes, including adsorption, due to its textural properties, mesoporous channels, and silanol groups on the surface. These characteristics make it a promising material for the adsorption of emerging contaminants. This work evaluated the potential use of SBA-15 for the adsorption of bisphenol A (BPA), ciprofloxacin (CIP), and losartan (LS). This study showed that the material has highly ordered mesoporous channels and silanol groups on the surface, which influenced the affinity tests. SBA-15 exhibited the highest adsorption capacity (0.1317 mmol g−1) and removal percentage (60%) for CIP among the contaminants assessed. The adsorption mechanism was elucidated, revealing different interactions for each molecule. The kinetic curves for CIP adsorption indicated that the process reached saturation in 20 min, the equilibrium isotherm showed the highest adsorption at 15 °C, and the thermodynamic study shows an exothermic behavior and spontaneous process. The simplified batch design estimated that 27 g of SBA-15 is required to treat 10 L of 0.2 mmol L−1 initial CIP concentration solution and achieve 90% adsorption removal. This material demonstrated satisfactory performance in absorbing emerging contaminants.

Graphical Abstract

1. Introduction

The constant increase in the world’s population has brought major problems of water pollution with emerging contaminants. These contaminants can be produced by plastics, surfactants, or pharmaceutical industries and are not efficiently removed from water treatment plants [1]. Several methods have been developed for the treatment of emerging contaminants, encompassing physical, chemical, and biological approaches [2].
Physical treatments, such as filtration, sedimentation, and membrane separation processes, are widely used due to their simplicity and speed [3]. However, these methods have significant limitations in effectively removing molecules at microscopic levels, particularly at the very low concentrations commonly found in emerging contaminants [4,5]. Furthermore, these processes often only transfer the contaminant to another phase without effectively degrading it, which can lead to the generation of secondary waste and additional environmental impacts [6,7].
Chemical and biological methods also have significant disadvantages. The introduction of chemicals in the treatment can generate unwanted by-products and, in some cases, worsen the contamination, in addition to altering essential parameters, such as the pH, making the water reuse process difficult [8,9]. Biological processes, however, although promising, may have limitations, such as difficulties in treating complex mixtures of contaminants or even generating secondary problems, such as excessive biomass growth or the release of metabolites that can be equally harmful [10,11].
The adsorption process using solids appears to be one of the most promising alternatives. This technique allows efficient separation between phases, offers excellent results in contaminant removal, and is easier to operate, with the potential for large-scale application in a sustainable and economical manner [12,13].
The SBA-15 emerges as an alternative adsorbent for this process. It is a material with a 2D hexagonal structure, a pore diameter between 5 and 30 nm, and is microporous, which is important for thermal stability [14,15]. This material has a larger surface area, pore diameter, and chemical and thermal stability in processes with a pH close to 4 and 8. This is due to the silica structure with silanol groups for surface interactions [16]. However, little is known about this material’s efficiency in absorbing emerging contaminants without surface functionalization and about how BPA, CIP, and LS molecules interact with the silica surface and any functional groups present.
This study aimed to assess how the SBA-15 material can effectively be used as an adsorbent in adsorption processes. For this purpose, an affinity test was performed to select the best adsorbate–adsorbent system. In addition, adsorption kinetics and equilibrium studies were performed, and the possible adsorption mechanisms were elucidated.

2. Results and Discussion

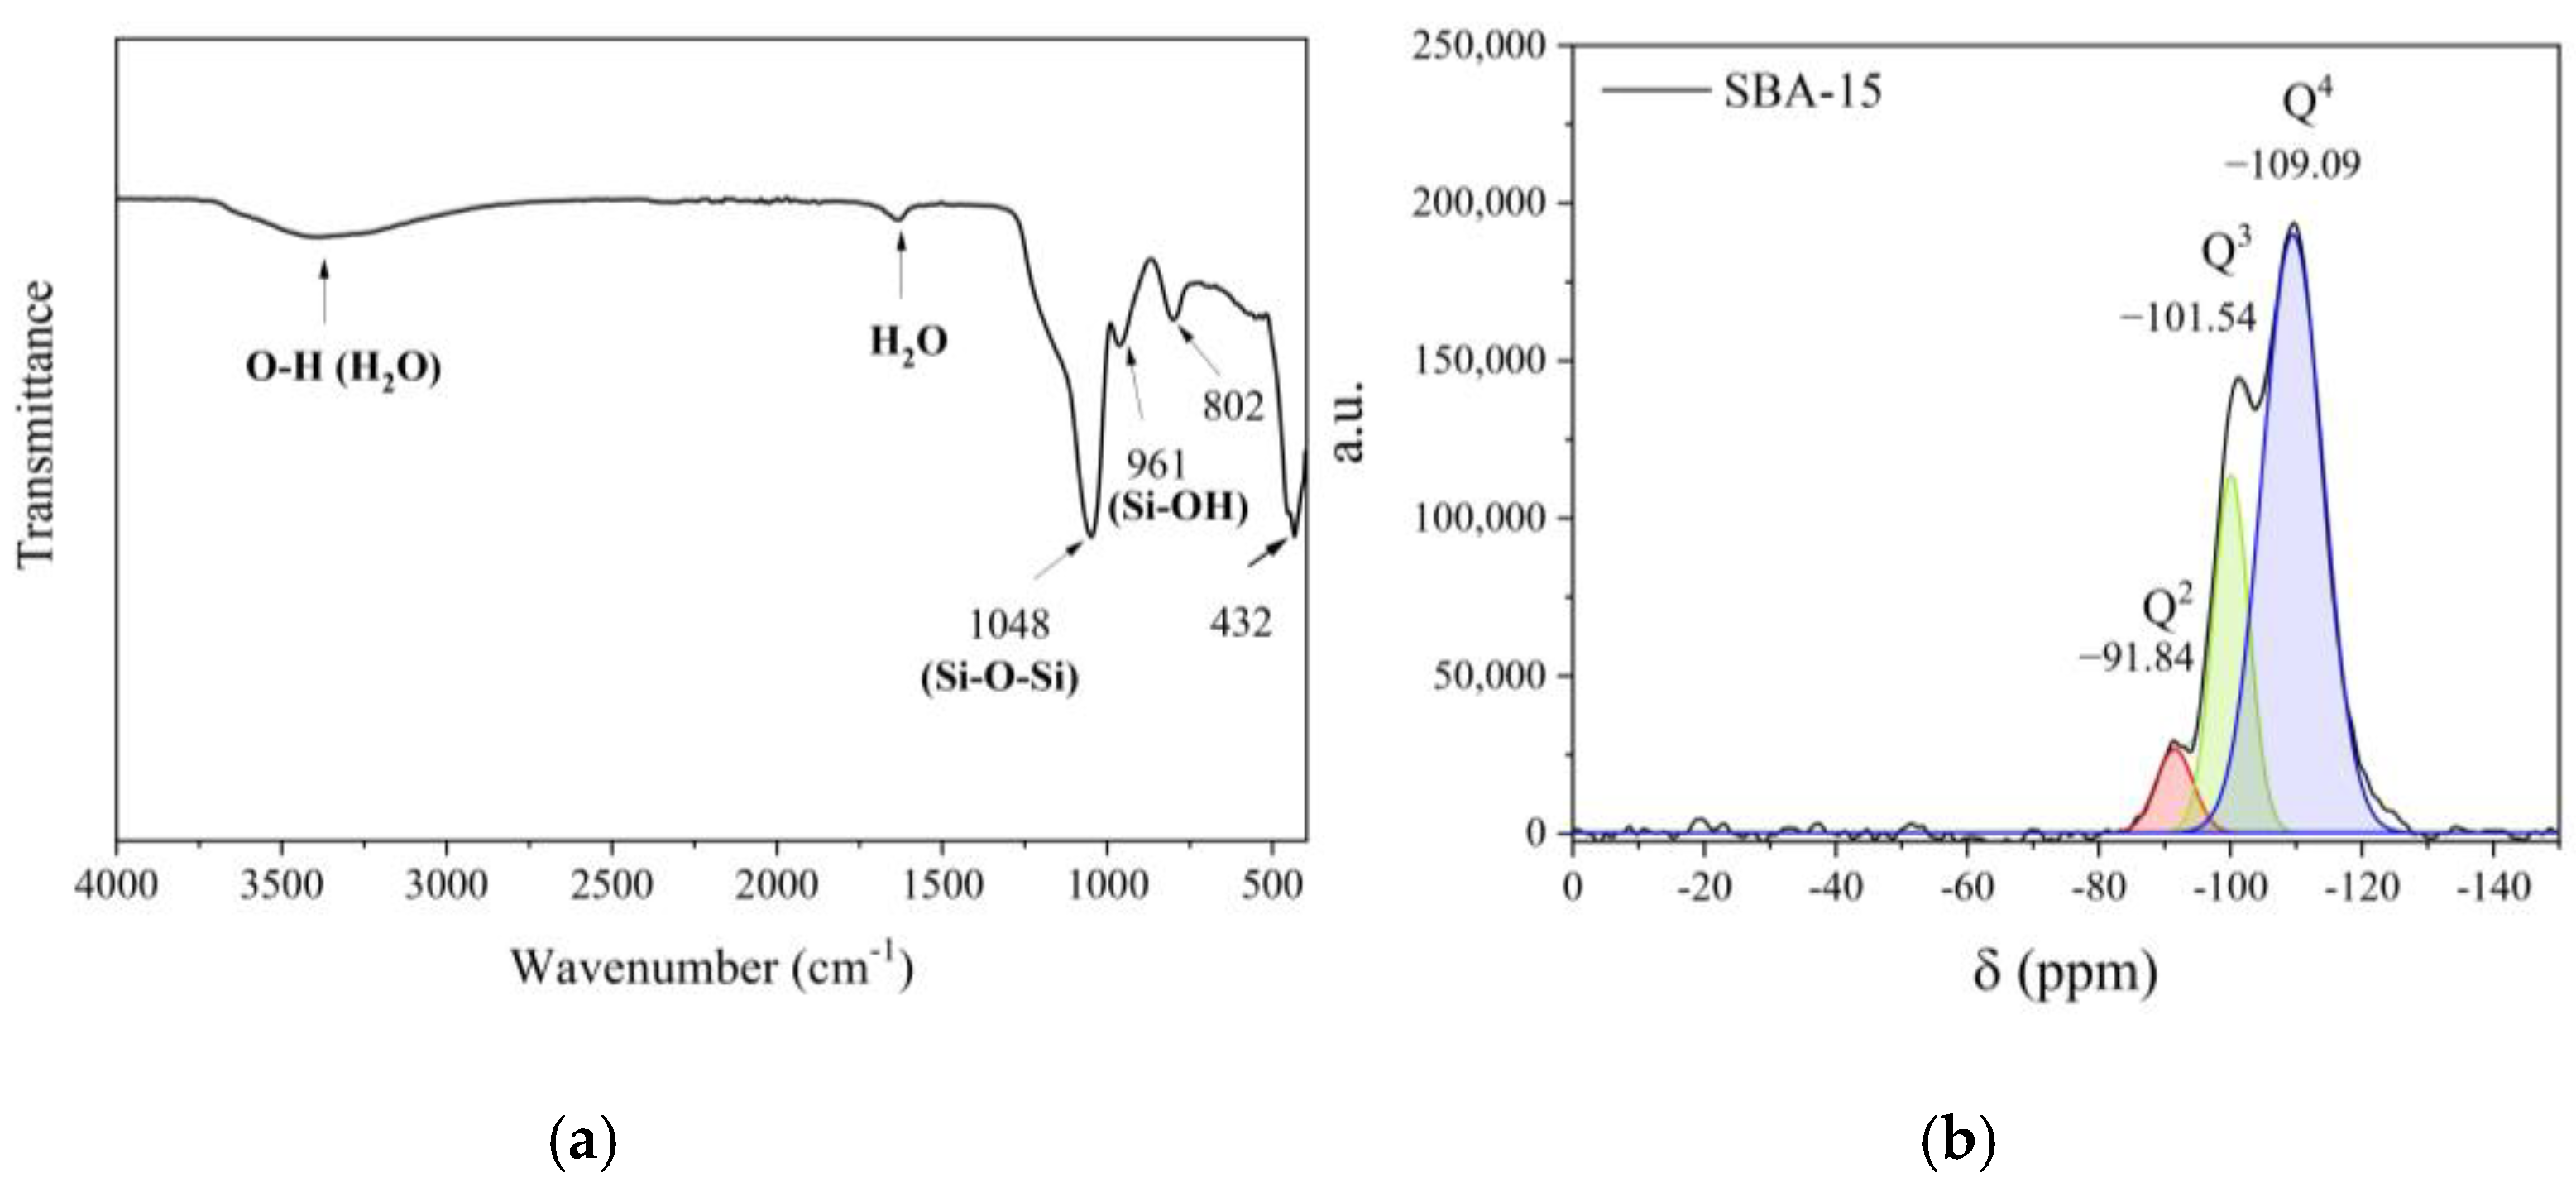
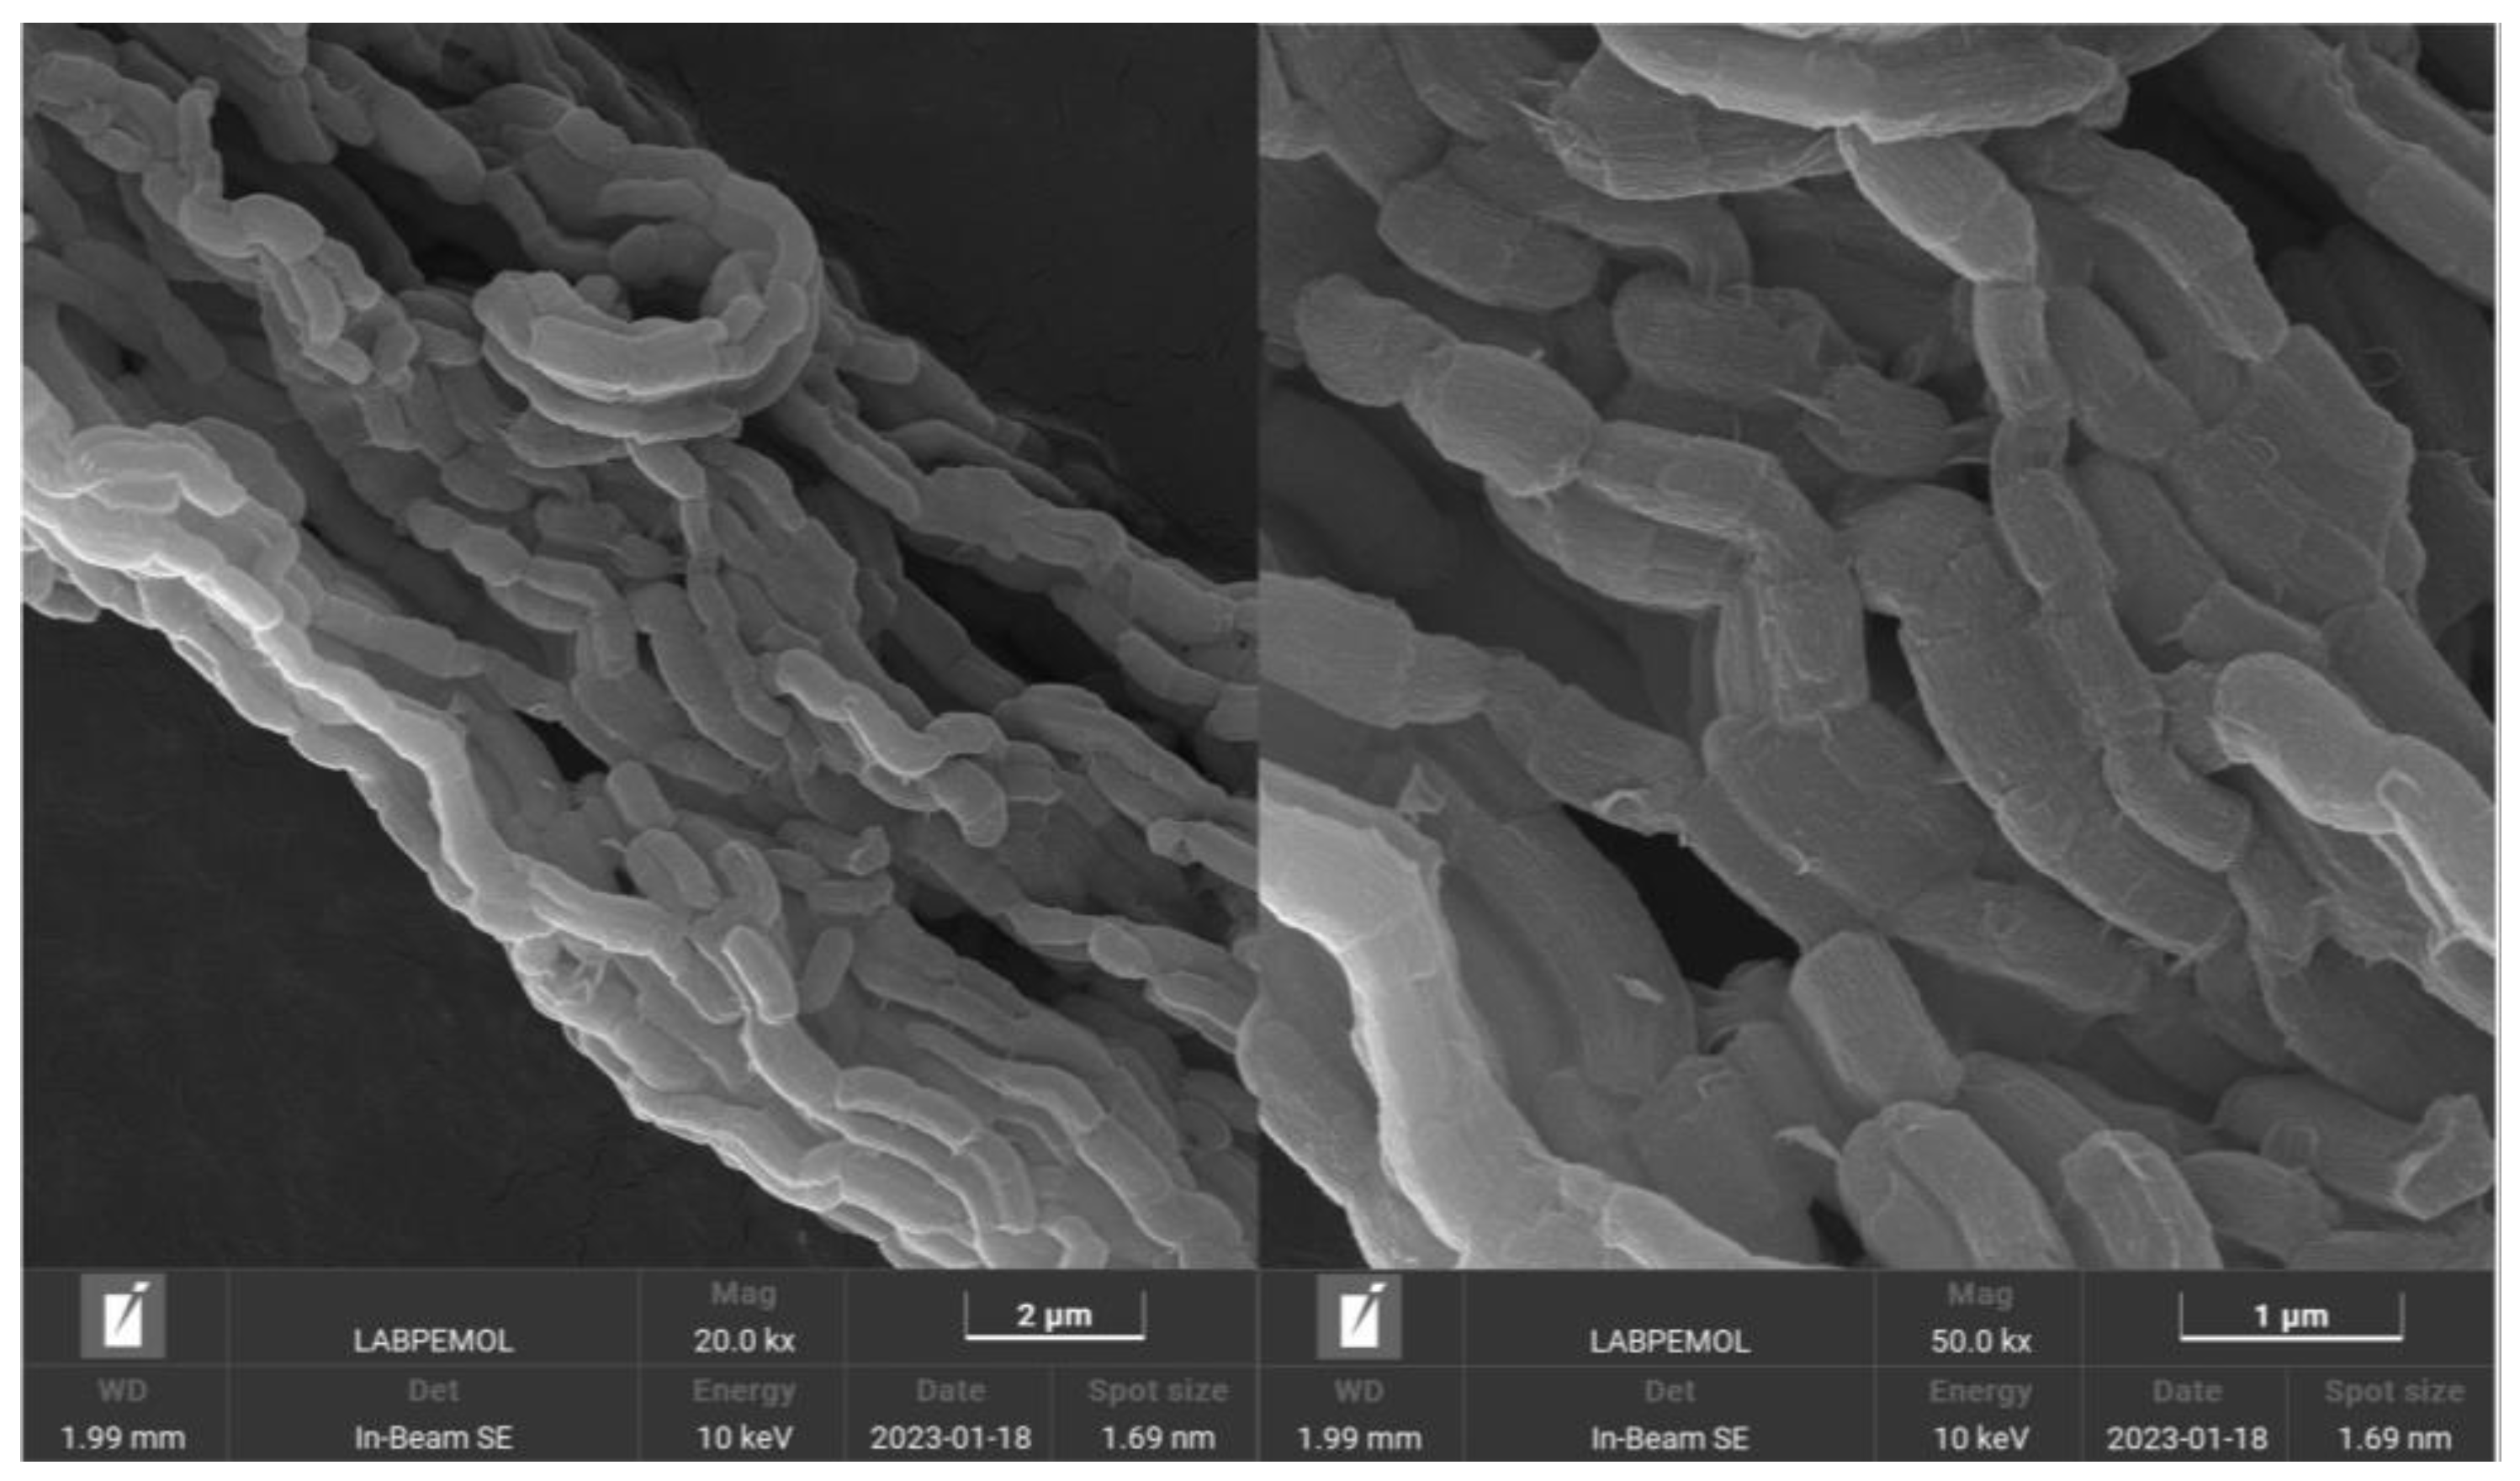
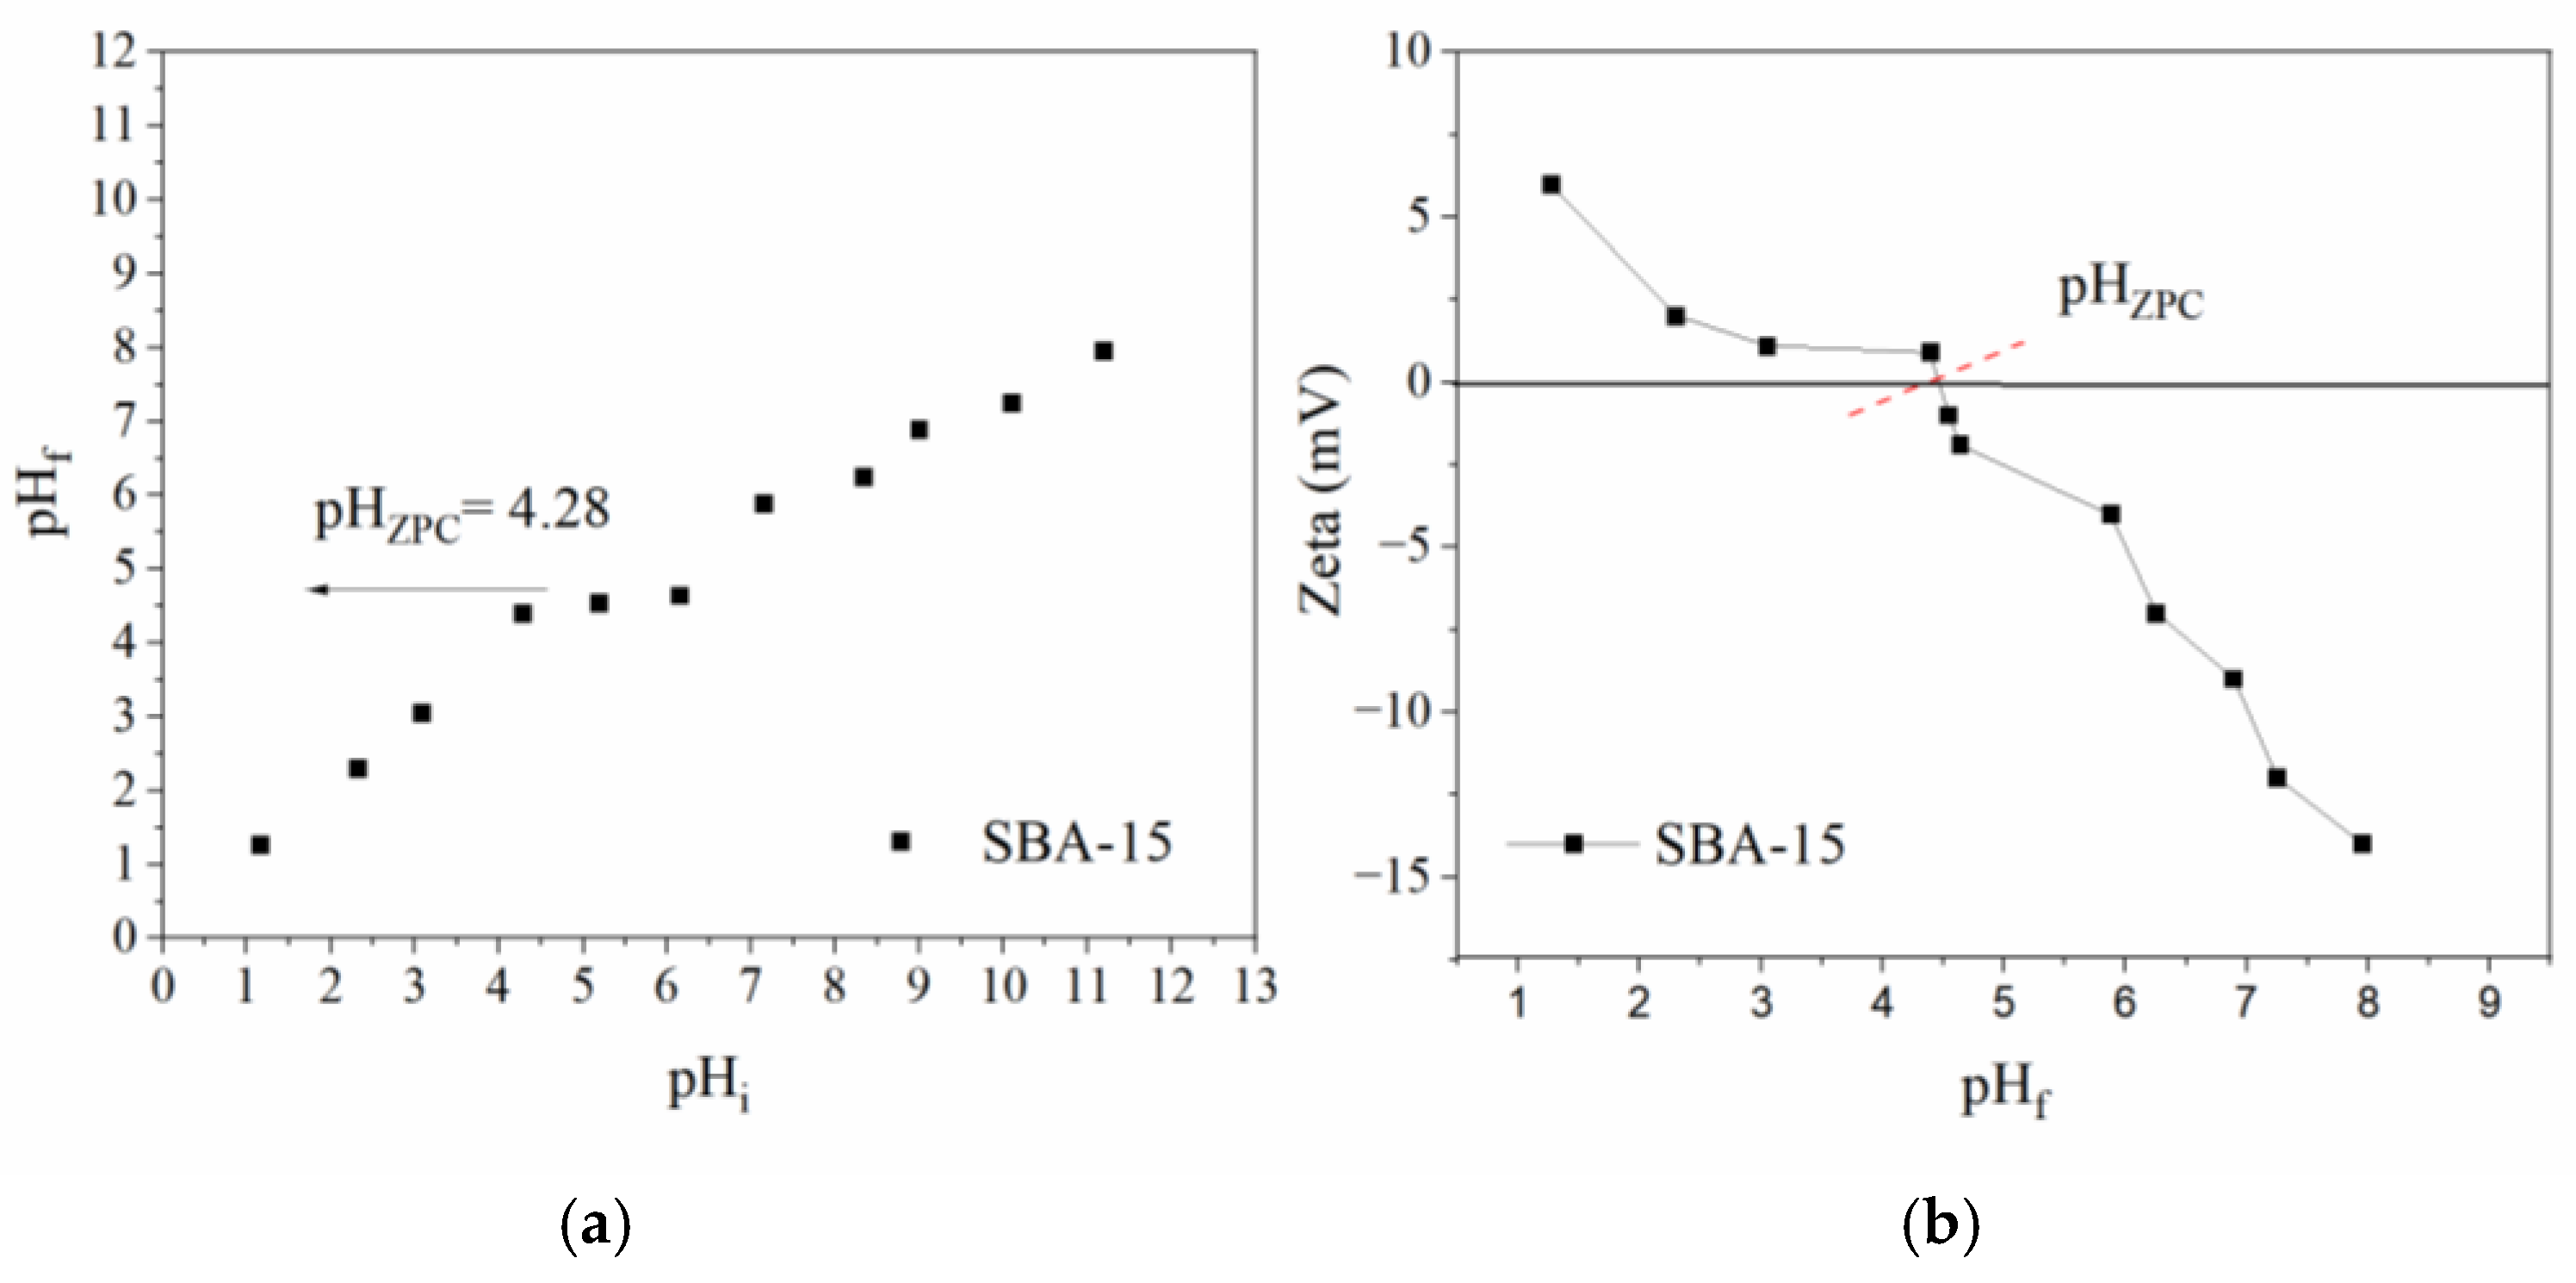
2.1. Characterization of the Nanostructured Mesoporous Material SBA-15

Figure 1a shows XRD for SBA-15 at a low angle, ranging from 0.5° to 5°, where three peaks are observed. The first peak of higher intensity corresponds to the (1 0 0) plane, while the second and third correspond to the (1 1 0) and (2 0 0) planes, respectively [17]. These peaks are characteristic of 2D hexagonal mesoporous structures, as shown in Figure 1b, which exhibits a type IV isotherm with H1-type hysteresis [18]. Table 1 presents the textural properties, with a surface area (SBET) of 688.7 m2 g−1 and a mesoporous volume of 0.731 cm3 g−1. However, the material also contains micropores, with a volume of 0.073 cm3 g−1. Therefore, the external area (representing the mesoporous area) is 504.8 m2 g−1, and the pore diameter is 6.0 nm.
Figure 2a (FTIR spectrum) shows a band at 432 cm−1 representing the Si-O-Si bonds to condensed structure, and the peaks at 802 and 1048 cm−1 are symmetric and asymmetric stretching vibrations, respectively. The peak at 961 cm−1 is attributed to the silanol group (Si-OH) present in the material structure. Figure 2b shows the 29Si NMR with Q4 (−109.09 ppm) peak related to the siloxane group (Si-O-Si). The peaks of Q3 (−101.54 ppm) and Q2 (−91.84 ppm) are from silanol group (Si-(OH)2) and isolated silonals (Si-OH), respectively [19]. Table 2 presents the signal parameters for NMR. Q4 presents the largest area value (63.79%). The areas of Q3 and Q2 present area values of 30.48% and 5.73%, respectively. The silanol group has higher concentrations than isolated silonals, and the surface has more silanol bridges than isolated ones.
Figure 3 shows the SEM images for the SBA-15 material. The fiber morphology consists of smaller particles. This is important for continuous mesoporous channels in all structures. The entire material is organized in one direction with a rough surface. Previous works have shown the importance of morphology for intrachannel diffusion, such as in platelets that have short and striking textural properties [20]. Fiber morphology provides high performance in adsorption processes thanks to its accessibility when compared to other morphologies, such as spheres that have curved mesoporous channels and obstructions in their pores [21,22]. The EDS spectrum (Figures S1 and S2 in the Supplementary Materials) was analyzed to determine the chemical composition of the material. The results confirmed that the material is composed exclusively of Si and O species, indicating its constitution as SiO₂, consistent with the findings reported in the literature [23].

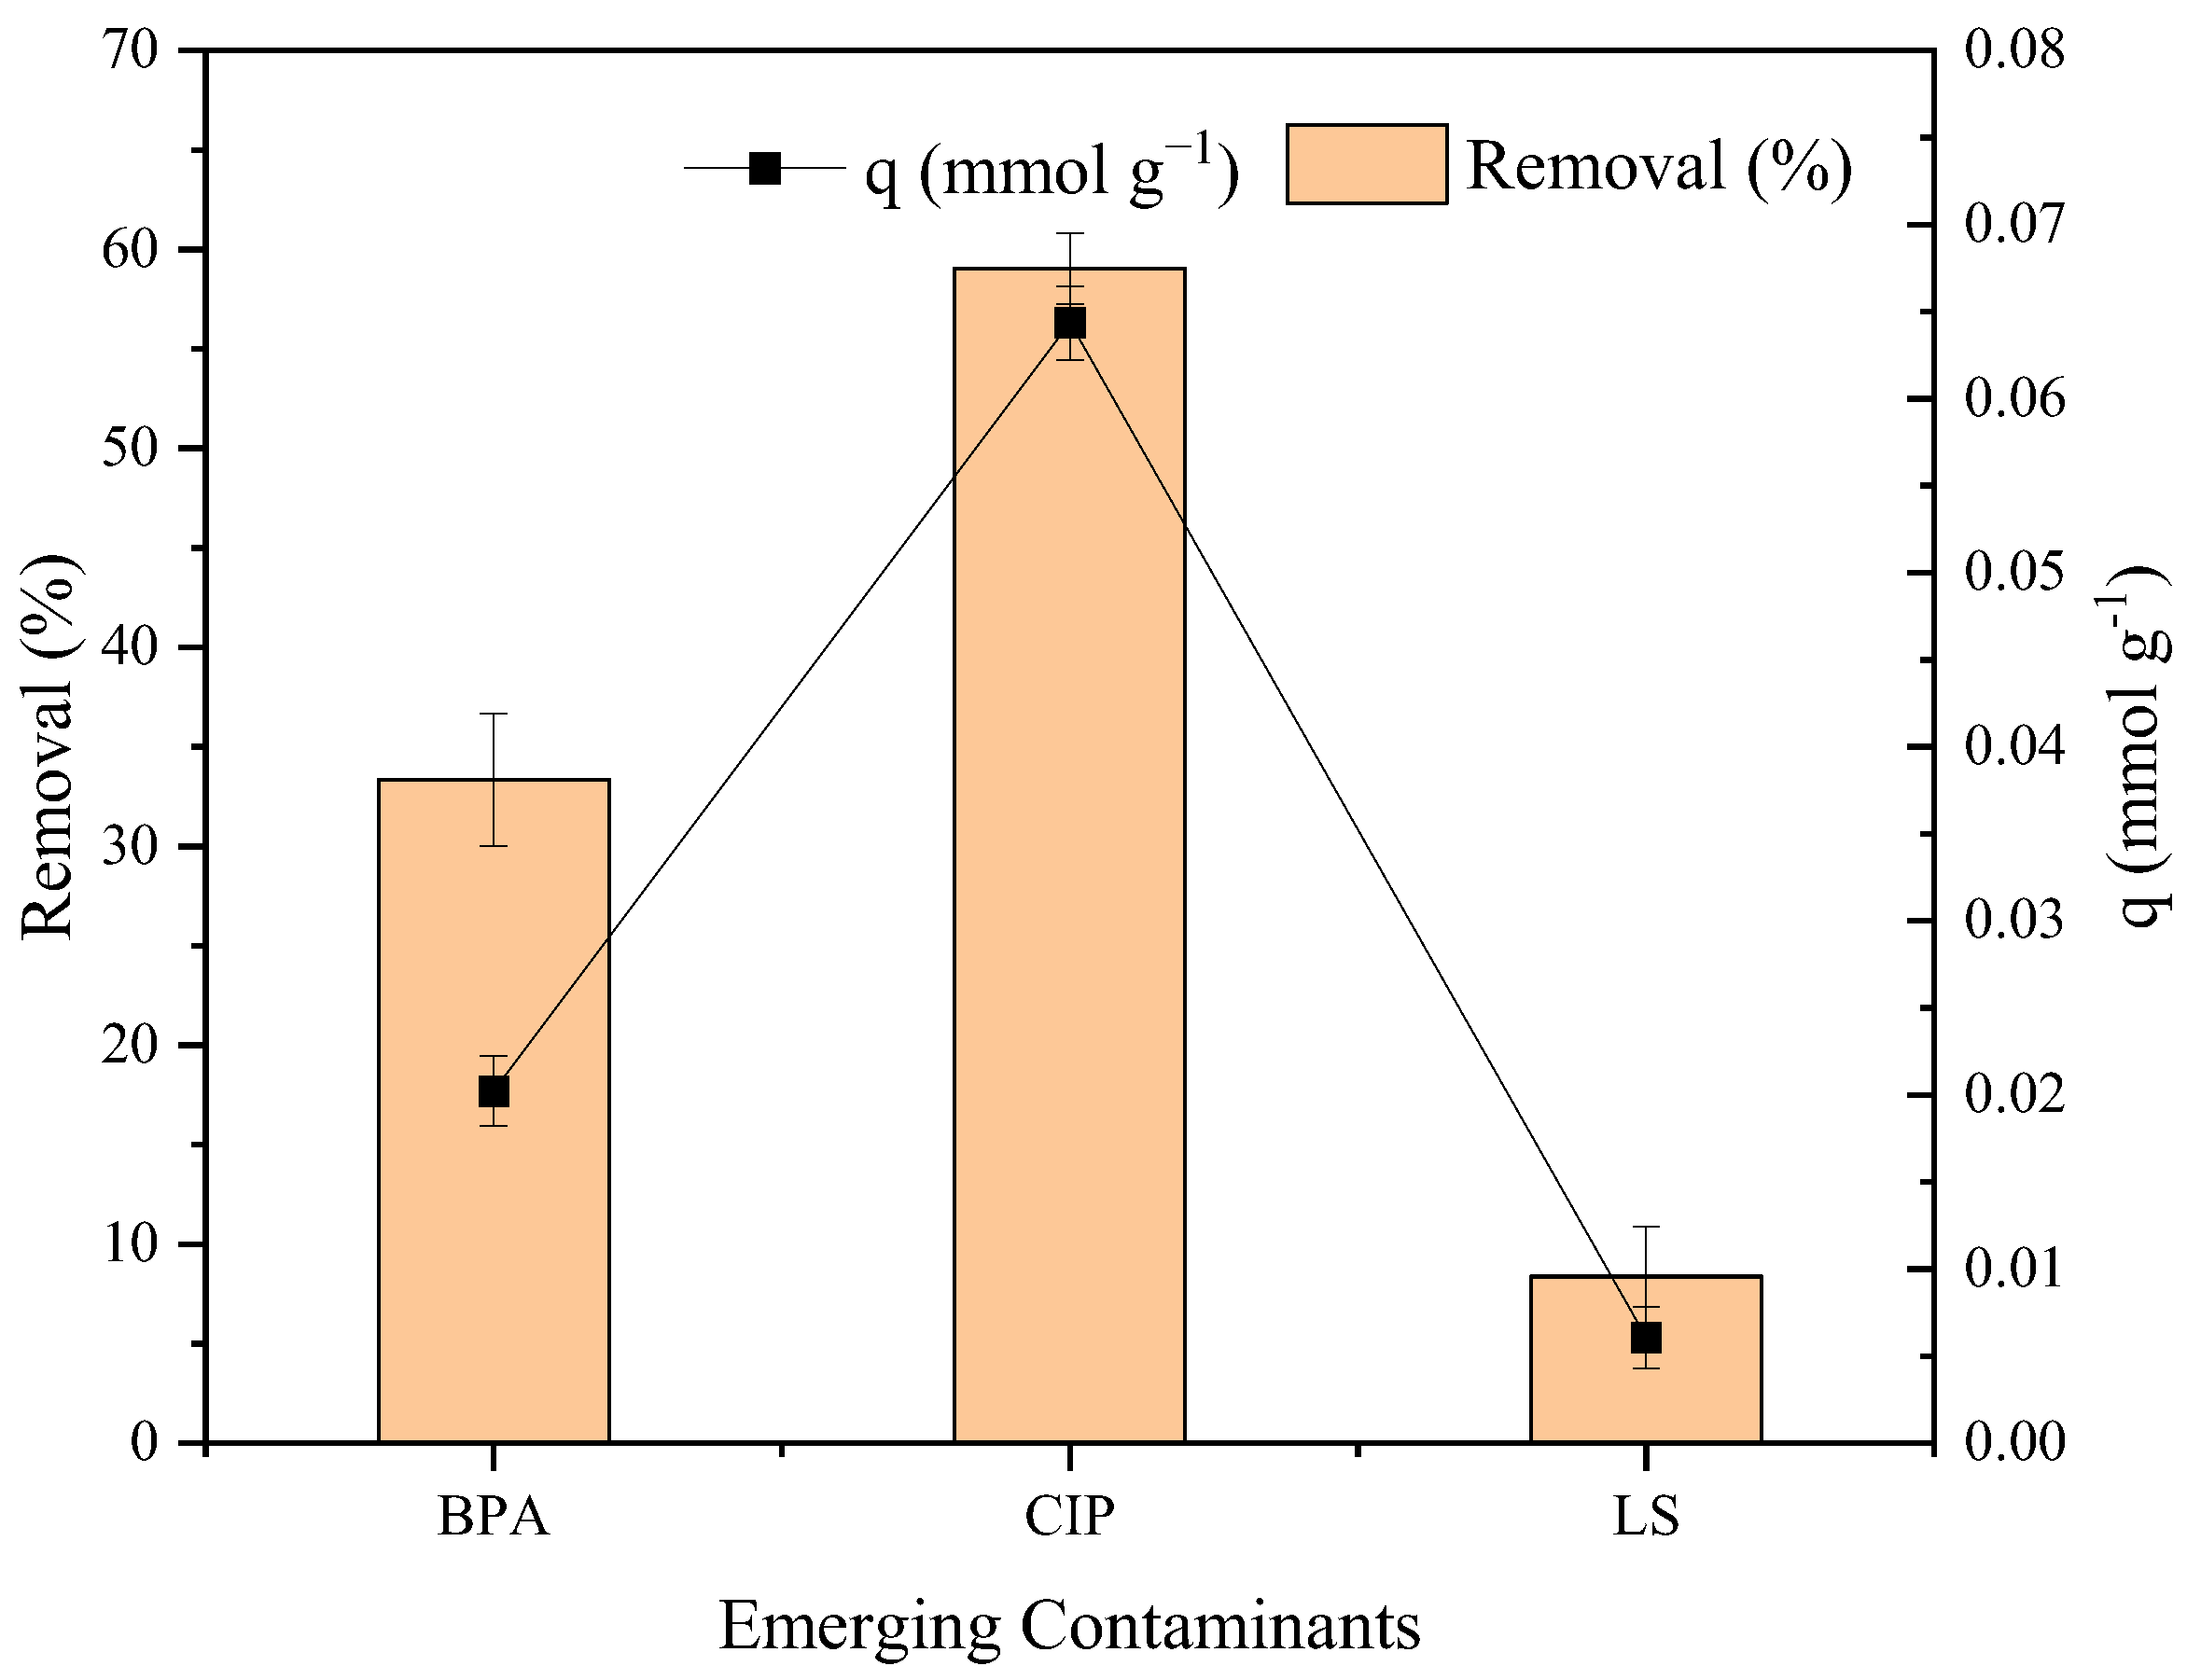
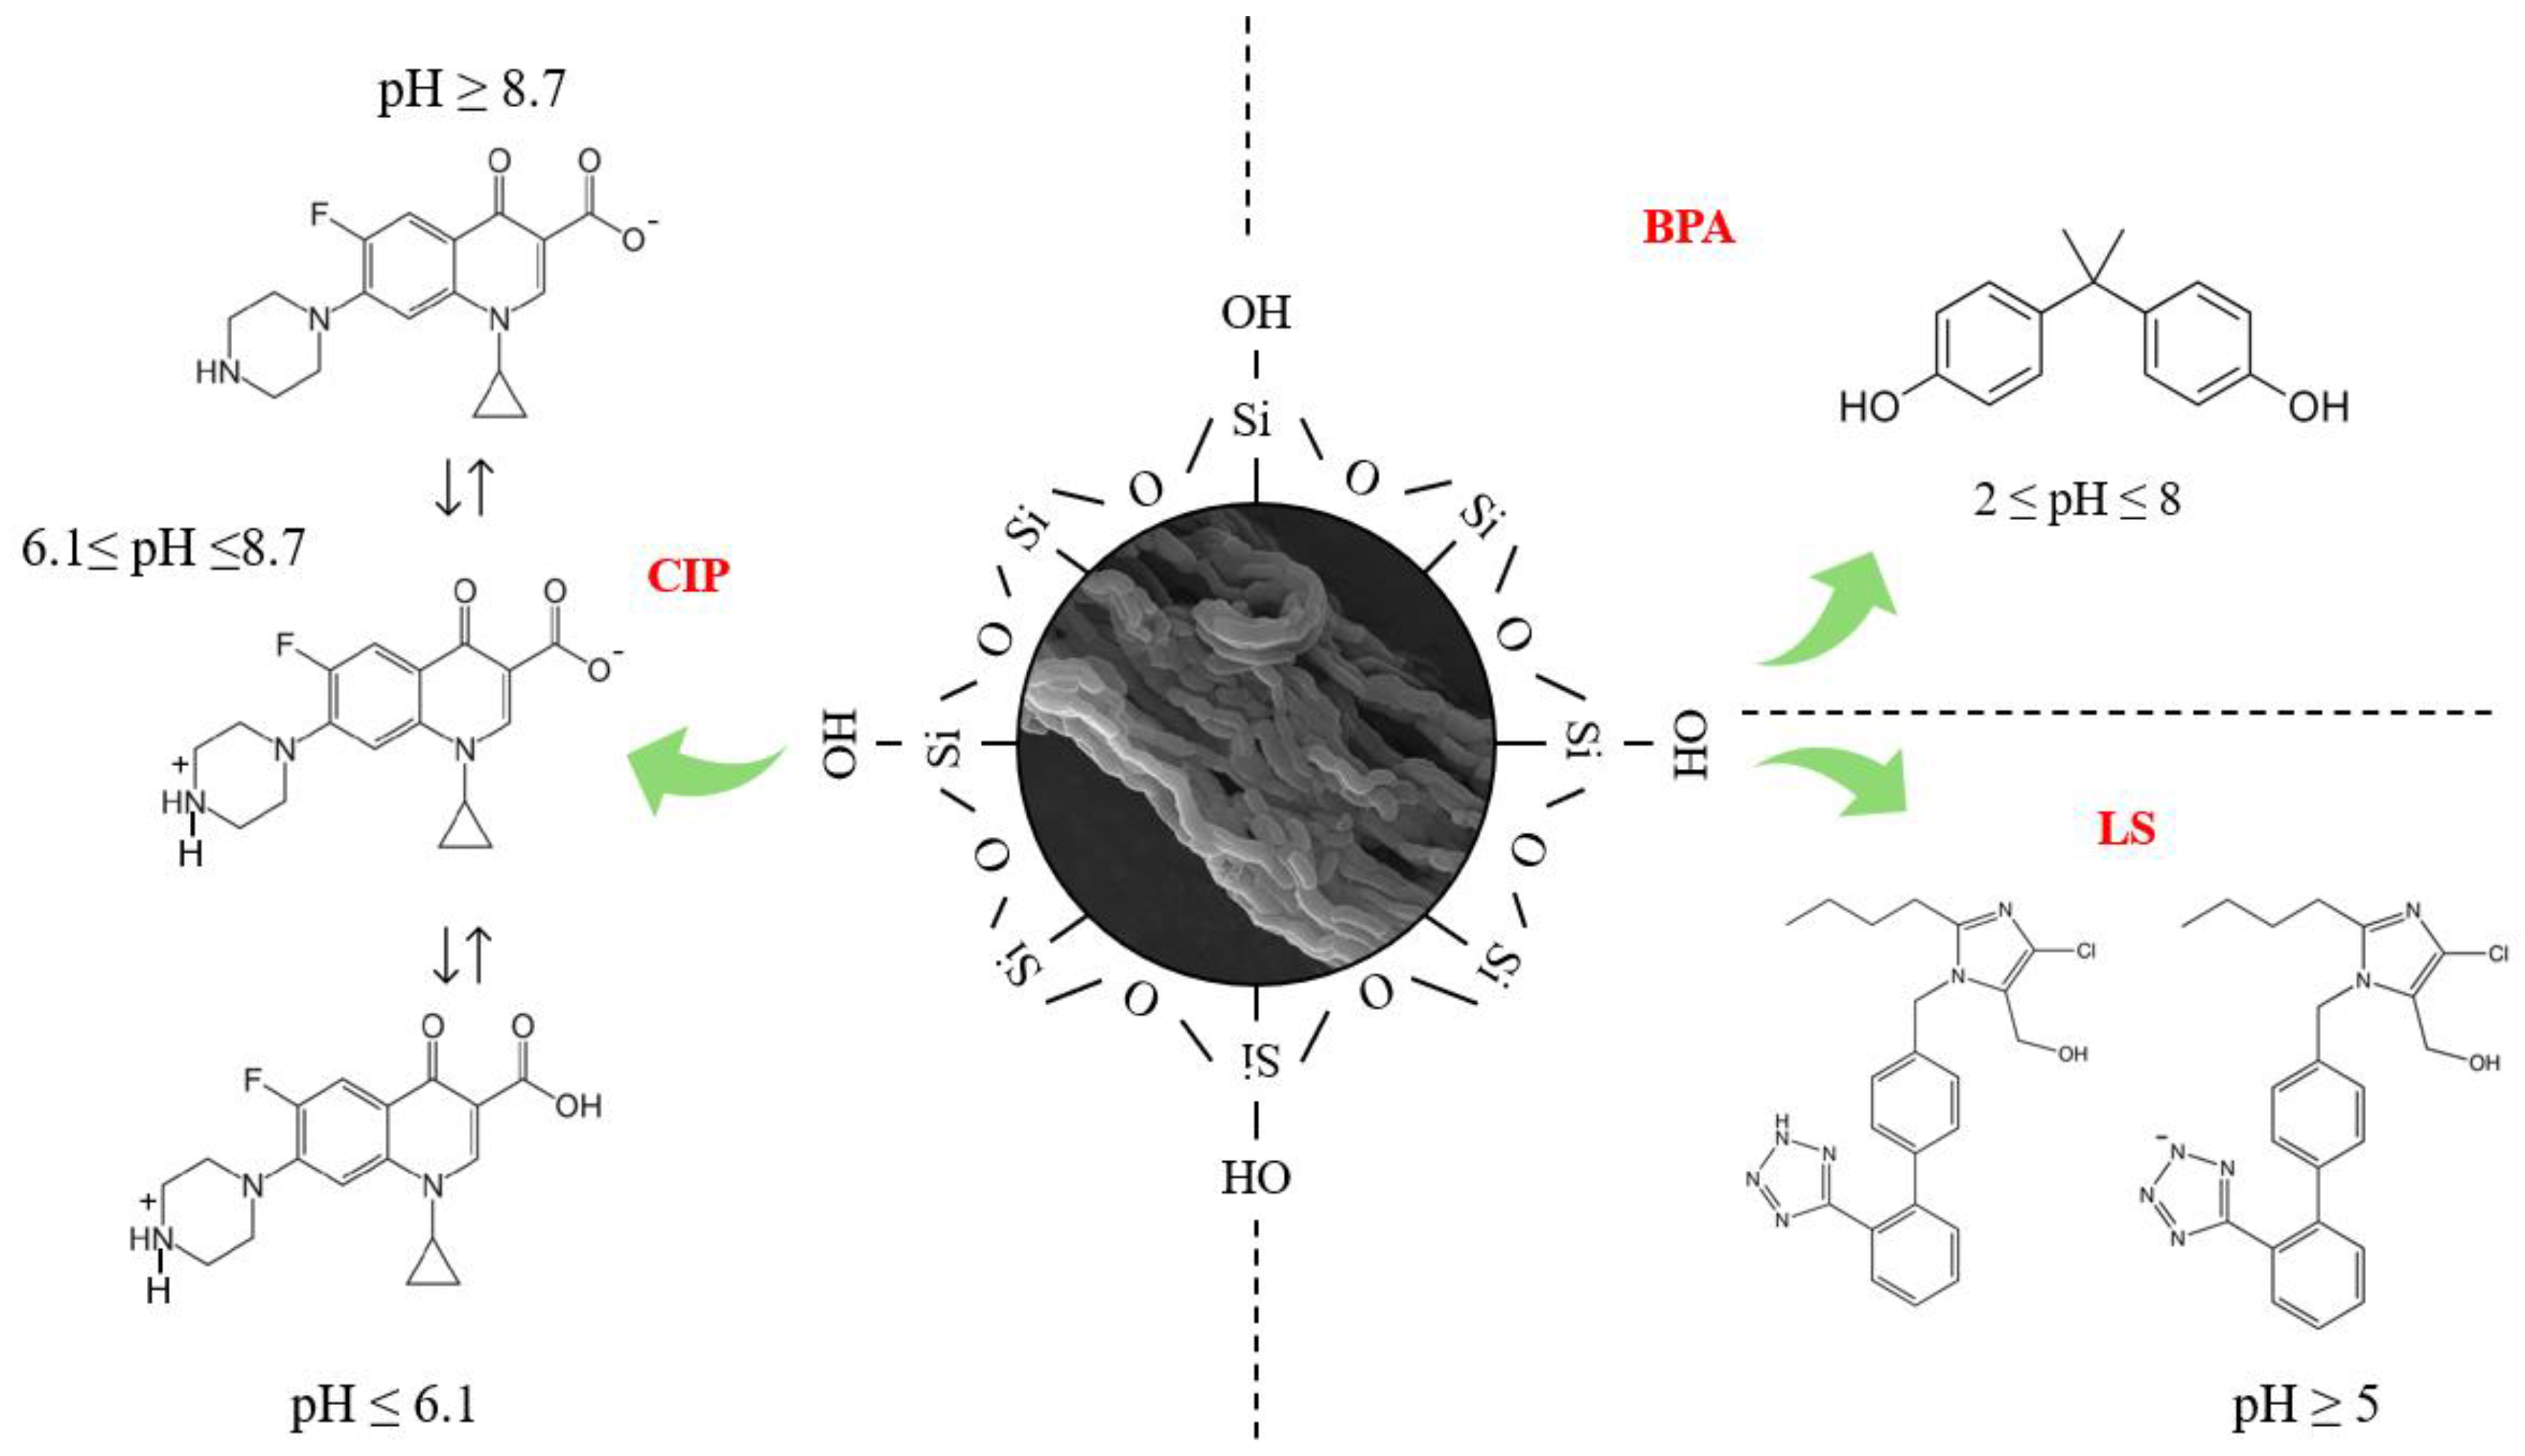
2.2. Affinity and Adsorption Mechanism

Figure 4 shows the affinity test for the adsorption of bisphenol A (BPA), ciprofloxacin (CIP), and losartan (LS) on SBA-15. CIP presents the best performance, with a maximum %R of 60% and an adsorption capacity (q) of 0.0644 mmol g−1. BPA presents a removal of 33% and q of 0.0202 mmol g−1. LS presents lower values than the other two molecules, with a removal percentage of 8% and a q of 0.0060 mmol g−1.
Compared to other materials, SBA-15 exhibits satisfactory adsorption performance. For example, clinoptilolite zeolite and pumice achieved removal rates of 51% and 25%, respectively, for CIP [20]. Activated carbon, previously tested for this contaminant, showed a value to q of 0.0111 mmol g−1 [21]. Kaolinite material shows 0.02 mmol g−1 for ciprofloxacin [22]. This may indicate that the material used in this work performed excellently for this contaminant.
Figure 5 shows the adsorption mechanism for BPA, CIP, and LS in the mesoporous channels of SBA-15. All experiments were conducted in ultrapure water at a pH of 5 without any pH control. It is important to understand how each molecule interacts with SBA-15. BPA remains unchanged at pH levels between 2 and 7, and hydrogen bonds are formed through interaction with silanol groups (Si-OH) present on the adsorbate surface [24]. LS carries a negative charge at a pH close to 5, interacting with the siloxane group due to its partially positive charge on Si. However, repulsive forces arise between LS and the silanol group due to the negative charge on OH, which hinders the adsorption process [25]. CIP can exhibit three distinct forms according to the solution’s pH. At a pH ≤ 6.1, it acquires a negative charge due to the amine group being in protonated form (cationic form) [26]. At a pH ≥ 8.7, it is in an anionic form due to the deprotonation of the carboxylic acid group in the structure of the molecule [27]. Between a pH of 6.1 and 8.7, it is in an isoelectric state because CIP is a zwitterionic compound [28]. At a pH close to 5, this molecule presents electrostatic interactions with Si-O-Si and Si-OH, which have a great impact on the adsorption process, allowing adsorption at different sites.
Figure 6a shows the determination of SBA-15′s zero-point charge using NaOH as an electrolyte to determine ionic strength and pH, with a range of 1 to 11. The plateau is observed at a pH of 4.28, this indicates the pHZPC region. Some studies have indicated the regions at a pH of 4 [29], and a pH of 5.2 in a material with different synthesis parameters [30]. This material presents a positive charge in the pH region of 1 to 4 and a negative charge in the pH region of 5 to 8 (Figure 6b). Previous works have shown the same regions for this charge on the SAB-15 surface [31,32]. This is important to the adsorption process; the CIP presented higher adsorption in the mesoporous channel at a pH close to 5, which indicates that the molecule has a positive charge and SBA-15 presented a partially negative surface, causing an attraction between the charges.
Therefore, the best adsorbent/adsorbate system was chosen to continue this study, with the evaluation of kinetic and equilibrium tests, in addition to thermodynamic calculations and simplified batch design. The chosen system was the one formed by the antibiotic ciprofloxacin and SBA-15.

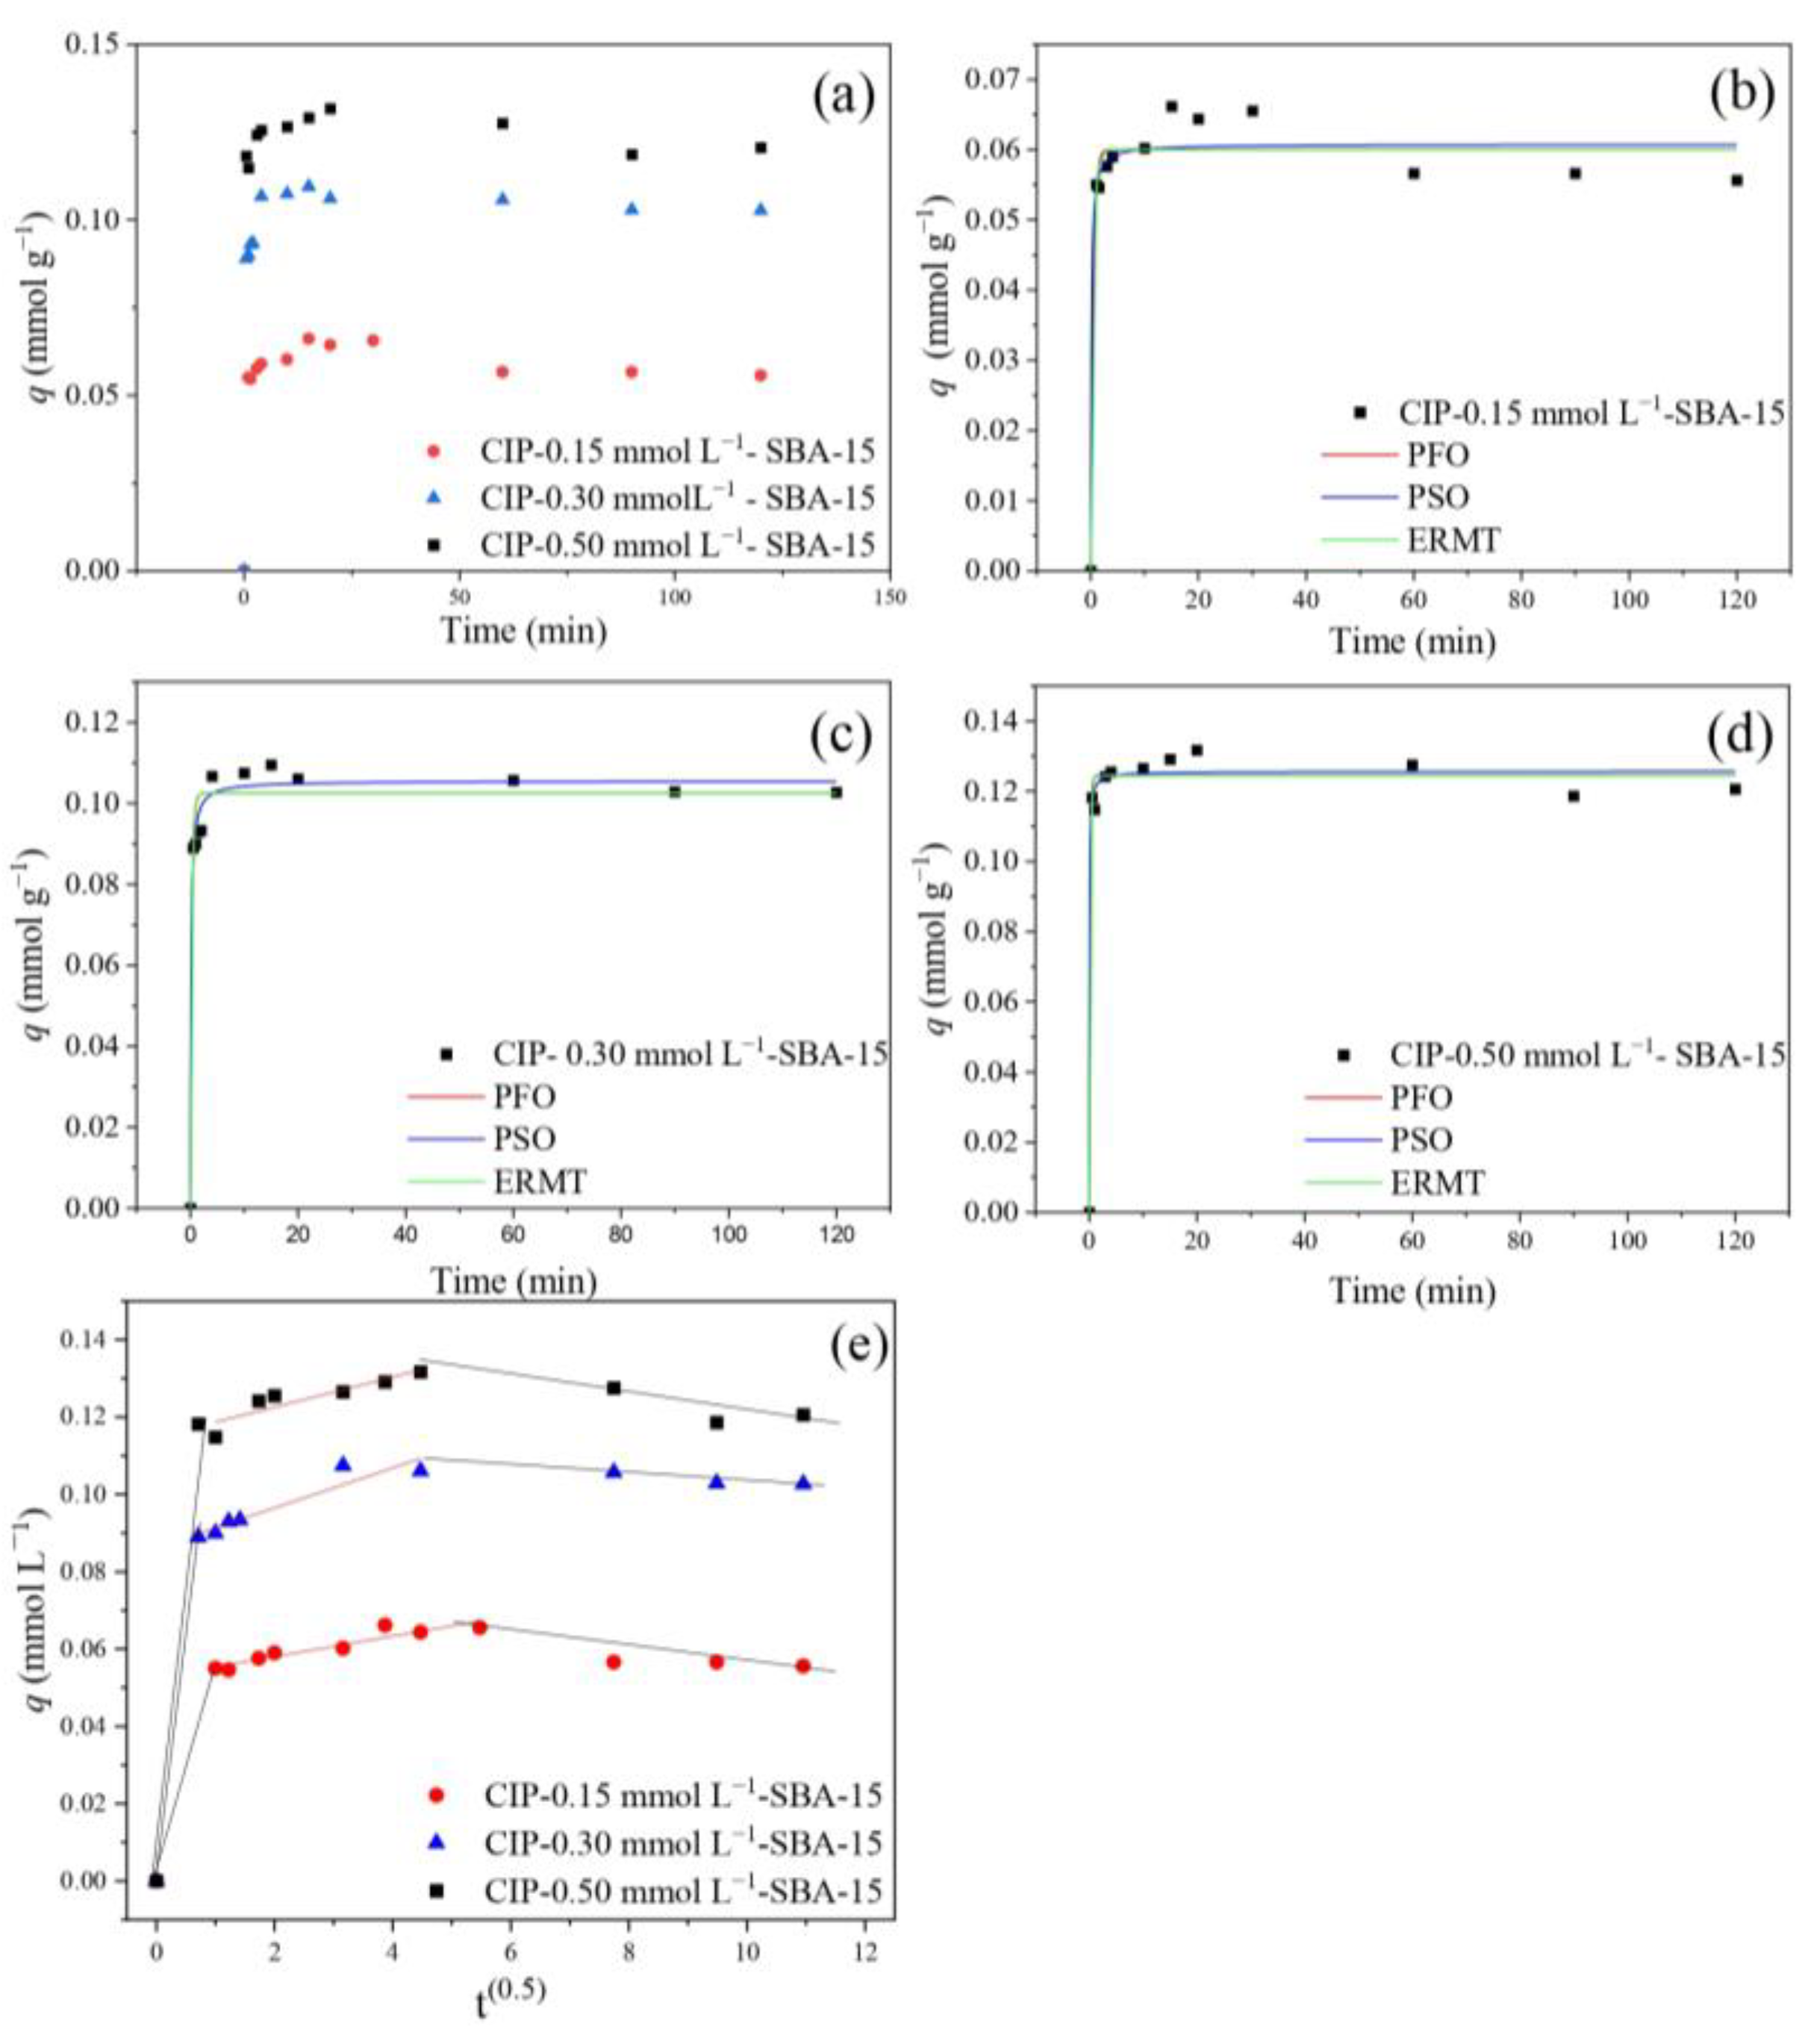
2.3. Kinetic Study to Adsorption of CIP

Figure 7 illustrates the curves of CIP adsorption on SBA-15 at 0.15, 0.30, and 0.50 mmol. L−1. The system exhibited an equilibrium time of 20 min, showing excellent performance at the beginning of adsorption and continuing until the saturation plateau. The adsorption capacity has a linear growth as the initial concentration increases. The q at equilibrium for 0.15, 0.30, and 0.50 mmol L−1 is 0.0644, 0.1061, and 0.1317 mmol g−1, respectively.
Regarding the time to reach the saturation plateau, the material in this study demonstrated faster results compared to others [33,34,35,36]. Wu et al. [37], for example, studied the use of mixed oxides, which presented times ranging from 60 min to 600 min. Similar results were found by Tran et al. [38] with a chitosan/biochar hydrogel sphere. The authors also found times to reach the equilibrium plateau between 60 and 600 min. Montmorillonite was studied by Wu et al. [39] and presented an equilibrium time of 60 min at different initial concentrations, indicating slower adsorption.
Figure 7b–e show the fit to the PFO, PSO, ERMT, and IP models. Table 3 shows the model parameters applied to experimental data. The PFO model presented an estimated adsorption capacity at equilibrium (qe) of 0.06, 0.102, and 0.122 mmol g−1 for initial concentrations of 0.15, 0.30, and 0.50, respectively, and the PSO model presented 0.061, 0.106, and 0.126 mmol g−1 for these concentrations. The PSO model presented the best R2Adj; however, the PFO model presented lower AICc values (corrected Akaike criteria). This may indicate that adsorption may occur through chemical interactions at the active sites on the SBA-15 surface. Furthermore, physical adsorption is also present in the process, with intraparticle diffusion in the mesoporous channels [40]. The mean relative deviation (MRD) was calculated to obtain statistical data from the presented models.
Some models are important to describe adsorption control mechanisms. For this purpose, the IPD and EMRT models were adjusted to the experimental data. The IPD model presents multilinearity and the second region is the most important since it represents diffusion within the pores. The lowest value for R2Adj indicates that the diffusion process cannot describe the limiting phase [41]. The EMRT presents higher values for R2Adj for all concentrations, indicating a satisfactory adjustment. The KTM (decay of the diffusion rate of the outer film) increases with increasing initial concentration. This may suggest that there is a resistance in the outer film that limits the adsorption process [37,42]. This behavior aligns with the increasing thickness of the diffusion boundary layer at higher concentrations, which impacts the adsorption rate.
Analysis of the fitted models shows that although chemical interactions at the active site on the material surface are an important factor, the resistance to external mass transfer also affects the adsorption process, especially at higher initial concentrations, where the effect of the diffusion boundary layer becomes evident. The choice between models should therefore consider both the nature of the adsorbent interactions and the effects of the physical transport.

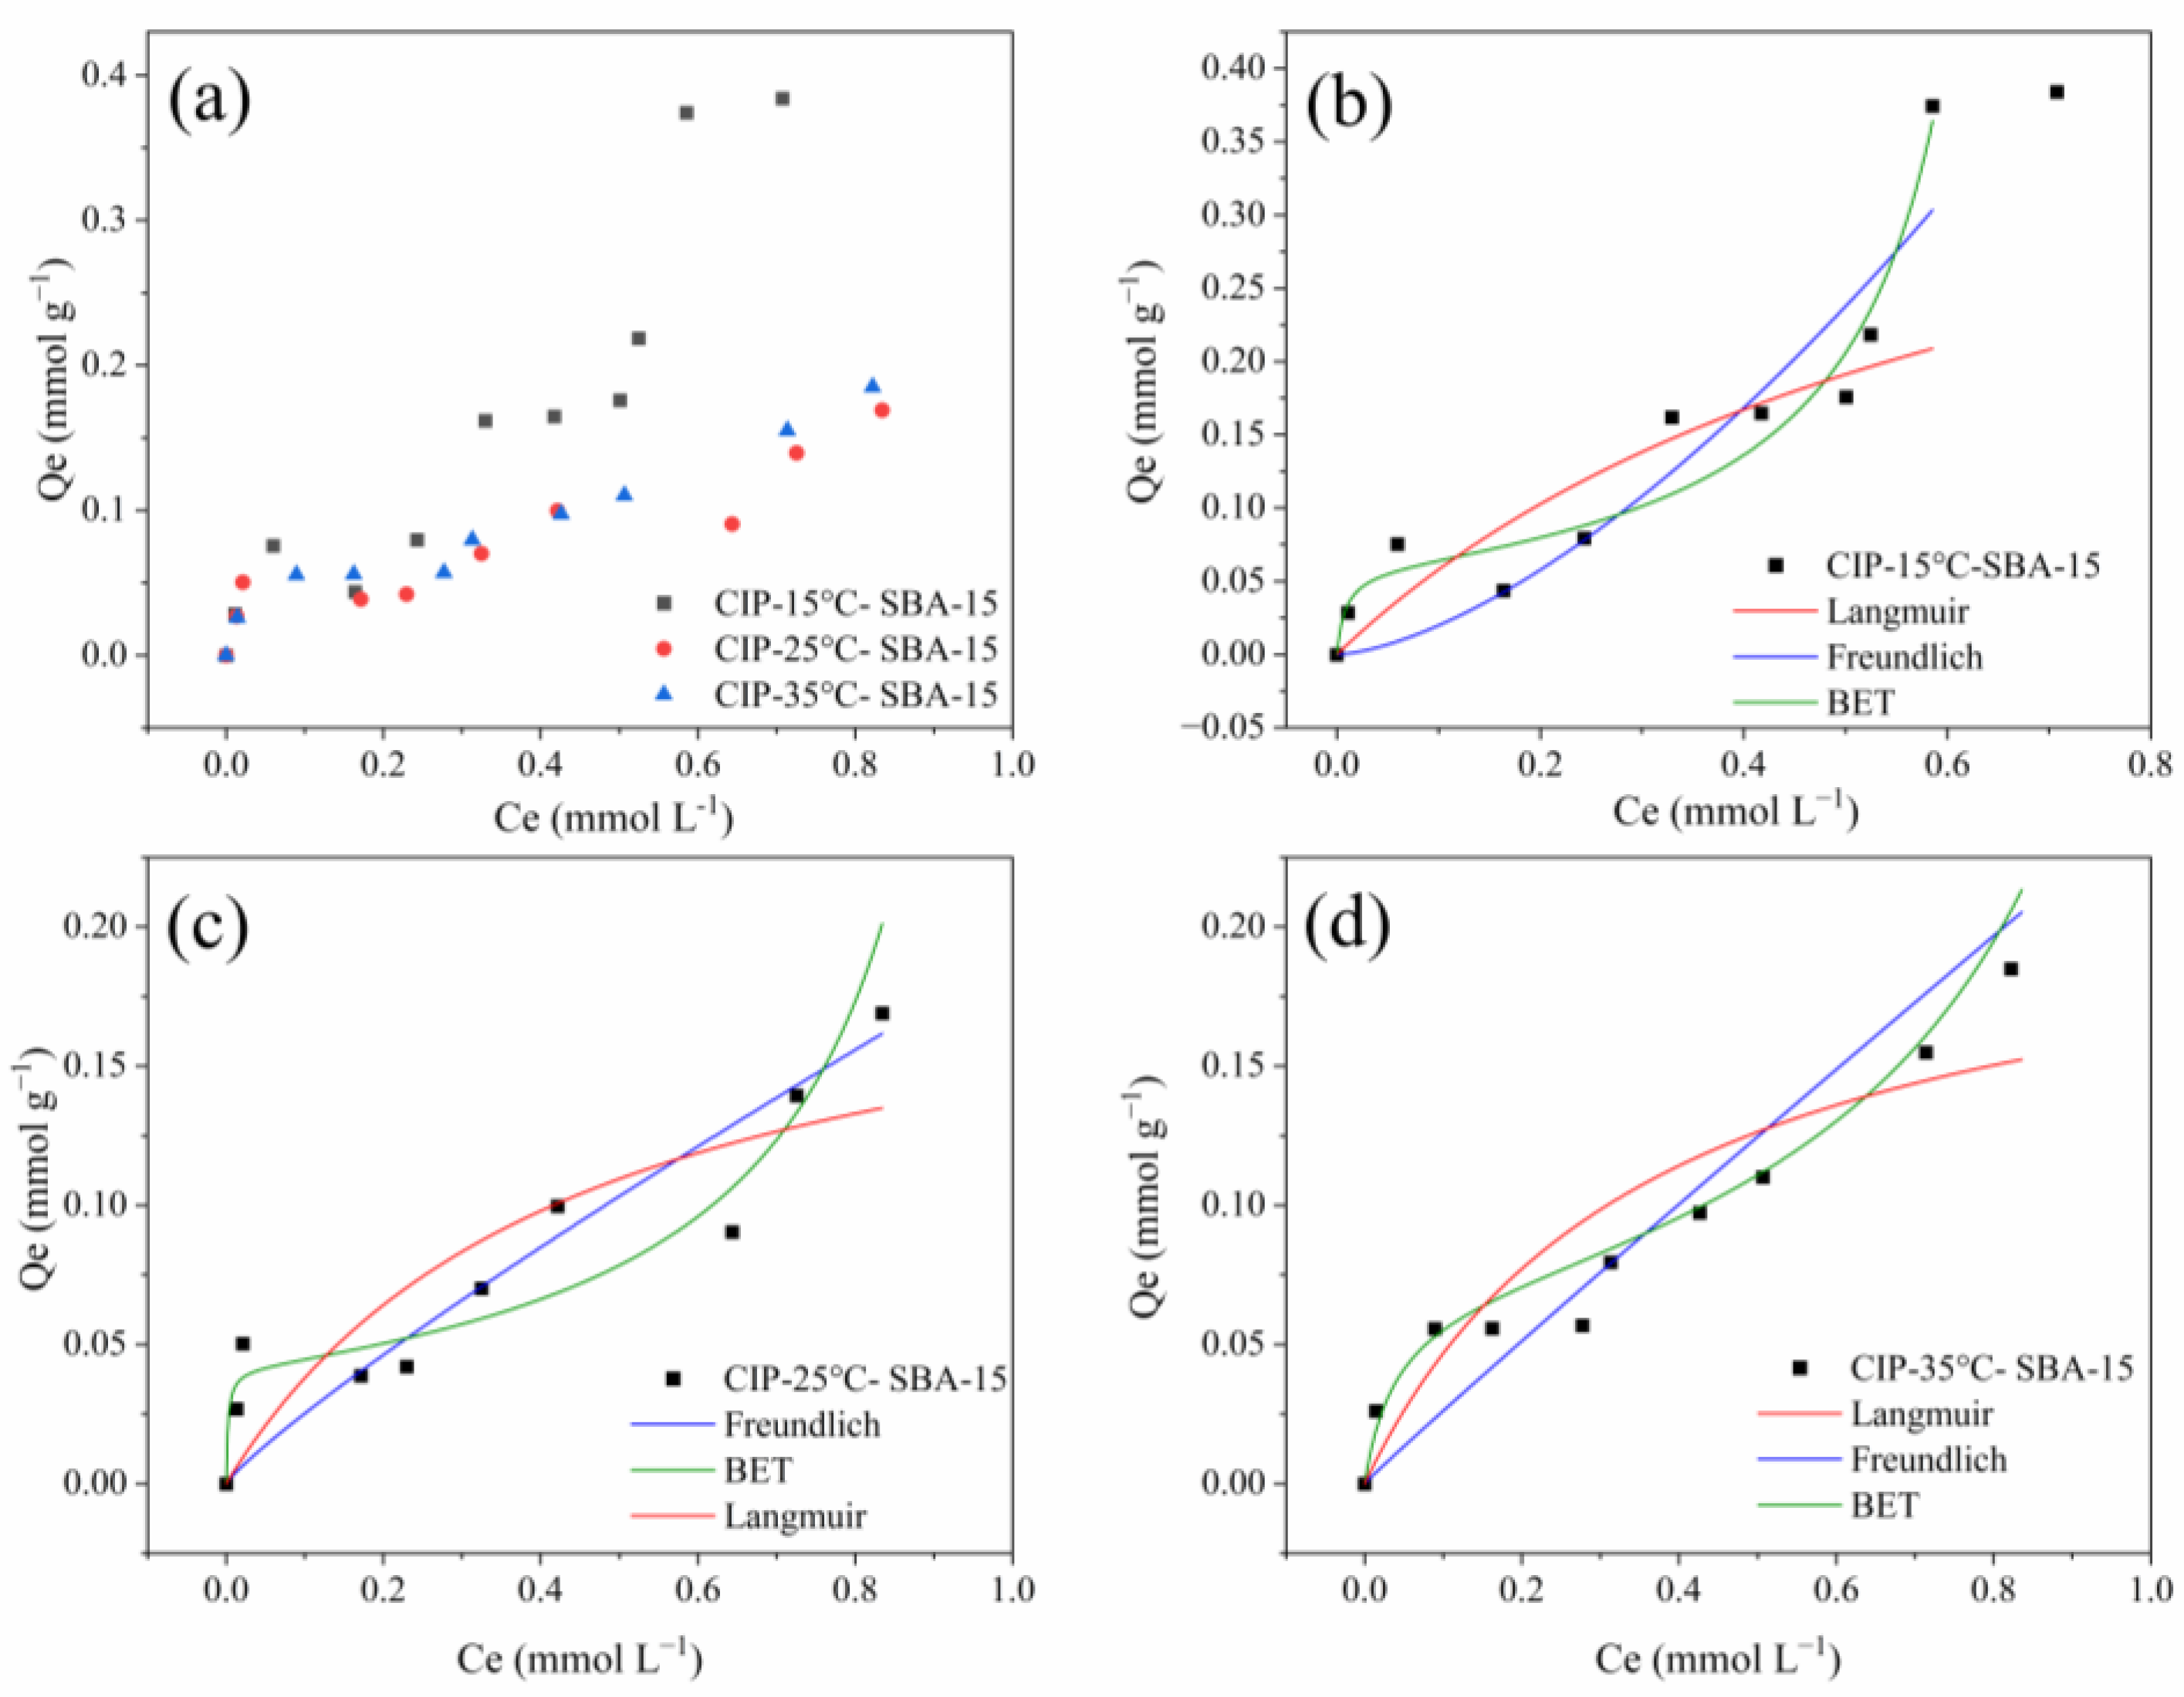
2.4. Equilibrium Isotherm

Figure 8 presents the graph of the isotherms obtained at 15 °C, 25 °C, and 30 °C. This adsorption process presents an increase according to temperatures, which may indicate that the process exhibits exothermic behavior [43]. Figure 8b–d show the models fitted.
All parameters of models applied to experimental data are described below (Table 4). The isothermal profiles suggest that the material may not be fully saturated and higher qL (Langmuir model) may confirm this when compared to the experimental (qmax) [44]. The n (Freundlich parameter) was <1 for 25 and 35 °C and >1 for the temperature of 15 °C. This may indicate that the interactions have lower energy at higher temperatures and physical interactions may be present. However, for the lowest temperature evaluated, there is higher energy, and chemical interactions may be involved [45]. The B.E.T. model shows a satisfactory R2Adj for all temperatures (>0.9), suggesting multilayers with diverse interaction sites. The qb value (monolayer) was between 0.0059 and 0.068 mmol g−1. However, from the AICc values, it is possible to observe that the B.E.T. model is the one that best describes the system at a temperature of 15 °C.
The Langmuir model clearly does not describe the adsorption process as presented by the equilibrium curves. Table 5 presents a comparison of qL (Langmuir model) across distinct adsorbents, along with all the adsorption parameters for CIP adsorption. It can be noted that this work presents the shortest equilibrium time, only 20 min, and achieves a promising qL. A similar material, MCM-41, was evaluated by Lu et al. [41], and presented a time of 60 min and a qmax value of 0.210 mmol g−1, close to that achieved by the evaluated SBA-15. Carbon-based materials were also evaluated for CIP removal. In general, these materials took a long time to reach equilibrium and achieved lower qL values.
Table 5. Comparison of Langmuir qL and adsorption parameters for different adsorbents.
MaterialqL
(mmol g−1) 1
Dosage
(g L−1)
Equilibrium Time (min)Initial Concentration (C0) (mmol g−1) 1Temperature (°C)Reference
SBA-150.2071.5200.01–1.5025This work
MCM-410.2101.5600.03–0.9025Lu et al. [41]
Functional silica aerogel0.1761.5900.015–0.3825Sert Çok et al. [46]
Bulk pomegranate peel0.016102400.03–0.3625Hamadeen et al. [47]
Activated Carbon (Mangosteen Peel)0.0900.75600.15–1.2025Tran et al. [38]
Chitosan/biochar hydrogel beads0.24256000.015–0.5030Afzal et al. [48]
Chitosan/Kaolin/Fe3O40.1440.75600.03–0.6025Ma et al. [49]
1 Conversion of mmg g−1 to mmol g−1.
Table 6 exhibits the thermodynamic parameters computed from experimental isothermal data at 15°, 25°, and 35°. This process exhibits exothermic behavior, characterized by heat dissipation [50]. The enthalpy change (ΔH°) for the adsorption process is negative (−89.208 kJ mol⁻¹), indicating energy release [51,52]. The adsorbed state of ciprofloxacin (CIP) is more ordered due to the loss of molecular degrees of freedom during adsorption, resulting in a negative entropy change (ΔS°) [53]. The process is spontaneous, as indicated by the negative Gibbs free energy (ΔG°) values, which range from −29.675 to −27.819 kJ mol⁻¹, a common characteristic of exothermic processes [54]. Based on these characteristics, the adsorption of CIP on SBA-15 exhibits ΔH° < 0. This behavior suggests that at higher temperatures, there is a reduction in the q of the material, a typical phenomenon in exothermic processes. The negative activation energy (Ea) can be interpreted as a reflection of the increased efficiency of the system at lower temperatures.

2.5. Simplified Batch Design for CIP-SBA-15

The simplified batch design was carried out considering the application of solution volumes ranging from 1 to 10 L, with a CIP concentration of 0.2 mmol L−1 and an R% efficiency between 50% and 90%. The calculations were based on the B.E.T. model. Figure 9 shows the mass required for the conditions evaluated.
Linearity is observed, and expected, concerning the mass of adsorbent required as the desired removal percentage and the increase in the volume to be treated. The maximum condition, reaching 90% removal and 10 L of treated solution, requires 27 g of SBA-15. In addition, the material used in this work has a lower synthesis price when compared to commercial SBA-15 or even other adsorbent materials, such as MCM-41, which presented adsorption capacity like SBA-15. The synthesis cost of the SBA-15 synthesized is approximately USD 8/g. For commercial SBA-15 (Sigma-Aldrich®, St. Louis, MO, USA) it is around USD 38/g, and for MCM-41, it is around USD 15,960/g (Sigma-Aldrich®, St. Louis, MO, USA). Compared to these materials, SBA-15 has excellent performance and market value.

3. Materials and Methods

3.1. Materials

For the synthesis of SBA-15, Pluronic® P123 (Poly(propylene glycol)-block-poly(ethylene glycol)-block-(propylene glycol, Mw~5800), HCL (hydrochloric acid P.A., 37% by weight), ultrapure water and tetraethyl orthosilicate (TEOS, P.A., purity > 98.0%), and NaOH (sodium hydroxide P.A., purity > 99%), all obtained from Sigma-Aldrich (St. Louis, MO, USA), were used. The synthetic solutions for the adsorption tests were prepared with ciprofloxacin (EMS S/A, ≤99%; Hortolândia, SP, Brazil), losartan (Purifarm, ≥99%; São Paulo, SP, Brazil), bisphenol A (Sigma-Aldrich®, ≥99%, St. Louis, MO, USA), and ultrapure water.

3.2. Synthesis of Mesoporous Silica Nanostructure

The SBA-15 material was synthesized using the methodology of Zhao et al. [55]. The P123 (16.3 g) was dissolved in water (519.2 g) and HCl (96.7 g) for 3 h at 35 °C. The 34.8 g of TEOS was added to the solution and kept stirring for 20 h. Afterwards, the mixture was added to the Teflon autoclave at 100 °C for 24 h, then filtered until reaching a pH of 7 and calcined at 550 °C for 6 h in 2° min−1.

3.3. Adsorbate Characterization

X-ray diffraction (XRD) was used to characterize the ordered structure, using a range of 0.5° to 5°, step size of 0.01° with a time of 0.3 s, the slit used was 0.1 mm for divergent and 0.3 mm for convergent, 0.5 for central. N2 adsorption and desorption were used to provide the textural properties, and the surface area was obtained using the B.E.T. method, mesoporous volume (Vmeso), microporous volume (Vmicro), and external surface area (Sext) by the t-Plot method [56]. The details are presented in the Supplementary Materials. Fourier transform infrared spectroscopy (FTIR) and nuclear magnetic resonance (NMR) for Si29 were used to evaluate the groups present in the material and the structure of the material, respectively. Scanning electron microscopy (SEM) obtained morphology images of SBA-15 material. Energy dispersive spectroscopy (EDS) was performed to obtain data on the chemical composition of the material. All details are shown in the Supplementary Materials.

3.4. Affinity Test

The tests were performed using a 1.5 g L−1 to dosage of SBA-15 and 10 mL of the BPA, CIP, and LS solutions (initial concentration = 0.2 mmol L−1) at pH 5, 25 °C and 200 rpm. The mixture was kept under constant stirring for 48 h, at 25 °C and 200 rpm, and the tests were performed in triplicate. The aliquots were filtered and quantified using the UV-Vis spectrophotometer. The removal percentage (%R, Equation (1)) and the adsorption capacity (q, mmol g−1, Equation (2)) were obtained using their equations. Details about the affinity tests can be found in the Supplementary Materials.

3.5. Determination of pHZPC and Zeta Potential

The pHZPC was determined using NaOH solution as an electrolyte and HCl for pH values in the range of 1 to 11. This solution was separated into different Erlenmeyer with SBA-15, a dosage of 1.5 g L−1, and stirring of 200 rpm for 24 h at 25 °C. The pH was measured initially (pHi) and at the end (pHf) after the adsorption process. Afterward, the zeta potential was measured at each final pH for all samples, described in Supplementary Materials.

3.6. Kinetics, Equilibrium Isotherms, and Thermodynamic Studies

The tests were performed with the best system of SBA-15 + emerging contaminant, a dosage of 1.5 g L−1 and quantification was performed in the same way as for the affinity tests. Adsorption kinetics were evaluated at 0.15, 0.30 and 0.50 mmol g−1. The kinetics models comprise pseudo-first order (PFO) (Equation (1)) [57], pseudo-second order (PSO) (Equation (2)) [58], interparticle diffusion (IPD) (Equation (3)) [59], and external mass transfer resistance (EMTR) (Equations (4) and (5)) [60]. Equilibrium isotherms were performed in the C0 range from 0.01 to 1 mmol g−1 at 15 °C, 25 °C, and 35 °C. Details of the following equations, the Langmuir (Equation (6)) [61], Freundlich (Equation (7)) [62], and B.E.T. (Equation (8)) [63], are shown in the Supplementary Materials.
q t = q e ( 1 e K 1 t )
q t = K 2 q e 2 t 1 + K 2 q e t
q t = K I t 1 2 + C
d C f d t = K T M V m q m K L 1 + K L C F 2 ( C C f )
d C d t = K T M ( C C f )
q e = q M a x K L C e 1 + K L C e
q e = K F C E 1 / n
q e = q B K B C e ( 1 K U C e ) ( 1 K U C e + K B C e )
The thermodynamic analysis was conducted to comprehend the behavior of the adsorption process under varying temperature conditions. The equilibrium thermodynamic constant (KD) was calculated, and the necessary modifications were made for use in calculating the parameters [64]. All values of the thermodynamic parameters of entropy variation (ΔS°), enthalpy variation (ΔH°), activation energy (Ea), and Gibbs energy variation (ΔG°) were calculated. Details are presented in the Supplementary Materials.

3.7. The Simplified Batch Design

The mass quantity of SBA-15 for adsorption of the emerging contaminant at different removal percentages was made available using the simplified batch design. First, the mass balance for the system was calculated using Equations (S15) and (S16) in Supplementary Materials [45]. Considering the best model fitted with the experimental equilibrium data is important. The mass required to remove 50–90% of the contaminant with a value of 0.2 mmol L−1 to initial concentration and a solution volume ranging from 1 to 10 L was calculated.

4. Conclusions

The SBA-15 material was successfully synthesized, exhibiting an ordered structure and excellent textural properties. The characteristic peaks of symmetry p6mm were observed in the XRD spectrum. Furthermore, the FTIR and NMR spectra confirmed the presence of silica structure condensed and silanol group in the structure of the synthesized material. The SBET and DP values were 688.7 m2 g−1 and 6.0 nm, respectively. The synthesized SBA-15 presented a fiber morphology, which is common for this material. The use of the synthesized SBA-15 as an adsorbent material was evaluated. Affinity tests were performed with contaminant bisphenol A, ciprofloxacin, and losartan. Better results were found for the SBA-15 + CIP system, which can be attributed to the better interaction of CIP on Si-O-Si and Si-OH sites present on the surface. For this reason, this system was chosen to continue the adsorption tests. The kinetic tests showed an equilibrium time of 20 min and the PSO kinetic model had the best fit. The equilibrium tests demonstrated that temperature can negatively influence the process since the qmax decreases with the increasing temperature. This behavior may also indicate an exothermic system. The B.E.T. model showed the best fit, suggesting multilayer adsorption with varying interaction sites. The simplified batch design demonstrated that 27 g of SBA-15 is necessary to achieve 90% CIP removal in a solution volume of 10 L. Finally, it is possible to conclude that the synthesized material presented satisfactory performance in the adsorption process of ciprofloxacin from aqueous solutions.

Supplementary Materials

The following supporting information can be downloaded at: https://www.mdpi.com/article/10.3390/molecules30051040/s1, S1—adsorbent characterization; S2—affinity test; S3—Zeta potential; S4—kinetics, equilibrium models, and thermodynamic study; S5—the simplified batch design; Figure S1—color map obtained by EDS for C (carbon ribbon), Au (coating), Si, and O (SBA-15); Figure S2—EDS spectrum for SBA-15 material; Figure S3—thermodynamic plot of lnKc versus 1/T.

Author Contributions

Conceptualization: F.E.d.S., M.P.S., M.G.A.V. and S.B.C.P.; methodology, M.G.A.V., S.B.C.P., F.E.d.S. and M.P.S.; validation, F.E.d.S., M.P.S., M.G.A.V. and S.B.C.P.; formal analysis, F.E.d.S. and M.P.S.; investigation, F.E.d.S. and M.P.S.; resources, M.G.A.V. and S.B.C.P.; data curation, F.E.d.S. and M.P.S.; writing—original draft preparation, F.E.d.S. and M.P.S.; writing—review and editing, F.E.d.S. and M.P.S.; visualization, F.E.d.S. and M.P.S.; supervision, M.G.A.V. and S.B.C.P.; project administration, M.G.A.V. and S.B.C.P.; funding acquisition, M.G.A.V. and S.B.C.P. All authors have read and agreed to the published version of the manuscript.

Funding

Nacional Institute of Sciences and Technology Midas (INCT Midas//CNPq, grant no. 465594/2014–0). São Paulo State Research Support Foundation (FAPESP, grant # 2020/16004–9).

Institutional Review Board Statement

Not applicable.

Informed Consent Statement

Not applicable.

Data Availability Statement

Data are contained within the article.

Acknowledgments

The authors also thank CENAPAD/SP for providing the software used in molecular modeling. The authors would like to thank the coordinators of the Human Resources Program of the National Petroleum, Natural Gas and Biofuels Agency—PRH-ANP and the FINEP management team for the financial support supported by resources from the investment of qualified oil companies in the R, D&I Clause of ANP Resolution 50/2015.

Conflicts of Interest

The authors declare no conflicts of interest.

References

  1. Solliec, M.; Roy-Lachapelle, A.; Gasser, M.-O.; Coté, C.; Généreux, M.; Sauvé, S. Fractionation and Analysis of Veterinary Antibiotics and Their Related Degradation Products in Agricultural Soils and Drainage Waters Following Swine Manure Amendment. Sci. Total Environ. 2016, 543, 524–535. [Google Scholar] [CrossRef] [PubMed]
  2. Taheran, M.; Naghdi, M.; Brar, S.K.; Verma, M.; Surampalli, R.Y. Emerging Contaminants: Here Today, There Tomorrow! Environ. Nanotechnol. Monit. Manag. 2018, 10, 122–126. [Google Scholar] [CrossRef]
  3. Veetil, D.P.; Mercier, G.; Blais, J.F.; Chartier, M.; Tran, L.H.; Taillard, V. Remediation of Contaminated Dredged Sediments Using Physical Separation Techniques. Soil Sediment Contam. 2014, 23, 932–953. [Google Scholar] [CrossRef]
  4. Ahmed, S.F.; Mofijur, M.; Nuzhat, S.; Chowdhury, A.T.; Rafa, N.; Uddin, M.A.; Inayat, A.; Mahlia, T.M.I.; Ong, H.C.; Chia, W.Y.; et al. Recent Developments in Physical, Biological, Chemical, and Hybrid Treatment Techniques for Removing Emerging Contaminants from Wastewater. J. Hazard. Mater. 2021, 416, 125912. [Google Scholar] [CrossRef]
  5. Kumar, R.; Qureshi, M.; Vishwakarma, D.K.; Al-Ansari, N.; Kuriqi, A.; Elbeltagi, A.; Saraswat, A. A Review on Emerging Water Contaminants and the Application of Sustainable Removal Technologies. Case Stud. Chem. Environ. Eng. 2022, 6, 100219. [Google Scholar] [CrossRef]
  6. Baek, M.K.; Sung, T.I.; Cho, E.S.; Namkung, K.C.; Bae, D.J.; Park, I.H. Magnetic Separation for Contaminants in Wastewater Using Magnetic Micro Bead. IEEE Trans. Magn. 2012, 48, 3768–3771. [Google Scholar] [CrossRef]
  7. Abdi, J.; Banisharif, F.; Khataee, A. Amine-Functionalized Zr-MOF/CNTs Nanocomposite as an Efficient and Reusable Photocatalyst for Removing Organic Contaminants. J. Mol. Liq. 2021, 334, 116129. [Google Scholar] [CrossRef]
  8. Bolong, N.; Ismail, A.F.; Salim, M.R.; Matsuura, T. A Review of the Effects of Emerging Contaminants in Wastewater and Options for Their Removal. Desalination 2009, 239, 229–246. [Google Scholar] [CrossRef]
  9. Esfandiar, N.; Suri, R.; McKenzie, E.R. Competitive Sorption of Cd, Cr, Cu, Ni, Pb and Zn from Stormwater Runoff by Five Low-Cost Sorbents; Effects of Co-Contaminants, Humic Acid, Salinity and PH. J. Hazard. Mater. 2022, 423, 126938. [Google Scholar] [CrossRef]
  10. Akinnawo, S.O. Eutrophication: Causes, Consequences, Physical, Chemical and Biological Techniques for Mitigation Strategies. Environ. Chall. 2023, 12, 100733. [Google Scholar] [CrossRef]
  11. Kebede, G.; Tafese, T.; Abda, E.M.; Kamaraj, M.; Assefa, F. Factors Influencing the Bacterial Bioremediation of Hydrocarbon Contaminants in the Soil: Mechanisms and Impacts. J. Chem. 2021, 2021, 9823362. [Google Scholar] [CrossRef]
  12. Pérez-Botella, E.; Valencia, S.; Rey, F. Zeolites in Adsorption Processes: State of the Art and Future Prospects. Chem. Rev. 2022, 122, 17647–17695. [Google Scholar] [CrossRef] [PubMed]
  13. Alomar, T.; Qiblawey, H.; Almomani, F.; Al-Raoush, R.I.; Han, D.S.; Ahmad, N.M. Recent Advances on Humic Acid Removal from Wastewater Using Adsorption Process. J. Water Process Eng. 2023, 53, 103679. [Google Scholar] [CrossRef]
  14. Wang, Y.; Zhang, F.; Wang, Y.; Ren, J.; Li, C.; Liu, X.; Guo, Y.; Guo, Y.; Lu, G. Synthesis of Length Controllable Mesoporous SBA-15 Rods. Mater. Chem. Phys. 2009, 115, 649–655. [Google Scholar] [CrossRef]
  15. Silva, F.E.d.; Rigoti, E.; Mello, M.I.S.d.; Pergher, S.B.C. Tuning Textural Properties by Changing the Morphology of SBA-15 Mesoporous Materials. Materials 2024, 17, 2827. [Google Scholar] [CrossRef]
  16. Zholobenko, V.L.; Khodakov, A.Y.; Impéror-Clerc, M.; Durand, D.; Grillo, I. Initial Stages of SBA-15 Synthesis: An Overview. Adv. Colloid. Interface Sci. 2008, 142, 67–74. [Google Scholar] [CrossRef]
  17. Laskowski, Ł.; Laskowska, M.; Walcarius, A.; Doskocz, M.; Vila, N.; Karczmarska, A.; Pawlik, P.; Goraus, J.; Balin, K.; Dulski, M. Synthesis and Characterization of SBA-15 Silica Containing Cyclam inside Pores for Capturing Iron Chloride: Analysis of Interactions between Ferrous Chloride and Cyclam in a System with Strongly Dispersed Functional Groups on the SiO2 Surface. Microporous Mesoporous Mater. 2024, 378, 113243. [Google Scholar] [CrossRef]
  18. Thommes, M.; Kaneko, K.; Neimark, A.V.; Olivier, J.P.; Rodriguez-Reinoso, F.; Rouquerol, J.; Sing, K.S.W. Physisorption of Gases, with Special Reference to the Evaluation of Surface Area and Pore Size Distribution (IUPAC Technical Report). Pure Appl. Chem. 2015, 87, 1051–1069. [Google Scholar] [CrossRef]
  19. Ojeda-López, R.; Pérez-Hermosillo, I.J.; Marcos Esparza-Schulz, J.; Cervantes-Uribe, A.; Domínguez-Ortiz, A. SBA-15 Materials: Calcination Temperature Influence on Textural Properties and Total Silanol Ratio. Adsorption 2015, 21, 659–669. [Google Scholar] [CrossRef]
  20. Genç, N.; Dogan, E.C. Adsorption Kinetics of the Antibiotic Ciprofloxacin on Bentonite, Activated Carbon, Zeolite, and Pumice. Desalin. Water Treat. 2015, 53, 785–793. [Google Scholar] [CrossRef]
  21. Avcı, A.; İnci, İ.; Baylan, N. A Comparative Adsorption Study with Various Adsorbents for the Removal of Ciprofloxacin Hydrochloride from Water. Water Air Soil Pollut. 2019, 230, 250. [Google Scholar] [CrossRef]
  22. Bizi, M.; El Bachra, F.E. Evaluation of the Ciprofloxacin Adsorption Capacity of Common Industrial Minerals and Application to Tap Water Treatment. Powder Technol. 2020, 362, 323–333. [Google Scholar] [CrossRef]
  23. Macías-Ferrer, D.; Melo-Banda, J.A.; Silva-Rodrigo, R.; Páramo-García, U.; Verde-Gómez, J.Y.; Del-Angel-Vicente, P. Synthesis of Micro/Nanostructured Carbon from Refined Sugar and Its Electrochemical Performance. Int. J. Electrochem. Sci. 2018, 13, 708–718. [Google Scholar] [CrossRef]
  24. Rekos, K.; Kampouraki, Z.C.; Sarafidis, C.; Samanidou, V.; Deliyanni, E. Graphene Oxide Based Magnetic Nanocomposites with Polymers as Effective Bisphenol-A Nanoadsorbents. Materials 2019, 12, 1987. [Google Scholar] [CrossRef] [PubMed]
  25. de Andrade, J.R.; Oliveira, M.F.; Canevesi, R.L.S.; Landers, R.; da Silva, M.G.C.; Vieira, M.G.A. Comparative Adsorption of Diclofenac Sodium and Losartan Potassium in Organophilic Clay-Packed Fixed-Bed: X-Ray Photoelectron Spectroscopy Characterization, Experimental Tests and Theoretical Study on DFT-Based Chemical Descriptors. J. Mol. Liq. 2020, 312, 113427. [Google Scholar] [CrossRef]
  26. Roca Jalil, M.E.; Baschini, M.; Sapag, K. Influence of PH and Antibiotic Solubility on the Removal of Ciprofloxacin from Aqueous Media Using Montmorillonite. Appl. Clay Sci. 2015, 114, 69–76. [Google Scholar] [CrossRef]
  27. Li, H.; Zhang, D.; Han, X.; Xing, B. Adsorption of Antibiotic Ciprofloxacin on Carbon Nanotubes: PH Dependence and Thermodynamics. Chemosphere 2014, 95, 150–155. [Google Scholar] [CrossRef]
  28. Xing, X.; Feng, J.; Lv, G.; Song, K.; Mei, L.; Liao, L.; Wang, X.; Xu, B. Adsorption Mechanism of Ciprofloxacin from Water by Synthesized Birnessite. Adv. Mater. Sci. Eng. 2015, 2015, 148423. [Google Scholar] [CrossRef]
  29. Bui, T.X.; Choi, H. Adsorptive Removal of Selected Pharmaceuticals by Mesoporous Silica SBA-15. J. Hazard. Mater. 2009, 168, 602–608. [Google Scholar] [CrossRef]
  30. Kokunešoski, M.; Gulicovski, J.; Matović, B.; Logar, M.; Milonjić, S.K.; Babić, B. Synthesis and Surface Characterization of Ordered Mesoporous Silica SBA-15. Mater. Chem. Phys. 2010, 124, 1248–1252. [Google Scholar] [CrossRef]
  31. da Silva Marques, V.B.; dos Santos, A.G.; de Lima Leite, R.H.; dos Santos, F.K.G. Functionalization of SBA-15 with EDTA and Its Application in Removing Ca2+ and Mg2+ Ions from Hard Water. Rev. Verde Agroecol. E Desenvolv. Sustentável 2020, 15, 300–308. [Google Scholar] [CrossRef]
  32. Ezzeddine, Z.; Batonneau-Gener, I.; Pouilloux, Y.; Hamad, H.; Saad, Z. The Applicability of as Synthesized Mesoporous Carbon CMK-3 as a Heavy Metals Adsorbent: Application to Real Water Samples. Energy Sources Part A Recovery Util. Environ. Eff. 2021, 43, 1675–1690. [Google Scholar] [CrossRef]
  33. da Silva de Assis, D.A.; dos Santos, E.G.; Eiras, D. Efficient and Reusable Mesoporous Silica Structures for Ciprofloxacin Removal from Water Media. J. Water Process Eng. 2024, 60, 105144. [Google Scholar] [CrossRef]
  34. Peng, X.; Hu, F.; Huang, J.; Wang, Y.; Dai, H.; Liu, Z. Preparation of a Graphitic Ordered Mesoporous Carbon and Its Application in Sorption of Ciprofloxacin: Kinetics, Isotherm, Adsorption Mechanisms Studies. Microporous Mesoporous Mater. 2016, 228, 196–206. [Google Scholar] [CrossRef]
  35. Khan, A.H.; Abdul Aziz, H.; Palaniandy, P.; Naushad, M.; Zouli, N. Ciprofloxacin Adsorption onto CNT Loaded Pumice: Adsorption Modelling, Kinetics, Equilibriums and Reusability Studies. J. Mol. Liq. 2024, 399, 124388. [Google Scholar] [CrossRef]
  36. Mao, H.; Wang, S.; Lin, J.Y.; Wang, Z.; Ren, J. Modification of a Magnetic Carbon Composite for Ciprofloxacin Adsorption. J. Environ. Sci. 2016, 49, 179–188. [Google Scholar] [CrossRef]
  37. Wu, Y.; Zheng, H.; Li, H.; Sun, Y.; Zhao, C.; Zhao, R.; Zhang, C. Magnetic Nickel Cobalt Sulfide/Sodium Dodecyl Benzene Sulfonate with Excellent Ciprofloxacin Adsorption Capacity and Wide PH Adaptability. Chem. Eng. J. 2021, 426, 127208. [Google Scholar] [CrossRef]
  38. Tran, Q.T.; Do, T.H.; Ha, X.L.; Nguyen, H.P.; Nguyen, A.T.; Ngo, T.C.Q.; Chau, H.D. Study of the Ciprofloxacin Adsorption of Activated Carbon Prepared from Mangosteen Peel. Appl. Sci. 2022, 12, 8770. [Google Scholar] [CrossRef]
  39. Wu, M.; Zhao, S.; Jing, R.; Shao, Y.; Liu, X.; Lv, F.; Hu, X.; Zhang, Q.; Meng, Z.; Liu, A. Competitive Adsorption of Antibiotic Tetracycline and Ciprofloxacin on Montmorillonite. Appl. Clay Sci. 2019, 180, 105175. [Google Scholar] [CrossRef]
  40. Antonelli, R.; Malpass, G.R.P.; da Silva, M.G.C.; Vieira, M.G.A. Adsorption of Ciprofloxacin onto Thermally Modified Bentonite Clay: Experimental Design, Characterization, and Adsorbent Regeneration. J. Environ. Chem. Eng. 2020, 8, 104553. [Google Scholar] [CrossRef]
  41. Lu, D.; Xu, S.; Qiu, W.; Sun, Y.; Liu, X.; Yang, J.; Ma, J. Adsorption and Desorption Behaviors of Antibiotic Ciprofloxacin on Functionalized Spherical MCM-41 for Water Treatment. J. Clean. Prod. 2020, 264, 121644. [Google Scholar] [CrossRef]
  42. Módenes, A.N.; Bazarin, G.; Borba, C.E.; Locatelli, P.P.P.; Borsato, F.P.; Pagno, V.; Pedrini, R.; Trigueros, D.E.G.; Espinoza-Quiñones, F.R.; Scheufele, F.B. Tetracycline Adsorption by Tilapia Fish Bone-Based Biochar: Mass Transfer Assessment and Fixed-Bed Data Prediction by Hybrid Statistical-Phenomenological Modeling. J. Clean. Prod. 2021, 279, 123775. [Google Scholar] [CrossRef]
  43. de Oliveira Carvalho, C.; Costa Rodrigues, D.L.; Lima, É.C.; Santanna Umpierres, C.; Caicedo Chaguezac, D.F.; Machado Machado, F. Kinetic, Equilibrium, and Thermodynamic Studies on the Adsorption of Ciprofloxacin by Activated Carbon Produced from Jerivá (Syagrus romanzoffiana). Environ. Sci. Pollut. Res. 2019, 26, 4690–4702. [Google Scholar] [CrossRef] [PubMed]
  44. Song, X.; Zhang, Y.; Yan, C.; Jiang, W.; Chang, C. The Langmuir Monolayer Adsorption Model of Organic Matter into Effective Pores in Activated Carbon. J. Colloid. Interface Sci. 2013, 389, 213–219. [Google Scholar] [CrossRef] [PubMed]
  45. de Almeida, A.S.V.; Mastelaro, V.R.; da Silva, M.G.C.; Prediger, P.; Vieira, M.G.A. Adsorption of 17α-Ethinylestradiol onto a Novel Nanocomposite Based on Graphene Oxide, Magnetic Chitosan and Organoclay (GO/MCS/OC): Kinetics, Equilibrium, Thermodynamics and Selectivity Studies. J. Water Process Eng. 2022, 47, 102729. [Google Scholar] [CrossRef]
  46. Sert Çok, S.; Koç, F.; Len, A.; Almásy, L.; Dudás, Z. Silica Aerogels Modified with Vinyl, Epoxide, Methacrylate Moieties for the Removal of Ciprofloxacin by Adsorption from Water. Sep. Purif. Technol. 2025, 354, 129112. [Google Scholar] [CrossRef]
  47. Hamadeen, H.M.; Elkhatib, E.A. New Nanostructured Activated Biochar for Effective Removal of Antibiotic Ciprofloxacin from Wastewater: Adsorption Dynamics and Mechanisms. Environ. Res. 2022, 210, 112929. [Google Scholar] [CrossRef]
  48. Afzal, M.Z.; Sun, X.F.; Liu, J.; Song, C.; Wang, S.G.; Javed, A. Enhancement of Ciprofloxacin Sorption on Chitosan/Biochar Hydrogel Beads. Sci. Total Environ. 2018, 639, 560–569. [Google Scholar] [CrossRef]
  49. Ma, W.; Dai, J.; Dai, X.; Yan, Y. Preparation and Characterization of Chitosan/Kaolin/Fe3O4 Magnetic Microspheres and Their Application for the Removal of Ciprofloxacin. Adsorpt. Sci. Technol. 2014, 32, 775–790. [Google Scholar] [CrossRef]
  50. Huš, M.; Dasireddy, V.D.B.C.; Strah Štefančič, N.; Likozar, B. Mechanism, Kinetics and Thermodynamics of Carbon Dioxide Hydrogenation to Methanol on Cu/ZnAl2O4 Spinel-Type Heterogeneous Catalysts. Appl. Catal. B 2017, 207, 267–278. [Google Scholar] [CrossRef]
  51. Azhagiya Singam, E.R.; Zhang, Y.; Magnin, G.; Miranda-Carvajal, I.; Coates, L.; Thakkar, R.; Poblete, H.; Comer, J. Thermodynamics of Adsorption on Graphenic Surfaces from Aqueous Solution. J. Chem. Theory Comput. 2019, 15, 1302–1316. [Google Scholar] [CrossRef] [PubMed]
  52. Yin, D.; Xu, Z.; Shi, J.; Shen, L.; He, Z. Adsorption Characteristics of Ciprofloxacin on the Schorl: Kinetics, Thermodynamics, Effect of Metal Ion and Mechanisms. J. Water Reuse Desalin. 2018, 8, 350–359. [Google Scholar] [CrossRef]
  53. Uzosike, A.O.; Ofudje, E.A.; Adeogun, A.I.; Akinyele, J.O.; Idowu, M.A. Comparative Analysis of Bisphenol-A Removal Efficiency from Water: Equilibrium, Kinetics, Thermodynamics and Optimization Evaluations. J. Iran. Chem. Soc. 2022, 19, 4645–4658. [Google Scholar] [CrossRef]
  54. de Sá Costa, H.P.; Duarte, E.D.V.; da Silva, M.G.C.; Vieira, M.G.A. Adsorption of Diclofenac and Losartan Using Multi-Walled Carbon Nanotubes Functionalized with Iron Nanoparticles via the Green Route: Equilibrium, Thermodynamics, and Machine Learning Studies. J. Water Process Eng. 2024, 58, 104923. [Google Scholar] [CrossRef]
  55. Zhao, D.; Feng, J.; Huo, Q.; Melosh, N.; Fredrickson, G.H.; Chmelka, B.F.; Stucky, G.D. Triblock Copolymer Syntheses of Mesoporous Silica with Periodic 50 to 300 Angstrom Pores. Science 1998, 279, 548–552. [Google Scholar] [CrossRef]
  56. Galarneau, A.; Cambon, H.; Di Renzo, F.; Ryoo, R.; Choi, M.; Fajula, F. Microporosity and Connections between Pores in SBA-15 Mesostructured Silicas as a Function of the Temperature of Synthesis. New J. Chem. 2003, 27, 73–79. [Google Scholar] [CrossRef]
  57. Lagergren, S. Zur Theorie Der Sogenannten Adsorption Gelöster Stoffe. Zeitschr Für Chem. Und Ind. Der Kolloide 1907, 2, 15. [Google Scholar] [CrossRef]
  58. Ho, Y.S.; McKay, G. A Comparison of Chemisorption Kinetic Models Applied to Pollutant Removal on Various Sorbents. Process Saf. Environ. Prot. 1998, 76, 332–340. [Google Scholar] [CrossRef]
  59. Weber, W.J., Jr.; Morris, J.C. Kinetics of Adsorption on Carbon from Solution. J. Sanit. Eng. Div. 1963, 89, 31–59. [Google Scholar] [CrossRef]
  60. Puranik, P.R.; Modak, J.M.; Paknikar, K.M. A Comparative Study of the Mass Transfer Kinetics of Metal Biosorption by Microbial Biomass; Elsevier: Amsterdam, The Netherlands, 1999; Volume 52. [Google Scholar]
  61. Langmuir, I. The Adsorption of Gases on Plane Surfaces of Glass, Mica and Platinum. J. Am. Chem. Soc. 1918, 40, 1361–1403. [Google Scholar] [CrossRef]
  62. Haring, M.M. Colloid and Capillary Chemistry (Freundlich, Herbert). J. Chem. Educ. 1926, 3, 1454. [Google Scholar] [CrossRef]
  63. Ebadi, A.; Soltan Mohammadzadeh, J.S.; Khudiev, A. What Is the Correct Form of BET Isotherm for Modeling Liquid Phase Adsorption? Adsorption 2009, 15, 65–73. [Google Scholar] [CrossRef]
  64. Milonjić, S.K. A Consideration of the Correct Calculation of Thermodynamic Parameters of Adsorption. J. Serbian Chem. Soc. 2007, 72, 1363–1367. [Google Scholar] [CrossRef]
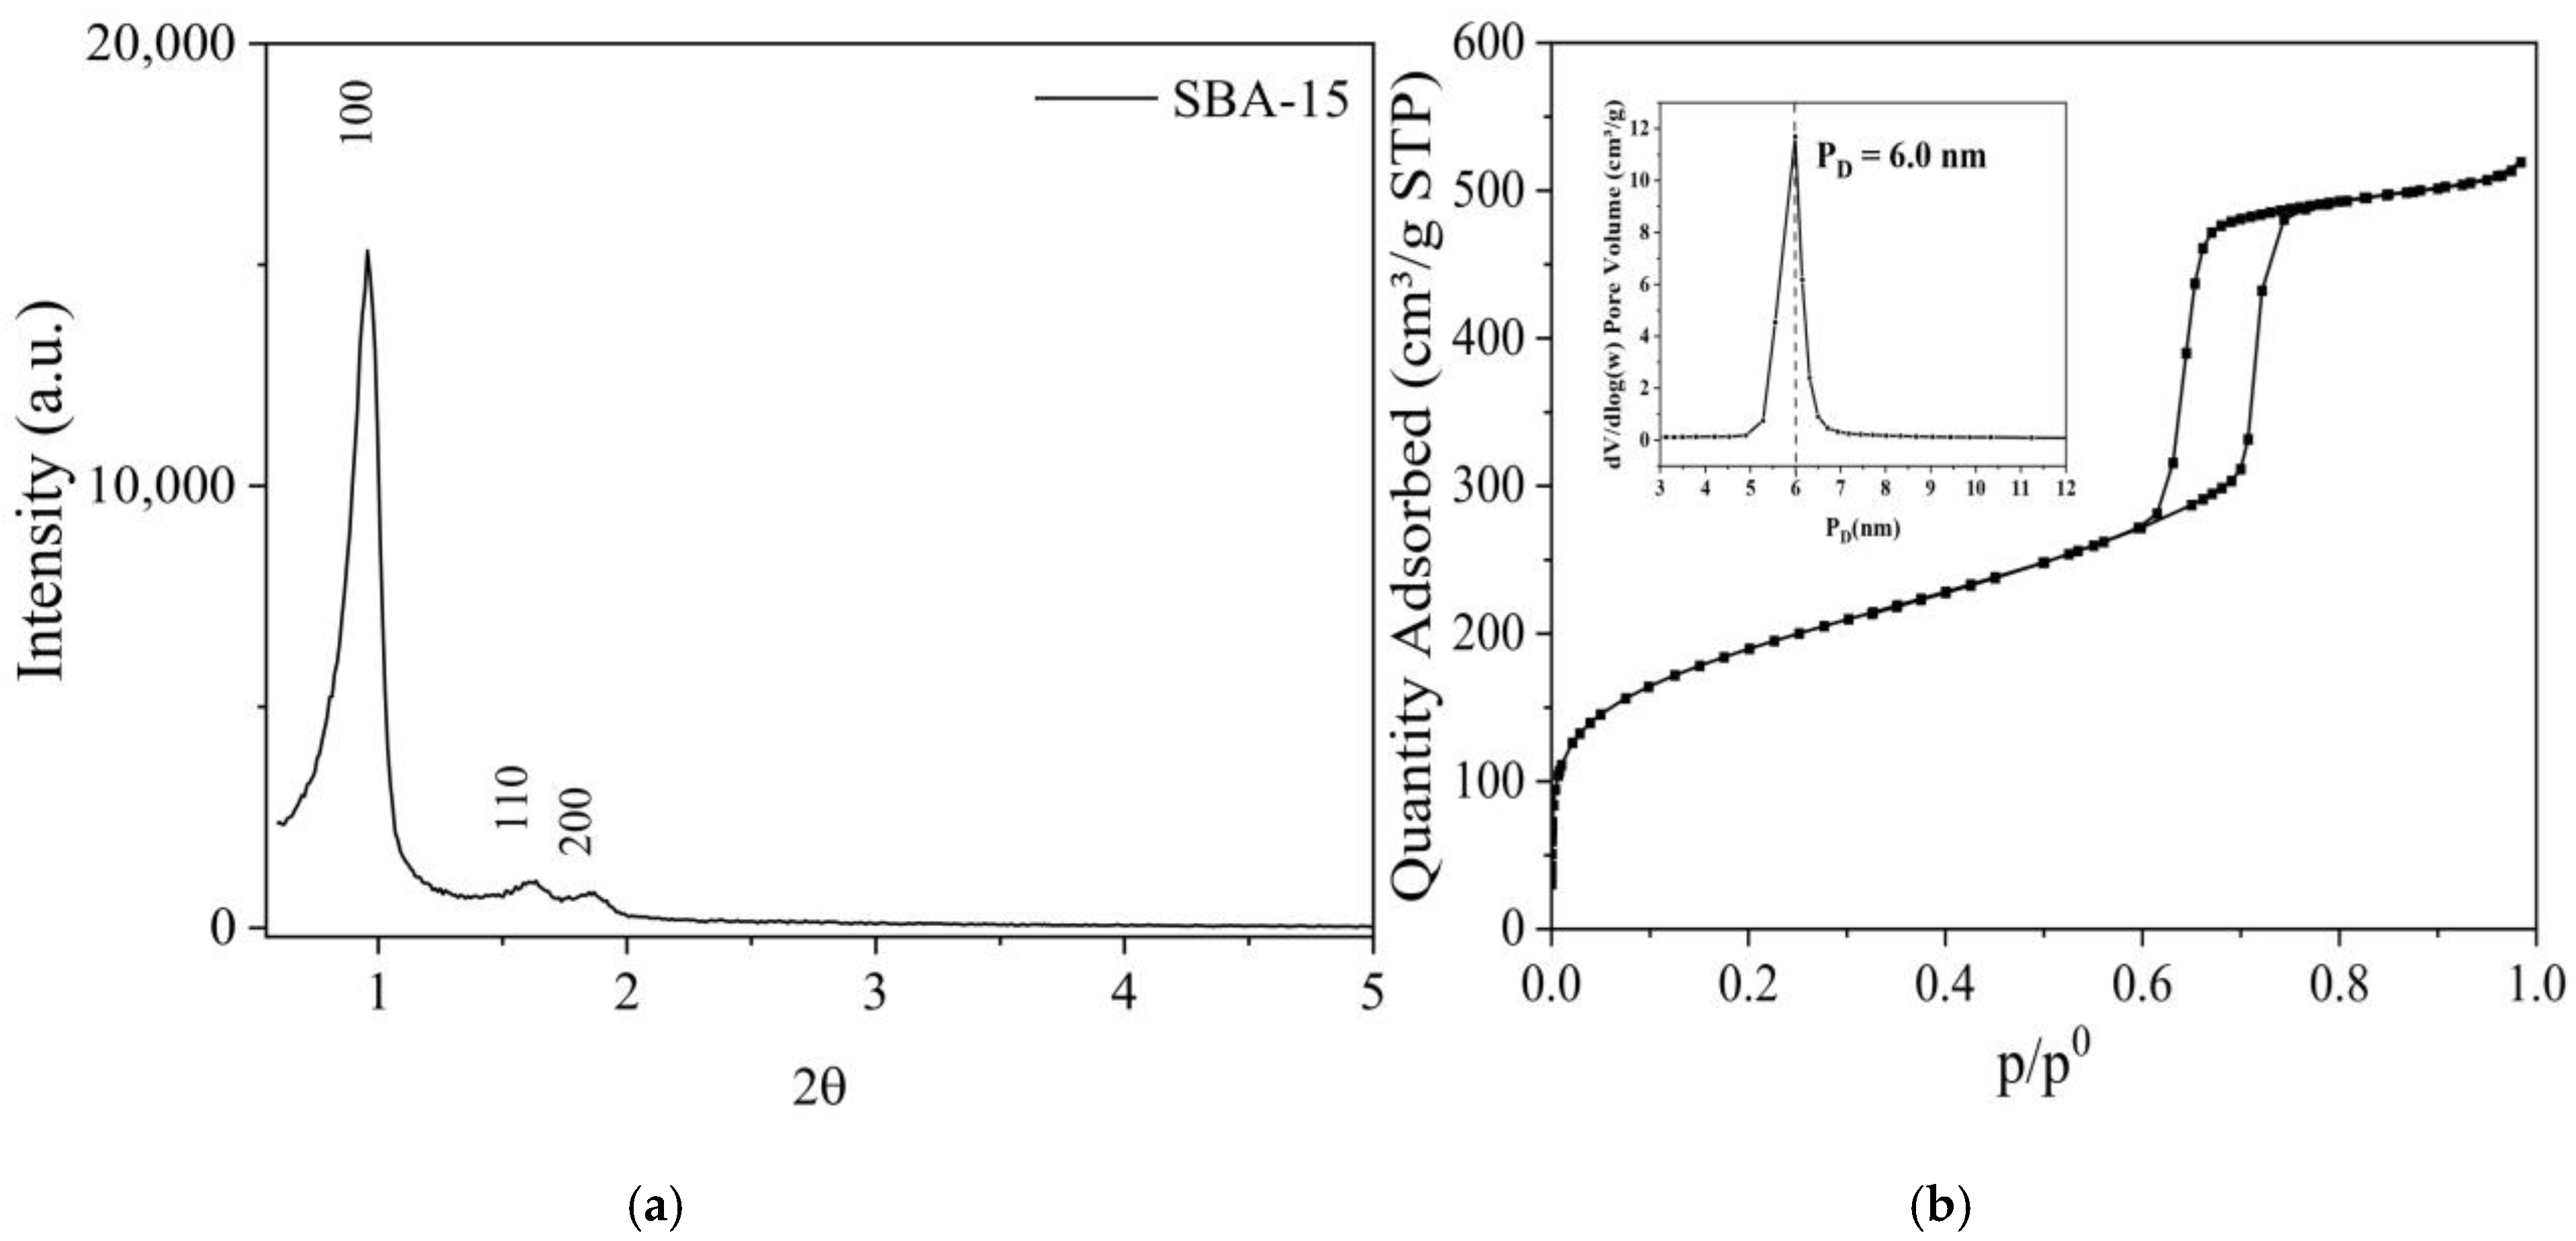
Figure 1. X-ray diffraction (a) and N2 physisorption for SBA-15 (b).
Molecules 30 01040 g001
Figure 2. FTIR (a) and NMR (b) for SBA-15.
Molecules 30 01040 g002
Figure 3. SEM micrographs for SBA-15 material.
Molecules 30 01040 g003
Figure 4. Affinity test for BPA, CIP, and LS on SBA-15.
Molecules 30 01040 g004
Figure 5. Adsorption mechanism of BPA, CIP, and LS on SBA-15.
Molecules 30 01040 g005
Figure 6. Determination of pHzpc with pHi (pH initial) and pHf (pH final) (a); determination of zeta potential (b) to material SBA-15.
Molecules 30 01040 g006
Figure 7. Kinetic curves of CIP adsorption on SBA-15 at 0.15, 0.30, and 0.50 mm L−1 (a); Models for 0.15 (b), 0.30 (c), and 0.50 mmol L−1 (d); IP model (e).
Molecules 30 01040 g007
Figure 8. Equilibrium for CIP adsorption on SBA-15 at 15°, 25°, and 30° C (a); models fitted to 15° C (b); 25° C (c); and 35° C (d).
Molecules 30 01040 g008
Figure 9. Simplified batch design for CIP system on SBA-15 with different removal percentages.
Molecules 30 01040 g009
Table 1. Textural properties for mesoporous silica material.
MaterialSBET (m2/g) Vmeso (cm3/g)Vmicro (cm3/g) Sext (m2/g) DBJH (nm)
SBA-15688.70.7310.073504.86.0
SBET = Surface area by BET method; Vmeso = mesopore volume; Vmicro = micropore volume; Sext = external surface area by t-Plot method. DBJH: pore diameter by BJH method.
Table 2. Parameters obtained from 29Si for SB-FIB.
MaterialSignal δ (ppm)Area (%)
SBA-15Q2−91.845.73
Q3−101.5430.48
Q4−109.0963.79
Table 3. Parameters for the PFO, PSO, IPD, and EMTR kinetic models.
ModelsParameters(C0) (mmol L−1)
0.100.300.50
qe0.0660.1090.132
PFOqPFO0.0600.1020.122
k12.1963.5685.660
R2Adj0.9520.9570.982
AICc−124.559−113.199−105.539
MRD (%)3.540.600.83
PSOqPSO0.0610.1060.126
k28.3467.87223.403
R2Adj0.9550.9820.986
AICc−87.749−76.599−79.779
MRD (%)3.461.351.06
IPDKi 0.002640.005170.00389
c0.05370.08620.115
R2Adj0.86780.8590.764
AICc−83.843−60.403−49.434
MRD (%)4.318.0118.99
EMTRKTM1.4411.7742.188
R20.9780.9800.992
AICc−128.222−116.880−123.290
MRD (%)5.45.13.1
where equilibrium adsorption capacity (qe): mmol g−1, equilibrium adsorption capacity for the PFO model (qPFO): mmol g−1, the pseudo-first order constant (k1): min−1, equilibrium adsorption capacity to PFO model (qPSO): mmol g−1, pseudo-second order constant (k2): L mol−1 min−1, the constant for the intraparticle diffusion model (Ki): mmol L−1 min−1; constant related to the thickness of the boundary layers (c): mmol L−1, external mass transfer resistance (KTM): min−1.
Table 4. Isothermal models and parameters obtained.
ModelsParametersTemperature (°C)
152535
qmax0.3740.2070.208
LangmuirqL0.4500.2070.220
KL1.4772.2492.705
R2Adj0.6740.6970.809
AICc−44.858−55.204−58.524
MRD (%)35.3238.1727.41
FreundlichKF0.6930.1890.244
1/n1.5440.8760.971
R2Adj0.7880.6450.919
AICc−36.547−35.644−50.798
MRD (%)28.4429.4425.51
BETqb0.0590.0410.068
Kb121.581449.75225.871
Ku1.4340.9540.818
R2Adj0.9330.9050.944
AICc−62.457−63.816−71.705
MRD (%)19.6619.5611.53
where adsorption capacity from experimental data (qmax): mmol g−1, maximum monolayer adsorption capacity to Langmuir model (qL): mmol g−1, Langmuir model constant (KL): L mmol−1, Freundlich model constant (KF): (mmol g−1) (L mol−1)1/n, maximum monolayer adsorption capacity for B.E.T. model (qb): mmol g−1, monolayer adsorption constant (Kb): L g−1, multilayer adsorption constant (Ku): L g−1.
Table 6. Thermodynamic parameters for experimental data.
T (°C)ΔH° (kJ mol−1)ΔS° (J mol−1 K−1)ΔG° (kJ mol−1)Ea (kJ mol−1)
15
−55.380

−89.208
−29.675−52.902
25−28.783−52.819
35−27.819−52.298
Entropy variation (ΔS°); enthalpy variation (ΔH°); activation energy (Ea); Gibbs energy variation (ΔG°).
Disclaimer/Publisher’s Note: The statements, opinions and data contained in all publications are solely those of the individual author(s) and contributor(s) and not of MDPI and/or the editor(s). MDPI and/or the editor(s) disclaim responsibility for any injury to people or property resulting from any ideas, methods, instructions or products referred to in the content.

