Article

Theoretical Investigation of Competitive Adsorption of Light and Heavy Rare Earth Ions on the (001) Surface of Kaolinite

1
School of Intelligent Manufacturing and Materials Engineering, Gannan University of Science and Technology, Ganzhou 341000, China
2
Key Laboratory of Ionic Rare Earth Resources and Environment, Ministry of Natural Resources of the People’s Republic of China, Ganzhou 341000, China
3
College of Resource and Environmental Engineering, Jiangxi University of Science and Technology, Ganzhou 341000, China
*
Author to whom correspondence should be addressed.
Molecules 2025, 30(4), 838; https://doi.org/10.3390/molecules30040838
Submission received: 3 January 2025 / Revised: 29 January 2025 / Accepted: 1 February 2025 / Published: 11 February 2025

Abstract

:
Kaolinite is the primary mineral in ion-adsorption rare earth ores, and improving our understanding of the adsorption state of REEs on kaolinite will benefit efforts to leach REEs from these ores. In order to explain why Eu3+ ions exhibit stronger pH-dependent desorption behavior than Lu3+, molecular dynamics simulations were applied to investigate the adsorption mechanism of Eu3+ and Lu3+ on a deprotonated kaolinite (001) surface. The simulation results show that the hydration numbers of Eu3+ and Lu3+ are comparable, whereas the ordering degree of water molecules around Eu3+ is higher than that of Lu3+, which is beneficial to the movement of Eu3+ to preferentially occupy favorable adsorption sites on the kaolinite surface, following which coordination bonds are formed between Eu3+ and the surface. As a result, the desorption rate of Eu3+ decreases sharply with the increase in leaching pH, while the desorption rate of Lu3+ is only slightly affected by pH.

Graphical Abstract

1. Introduction

Rare earth elements (REEs) are known as industrial vitamins due to their unique physical and chemical properties; thus, they are widely applied in the fields of magnetism, nuclear energy, catalysis, and medicine [1,2]. There are two different kinds of RE ores, depending on the existence state of REEs [3]: mineral-type and ion-adsorption RE ores. Mineral TRE ores, such as bastnaesite and monazite, mainly contain light REEs (La→Gd), while heavy REEs (Tb→Lu + Y) are only present in ion-adsorption RE ores [4]. The value of heavy REEs is much higher than that of light REEs. Ion-adsorption RE ores are only present in southeast Asia, with the REEs mainly adsorbed on clay mineral surfaces (e.g., kaolinite) in the forms of hydrated ions or hydroxyl-hydrated ions, meaning they can be desorbed through ion exchange with concentrated inorganic salts such as NH4+, Mg2+, and Al3+ [5,6,7].
Kaolinite is a typical 1:1 lamellar silicate mineral, with a basic unit of Si-O-Al-O-H [8]. This basic unit usually cleaves the (001) surface, and, subsequently, the Si-O and Al-OH surfaces are exposed, which is beneficial for the adsorption of metal ions. In addition, there are permanent and variable pH-dependent charges on the kaolinite’s surface due to isomorphous substitution and protonation/deprotonation of amphoteric hydroxyl groups, respectively [9,10,11]. As a result, RE ions can be adsorbed through electrostatic attraction and surface complexation [12].
The adsorption/desorption behaviors of RE ions on kaolinite have been widely investigated because kaolinite is the primary mineral carrier of REEs in ion-adsorption RE ores. Moldoveanu et al. [13,14] investigated the leaching efficiency of cations (Li+, Na+, Cs+, and NH4+) and anions (SO42− and Cl) for RE ions from clay minerals of ion-adsorption RE ores, revealing that Cs+ > NH4+ > Na+ > Li+ and SO42− > Cl. Xiao et al. [15] revealed that the adsorption capacities of La, Nd, and Y on the surface of kaolinite are 1.731, 1.587, and 0.971 mg/g, respectively, showing that kaolinite prefers to adsorb light REEs. In addition, they also found that with the increase in the depth of the ion-adsorption RE ore body, the amount of light REEs gradually decreased, while the amount of heavy REEs showed an upward trend. He et al. [16] found that light RE ions are preferentially adsorbed by kaolinite at high ionic strengths, and that the fractionation effect of RE ions in ion-adsorption RE ores is mainly due to selective adsorption of light RE ions by kaolinite and halloysite.
The above studies mainly concentrated on experimental phenomena, while little attention has been paid to adsorption/desorption mechanisms. Chemical theoretical calculations are an effective method to investigate the reaction mechanisms on molecular and atomic scales [17,18,19]. In previous studies, we found that hydrated RE ions can be adsorbed on the kaolinite’s Si-O surface through hydrogen bonds, while coordination and hydrogen bonds were found on the Al-OH surface. The hydroxyl groups of the Al-OH surface can be protonated and deprotonated, and because active reactions of the surface are enhanced when the surface hydroxyl is deprotonated, coordination bonds form between hydrated RE ions and deprotonated oxygen [20,21]. A similar conclusion was also found by Peng [22] and Wang et al. [23], who revealed that the adsorption energy of RE ions increased with the increase in the degree of surface hydroxyl deprotonation. All of these works investigated the adsorption of single hydrated RE ions on kaolinite using density functional theory (DFT) and made lateral comparisons, ignoring the competitive adsorption between light and heavy RE ions. Molecular dynamics (MD) calculations can simulate systems that resemble the real reaction environment to obtain statistical parameters that supplement DFT calculations [24,25].
In our previous work [26], we found clear differences in desorption behavior between light and heavy REEs; however, the mechanism behind these differences is unclear. Hence, the competitive adsorption behavior of light and heavy REEs on kaolinite surfaces is studied through this experiment. Moreover, MD calculations were used to reveal the microscopic mechanisms of competitive adsorption at the molecular level. This research is beneficial to enriching metallogenic theory and optimizing leaching technology for ion-adsorption RE ores.

2. Results and Discussion

2.1. Experimental Results

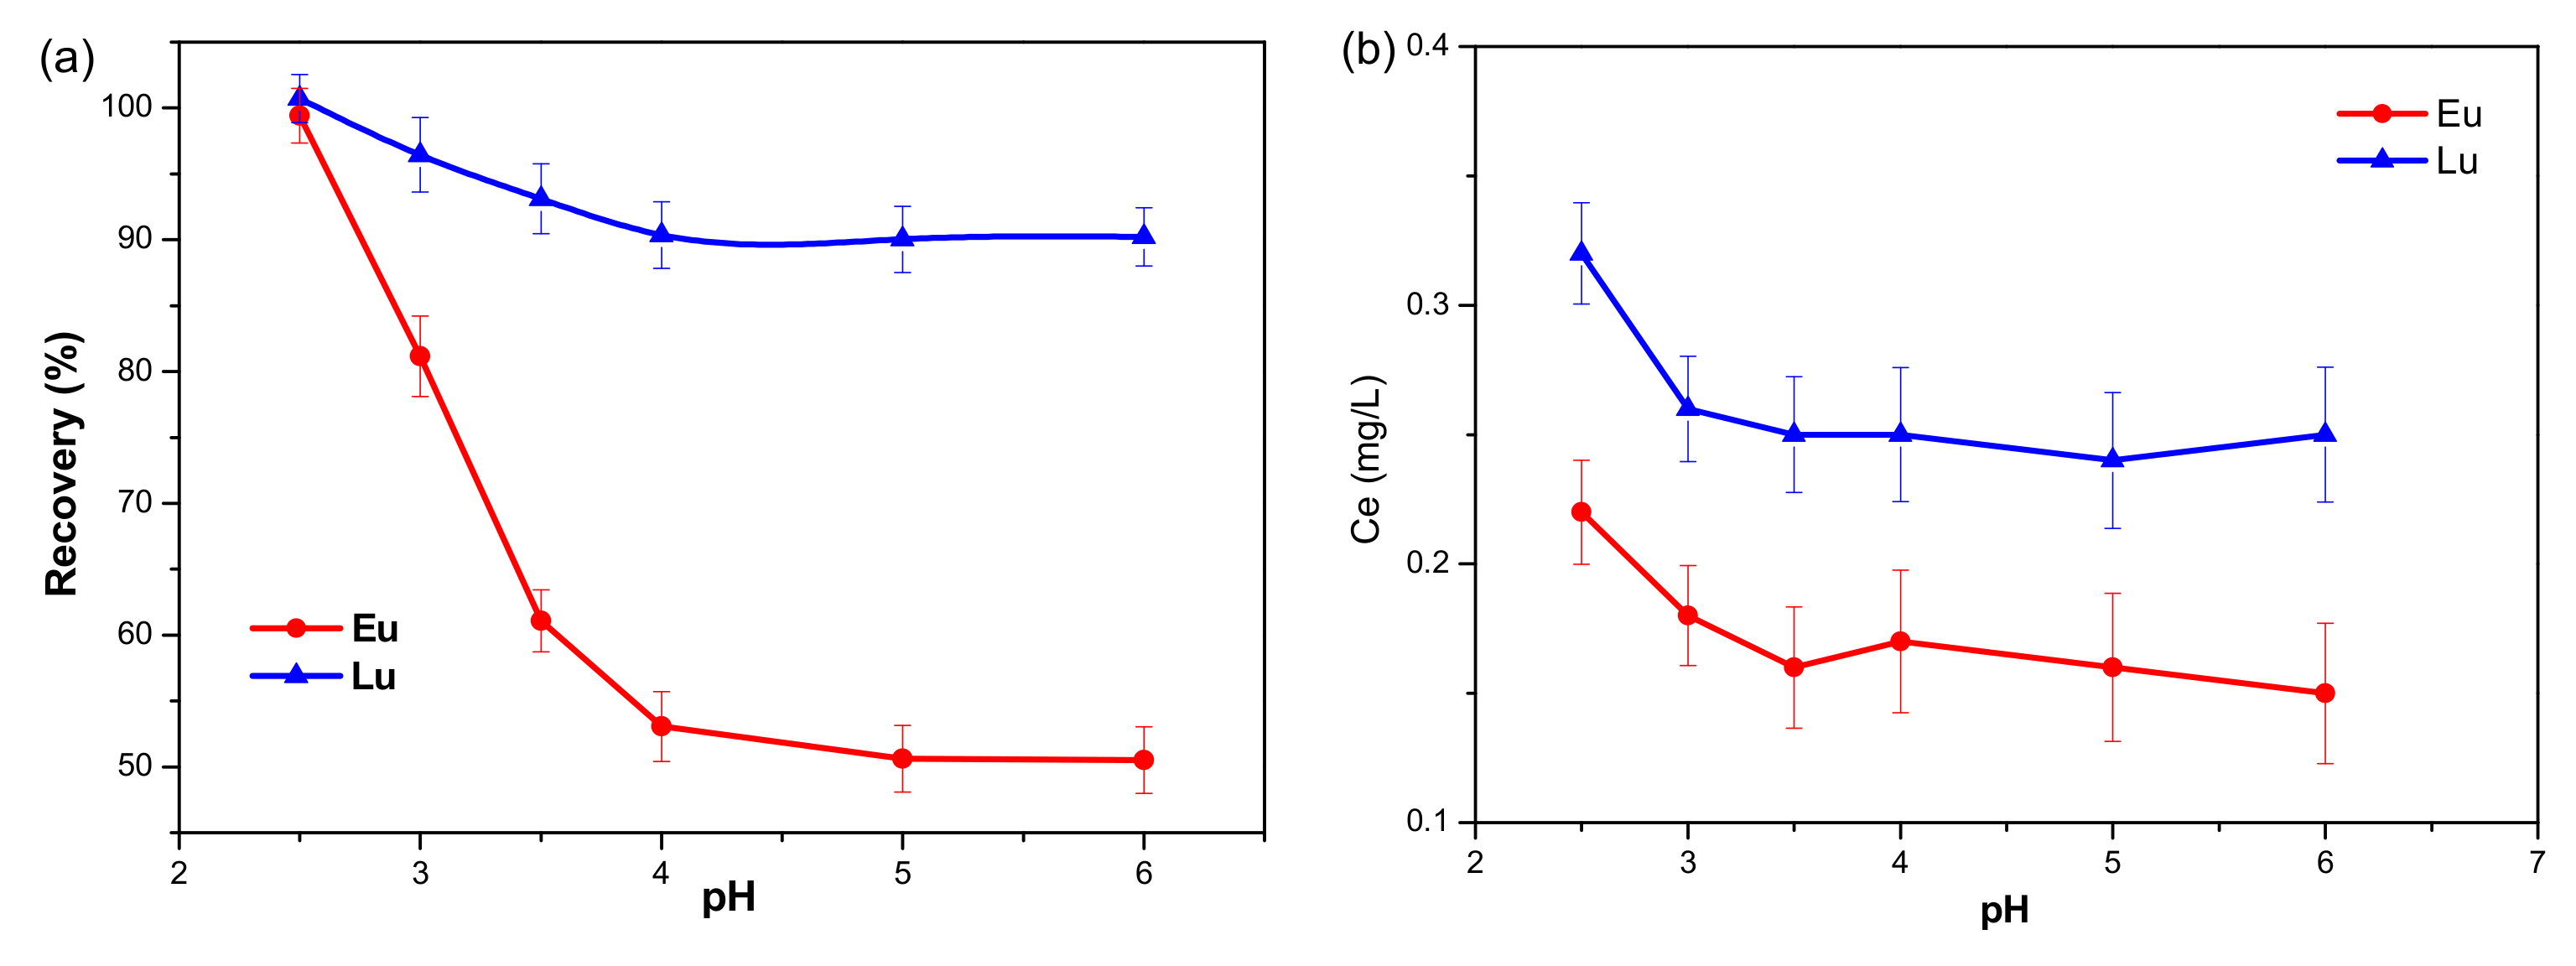
2.1.1. Desorption Characteristics of Eu3+ and Lu3+ from Kaolinite

The recovery of Eu3+ and Lu3+ from adsorbed and raw kaolinite was evaluated as a function of the pH value. As shown in Figure 1a, the desorption characteristics of Eu3+ and Lu3+ from adsorbed kaolinite were clearly different. The recovery of Eu3+ first decreased sharply with an increase in pH, and then remained constant at 50.5% when the pH was higher than 4. By contrast, the recovery of Lu3+ decreased slightly with an increase in pH, but a recovery as high as 90.2% was observed when the pH was lowered to 6. In Figure 1b, the equilibrium concentrations of Eu3+ and Lu3+ are 0.23 mg/L and 0.32 mg/L, respectively, which are much lower than the equilibrium concentrations of Eu3+ (21.1 mg/L) and Lu3+ (25.2 mg/L) desorbed from kaolinite. These results demonstrate that the Eu3+ and Lu3+ released from kaolinite almost always originate from adsorption.
Previous studies have shown that RE ions are adsorbed on clay surfaces through cation exchange, surface complexes, and electrostatic adsorption [27,28]. In addition, RE ions tend to adsorb on the deprotonated kaolinite surface through coordination bonds, which are hard to remove. Therefore, the low recovery of Eu3+ at a high pH might due to the coordination bonds between Eu3+ and the deprotonated surface. This observation can be verified by the following MD simulations. In order to clearly reveal the differences in desorption characteristics between Eu3+ and Lu3+, the competitive kinetics of adsorption of Eu3+ and Lu3+ onto kaolinite were studied.

2.1.2. Adsorption Kinetics

The competitive adsorption efficiencies of Eu3+ and Lu3+ on kaolinite are shown in Figure 2. The qe of Lu3+ was slightly higher than that of Eu3+, indicating that the fractionation effect for light and heavy REEs occurred on kaolinite. The qe of Eu3+ and Lu3+ increased with an increase in contact time, and adsorption equilibria were reached at 120 min and 60 min, respectively. As the contact time continued to increase, there was little increase in the adsorption capacity; however, 95% of Lu3+ was adsorbed within 20 min, while only 82% of Eu3+ was adsorbed. These results imply that the adsorption rate of Eu3+ was much slower than that of Lu3+, which might be due to the presence of a different adsorption mechanism. The slow adsorption rate of Eu3+ might be due to the formation of coordination bonds between Eu3+ and the kaolinite surface, which leads to low desorption rates at high pH values. Moreover, the adsorption of almost all of Lu3+ was quite rapid, which might be due to the weak electrostatic attraction between Lu3+ and the surface [20]. Hence, Lu3+ was easily desorbed at high pH values. Eu3+, which is more firmly attached to kaolinite, required lower pH values for full desorption [29].
Pseudo-first-order [30] and pseudo-second-order [31] models were adopted to study the kinetic adsorption characteristics of Eu3+ and Lu3+ on kaolinite. The corresponding models are expressed in Equations (1) and (2).
The pseudo-first-order model is
ln q e q t = l n q e k 1 t
The pseudo-second-order model is
t q t = 1 q e t + 1 k 2 q e 2
where qt is the adsorption capacity of RE ions at time t, and k1 and k2 are the rate constants for pseudo-first-order and pseudo-second-order models, respectively.
The fitted results of the kinetics of Eu3+ and Lu3+ adsorption on kaolinite are shown in Figure 3, while Table 1 lists the values of kinetics parameters for pseudo-first-order and pseudo-second-order models. The correlation coefficient values (R2) of Eu3+ and Lu3+ for pseudo-second-order models were 0.998 and 0.999, respectively, which are higher than those of pseudo-first-order models, suggesting that the adsorption kinetics of Eu3+ and Lu3+ on kaolinite all matched well to the pseudo-second-order model; a similar conclusion was obtained by Guan et al. [32]. In addition, the larger k2 of Lu3+ implies that the adsorption rate of Lu3+ was higher than that of Eu3+.

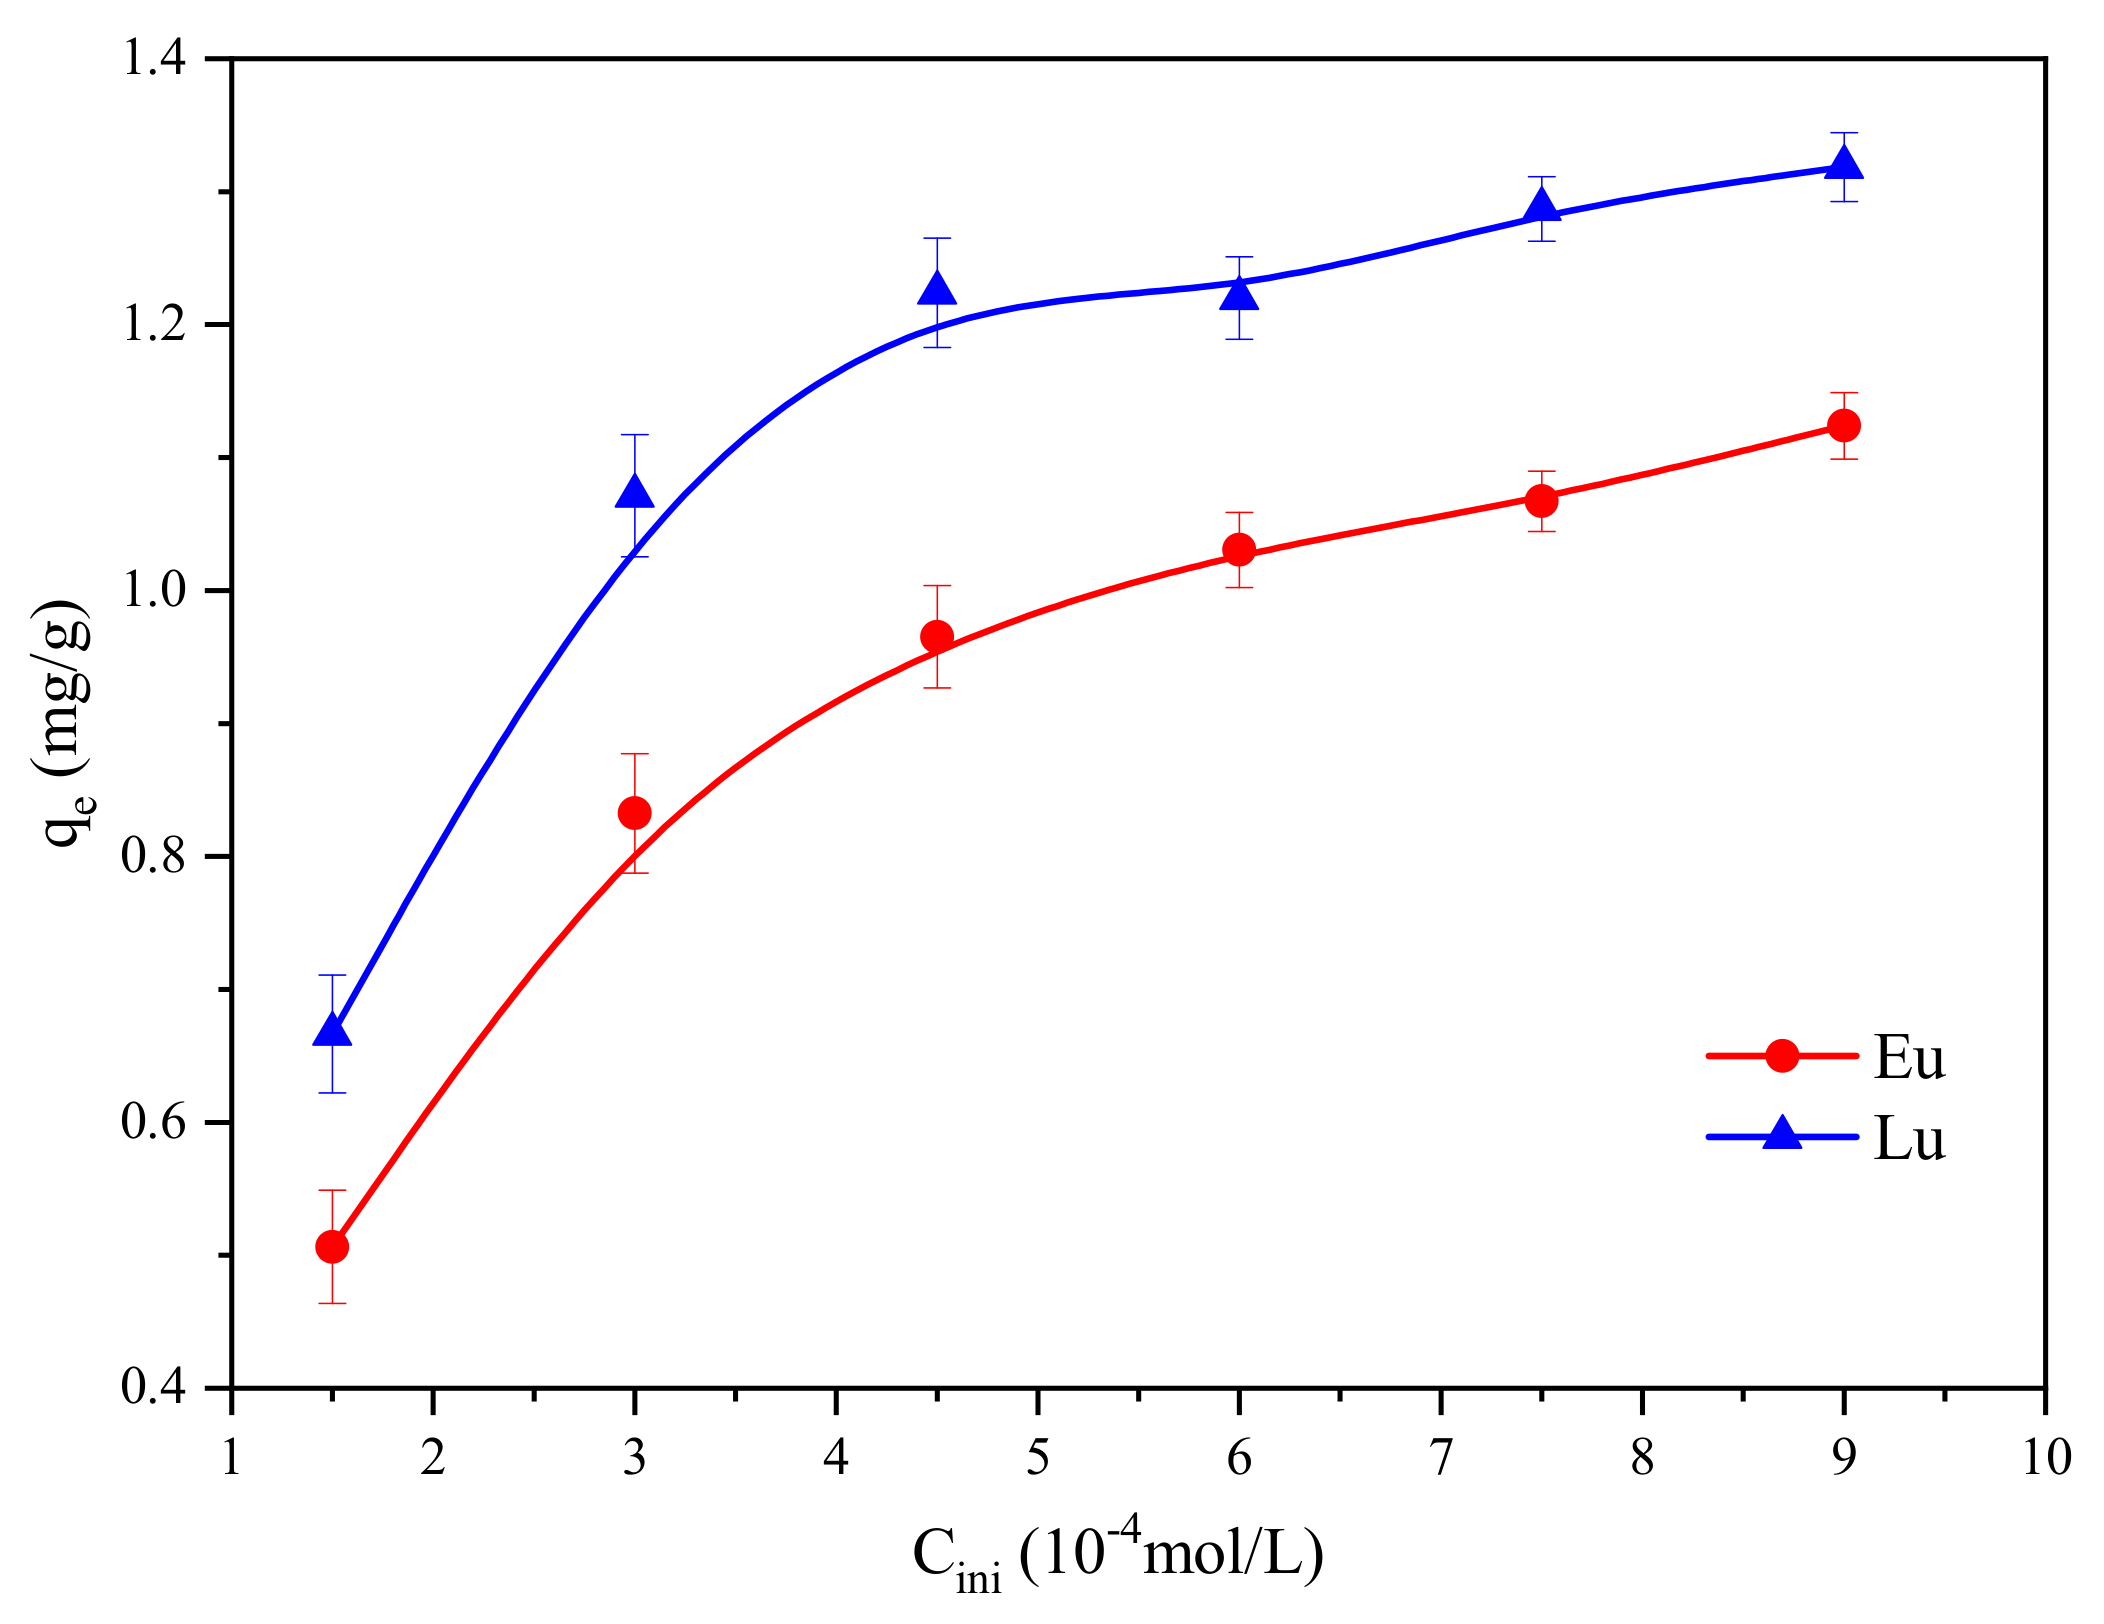
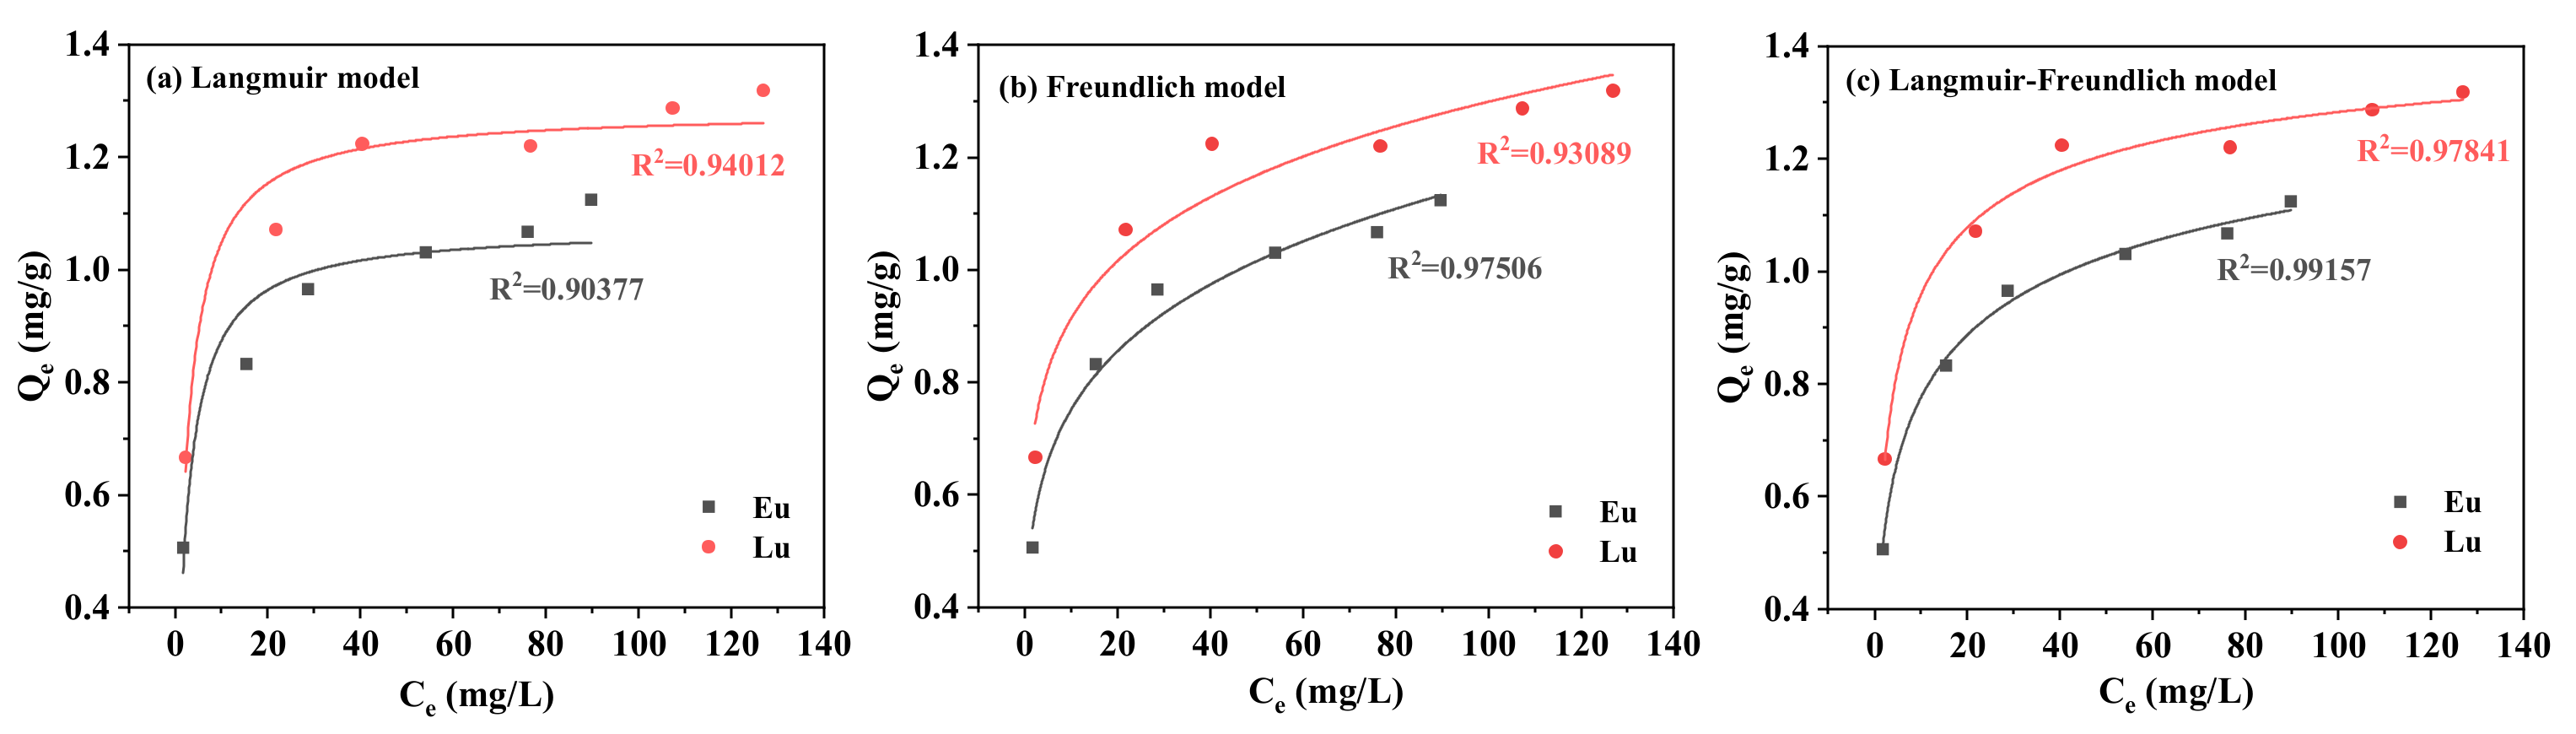
2.1.3. Adsorption Isotherms

The effect of different initial concentrations of Eu3+ and Lu3+ on the equilibrium adsorption capacities are presented in Figure 4. The adsorption capacities of Eu3+ and Lu3+ increased rapidly with the increase in initial concentrations, but increased slowly when initial concentrations were higher than 0.45 mmol/L. The results indicated that the increase in initial concentration of Eu3+ and Lu3+ was beneficial to the increase in adsorption capacities, since the increase in initial Eu3+ and Lu3+ concentrations increases the mass-transfer driving force of Eu3+ and Lu3+ between the solution and the kaolinite surface [33].
Many isotherms have been used to model equilibrium adsorption data to obtain adsorption information such as adsorption mechanisms, maximum adsorption capacities, and adsorbent properties [34]. In this study, two-parameter adsorption isotherms (the Langmuir and Freundlich model) and three-parameter adsorption isotherms (the Langmuir–Freundlich model) were chosen to describe the properties of the adsorption of Eu3+ and Lu3+ on the kaolinite surface. Since linearization of the adsorption model changes the dependent and independent variables and introduces propagation errors [34,35], a nonlinear fitting method was chosen for this study.
The basic assumptions of the Langmuir isotherm are [34] as follows: (1) monolayer adsorption; (2) homogenous distribution of adsorption sites; (3) constant adsorption energy; and (4) a negligible interaction between adsorbate molecules. The nonlinear Langmuir model is presented as follows:
Q e = Q L K L C e 1 + K L C e
where Qe is the equilibrium adsorption capacity (mg/g), KL is the Langmuir constant (L/mg), Ce is the equilibrium concentration (mg/L), and QL is the maximum adsorption capacity (mg/g).
The Freundlich model [36] assumes the heterogeneity of the surface, as well as that adsorption occurs at different active sites. Stronger binding sites are occupied first, and the binding strength decreases with an increase in site occupation [37]. The nonlinear Freundlich model is presented as follows:
Q e = K F C e n F
where Qe is the equilibrium adsorption capacity (mg/g), KF is the Freundlich adsorbent capacity ( m g / g ) / ( m g / L ) n F , and nF is a constant.
However, the adsorption process is often complex: the adsorbent surface is not completely homogeneous, adsorption sites are inhomogeneous, and the adsorption process may also coexist with chemisorption and physisorption. Due to this, the Langmuir and Freundlich adsorption isotherm models have some limitations, and the latter is also unable to determine the maximum adsorption capacity. On this basis, the Langmuir–Freundlich isotherm model was developed by combining the two isotherm models [38,39,40]. The Langmuir–Freundlich isotherm model assumes that at low adsorbate concentrations, the model satisfies the Freundlich isotherm model, whereas under high-adsorbate-concentration conditions, it will satisfy the Langmuir isotherm model [41]. Its nonlinear equations are expressed as follows:
Q e = Q L F K L F C e n L F 1 + K L F C e n L F
where Qe is the equilibrium adsorption capacity (mg/g), QLF (mg/g) is the Langmuir–Freundlich maximum adsorption capacity of the adsorbent; KLF (L/mg) is the Langmuir–Freundlich equilibrium constant; and nLF (dimensionless) is the exponent of the Langmuir–Freundlich model.
The fitting plots of Langmuir, Freundlich, and Langmuir–Freundlich adsorption isotherm models of Eu3+ and Lu3+ are shown in Figure 5, and Table 2 presents the corresponding parameters of these models. As the adjusted correlation coefficients (adj-R2) are above 0.90, it can be concluded that almost all selected models fit the experimental data of the adsorption process well. A higher correlation coefficient (R2 >0.97) and a lower red-χ2 (reduced chi-square statistic) value for the Langmuir–Freundlich model suggest that the sorption isotherms were better fitted by this model than by the Langmuir and Freundlich models. In addition, the Langmuir–Freundlich isotherm model overestimates the value of maximum adsorption, which has also been observed in other studies [40]. Based on the basic assumptions of the Langmuir–Freundlich isotherm model, the following conclusions are drawn: Both homogeneous and heterogeneous active adsorption sites are present on the surface of kaolinite, and the adsorption behaviors of Eu3+ and Lu3+ satisfy the Freundlich isotherm model under the condition of a low concentration. This means that Eu3+ and Lu3+ will preferentially occupy stronger-binding sites, whereas at a high concentration, the adsorption behaviors of Eu3+ and Lu3+ satisfy the Langmuir isothermal model. The Langmuir model can describe chemisorption (chemical adsorption with about 50% coverage fraction) and physical adsorption is represented by the Freundlich model [34]. However, isothermal adsorption models can only approximately determine adsorption mechanisms, especially the Freundlich model, which is an empirical model and lacks specific physical significance; therefore, it is difficult to clarify the adsorption mechanism of Eu3+ and Lu3+ by model fitting [34]. The adsorption mechanism needs to be further corroborated by molecular dynamics simulations.

2.2. MD Calculation

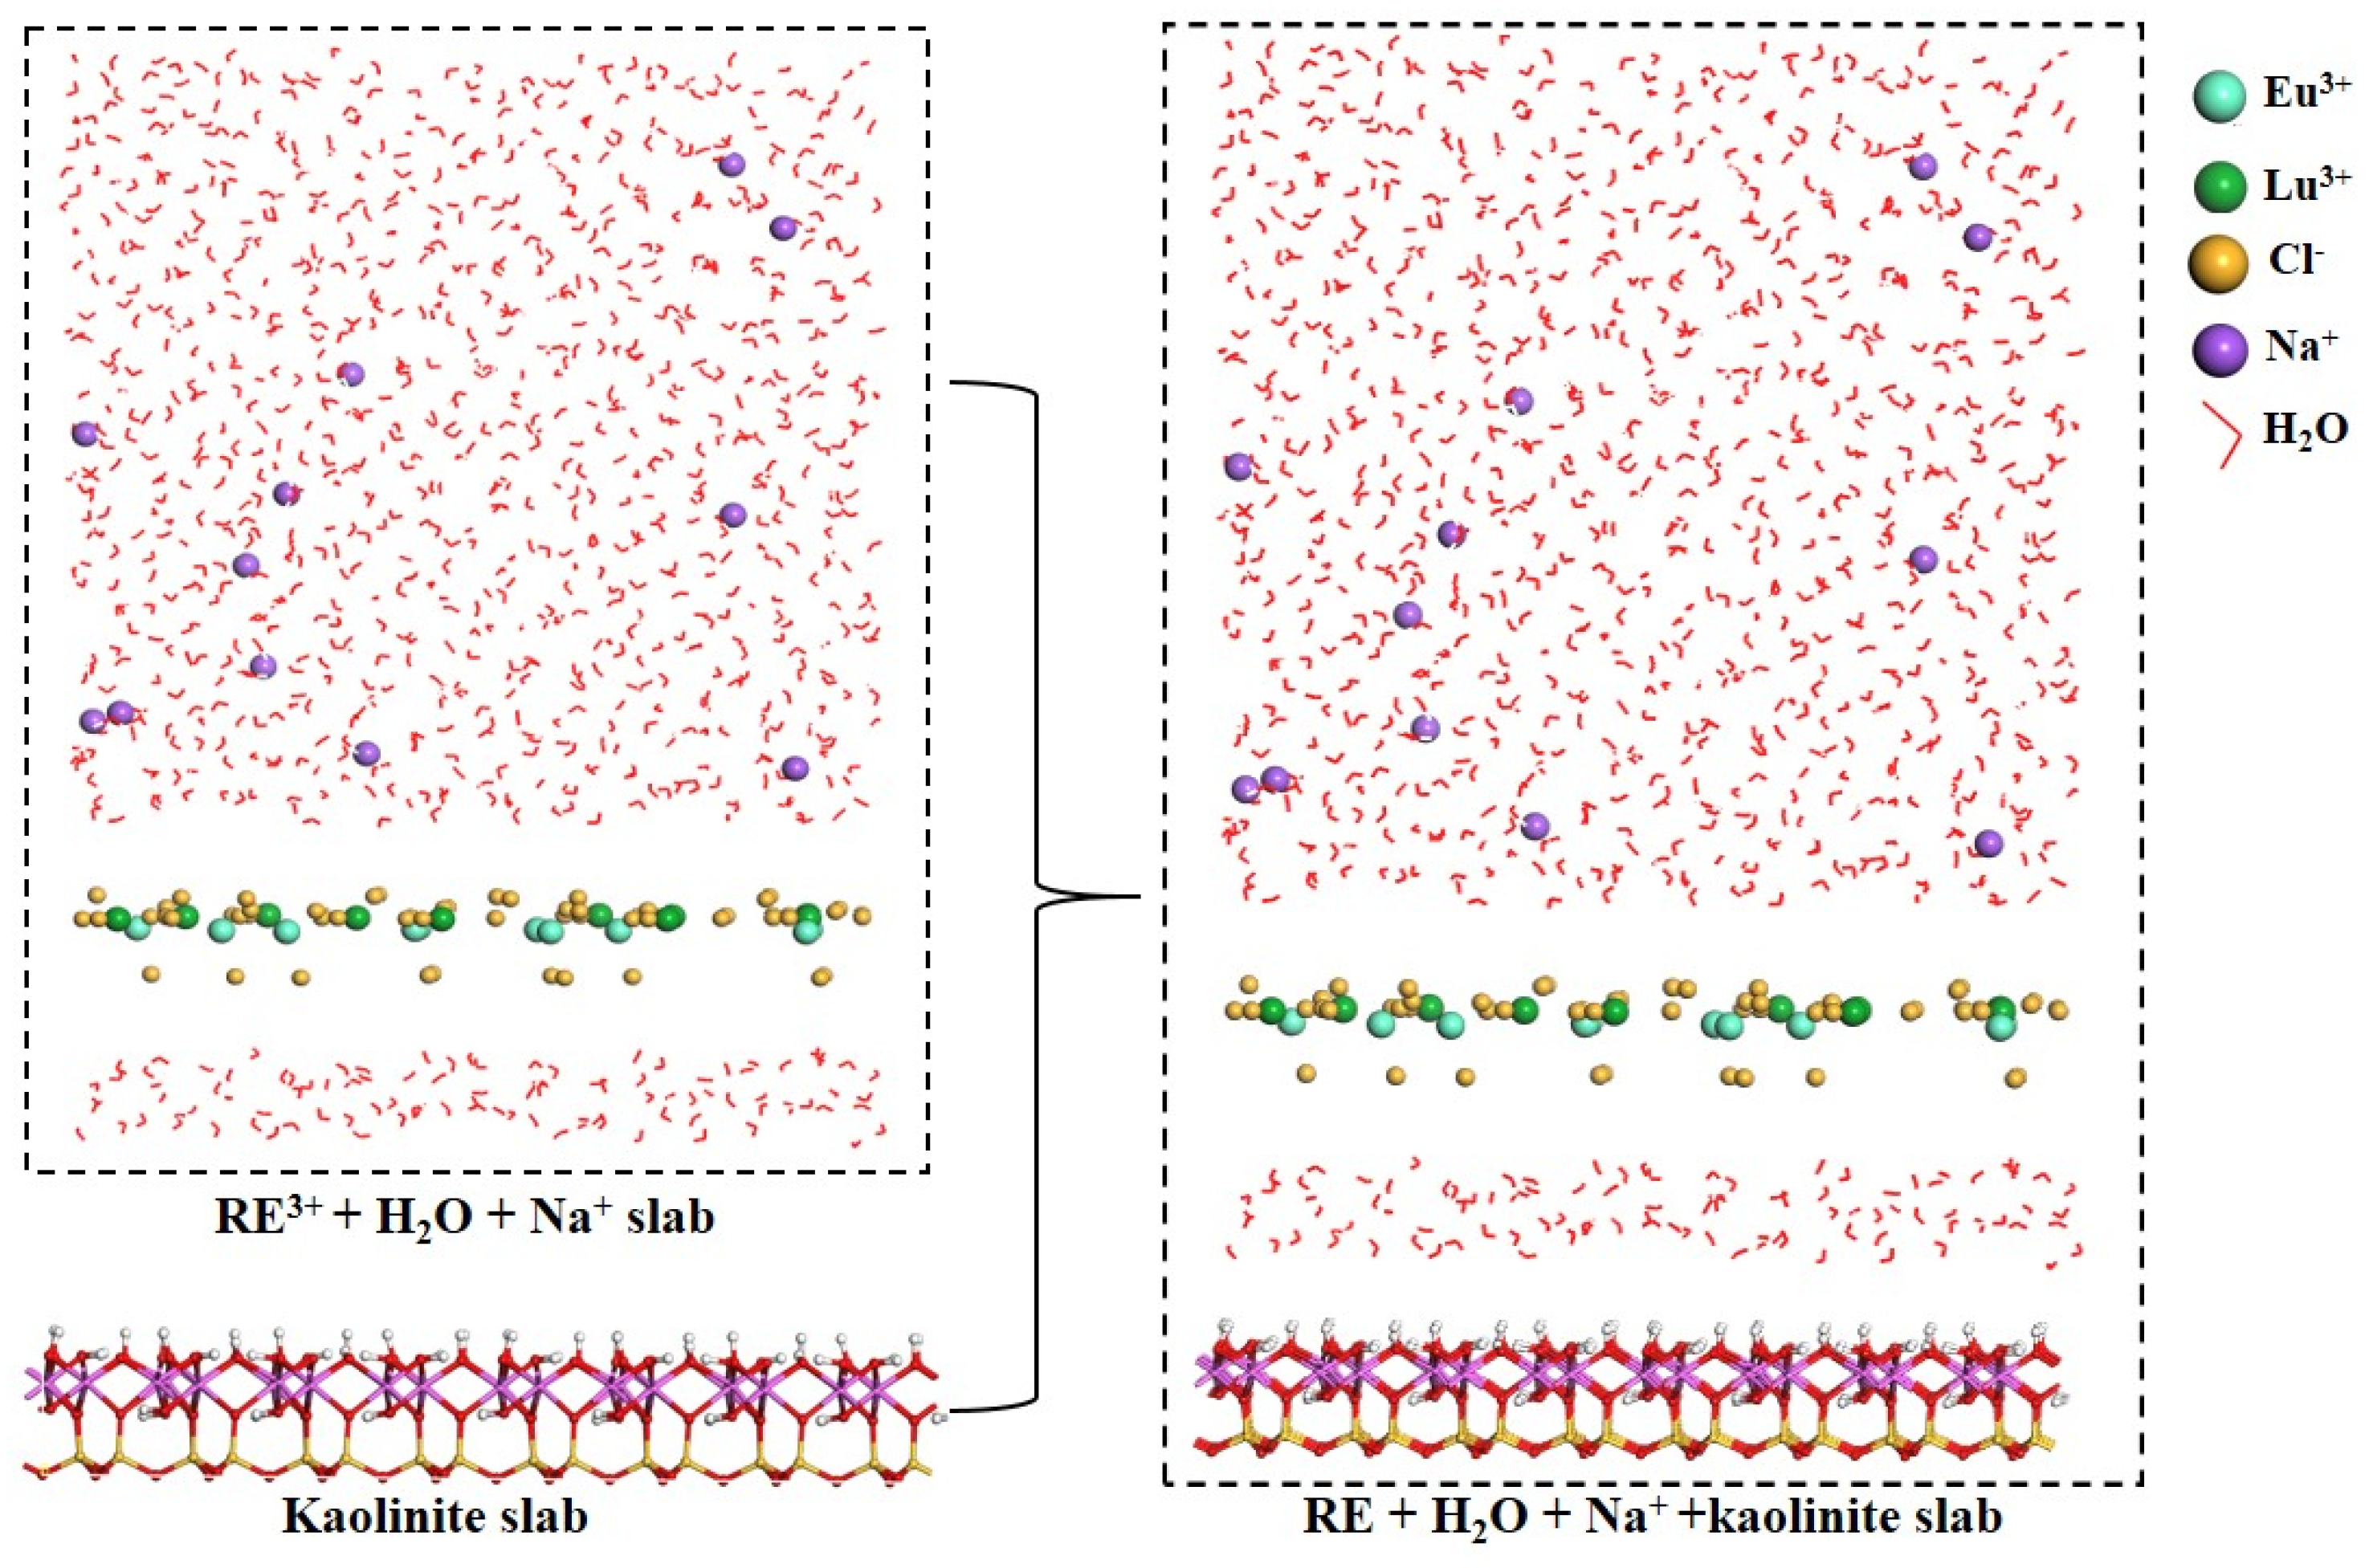
2.2.1. Adsorption Behavior of Eu3+ and Lu3+

In order to clearly reveal the difference in desorption characteristics between Eu3+ and Lu3+ on a deprotonated kaolinite (001) surface on a molecular scale, MD calculations, which can determine the statistical properties of a large system, were adopted.
The adsorption geometries of Eu3+ and Lu3+ on the deprotonated kaolinite (001) surface at different simulation times are shown in Figure 6. It can be observed that most Eu3+ and Lu3+ moved towards the kaolinite surface over time, forming an electric double layer. This surface is negatively charged, which is attractive to cations (Eu3+ and Lu3+). From the snapshots of 1 ps, 5 ps, and 10 ps, it can be seen that Eu3+ moved towards the surface significantly faster than Lu3+. The positions of Eu3+ and Lu3+ near the kaolinite surface remained almost unchanged at 50 and 500 ps, suggesting that a simulation of 500 ps was enough to reach adsorption equilibrium. When the system was at equilibrium, there were four Eu3+ ions on the deprotonated oxygen of kaolinite surface at distances of 2.14 Å, 2.21 Å, 2.45 Å, and 2.63 Å. These distances indicate that coordination bonds formed between Eu3+ and the surface. However, the smallest distance between Lu3+ and the deprotonated oxygen of kaolinite surface was 3.2 Å. When the distance between RE3+ and the kaolinite surface is less than 3 Å, it is called inner-layer adsorption, and when the distance is greater than 3 Å, it is called outer-layer adsorption. The MD results indicate that the interaction force between Eu3+ and the kaolinite surface was stronger than that of Lu3+.
The MD simulation explain for the difference in desorption behavior between Eu3+ and Lu3+ on the deprotonated kaolinite (001) surface. At a pH of 6, part of the hydroxyl surface is deprotonated and kaolinite mixes with the neodymium chloride and lutetium chloride solution, which contains active sites for inner-layer adsorption. In addition, the diffusion rate of Eu3+ on the deprotonated kaolinite surface was significantly faster than that of Lu3+. Hence, Eu3+ ions preferentially occupy the limited inner-layer adsorption sites, and these Eu3+ ions were difficult to desorb via ion exchange. Due to the limited inner-layer adsorption sites, Lu3+ can only be adsorbed via outer-layer adsorption. Therefore, the desorption rate of Eu3+ from kaolinite decreases significantly with an increase in pH, while the desorption rate of Lu3+ was less affected by the pH value.

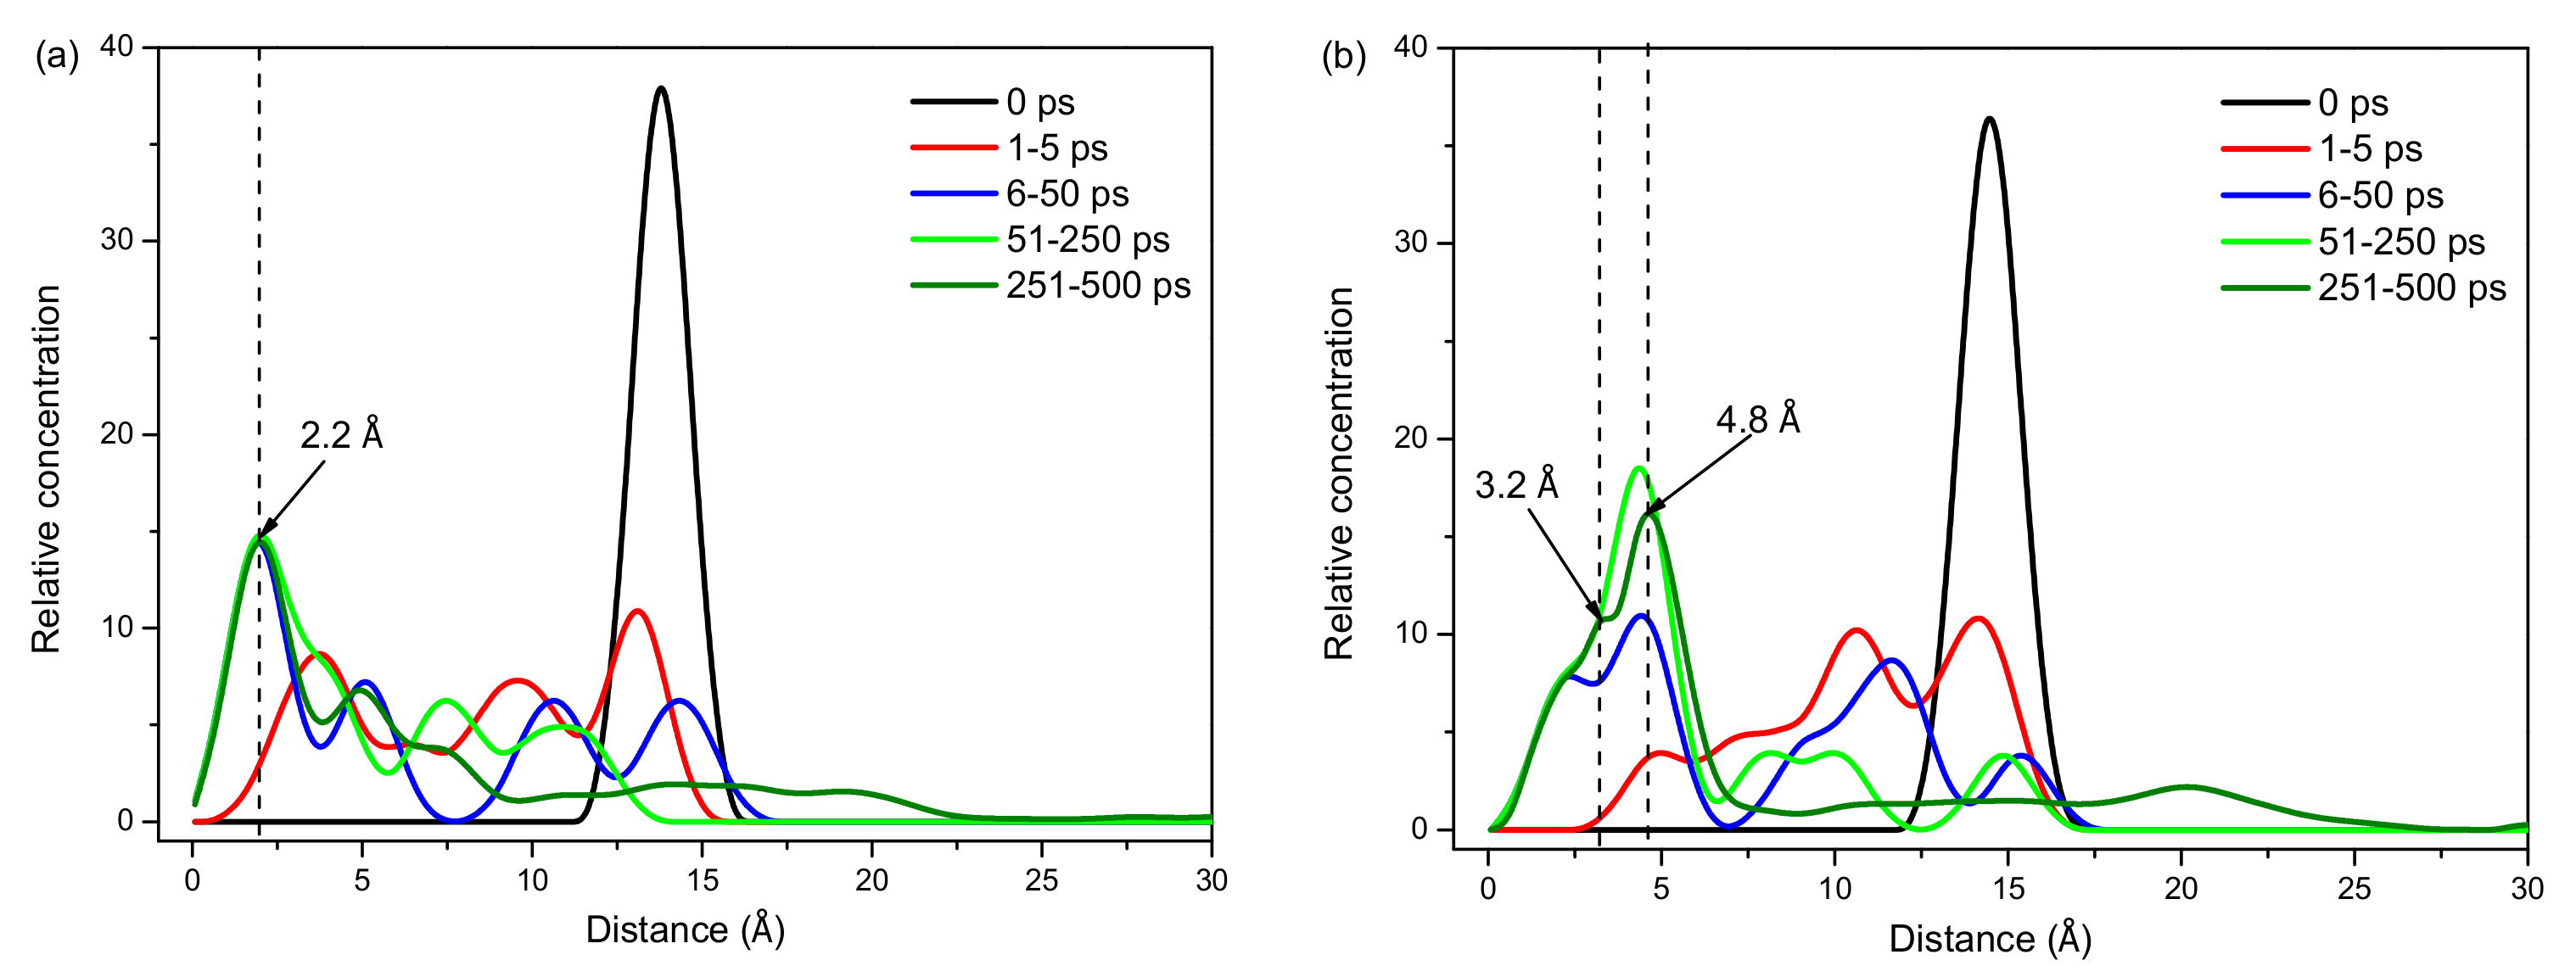
2.2.2. Concentration Distribution of Eu3+ and Lu3+ on the Surface

To quantify the adsorption of Eu3+ and Lu3+ on the kaolinite surface, the concentration profiles of Eu3+ and Lu3+ on the normal direction of the kaolinite (001) surface at different times are shown in Figure 7. As the simulation time increases, the peaks in the concentration profiles of Eu3+ and Lu3+ move towards the kaolinite surface. When the simulation duration is larger than 50 ps, the first peak of the concentration profile of Eu3+ basically coincides with different time periods, indicating that the position of Eu3+ near the surface of kaolinite remains unchanged after 50 ps, which was also verified by the adsorption geometries of Eu3+ at different times (Figure 6). The intensity of the first peak of the concentration profile of Lu3+ was still not the same after 50 ps, because there were no interactions between Lu3+ and the kaolinite surface; thus, Lu3+ can move freely in the solution.
The relative concentration profiles shown that the first concentration peak of Eu3+ appeared at 2.2 Å, indicating that a coordination bond was formed between Eu3+ and the kaolinite surface, whereas the distances between other Eu3+ ions and the kaolinite surface were larger than 3 Å, implying that only a some of the Eu3+ ions were adsorbed on the kaolinite surface by a coordination bond. However, the first concentration peak of Lu3+ appeared at 3.2 Å, while most of the Lu3+ appeared at 4.8 Å, indicating a more tightened adsorption of Eu3+ on the kaolinite. According to the literature [42,43,44], the density peaks located at a distance of less than 0.3 nm from the surface are linked to inner-sphere adsorption. Therefore, Eu3+ exhibited inner-sphere adsorption on the kaolinite surface through ligand bonding, while Lu3+ exhibited outer-sphere adsorption mainly through electrostatic interactions.

2.2.3. Diffusion Abilities of Eu3+ and Lu3+

The MSD is linear with time and the statistics decrease with time; large fluctuations are often observed at the end. Therefore, the number of frames used in the calculation of MSD was no more than half of the total number of frames. The MSD of Eu3+ and Lu3+ at 0–250 ps was determined to investigate the diffusion ability. Figure 8 shows the mean squared displacement and linear fittings of Eu3+ and Lu3+ on the kaolinite surface. The self-diffusion coefficients (D) of Eu3+ and Lu3+ according to the fitting calculation are listed in Table 3. It can be seen from Table 3 that the self-diffusion coefficient of Eu3+ is 7.6 × 10⁻⁹ m2/s, which is larger than that of Lu3+, implying that the diffusion ability of Eu3+ was greater than that of Lu3+ in the simulation system. These results indicate that the adsorption of Eu3+ on the deprotonated kaolinite surface is kinetically dominant.

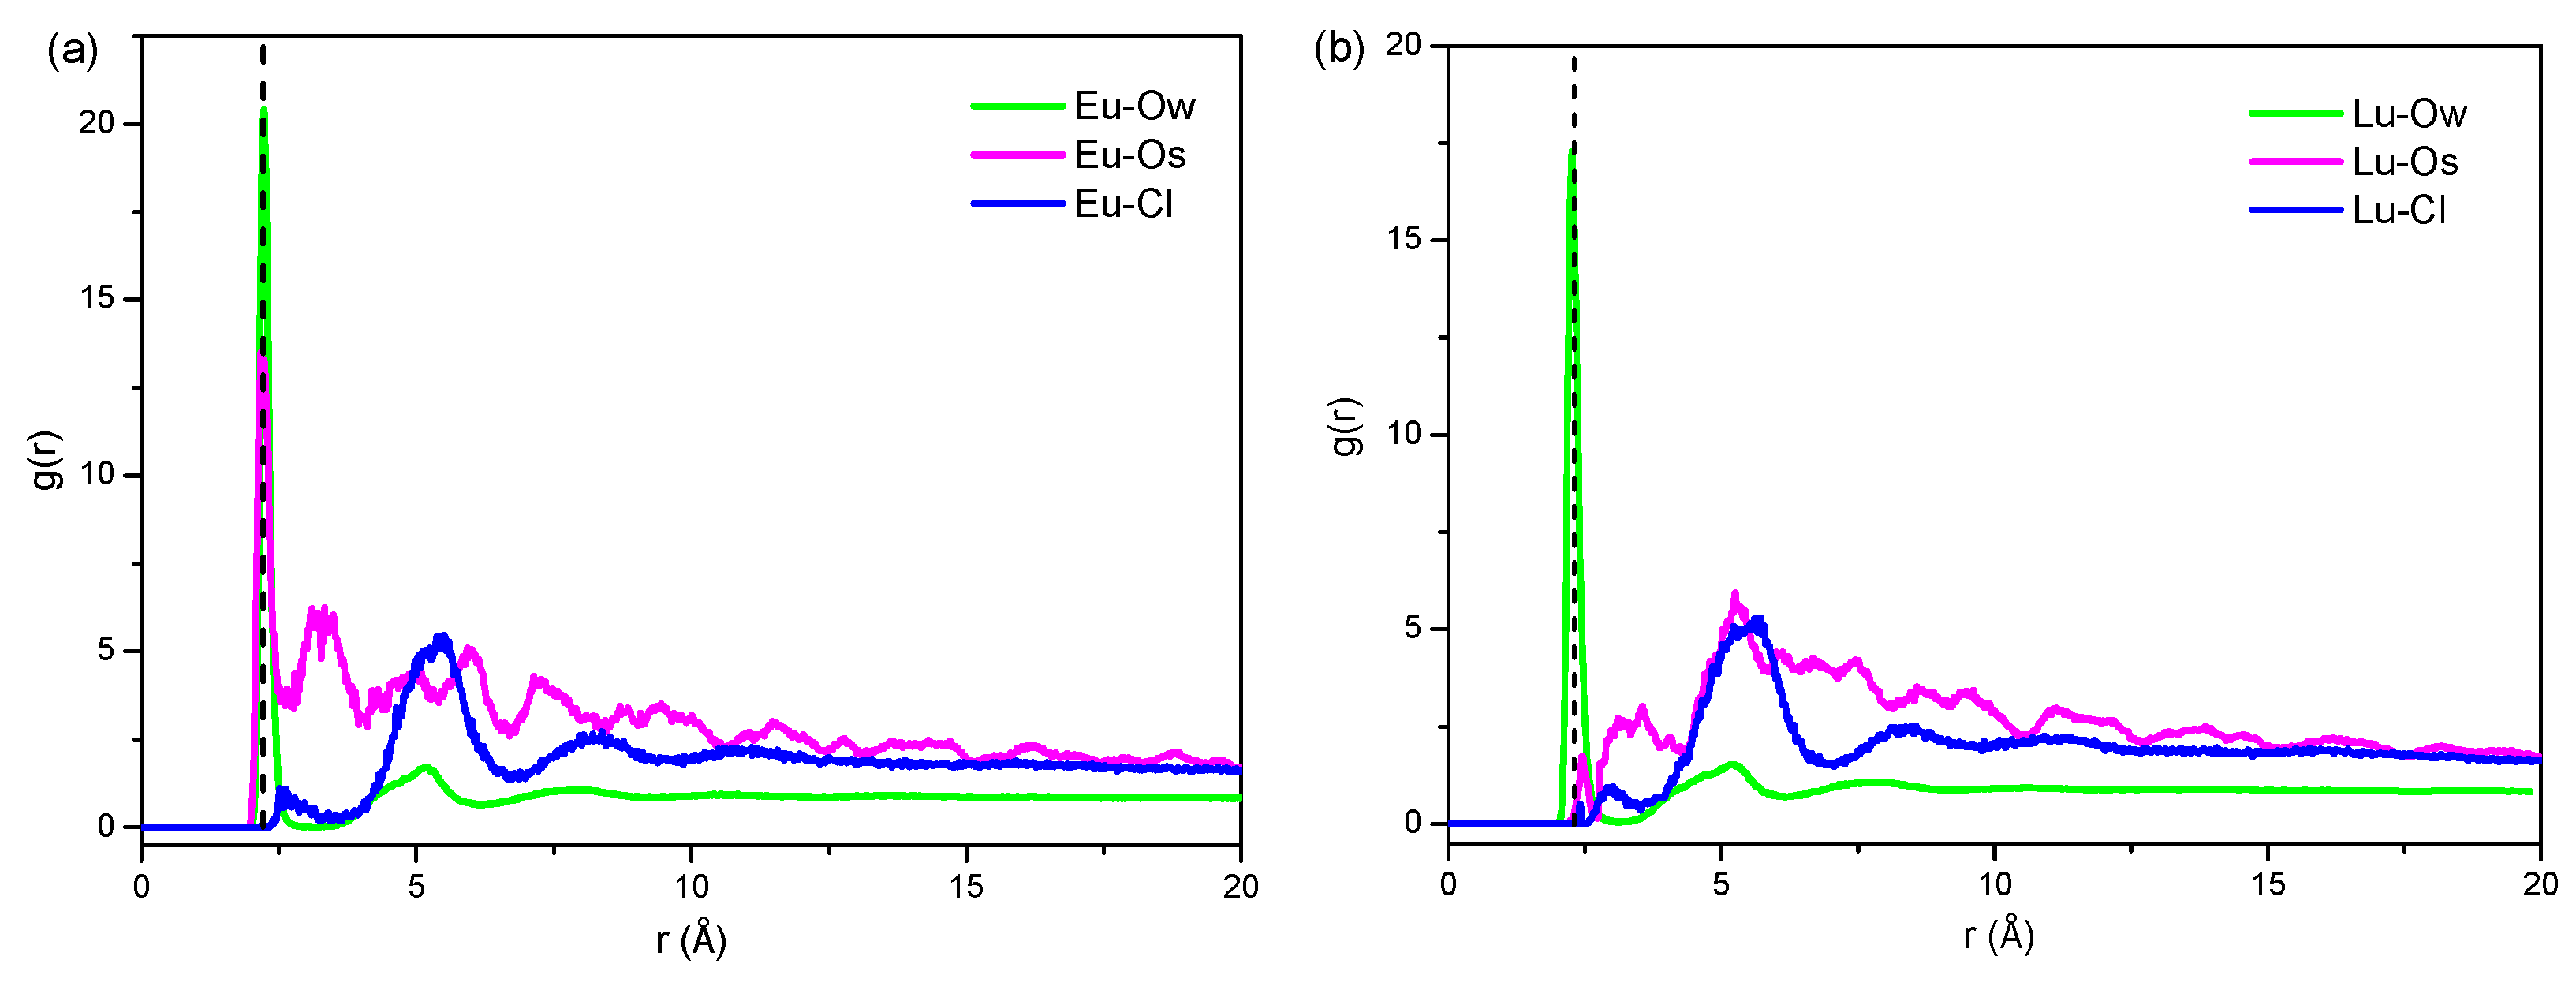
2.2.4. Radial Distribution Function of Eu3+ and Lu3+

The RDF was used to study the aggregation of Eu3+ and Lu3+ with surrounding particles in order to obtain the coordination number. Generally, water molecules within 3 Å from the metal ion is regarded as the first hydration number. The intensity of the first peak of the atomic radial distribution function in RE-OW (oxygen of water) indicates the ordering degree of molecular water around RE3+.
Figure 9 shows RDFs of Eu-Ow, Eu-Os, Eu-Cl, Lu-Ow, Lu-Os, and Lu-Cl pairs at 500 ps. It was found that the first sharp peaks of Eu-Ow and Lu-Ow are present at 2.23 Å and 2.31 Å, respectively, and the intensity of these peaks for Eu-Ow was higher than that of Lu-Ow, implying that the ordering degree of water molecules around Eu3+ is higher than that of Lu3+. On the other hand, the higher ordering degree of water molecules is beneficial for the movement of Eu3+ to the kaolinite surface and the preferential occupation of adsorption sites. As seen in Figure 9, a strong peak appeared in the radial distribution function between Eu and Os within 0–3 Å, while it did not appear in Lu-Os, indicating that Eu3+ is closer to the kaolinite surface. As for Cl, there was no peak within 0–3 Å, with the first peak appearing around 5.17 Å, indicating that Cl ions were far away from Eu3+ and Lu3+, as EuCl3 and LuCl3 are fully ionized in aqueous solutions.
The coordination numbers at 500 ps were obtained by integrating RDFs of Eu-Ow, Eu-Os, Eu-Cl, Lu-Ow, Lu-Os, and Lu-Cl (Table 4). The first hydration number of Eu3+ was 7.1, which is less than that of Lu3+, due to the coordination number of Os between Eu-Os being higher than that of Lu-Os, which indicates that a certain amount of water coordinated to Eu3+ was replaced by Os. The coordination number of Cl between Eu-Cl and Lu-Cl was only 0.01, indicating that almost no Cl enters the first coordination layer of RE ions. The total coordination numbers of Eu3+ and Lu3+ are 8.12 and 8.01, respectively, which is close to the results reported by D’Angeol [45].

3. Experiments and Models

3.1. Experiment Details

3.1.1. Experimental Materials

The raw kaolinite used in this study was provided by Kaolin Co., Ltd., (Suzhou, China). The other chemicals used, such as europium chloride, lutecium chloride, and ammonium sulfate, were obtained from Sinopharm Chemical Reagent Co., Ltd., (Chengdu, China).

3.1.2. Desorption of RE Ions from Kaolinite

The mineralizing process of ion-adsorption RE ores was carried out in a slightly acidic environment; hence, kaolinite was added into a mixed solution of EuCl3 and LuCl3 at pH 6 in a mechanical shaker for 240 min. The adsorbents for Eu3+ and Lu3+ were desorbed using a 0.11 mol/L (NH4)2SO4 solution in the pH range of 2.5 to 6 for 240 min with a liquid–solid ratio of 50:1. H2SO4 was used to control the pH. After desorption, the rare-earth ion supernatant was obtained using centrifugation and filtration, and then, the concentration of rare earth ions in the supernatant was detected using an inductively coupled plasma–optical emission spectrometer (ICP-OES). In contrast, the same desorption process was also performed on raw kaolinite to ensure that the release Eu3+ and Lu3+ came from adsorption.
The leaching efficiencies were calculated using Equation (6).
R e c o v e r y % = c   V m   q e × 100
where c is the concentration of RE ions that are desorbed in the leaching solution; V is the volume of the leaching solution; m is the mass of an adsorbent; and qe is the adsorption capacity of RE ions.

3.1.3. Effect of Contact Time on Adsorption

The effect of contact time on the adsorption capacities (qe) of Eu3+ and Lu3+ on kaolinite was determined at a fixed pH of 6 at 25 °C. Furthermore, 1 g kaolinite was mixed with 25 mL of a mixed Eu3+ and Lu3+ solution with the concentration of 0.7 mmol/L for each REE. After adsorption, kaolinite was separated from the solution through centrifugation. After that, ultrapure water was used to remove the residue on the surface of the kaolinite and the kaolinite was then dissolved using acid to determine the qe of Eu3+ and Lu3+ on kaolinite via ICP-OES.
The equilibrium adsorption capacities (qe) were calculated by using the following equation:
q e = m M
where qe is the adsorption capacity (mg/g) and m and M represent the masses of the adsorbed REE and the adsorbent, respectively.

3.1.4. Adsorption Isotherm Experiments

The influence of the initial concentration of Eu3+ and Lu3+ on qe was studied by varying these concentrations in the range of 0.1–0.9 mmol/L with a contact time of 240 min at a fixed pH of 6.

3.2. Details of MD Calculations

Kaolinite is cleaved along the (001), (010), and (110) surfaces during crushing, with the basal surface (001) being the most easily cleaved, and thus this surface accounts for the largest percentage of the total area of kaolinite particles and has the greatest influence on the adsorption behavior of kaolinite [46]. Therefore, most of the current mechanistic studies have focused on the kaolinite (001) surface [44,47,48,49]. MD simulations were carried out using the Forcite module in Materials Studio software, which was developed by Accelrys Software Inc. Geometry optimization was carried out with a maximum iteration of 5000 in order to reduce the energy of the model to an acceptable level. Finally, a 500 ps MD simulation was performed at 298 K under an NVE ensemble while using the Universal [50] force field. Equations of motion were integrated with a time step of 1 fs for all dynamic runs, and the Nose function was selected for temperature control. The long-range electrostatic and van der Waals interactions were calculated using the Ewald- and Atom-based methods, respectively, with a cutoff radius of 12.5 Å. These parameters have been widely used to study the adsorption of metal ions on the kaolinite (001) surface [48,49].
In our previous work [11], we found that the Al-OH on the kaolinite (001) surface was deprotonated when the solution pH was higher than 4.1; therefore, we only investigated the competitive adsorption of Eu3+ and Lu3+ on the deprotonated Al-OH surface. Otherwise, adsorption experiments imply that the number of deprotonated sites is limiting; hence, we assumed that 10% (three OH groups) of the surface hydroxyls were deprotonated and, in turn, the deprotonated surface was geometry optimized with the Castep module. Afterwards, the deprotonated surface was replicated two times in the x- and y-directions to obtain a super-cell with the following dimensions: 20.61 × 35.77 × 10.31 Å3 (Figure S1). In order to maintain the electrical neutrality of the system, 12 Na+ ions were added as balancing ions. The construction function in the Amorphous Cell module of Materials Studio was used to construct the following three solvent models: (1) 100 H2O molecules; (2) 10 Eu3+, 10 Lu3+ and 60 Cl ions; and (3) 900 H2O molecules and 12 Na+ ions. Then, the kaolinite model and three solvent models were combined using the Build Layers tool to obtain the initial adsorption model. A flexible simple point charge (SPC) model [51] was used for water molecules, while the Mulliken atomic partial charges of water molecules and RE3+ were used to determine the Castep. A vacuum layer with a thickness of 20 Å was added to the water molecule layer to avoid interference from the periodic image layer in the z-axis direction. The method of constructing the kaolinite/water/RE interface models is presented in Figure 10.

4. Conclusions

Adsorption experiments and molecular dynamics simulations were applied to investigate the competitive adsorption of Eu3+ and Lu3+ on kaolinite to illustrate why Eu3+ ions exhibit stronger pH-dependent desorption behavior. The adsorption of Lu3+ reached equilibrium in 60 min, while Eu3+ adsorption reached equilibrium in 120 min; however, both fit well with the pseudo-second-order model. Although the adsorption of Eu3+ and Lu3+ fit well with the Langmuir model, the R2 value of the Freundlich model for Eu3+ was high at 0.98, indicating that Eu3+ might be adsorbed at sites of a different energy on the kaolinite surface.
MD simulations showed that some of the Eu3+ ions move rapidly to the deprotonated kaolinite surface and occupy the limited inner-layer adsorption sites. This was indicated by the higher ordering degree of water molecules around Eu3+ compared to that of Lu3+, which was beneficial to the diffusion of Eu3+ to the kaolinite surface. Hence, the self-diffusion coefficient of Eu3+ is larger than that of Lu3+. As a result, some of the Eu3+ adsorbed to the kaolinite surface via inner-layer adsorption, and can be desorbed by a strong acid, while Lu3+ adsorbs via outer-layer adsorption, which can be desorbed via ion exchange. The different desorption behaviors of Eu3+ and Lu3+ were clarified by MD simulations on an atomic scale.

Supplementary Materials

The following supporting information can be downloaded at: https://www.mdpi.com/article/10.3390/molecules30040838/s1, Figure S1: The modeling process of kaolinite super-cell; Figure S2: The concentration distribution profiles of H2O on the normal direction of kaolinite surface.

Author Contributions

Conceptualization, T.Q.; methodology, S.Q. and L.L.; software, S.Q. and X.L.; validation, S.Q.; formal analysis, Z.F.; investigation, T.T.; resources, Y.H.; data curation, Q.L.; writing—original draft preparation, Y.H.; writing—review and editing, S.Q.; visualization, Z.F.; supervision, S.Q.; project administration, T.Q.; funding acquisition, K.Z. and T.Q. All authors have read and agreed to the published version of the manuscript.

Funding

This research was funded by the National Natural Science Foundation of China (No. 52274262). Jiangxi Provincial Natural Science Foundation (20242BAB20191). Funded by Key Laboratory of Ionic Rare Earth Resources and Environment, Ministry of Natural Resources of the People’s Republic of China (No. 20232IRERE305). Ganpo Juncai Support Program Youth Science and Technology Talent Support Project (No.2025QT15). GanPo Yingcai Support Program. Youth Innovative leading Talent Support Project (No. gpyc20240040).

Institutional Review Board Statement

Not applicable.

Informed Consent Statement

Not applicable.

Data Availability Statement

Data are contained within the article.

Conflicts of Interest

The authors declare no conflicts of interest.

Abbreviations

The following abbreviations are used in this manuscript:
RERare earth
MDMolecular dynamics
DFTDensity functional theory
MSDMean square displacement

References

  1. Marx, J.; Schreiber, A.; Zapp, P.; Walachowicz, F. Comparative Life Cycle Assessment of NdFeB Permanent Magnet Production from Different Rare Earth Deposits. ACS Sustain. Chem. Eng. 2018, 6, 5858–5867. [Google Scholar] [CrossRef]
  2. Xu, B.; Wang, Z.; Hu, J.; Zhang, L.; Zhang, Z.; Liang, H.; Zhang, Y.; Fang, G. Dy-Modified Mn/TiO2 Catalyst Used for the Selective Catalytic Reduction of NO in Ammonia at Low Temperatures. Molecules 2024, 29, 227. [Google Scholar] [CrossRef] [PubMed]
  3. Xu, C.; Song, W.; He, C.; Wang, Z. The Overview of Distribution, Type and Genesis of the Exogenetic Rare Earth Elements (REE) Deposits. Bull. Mineral. Petrol. Geochem. 2015, 34, 234–241. [Google Scholar]
  4. Sun, X.; Dong, Y.; Wang, Y.; Chai, Y. The Synergistic Extraction of Heavy Rare Earth Elements using EHEHP-type and BTMPP-type Functional Ionic Liquids. RSC Adv. 2015, 5, 49500–49507. [Google Scholar] [CrossRef]
  5. He, Z.; Zhang, Z.; Yu, J.; Xu, Z.; Chi, R. Process optimization of Rare Earth and Aluminum Leaching from Weathered Crust Elution-deposited Rare Earth Ore with Compound Ammonium Salts. J. Rare Earths 2016, 34, 413–419. [Google Scholar] [CrossRef]
  6. Xiao, Y.F.; Chen, Y.; Feng, Z.Y.; Huang, X.W.; Huang, L.; Long, Z.; Cui, D. Leaching Characteristics of Ion-adsorption Type Rare Earths Ore with Magnesium Sulfate. Trans. Nonferrous Met. Soc. China 2015, 25, 3784–3790. [Google Scholar] [CrossRef]
  7. Yang, L.; Li, C.; Wang, D.; Li, F.; Liu, Y.; Zhou, X.; Liu, M.; Wang, X.; Li, Y. Leaching Ion Adsorption Rare Earth by Aluminum Sulfate for Increasing Efficiency and Lowering the Environmental Impact. J. Rare Earths 2019, 37, 429–436. [Google Scholar] [CrossRef]
  8. Kremleva, A.; Krueger, S.; Roesch, N. Density functional model studies of uranyl adsorption on (001) surfaces of kaolinite. Langmuir 2008, 24, 9515–9524. [Google Scholar] [CrossRef]
  9. Tombacz, E.; Szekeres, M. Surface Charge Heterogeneity of Kaolinite in Aqueous Suspension in Comparison with Montmorillonite. Appl. Clay Sci. 2006, 34, 105–124. [Google Scholar] [CrossRef]
  10. Mbey, J.; Thomas, F.; Razafitianamaharavo, A.; Caillet, C.; Villieras, F. A Comparative Study of Some Kaolinites Surface Properties. Appl. Clay Sci. 2019, 172, 135–145. [Google Scholar] [CrossRef]
  11. Qiu, S.; Qiu, T.S.; Yan, H.S.; Long, Q.B.; Wu, H.; Li, X.B.; Zhu, D.M. Investigation of Protonation and Deprotonation Processes of Kaolinite and Its Effect on the Adsorption Stability of Rare Earth Elements. Colloids Surf. A 2022, 642, 128596. [Google Scholar] [CrossRef]
  12. Granados, C.; Vilchis, G.; Jiménez, R.; Quiroz, G. Adsorption Behaviour of La(III) and Eu(III) Ions from Aqueous Solutions by Hydroxyapatite: Kinetic, Isotherm, and Thermodynamic Studies. J. Chem. 2013, 2013, 751696. [Google Scholar] [CrossRef]
  13. Moldoveanu, G.; Papangelakis, V. Recovery of Rare Earth Elements Adsorbed on Clay Minerals: I. Desorption Mechanism. Hydrometallurgy 2012, 117, 71–78. [Google Scholar] [CrossRef]
  14. Moldoveanu, G.; Papangelakis, V. Recovery of Rare Earth Elements Adsorbed on Clay Minerals: II. Leaching with Ammonium Sulfate. Hydrometallurgy 2013, 131, 158–166. [Google Scholar] [CrossRef]
  15. Xiao, Y.F.; Huang, L.; Long, Z.; Feng, Z.Y.; Wang, L. Adsorption Ability of Rare Earth Elements on Clay Minerals and Its Practical Performance. J. Rare Earths 2016, 34, 543–548. [Google Scholar] [CrossRef]
  16. Yang, M.; Liang, X.; Ma, L.; Huang, J.; He, H.P.; Zhu, J. Adsorption of REEs on Kaolinite and Halloysite: A Link to the REE Distribution on Clays in the Weathering Crust of Granite. Chem. Geol. 2019, 525, 210–217. [Google Scholar] [CrossRef]
  17. Dash, B.; Rath, S. Density functional Theory and Molecular Dynamics Insights into the Site-dependent Adsorption of Hydrogen Fluoride on Kaolinite. J. Mol. Liq. 2020, 299, 112265. [Google Scholar] [CrossRef]
  18. Zhao, M.; Rao, M.; Wang, F.; Tao, Y.; Lu, L. Density Functional Simulation of Adsorption Behavior within the Dicalcium Silicate-Accelerated Carbonation System. ACS Sustain. Chem. Eng. 2022, 10, 16825–16832. [Google Scholar] [CrossRef]
  19. Hue, K.; Lew, J.; Muo, M.; Matar, O.; Luckham, P.; Muller, E. Molecular Dynamics Simulation of Polyacrylamide Adsorption on Calcite. Molecules 2023, 28, 6367. [Google Scholar] [CrossRef]
  20. Qiu, S.; Wu, H.; Yan, H.S.; Li, X.B.; Zhou, X.W.; Qiu, T.S. Theoretical Investigation of Hydrated [Lu(OH)2]+ Adsorption on Kaolinite(0 0 1) Surface with DFT Calculations. Appl. Surf. Sci. 2021, 565, 150473. [Google Scholar] [CrossRef]
  21. Qiu, S.; Yan, H.S.; Qiu, X.H.; Wu, H.; Zhou, X.W.; Wu, H.; Li, X.B.; Qiu, T.S. Adsorption of La on Kaolinite (0 0 1) Surface in Aqueous System: A Combined Simulation with an Experimental Verification. J. Mol. Liq. 2022, 347, 117956. [Google Scholar] [CrossRef]
  22. Peng, C.; Zhong, Y.; Wang, G.; Min, F.; Qin, L. Atomic-level Insights into the Adsorption of Rare Earth Y(OH)3-nn+ (n = 1–3) Ions on Kaolinite Surface. Appl. Surf. Sci. 2019, 469, 357–367. [Google Scholar] [CrossRef]
  23. Wang, G.; Lai, Y.; Peng, C.L. Adsorption of Rare Earth Yttrium and Ammonium Ions on Kaolinite Surfaces: A DFT study. Theor. Chem. Acc. 2018, 137, 53. [Google Scholar] [CrossRef]
  24. Paul, N.; Banerjee, T. Study on the Extraction of Acetamiprid and Imidacloprid from an Aqueous Environment Using Menthol-Based Hydrophobic Eutectic Solvents: Quantum Chemical and Molecular Dynamics Insights. ACS Sustain. Chem. Eng. 2022, 9, 4227–4246. [Google Scholar] [CrossRef]
  25. Wang, Y.; Yan, W.C.; Cui, K.Q.; Cheng, C.H.; Ren, Y.Y.; Wu, K. Molecular Simulation of the Water Diffusion Behavior and Electronic Properties of Boron-Nitride-Composited Mineral Oil. Molecules 2024, 29, 4500. [Google Scholar] [CrossRef]
  26. Qiu, S.; Li, F.J.; Yan, H.S.; Qiu, T.S.; Long, Q.B.; Zhou, X.W.; Li, Y.; Xia, Y. Step-Leaching and Pre-Enrichment of Light and Heavy REEs from Kaolinite and Montmorillonite. ACS Sustain. Chem. Eng. 2022, 10, 11815–11823. [Google Scholar] [CrossRef]
  27. Chen, Y.; Zhu, C.; Sun, Y.; Duan, H.; Ye, W.; Wu, D. Adsorption of La(III) onto GMZ Bentonite: Effect of Contact Time, Bentonite Content pH Value and Ionic Strength. J. Radioanal. Nucl. Chem. 2012, 292, 1339–1347. [Google Scholar] [CrossRef]
  28. Wu, D.; Zhu, C.; Chen, Y.; Zhu, B.; Yang, Y.; Wang, Q.; Ye, W. Preparation, Characterization and Adsorptive Study of Rare Earth Ions using Magnetic GMZ Bentonite. Appl. Clay Sci. 2012, 62–63, 87–93. [Google Scholar] [CrossRef]
  29. Xu, Q.H.; Yang, L.F.; Zhang, L.; Li, C.C.; Wang, D.S.; Zhou, X.M.; Zhou, X.Z.; Li, Y.X. Classification and High Efficient Leaching of Ion Adsorption Rare Earth Based on Its pH Dependence. Chin. J. Inorg. Chem. 2018, 34, 112–122. [Google Scholar]
  30. Lagergren, S. Zur Theorie Der Sogenannten Adsorption Geloster Stoffe. K. Sven. Vetenskapsakad. Handl. 1989, 24, 1–39. [Google Scholar]
  31. Ho, Y.; Mckay, G. Pseudo-second Order Model for Sorption Processes. Process Biochem. 1999, 34, 451–465. [Google Scholar] [CrossRef]
  32. Guan, X.D.; Li, P.; Liu, W.; Chang, Q.; Han, Y.; Zhang, J.; Zhang, H.; Li, Q.; Zheng, S. Adsorption Mechanism of Yttrium Ions onto Ion-adsorption Type Rare Earths Ore. Sep. Purif. Technol. 2022, 299, 121641. [Google Scholar] [CrossRef]
  33. Alshameri, A.; He, H.; Xin, C.; Zhu, J.; Wei, X.; Zhu, R.; Wang, H. Understanding the Role of Natural Clay Minerals as Effective Adsorbents and Alternative Source of Rare Earth Elements: Adsorption Operative Parameters. Hydrometallurgy 2019, 185, 149–161. [Google Scholar] [CrossRef]
  34. Wang, J.; Guo, X. Adsorption Isotherm Models: Classification, Physical Meaning, Application and Solving Method. Chemosphere 2020, 258, 127279. [Google Scholar] [CrossRef]
  35. Guo, X.; Wang, J. Comparison of Linearization Methods for Modeling the Langmuir Adsorption Isotherm. J. Mol. Liq. 2019, 296, 111850. [Google Scholar] [CrossRef]
  36. Freundlich, H. Concerning Adsorption in Solutions. J. Phys. Chem. 1906, 57, 385–490. [Google Scholar]
  37. Vijayaraghavan, K.; Padmesh, T.; Palanivelu, K.; Velan, M. Biosorption of Nickel(II) Ions onto Sargassum Wightii: Application of Two-Parameter and Three-Parameter Isotherm Models. J. Hazard. Mater. 2006, 133, 304–308. [Google Scholar] [CrossRef]
  38. Jeppu, G.P.; Clement, T.P. A Modified Langmuir-Freundlich Isotherm Model for Simulating pH-Dependent Adsorption Effects. J. Contam. Hydrol. 2012, 129–130, 46–53. [Google Scholar] [CrossRef]
  39. Azizian, S.; Eris, S.; Wilson, L.D. Re-Evaluation of the Century-Old Langmuir Isotherm for Modeling Adsorption Phenomena in Solution. Chem. Phys. 2018, 513, 99–104. [Google Scholar] [CrossRef]
  40. Tran, H.N.; Lima, E.C.; Juang, R.-S.; Bollinger, J.-C.; Chao, H.-P. Thermodynamic Parameters of Liquid–Phase Adsorption Process Calculated from Different Equilibrium Constants Related to Adsorption Isotherms: A Comparison Study. J. Environ. Chem. Eng. 2021, 9, 106674. [Google Scholar] [CrossRef]
  41. Rajahmundry, G.K.; Garlapati, C.; Kumar, P.S.; Alwi, R.S.; Vo, D.-V.N. Statistical Analysis of Adsorption Isotherm Models and Its Appropriate Selection. Chemosphere 2021, 276, 130176. [Google Scholar] [CrossRef] [PubMed]
  42. Bourg, I.C.; Lee, S.S.; Fenter, P.; Tournassat, C. Stern Layer Structure and Energetics at Mica-Water Interfaces. J. Phys. Chem. C 2017, 121, 9402–9412. [Google Scholar] [CrossRef]
  43. Liang, X.; Chen, M.; Zhou, H.J.; Zhu, R.L.; Zhu, J.X.; He, H.P. Competitive Adsorption of Alkali Ions on Aqueous Mica Surface: A Force Field Comparison Molecular Dynamics Study. Appl. Clay Sci. 2022, 219, 106436. [Google Scholar] [CrossRef]
  44. Vasconcelos, I.F.; Bunker, B.A.; Cygan, R.T. Molecular Dynamics Modeling of Ion Adsorption to the Basal Surfaces of Kaolinite. J. Phys. Chem. C 2007, 111, 6753–6762. [Google Scholar] [CrossRef]
  45. D’angelo, P.; Zitolo, A.; Migliorati, V.; Chigllemi, G.; Duvail, M.; Vitorge, P.; Abadie, S.; Spezia, R. Revised Ionic Radii of Lanthanoid(III) Ions in Aqueous Solution. Inorg. Chem. 2011, 50, 4572–4579. [Google Scholar] [CrossRef]
  46. Li, H.P.; Hu, Y.H.; Wang, D.Z.; Xu, J. Mechanism of interaction between cationic surfactant and kaolinite. J. Cent. South Univ. Nat. Sci. 2024, 35, 228–233. [Google Scholar]
  47. Zhang, Z.; Zhou, Q.; Yuan, Z.; Zhao, L.; Dong, J. Adsorption of Mg2+ and K+ on the Kaolinite (0 0 1) Surface in Aqueous System: A Combined DFT and AIMD Study with an Experimental Verification. Appl. Surf. Sci. 2021, 538, 148158. [Google Scholar] [CrossRef]
  48. Wang, Q.; Kong, X.; Zhang, B.; Wang, J. Adsorption of Zn(II) on the Kaolinite(001) Surfaces in Aqueous Environment: A Combined DFT and Molecular Dynamics Study. Appl. Surf. Sci. 2017, 414, 405–412. [Google Scholar] [CrossRef]
  49. Kong, X.; Wang, J. Copper(II) Adsorption on the Kaolinite(001) Surface: Insights From First-Principles Calculations and Molecular Dynamics Simulations. Appl. Surf. Sci. 2016, 389, 316–323. [Google Scholar] [CrossRef]
  50. RappéA, K.; Casewit, C.; Colwell, K.; Goddard, W.; Skiff, W. UFF, a Full Periodic Table Force Field for Molecular Mechanics and Molecular Dynamics Simulations. J. Am. Chem. Soc. 1992, 114, 10024–10035. [Google Scholar] [CrossRef]
  51. Berendsen, H.; Postma, J.; Gunsteren, W.; Hermans, J. Interaction Models for Water in Relation to Protein Hydration, Intermolecular Forces; Springer: Berlin/Heidelberg, Germany, 1981. [Google Scholar]
Figure 1. Effect of pH on the recovery of Eu3+ and Lu3+ from adsorbed (a) and raw (b) kaolinite.
Molecules 30 00838 g001
Figure 2. Effect of contact time on Eu3+ and Lu3+ adsorption onto kaolinite.
Molecules 30 00838 g002
Figure 3. Pseudo-first-order (a) and pseudo-second-order (b) for Eu3+ and Lu3+ onto kaolinite.
Molecules 30 00838 g003
Figure 4. The adsorption isotherms of Eu3+ and Lu3+ onto kaolinite.
Molecules 30 00838 g004
Figure 5. The nonlinearized Langmuir (a), Freundlich (b), and Langmuir-Freundlich isotherm (c) for Eu3+ and Lu3+ onto kaolinite.
Molecules 30 00838 g005
Figure 6. The adsorption geometries of Eu3+ and Lu3+ on deprotonated kaolinite (001) surface at different times.
Molecules 30 00838 g006
Figure 7. The concentration distribution profiles of Eu3+ (a) and Lu3+ (b) on the normal direction of kaolinite (001) surface at different time.
Molecules 30 00838 g007
Figure 8. The mean squared displacement and linear fittings of Eu3+ and Lu3+ on kaolinite surface.
Molecules 30 00838 g008
Figure 9. Radial distribution function of Eu3+ (a) and Lu3+ (b).
Molecules 30 00838 g009
Figure 10. Initial adsorption model of EuCl3 and LuCl3 on deprotonated kaolinite (001) surface.
Molecules 30 00838 g010
Table 1. Kinetics parameters for the adsorption of Eu3+ and Lu3+ onto kaolinite.
REPseudo-First-OrderPseudo-Second-Order
qe (mg/g)k1 (min−1)R2qe (mg/g)k2 (g/mg/min)R2
EuLu0.28
0.172
0.024
0.022
0.978
0.954
1.078
1.281
0.299
0.685
0.998
0.999
Table 2. Constants for equilibrium isotherm models for Eu3+ and Lu3+ onto kaolinite.
Adsorption Isotherm ModelUnitRE
EuLu
Qmax-expmg/g1.121.32
1. Langmuir model
QLmg/g1.07 ± 0.041.28 ± 0.03
KLL/mg0.43 ± 0.120.45 ± 0.09
adj-R2-0.903770.94012
red-χ2-0.004930.00354
2. Freundlich model
KF ( m g / g ) / ( m g / L ) n F 0.49 ± 0.030.64 ± 0.06
nF0.19 ± 0.020.15 ± 0.02
adj-R20.975060.93089
red-χ20.001280.00408
3. Langmuir-Freundlich model
QLFmg/g1.56 ± 0.241.49 ± 0.14
KLFL/mg0.09 ± 0.080.30 ± 0.12
nLF-0.41 ± 0.080.54 ± 0.13
adj-R2-0.991570.97841
red-χ2-4.32 × 10−40.00128
Table 3. Diffusion coefficient values of Eu3+ and Lu3+.
IonEu3+Lu3+
D (m2/s)7.6 × 10−106.8 × 10⁻¹⁰
Table 4. The coordination parameters of Eu-Ow, Eu-Cl, Eu-Os, Lu-Ow, Lu-Cl and Lu-Os.
Start Radius (Å)First Sharp Peak (Å)Cutoff Radius (Å)CN
Eu-Ow2.012.2337.1
Eu-Os1.952.1731.01
Eu-Cl2.492.9330.01
Lu-Ow1.972.3137.9
Lu-Os2.412.4730.1
Lu-Cl2.412.9330.01
Disclaimer/Publisher’s Note: The statements, opinions and data contained in all publications are solely those of the individual author(s) and contributor(s) and not of MDPI and/or the editor(s). MDPI and/or the editor(s) disclaim responsibility for any injury to people or property resulting from any ideas, methods, instructions or products referred to in the content.

