
FTIR Detection of Ce3+ Sites on Shape-Controlled Ceria Nanoparticles Using Adsorbed 15N2 as a Probe Molecule

 , , ,
, , ,  and
and 
Abstract

1. Introduction
2. Results
2.1. Basic Characteristics of the Samples
2.1.1. Initial Characterization
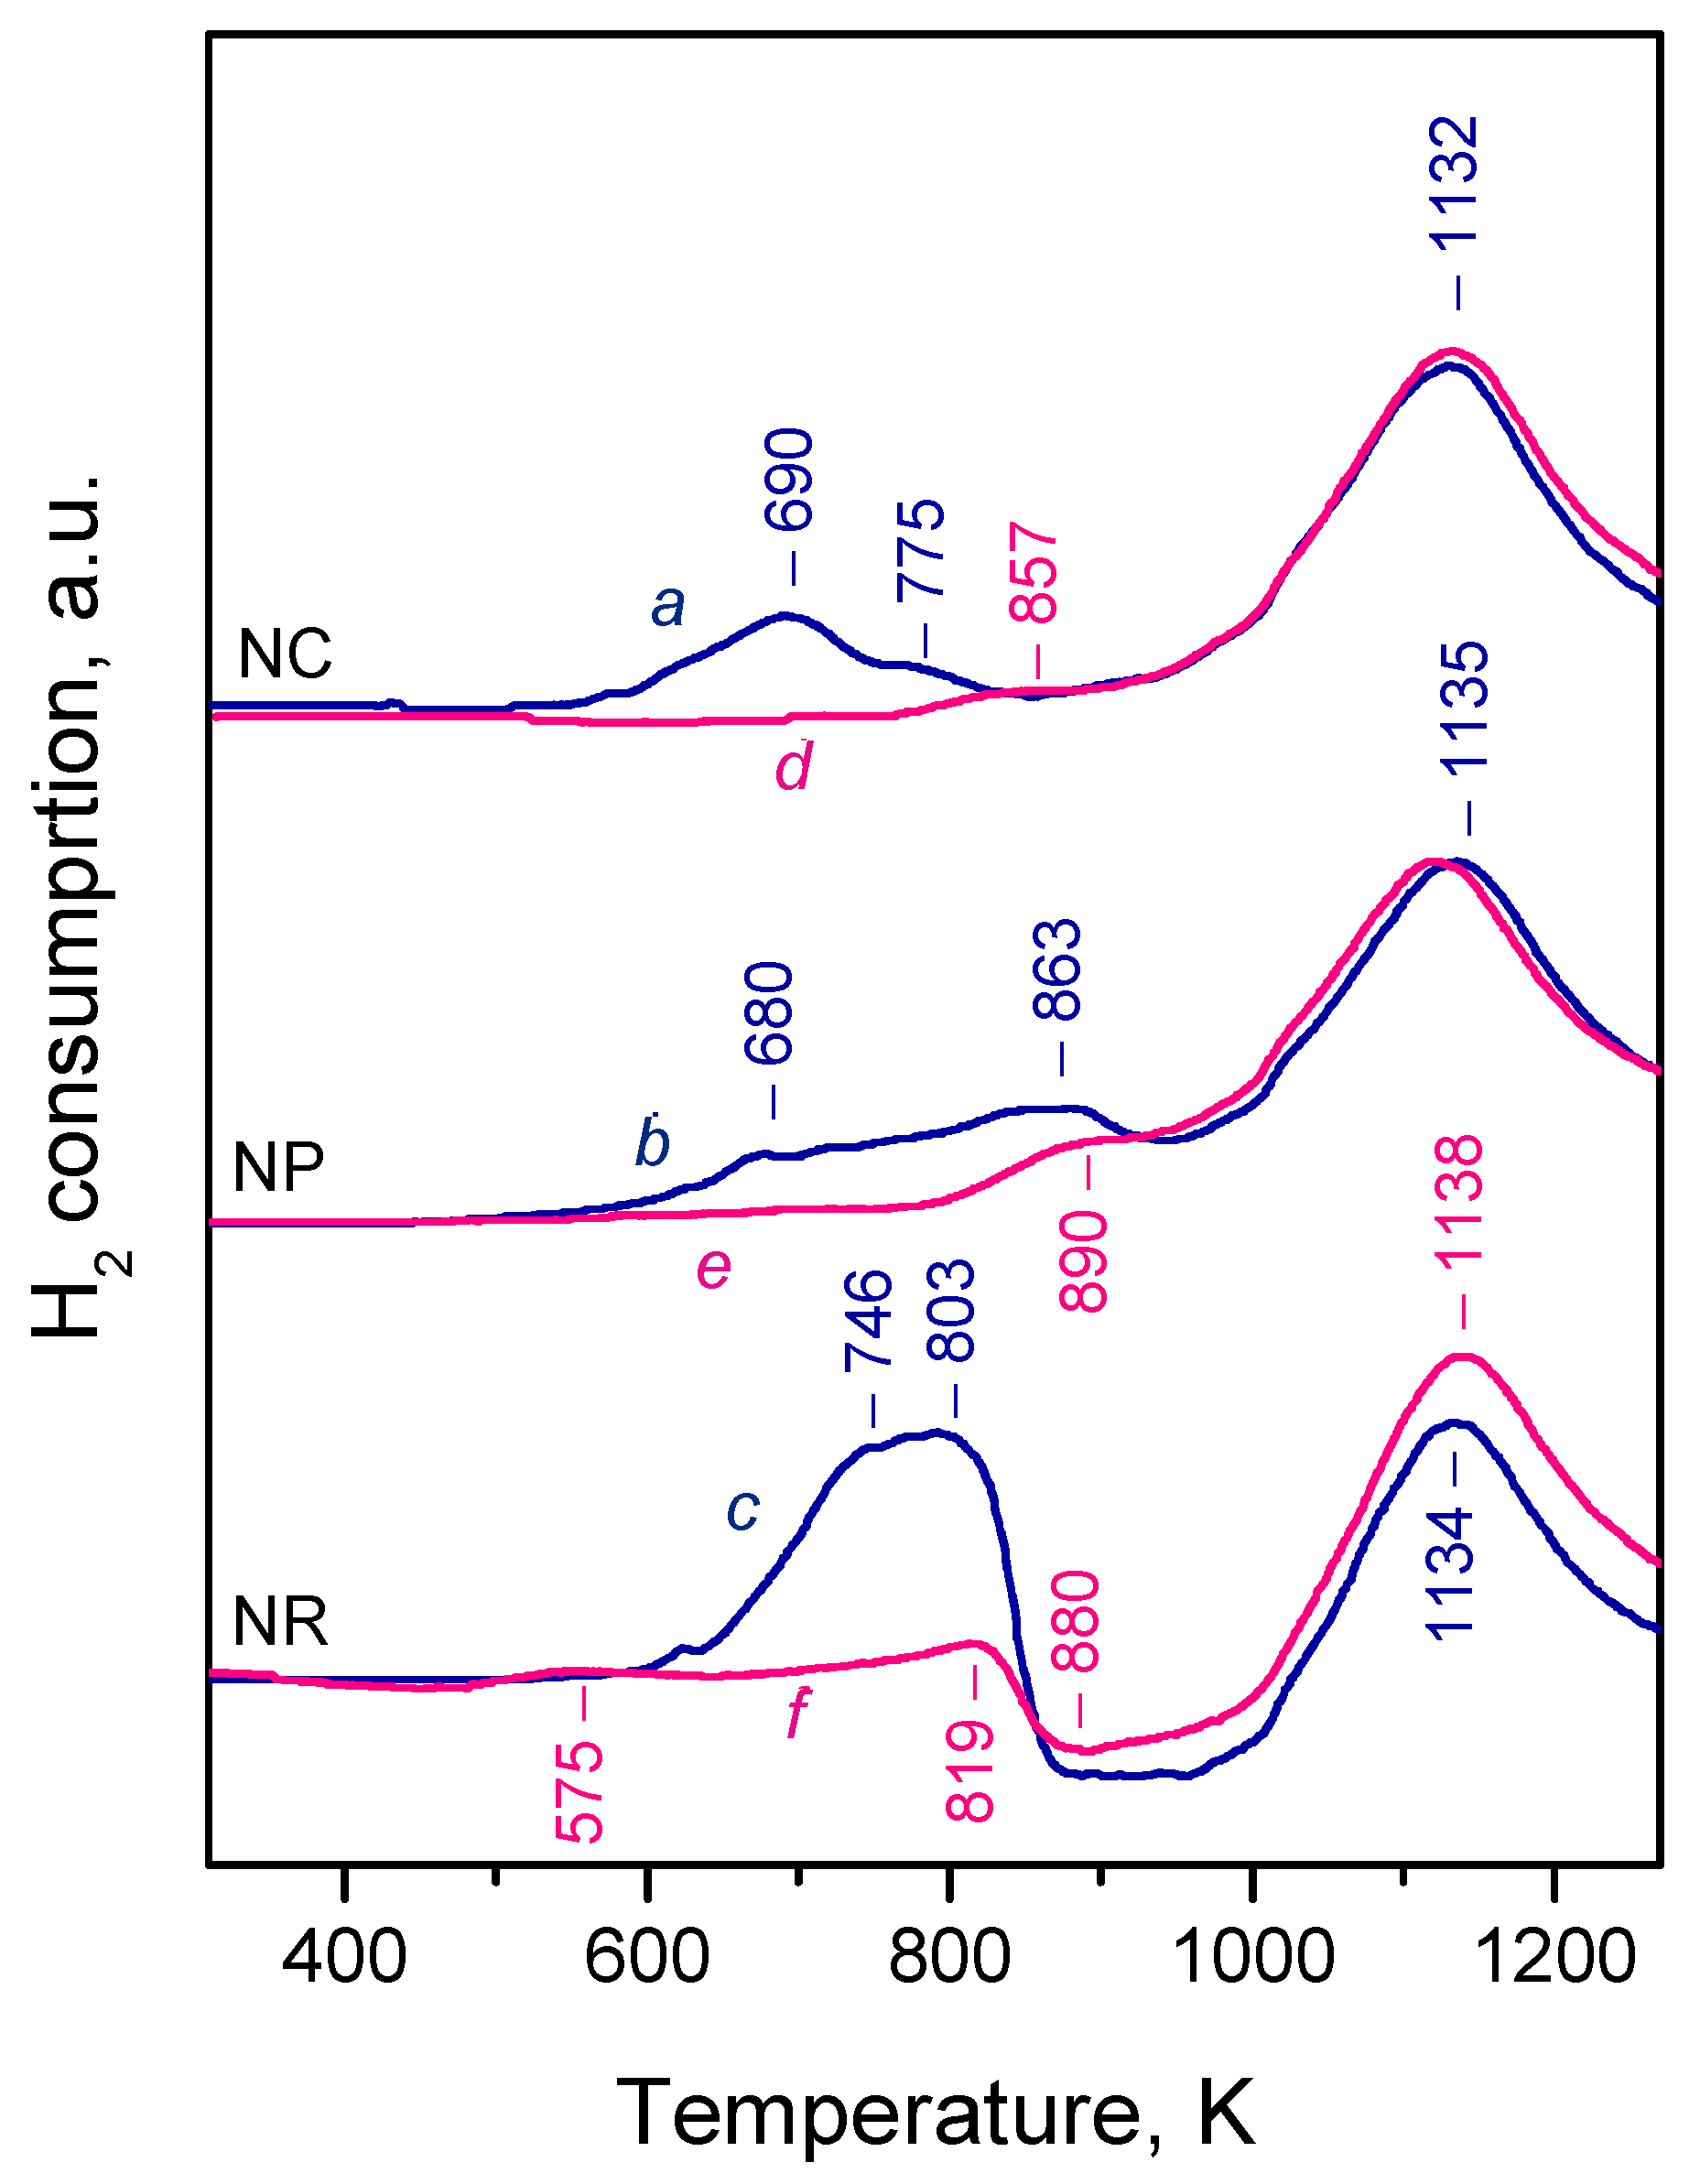
2.1.2. Temperature-Programmed Reduction
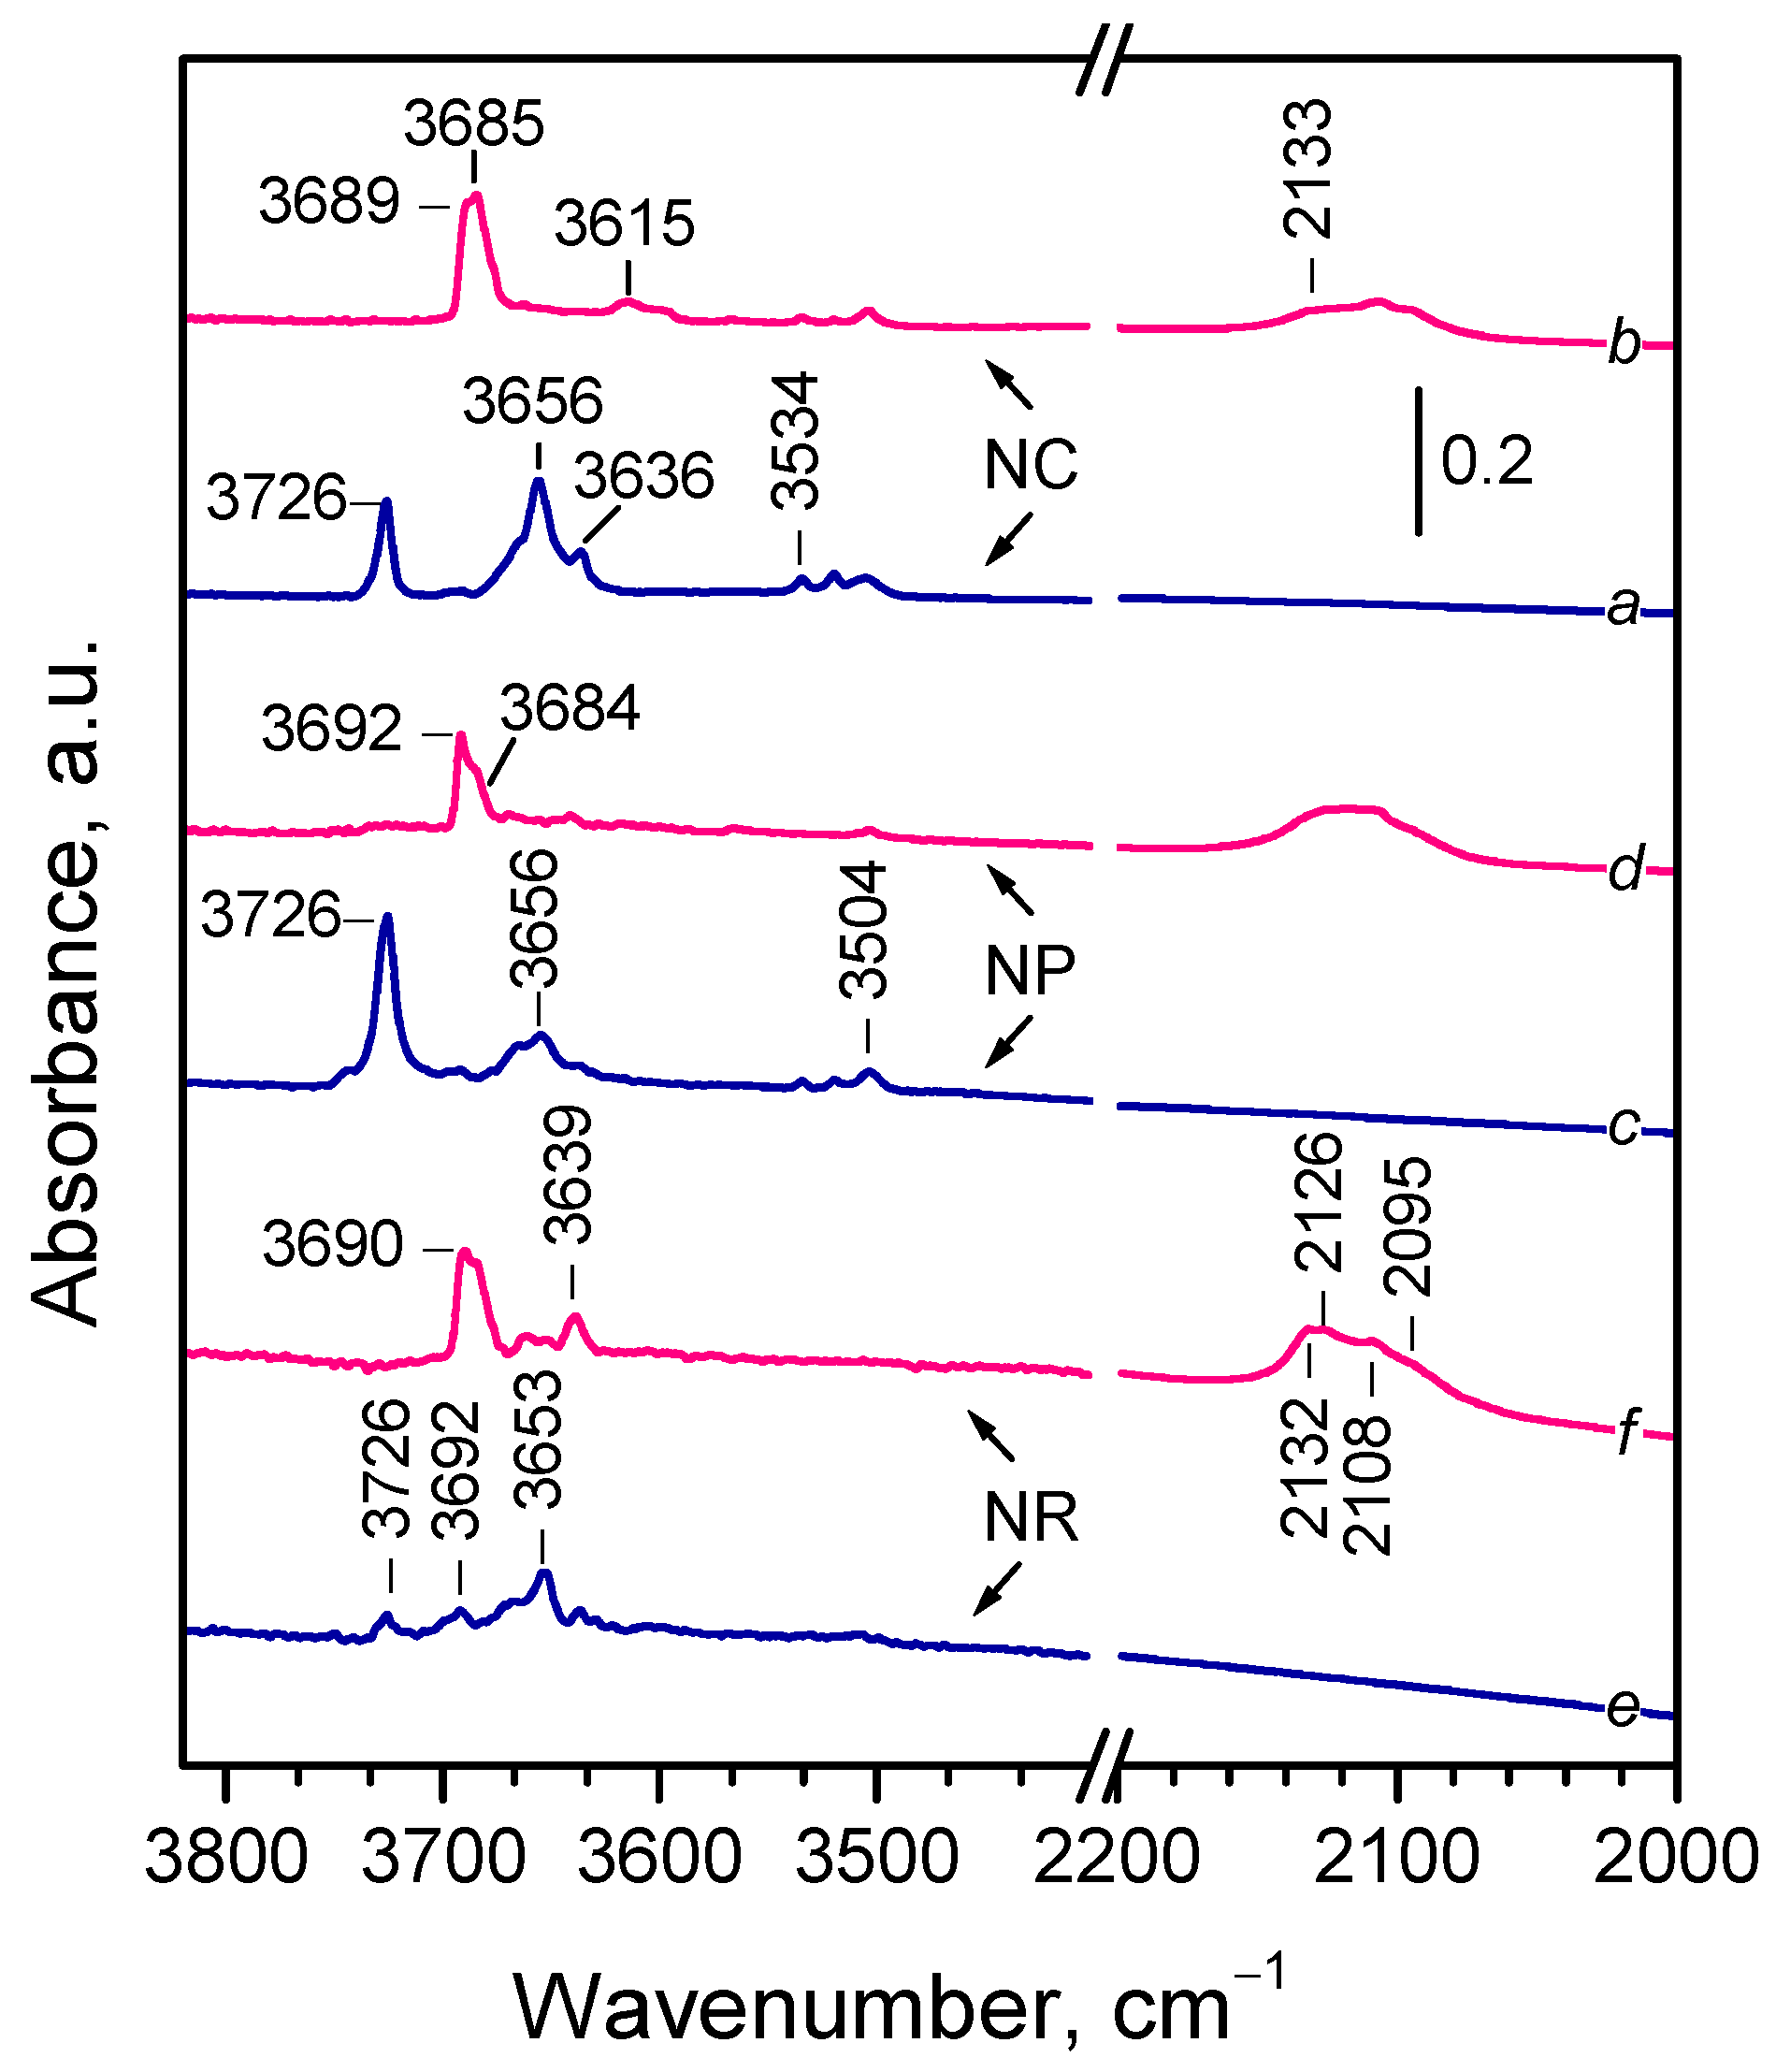
2.1.3. Background IR Spectra
2.2. FTIR Study of 15N2 Adsorption
2.2.1. General Observations
2.2.2. Adsorption of 15N2 on Reduced Ceria Nanocubes (CeO2-NC)
2.2.3. Adsorption of 15N2 on Reduced Ceria Nanopolyhedra (CeO2-NP)
2.2.4. Adsorption of 15N2 and 14N2 on Reduced Ceria Nanorods (CeO2-NR)
2.3. DFT Modeling of N2 Adsorption on Ceria
3. Discussion
3.1. Spectral Features of Adsorbed Dinitrogen
3.2. Reduction of Ceria
3.3. N2 Adsorption Sites on Reduced Ceria
3.4. Potential Use of N2 as an IR Probe Molecule for Testing Surface of Ceria and Related Materials
3.5. Future Directions
4. Materials and Methods
4.1. Synthesis of the Samples
4.2. Characterization Techniques
4.3. DFT Studies
5. Conclusions
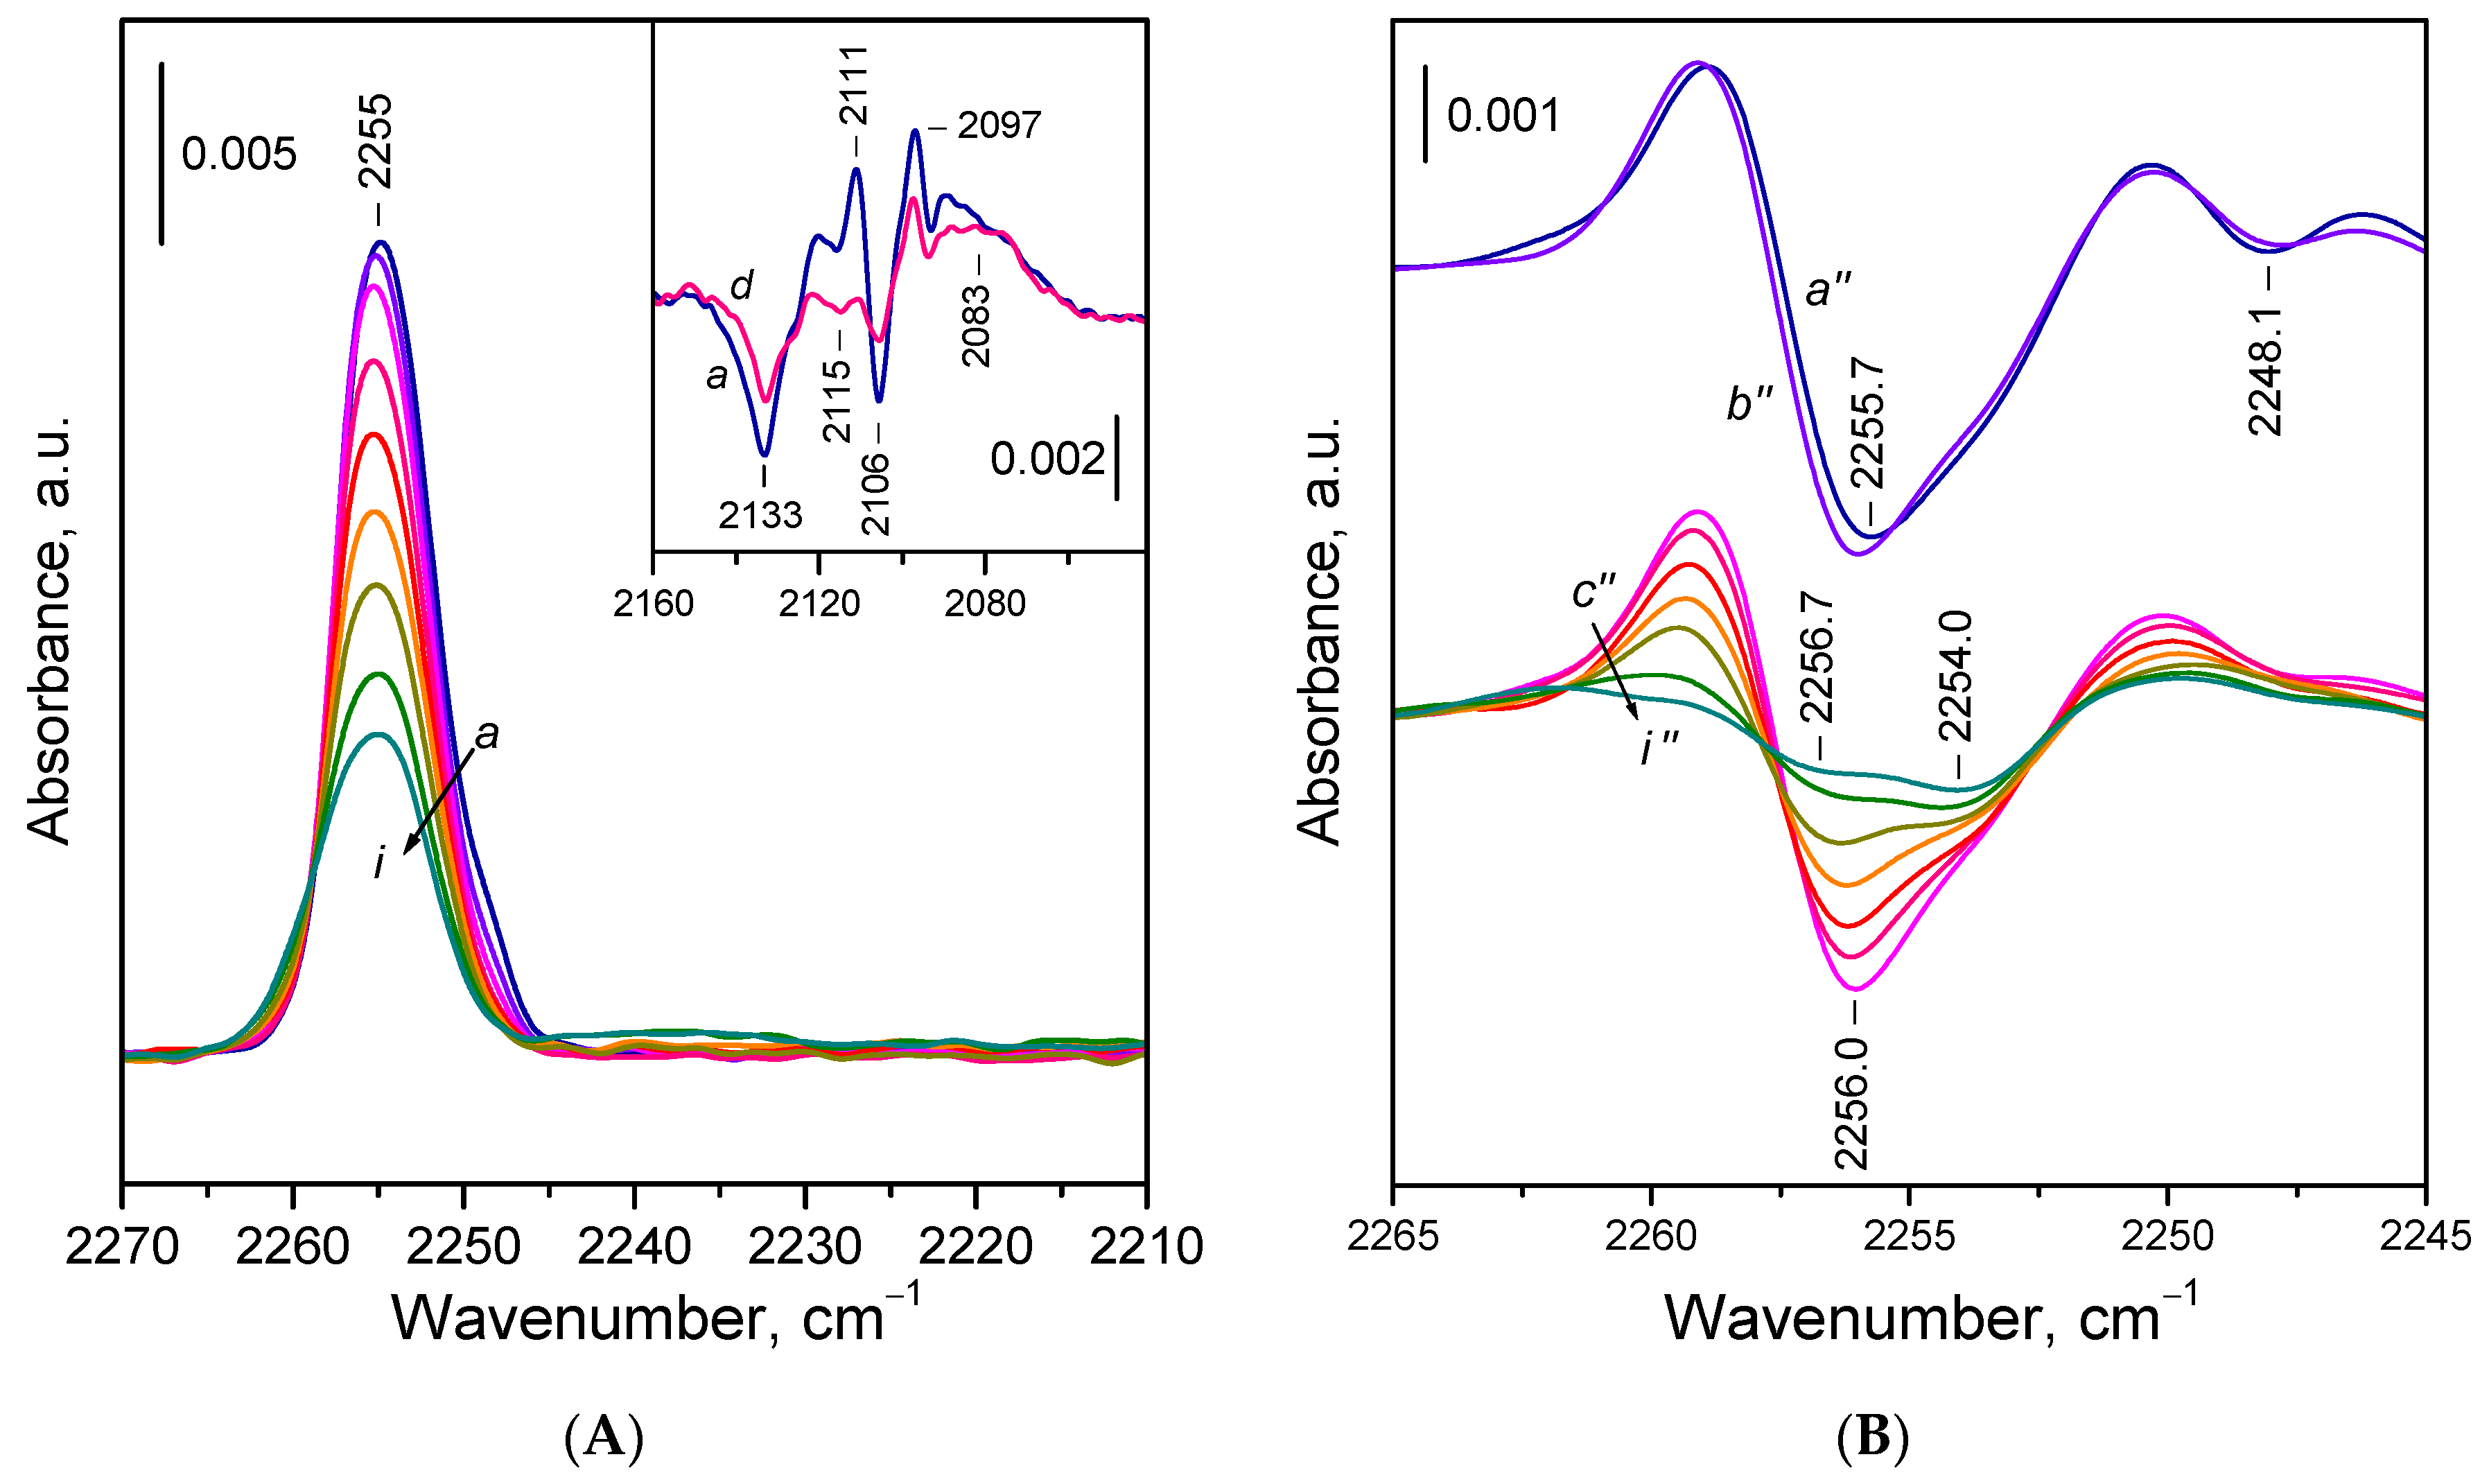
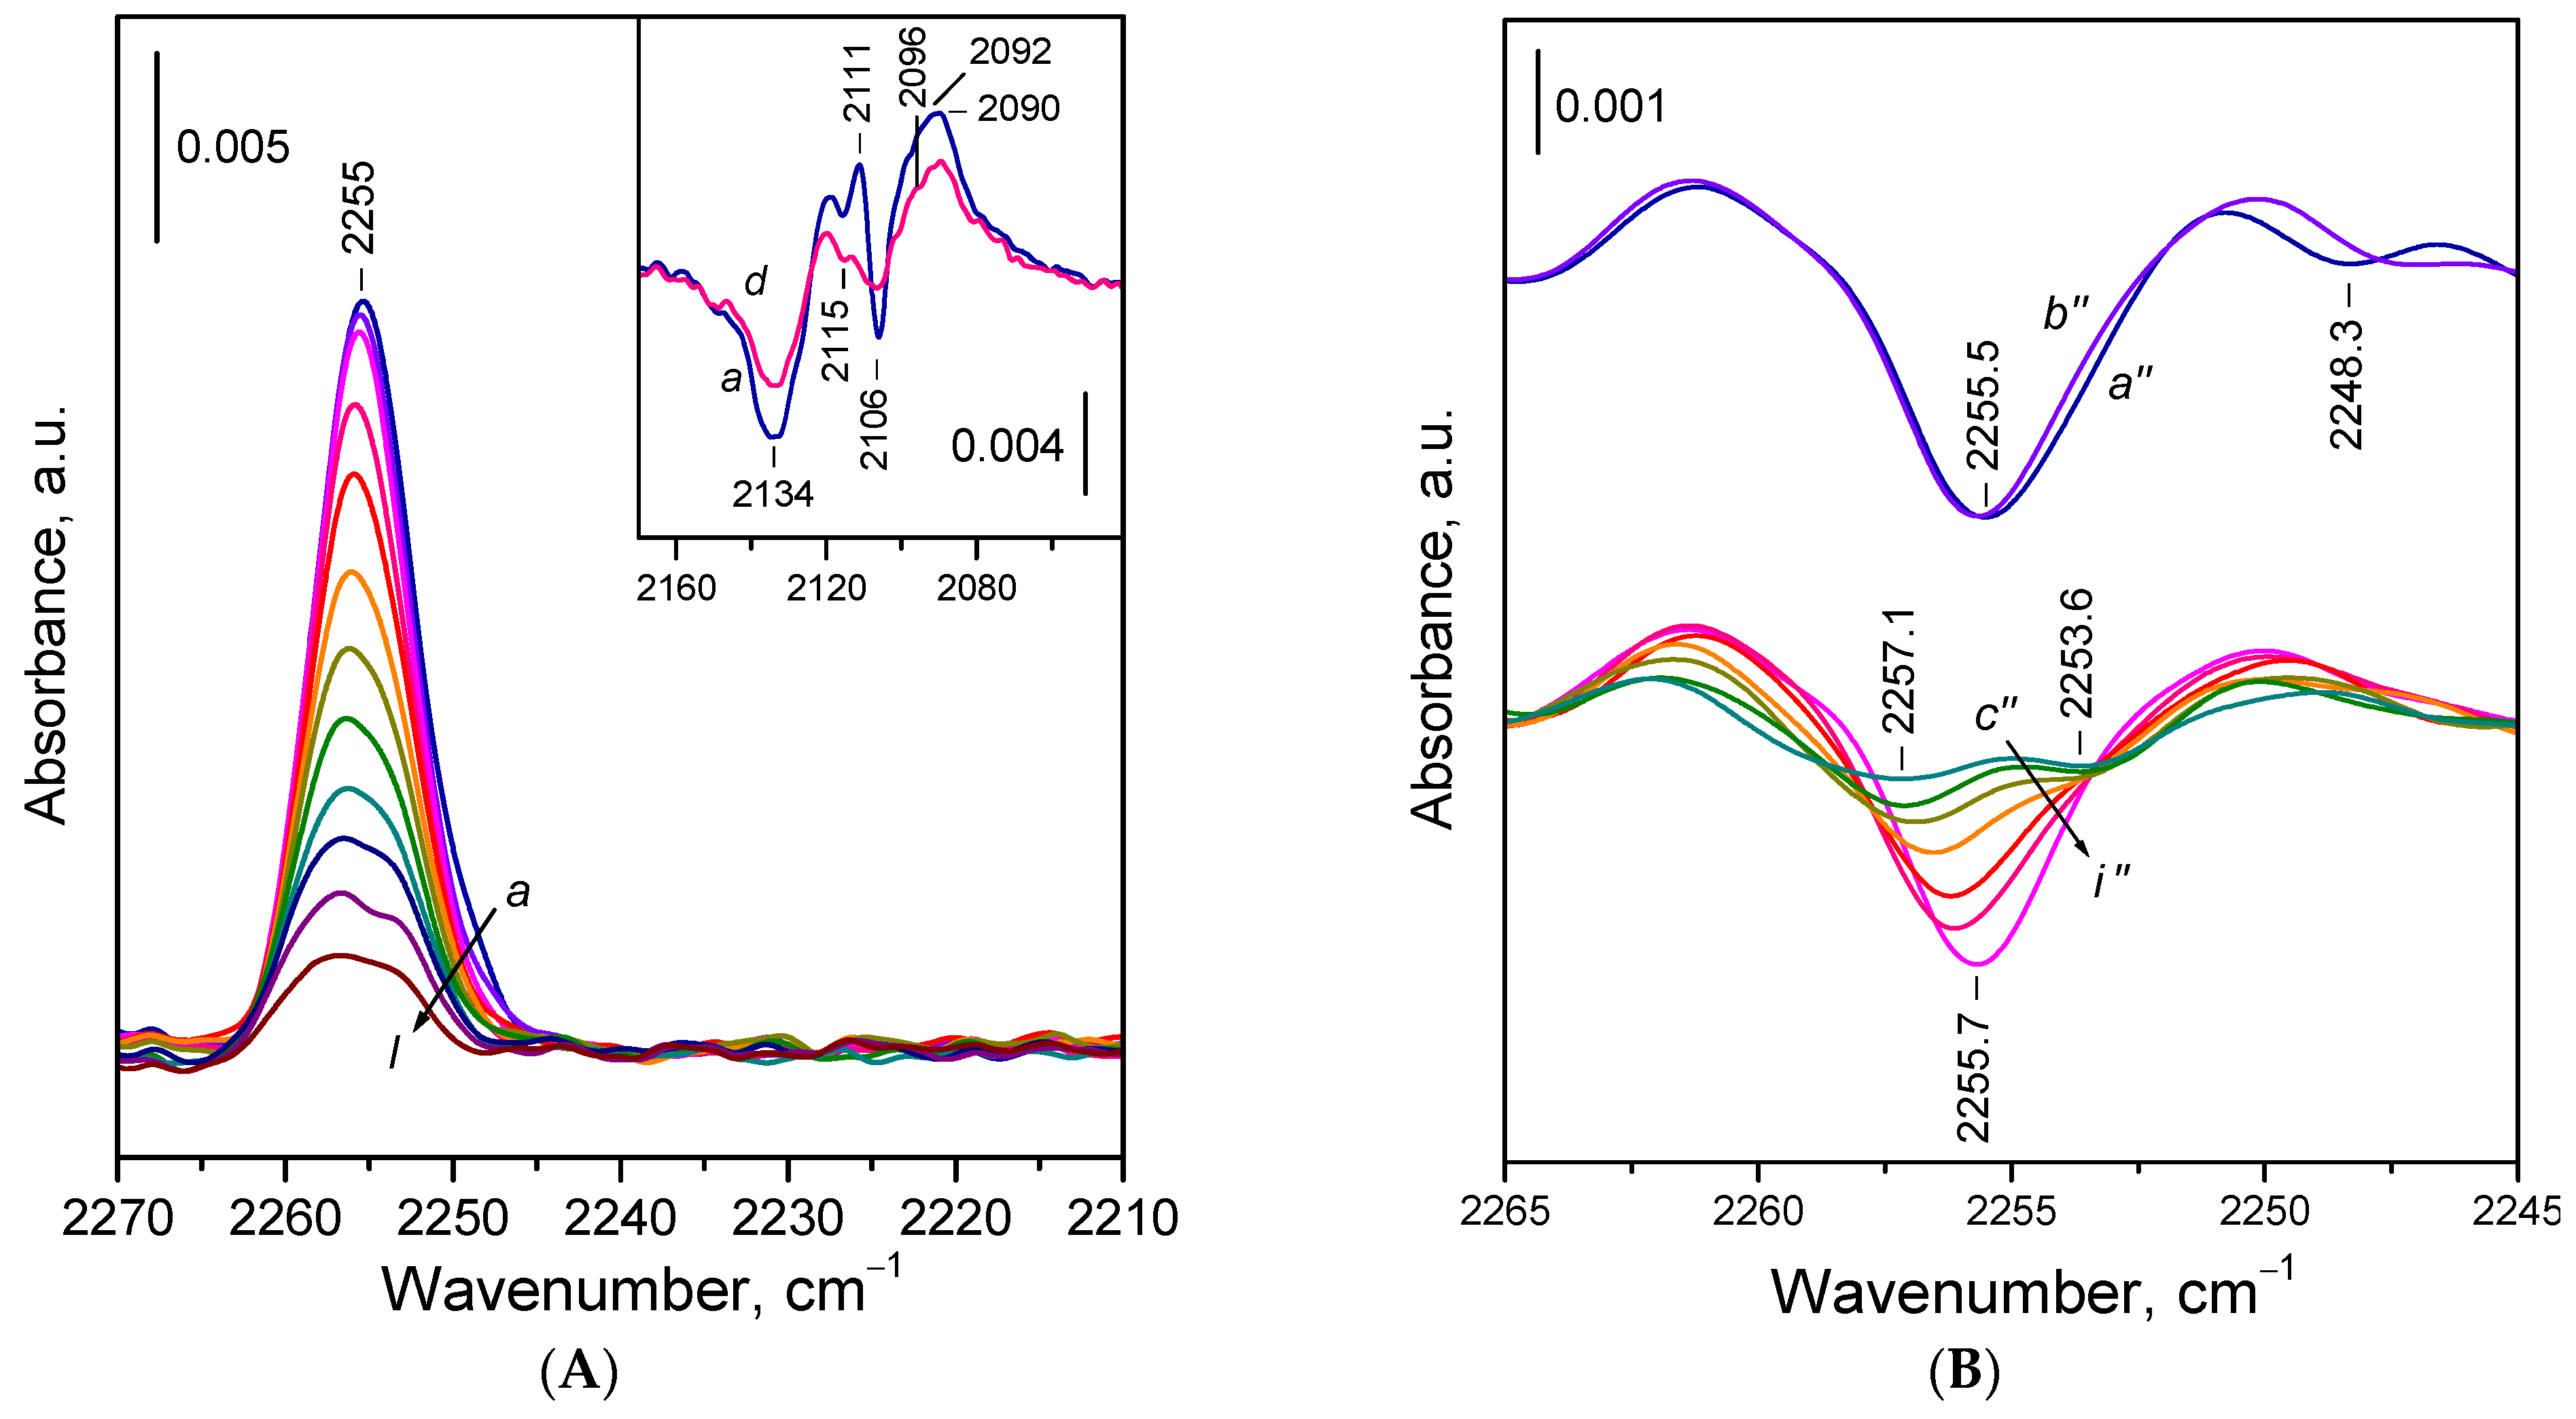
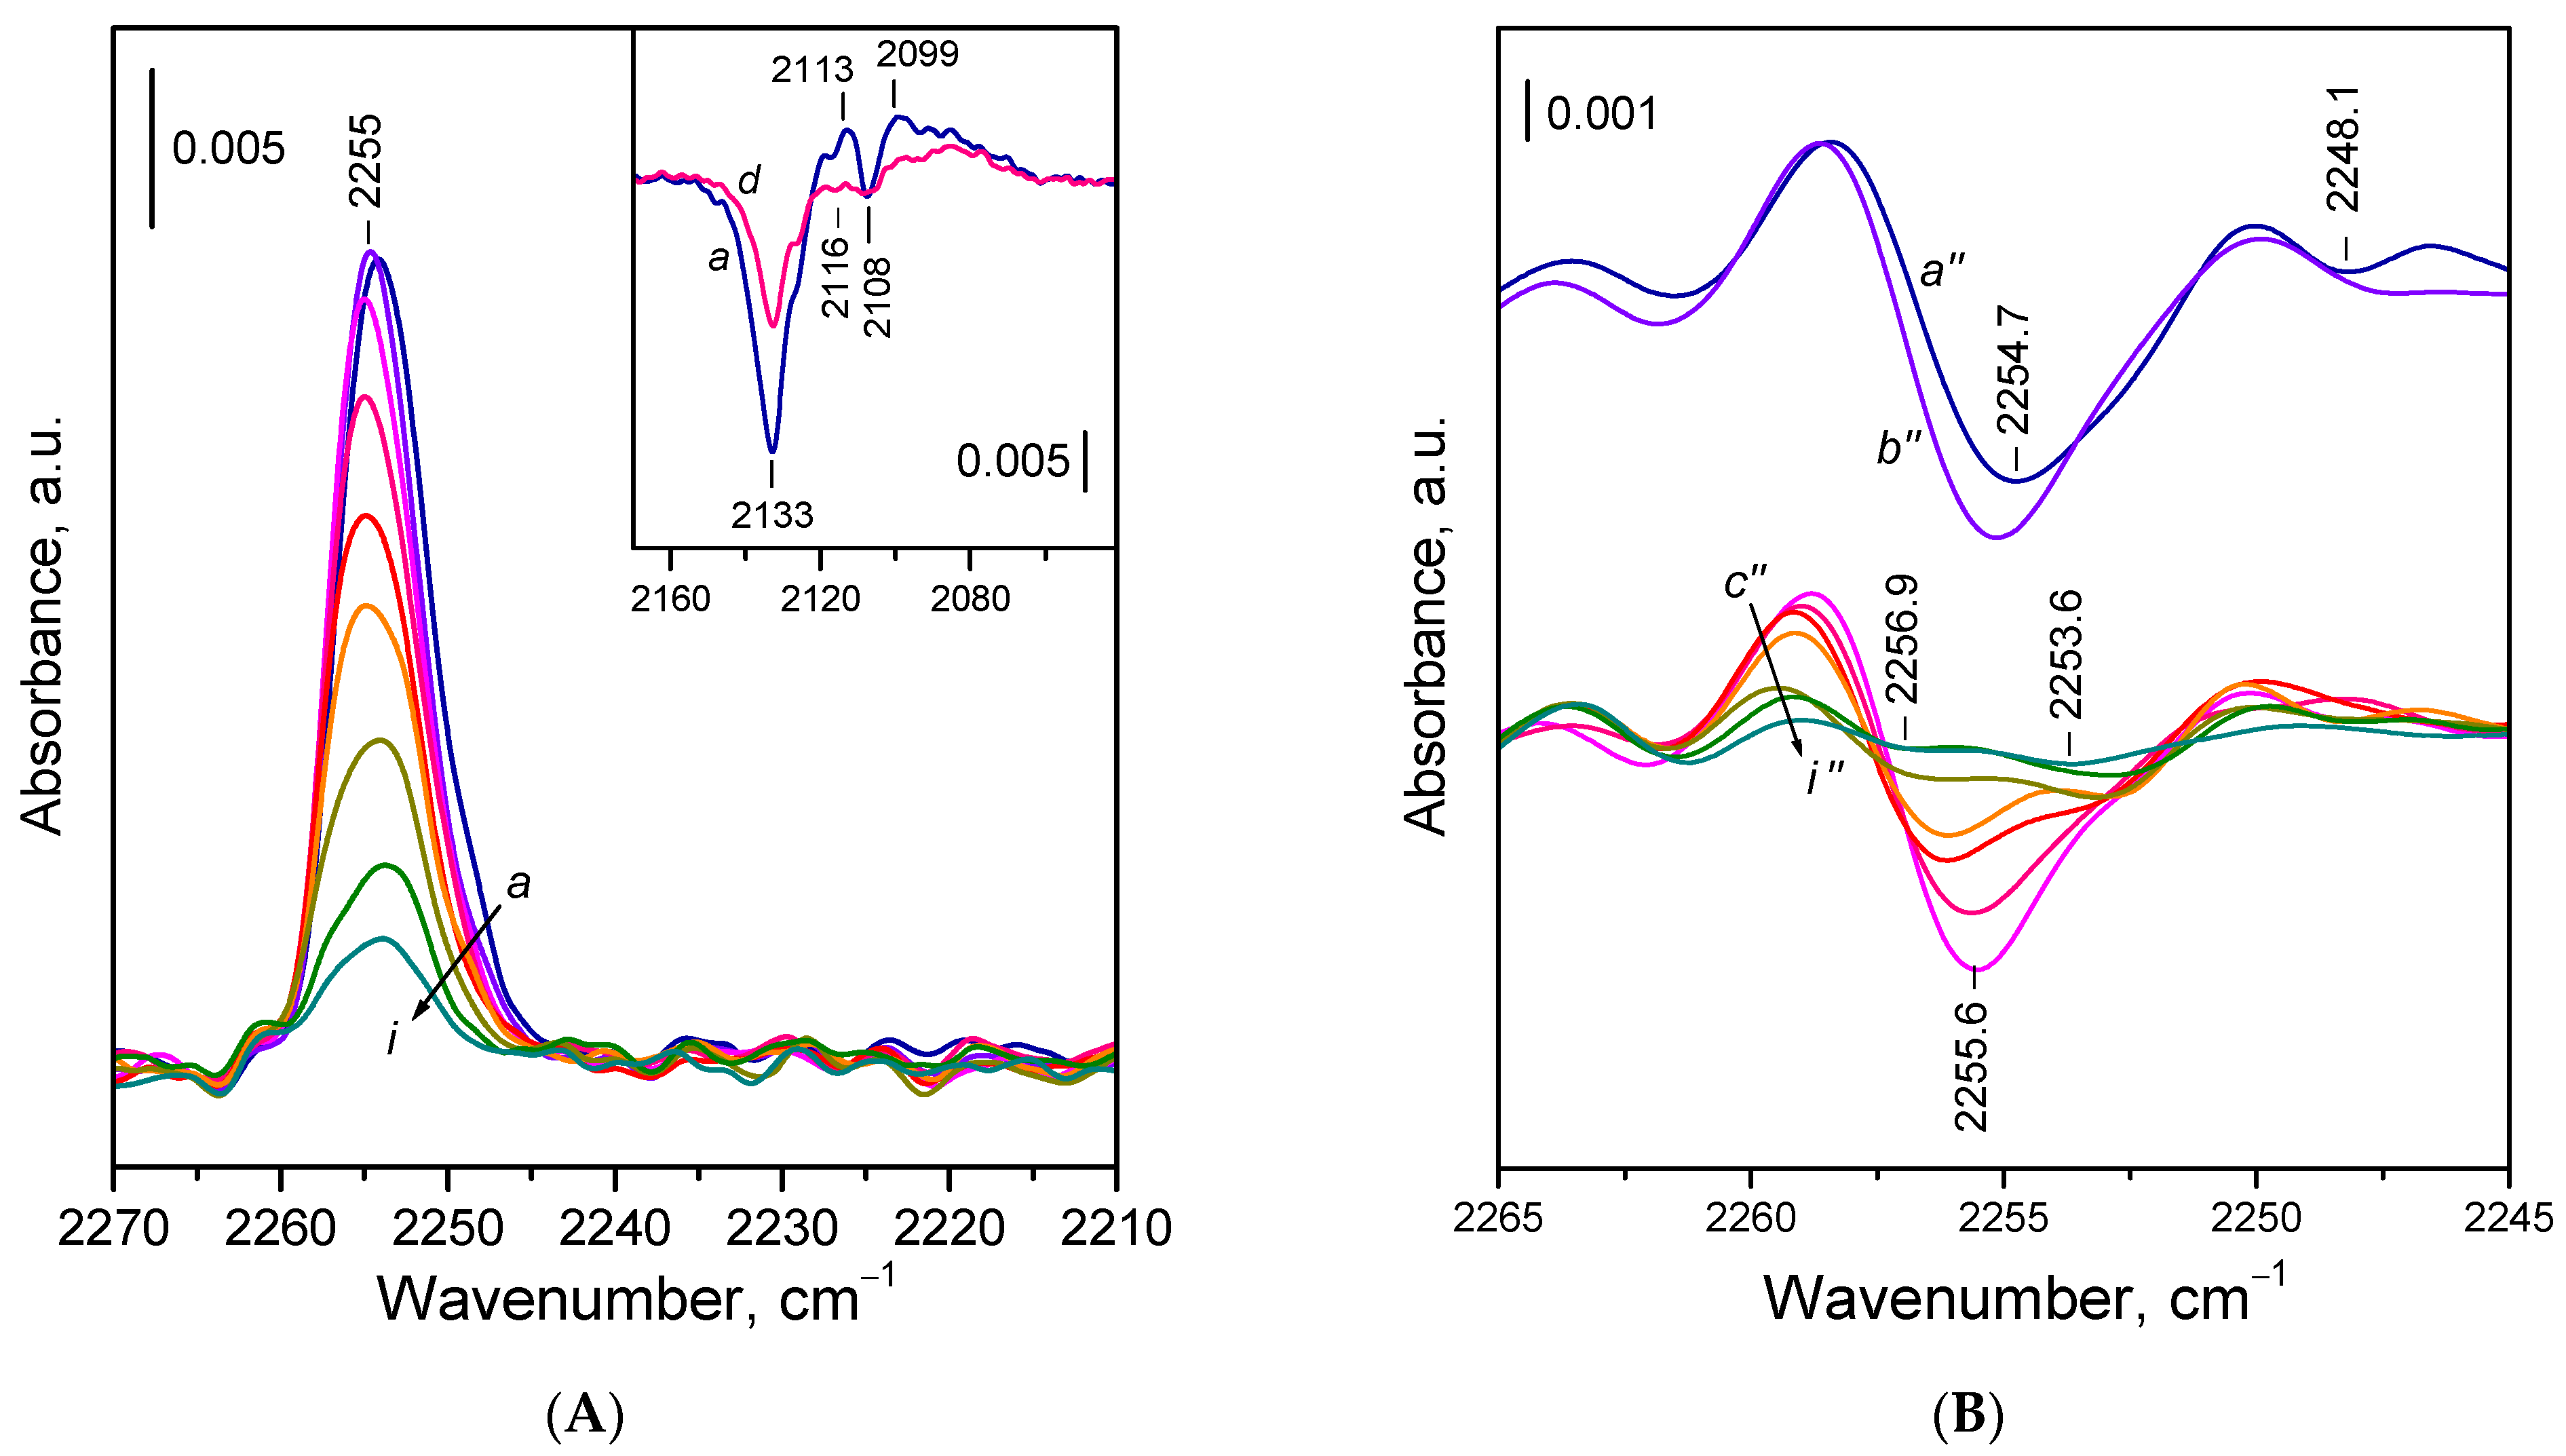
- Species characterized by an IR band at 2256–2255 cm−1. We attribute this band to 15N2 coordinated linearly to a corner or edge Ce3+ site on the ceria surface.
- Species characterized by an IR band at 2254–2253 cm−1. We assign this band to 15N2 bridging two Ce3+ cations on the CeO2{100} facets by one nitrogen atom.
- 15N2 polarized by surface OH groups of ceria. This adsorption form is only observed in the presence of gas-phase 15N2 and appears at 2248 cm−1 in the IR spectra. The contribution of 15N2 adsorbed on basic sites to this band is not excluded.
- Due to their very weak acidity, the Ce3+ sites on the regular CeO2{110} and CeO2{111} facets are considered not to form detectable complexes with 15N2.
Supplementary Materials
Author Contributions
Funding
Data Availability Statement
Acknowledgments
Conflicts of Interest
References
- Trovarelli, A. Catalytic properties of ceria and CeO2-containing materials. Catal. Rev. 1996, 38, 439–520. [Google Scholar] [CrossRef]
- Montini, T.; Melchionna, M.; Monai, M.; Fornasiero, P. Fundamentals and catalytic applications of CeO2-based materials. Chem. Rev. 2016, 116, 5987–6041. [Google Scholar] [CrossRef] [PubMed]
- Naqvi, S.T.R.; Shirinfar, B.; Majeed, S.; Najam-ul-Haq, M.; Hussain, D.; Iqbal, T.; Ahmed, N. Synthesis, Design and sensing applications of nanostructured ceria-based materials. Analyst 2018, 143, 5610–5628. [Google Scholar] [CrossRef] [PubMed]
- Han, X.; Liu, R.; Tan, B.; Wang, F.; Yan, M.; Zhao, X.; Zhao, J. Research progress on the application of ceria nanoparticles as abrasives in dielectric layer CMP and post cleaning: Structure, morphology, doping, and mechanism. Colloids Surf. A 2023, 679, 132551. [Google Scholar] [CrossRef]
- Li, H.; Xia, P.; Pan, S.; Qi, Z.; Fu, C.; Yu, Z.; Kong, W.; Chang, Y.; Wang, K.; Wu, D.; et al. The advances of ceria nanoparticles for biomedical applications in orthopaedics. Int. J. Nanomed. 2020, 15, 7199–7214. [Google Scholar] [CrossRef] [PubMed]
- Rozhin, P.; Melchionna, M.; Fornasiero, P.; Marchesan, S. Nanostructured ceria: Biomolecular templates and (bio)applications. Nanomaterials 2021, 11, 2259. [Google Scholar] [CrossRef] [PubMed]
- Aneggi, E.; Boaro, M.; Leitenburg, C.; Dolcetti, G.; Trovarelli, A. Insights into the redox properties of ceria-based oxides and their implications in catalysis. J. Alloys Compd. 2006, 408–412, 1096–1102. [Google Scholar] [CrossRef]
- Wang, X.; Li, M.; Wu, Z. In situ spectroscopic insights into the redox and acid-base properties of ceria catalysts. Chin. J. Catal. 2021, 42, 2122–2140. [Google Scholar] [CrossRef]
- Mai, H.X.; Sun, L.D.; Zhang, Y.W.; Si, R.; Feng, W.; Zhang, H.P.; Liu, H.C.; Yan, C.K. Shape-selective synthesis and oxygen storage behavior of ceria nanopolyhedra, nanorods, and nanocubes. J. Phys. Chem. B 2005, 109, 24380–24388. [Google Scholar] [CrossRef] [PubMed]
- Tana; Zhang, M.; Li, J.; Li, H.; Li, Y.; Shen, W. Morphology-dependent redox and catalytic properties of CeO2 nanostructures: Nanowires, nanorods and nanoparticles. Catal. Today 2009, 148, 179–183. [CrossRef]
- Wu, Z.; Li, M.; Howe, J.; Meyer, H.M.; Overbury, S.H. Probing defect sites on CeO2 nanocrystals with well-defined surface planes by Raman spectroscopy and O2 adsorption. Langmuir 2010, 26, 16595–16606. [Google Scholar] [CrossRef] [PubMed]
- Wu, Z.; Li, M.; Overbury, S.H. On the structure dependence of CO oxidation over CeO2 nanocrystals with well-defined surface planes. J. Catal. 2012, 285, 61–73. [Google Scholar] [CrossRef]
- Qiao, Z.-A.; Wu, Z.; Dai, S. Shape-controlled ceria-based nanostructures for catalysis applications. ChemSusChem 2013, 6, 1821–1833. [Google Scholar] [CrossRef] [PubMed]
- Désaunay, J.; Bonura, G.; Chiodo, V.; Freni, S.; Couzinié, J.-P.; Bourgon, J.; Ringuedé, A.; Labat, F.; Adamo, C.; Cassir, M. Surface-dependent oxidation of H2 on CeO2 surfaces. J. Catal. 2013, 297, 193–201. [Google Scholar] [CrossRef]
- Agarwal, S.; Lefferts, L.; Mojet, B.L. Ceria nanocatalysts: Shape dependent reactivity and formation of OH. ChemCatChem 2013, 5, 479–489. [Google Scholar] [CrossRef]
- Agarwal, S.; Lefferts, L.; Mojet, B.L.; Ligthart, D.A.J.M.; Hensen, E.J.M.; Mitchell, D.R.G.; Erasmus, W.J.; Anderson, B.G.; Olivier, E.J.; Neethling, J.H.; et al. Exposed surfaces on shape-controlled ceria nanoparticles revealed through AC-TEM and water–gas shift reactivity. ChemSusChem 2013, 6, 1898–1906. [Google Scholar] [CrossRef] [PubMed]
- Agarwal, S.; Zhu, N.; Hensen, E.J.M.; Mojet, B.L.; Lefferts, L. Surface-dependence of defect chemistry of nanostructured ceria. J. Phys. Chem. C 2015, 119, 12423–12433. [Google Scholar] [CrossRef]
- Zabilskiy, M.; Djinovic, P.; Tchernychova, E.; Tkachenko, O.P.; Kustov, L.M.; Pintar, A. Nanoshaped CuO/CeO2 materials: Effect of the exposed ceria surfaces on catalytic activity in N2O decomposition reaction. ACS Catal. 2015, 5, 5357–5365. [Google Scholar] [CrossRef]
- Matei-Rutkovska, F.; Postole, G.; Rotaru, C.G.; Florea, M.; Pârvulescu, V.I.; Gelin, P. Synthesis of ceria nanopowders by microwave-assisted hydrothermal method for dry reforming of methane. Int. J. Hydrogen Energy 2016, 41, 2512–2525. [Google Scholar] [CrossRef]
- Bezkrovnyi, O.S.; Kraszkiewicz, P.; Ptak, M.; Kepinski, L. Thermally induced reconstruction of ceria nanocubes into zigzag {111}-nanofacetted structures and its influence on catalytic activity in CO oxidation. Catal. Commun. 2018, 117, 94–98. [Google Scholar] [CrossRef]
- Cao, T.; You, R.; Li, Z.; Zhang, X.; Li, D.; Chen, S.; Zhang, Z.; Huang, W. Morphology-dependent CeO2 catalysis in acetylene semihydrogenation reaction. Appl. Surf. Sci. 2020, 501, 144120. [Google Scholar] [CrossRef]
- Sudduth, B.; Yun, D.; Sun, J.; Wang, Y. Facet-dependent selectivity of CeO2 nanoparticles in 2-propanol conversion. J. Catal. 2021, 404, 96–108. [Google Scholar] [CrossRef]
- Chakarova, K.; Drenchev, N.; Mihaylov, M.; Hadjiivanov, K.I. Interaction of O2 with reduced ceria nanoparticles at 100–400 K: Fast oxidation of Ce3+ ions and dissolved H2. Catalysts 2024, 14, 45. [Google Scholar] [CrossRef]
- Chakarova, K.; Zdravkova, V.; Karapenchev, B.; Nihtianova, D.; Ivanova, E.; Aleksandrov, H.; Koleva, I.; Panayotov, D.; Mihaylov, M.; Vayssilov, G.; et al. Evolution of Ce4+ Lewis acidity during dehydroxylation of ceria nanoparticles with different morphology: An integrated FTIR, DFT and HRTEM study. J. Catal. 2024, 433, 115463. [Google Scholar] [CrossRef]
- Chakarova, K.K.; Karapenchev, B.S.; Drenchev, M.; Ivanova, E.Z.; Aleksandrov, H.A.; Panayotov, D.A.; Mihaylov, M.Y.; Vayssilov, G.N.; Hadjiivanov, K.I. FTIR study of low-temperature CO adsorption on reduced ceria nanoparticles with different morphology: A comparison with oxidized samples. J. Catal. 2025, 443, 115986. [Google Scholar] [CrossRef]
- Aneggi, E.; Llorca, J.; Boaro, M.; Trovarelli, A. Surface-structure sensitivity of CO oxidation over polycrystalline ceria powders. J. Catal. 2005, 234, 88–95. [Google Scholar] [CrossRef]
- Aneggi, E.; Wiater, D.; Leitenburg, C.; Llorca, J.; Trovarelli, A. Shape-dependent activity of ceria in soot combustion. ACS Catal. 2014, 4, 172–181. [Google Scholar] [CrossRef]
- Kovacevic, M.; Mojet, B.L.; van Ommen, J.G.; Lefferts, L. Effects of morphology of cerium oxide catalysts for reverse water gas shift reaction. Catal. Lett. 2016, 146, 770–777. [Google Scholar] [CrossRef]
- Hadjiivanov, K.I.; Vayssilov, G.N. Characterization of oxide surfaces and zeolites by carbon monoxide as an IR probe molecule. Adv. Catal. 2002, 47, 307–511. [Google Scholar] [CrossRef]
- Davydov, A.A. Infrared Spectroscopy of Adsorbed Species on the Surface of Transition Metal Oxides; J. Wiley & Sons: Chichester, UK, 1990. [Google Scholar]
- Bozon-Verduraz, F.; Bensalem, A. IR studies of cerium dioxide: Influence of impurities and defects. J. Chem. Soc. Faraday Trans. 1994, 90, 653–657. [Google Scholar] [CrossRef]
- Binet, C.; Badri, A.; Lavalley, J.-C. A spectroscopic characterization of the reduction of ceria from electronic transitions of intrinsic point defects. J. Phys. Chem. 1994, 98, 6392–6398. [Google Scholar] [CrossRef]
- Binet, C.; Daturi, M.; Lavalley, J.-C. IR study of polycrystalline ceria properties in oxidised and reduced states. Catal. Today 1999, 50, 207–225. [Google Scholar] [CrossRef]
- Vayssilov, G.N.; Mihaylov, M.; Petkov, P.S.; Hadjiivanov, K.I.; Neyman, K.M. Reassignment of the vibrational spectra of carbonates, formates, and related surface species on ceria: A combined density functional and infrared spectroscopy investigation. J. Phys. Chem. C 2011, 115, 23435–23454. [Google Scholar] [CrossRef]
- Mihaylov, M.Y.; Ivanova, E.Z.; Aleksandrov, H.A.; Petkov, P.S.; Vayssilov, G.N.; Hadjiivanov, K.I. FTIR and density functional study of NO interaction with reduced ceria: Identification of N3− and NO2− as new intermediates in NO conversion. Appl. Catal. B 2015, 176–177, 107–119. [Google Scholar] [CrossRef]
- Wu, W.; Savereide, L.M.; Notestein, J.; Weitz, E. In-situ IR spectroscopy as a probe of oxidation/reduction of Ce in nanostructured CeO2. Appl. Surf. Sci. 2018, 445, 548–554. [Google Scholar] [CrossRef]
- Grünbacher, M.; Schlicker, L.; Bekheet, M.F.; Gurlo, A.; Klötzer, B.; Penner, S. H2 reduction of Gd- and Sm-doped ceria compared to pure CeO2 at high temperatures: Effect on structure, oxygen nonstoichiometry, hydrogen solubility and hydroxyl chemistry. Phys. Chem. Chem. Phys. 2018, 20, 22099–22113. [Google Scholar] [CrossRef] [PubMed]
- Panayotov, D.; Zdravkova, V.; Lagunov, O.; Andonova, S.; Spassova, I.; Nihtianova, D.; Atanasova, G.; Drenchev, N.; Ivanova, E.; Mihaylov, M.; et al. Capturing CO2 by ceria and ceria-zirconia nanomaterials of different origin. Phys. Chem. Chem. Phys. 2023, 25, 17154–17175. [Google Scholar] [CrossRef] [PubMed]
- Afrin, S.; Bollini, P. On the utility of Ce3+ spin-orbit transitions in the interpretation of rate data in ceria catalysis: Theory, validation, and application. J. Phys. Chem. C 2023, 127, 234–247. [Google Scholar] [CrossRef]
- Bensalem, D.; Bozon-Verduraz, F.; Delamar, M.; Bugli, G. Preparation and characterization of highly dispersed silica-supported ceria. Appl. Catal. A 1995, 121, 81–93. [Google Scholar] [CrossRef]
- Vassileva, E.; Varimezova, B.; Hadjiivanov, K. Column solid-phase extraction of heavy metal ions on a high surface area CeO2 as a pre-concentration method for trace determination. Anal. Chim. Acta 1996, 336, 141–150. [Google Scholar] [CrossRef]
- Wang, Y.; Liu, Z.; Confer, M.P.; Li, J.; Wang, R. In-situ DRIFTS study of chemically etched CeO2 nanorods supported transition metal oxide catalysts. Mol. Catal. 2021, 509, 111629. [Google Scholar] [CrossRef]
- Chen, S.; Cao, T.; Gao, Y.; Li, D.; Xiong, F.; Huang, W. Probing surface structures of CeO2, TiO2, and Cu2O nanocrystals with CO and CO2 chemisorption. J. Phys. Chem. C 2016, 120, 21472–21485. [Google Scholar] [CrossRef]
- Laachir, A.; Perrichon, V.; Badri, A.; Lamotte, J.; Catherine, E.; Lavalley, J.C.; El Fallah, J.; Hilaire, L.; Le Normand, F.; Quéméré, E.; et al. Reduction of CeO2 by hydrogen: Magnetic susceptibility and Fourier-transform infrared, ultraviolet and X-ray photoelectron spectroscopy measurements. J. Chem. Soc. Faraday Trans. 1991, 87, 1601–1609. [Google Scholar] [CrossRef]
- Jacobs, G.; Williams, L.; Graham, U.; Thomas, G.A.; Sparks, D.E.; Davis, B.H. Low temperature water–gas shift: In situ DRIFTS-reaction study of ceria surface area on the evolution of formates on Pt/CeO2 fuel processing catalysts for fuel cell applications. Appl. Catal. A 2003, 252, 107–118. [Google Scholar] [CrossRef]
- Zepeda, T.A.; Hernandez-Maldonado, J.A.; Fuentes, G.A.; Fierro-Gonzalez, J.C.; Goomez, S.A. Spectroscopic insights into gold-cerium oxidation states influencing catalytic activity and selectivity in CeO2-supported gold during CO-PROX reaction. Mol. Catal. 2024, 552, 113693. [Google Scholar] [CrossRef]
- Daly, H.; Ni, J.; Thompsett, D.; Meunier, F.C. On the usefulness of carbon isotopic exchange for the operando analysis of metal–carbonyl bands by IR over ceria-containing catalysts. J. Catal. 2008, 254, 238–243. [Google Scholar] [CrossRef]
- Sakata, Y.; Kinoshita, N.; Domen, K.; Onishi, T. Infrared studies on dinitrogen and dihydrogen adsorbed over TiO2 at low temperatures. J. Chem. Soc. Faraday Trans. 1987, 83, 2765–2772. [Google Scholar] [CrossRef]
- Geobaldo, F.; Lamberti, C.; Ricchiardi, G.; Bordiga, S.; Zecchina, A.; Turnes Palomino, G.; Otero Arean, C. N2 adsorption at 77 K on H-mordenite and alkali-metal-exchanged mordenites: An IR study. J. Phys. Chem. 1995, 99, 11167–11177. [Google Scholar] [CrossRef]
- Wakabayashi, F.; Kondo, J.N.; Domen, K.; Hirose, C. Direct comparison of N2 and CO as IR-spectroscopic probes of acid sites in H-ZSM-5 zeolite. J. Phys. Chem. 1995, 99, 10573–10580. [Google Scholar] [CrossRef]
- Neyman, K.M.; Strodel, P.; Ruzankin, S.P.; Schlensog, N.; Knözinger, H. N2 and CO molecules as probes of zeolite acidity: An infrared spectroscopy and density functional investigation. Catal. Lett. 1995, 31, 273–285. [Google Scholar] [CrossRef]
- Hadjiivanov, K.; Knözinger, H. FTIR spectroscopic evidence of formation of geminal dinitrogen species during the low-temperature N2 adsorption on NaY zeolites. Catal. Lett. 1999, 58, 21–26. [Google Scholar] [CrossRef]
- Zecchina, A.; Otero Arean, C.; Turnes Palomino, G.; Geobaldo, F.; Lamberti, C.; Spoto, G.; Bordiga, S. The vibrational spectroscopy of H2, N2, CO and NO adsorbed on the titanosilicate molecular sieve ETS-10. Phys. Chem. Chem. Phys. 1999, 1, 1649–1657. [Google Scholar] [CrossRef]
- Vayssilov, G.N.; Hu, A.; Birkenheuer, U.; Rösch, N. Dinitrogen as probe molecule of alkali-exchanged zeolites: A density functional study. J. Mol. Catal. A 2000, 162, 135–140. [Google Scholar] [CrossRef]
- Recchia, S.; Dossi, C.; Psaro, R.; Fusi, A.; Ugo, R. Dinitrogen irreversible adsorption on overexchanged Cu-ZSM-5. J. Phys. Chem. B 2002, 106, 13326–13332. [Google Scholar] [CrossRef]
- Larin, D.V.; Vercauteren, D.P.; Lamberti, C.; Bordiga, S.; Zecchina, A. Interaction between probe molecules and zeolites. Part II: Interpretation of the IR spectra of CO and N2 adsorbed in NaY and NaRbY. Phys. Chem. Chem. Phys. 2002, 4, 2424–2433. [Google Scholar] [CrossRef]
- Valenzano, L.; Civalleri, B.; Chavan, S.; Turnes Palomino, G.; Arean, C.O.; Bordiga, S. Computational and experimental studies on the adsorption of CO, N2, and CO2 on Mg-MOF-74. J. Phys. Chem. C 2010, 114, 11185–11191. [Google Scholar] [CrossRef]
- Zdravkova, V.; Mihaylov, M.; Hadjiivanov, K. Coordination of two N2 molecules to one Ni+ site in Ni–ZSM-5: An FTIR spectroscopy study. J. Phys. Chem. C 2024, 116, 12706–12711. [Google Scholar] [CrossRef]
- Chakarova, K.K.; Mihaylov, M.Y.; Karapenchev, B.S.; Koleva, I.Z.; Vayssilov, G.N.; Aleksandrov, H.A.; Hadjiivanov, K.I. N2 as an efficient IR probe molecule for the investigation of ceria-containing materials. Molecules 2024, 29, 3608. [Google Scholar] [CrossRef] [PubMed]
- Yang, C.; Capdevila-Cortada, M.; Dong, C.; Zhou, Y.; Wang, J.; Yu, X.; Nefedov, A.; Heißler, S.; López, N.; Shen, W.; et al. Surface refaceting mechanism on cubic ceria. J. Phys. Chem. Lett. 2020, 11, 7925–7931. [Google Scholar] [CrossRef] [PubMed]
- Loridant, S. Raman spectroscopy as a powerful tool to characterize ceria-based catalysts. Catal. Today 2021, 373, 98–111. [Google Scholar] [CrossRef]
- Taniguchi, T.; Watanabe, T.; Sugiyama, N.; Subramani, A.K.; Wagata, H.; Matsushita, N.; Yoshimura, M. Identifying defects in ceria-based nanocrystals by UV resonance Raman spectroscopy. J. Phys. Chem. C 2009, 113, 19789–19793. [Google Scholar] [CrossRef]
- Trenque, I.; Magnano, G.C.; Bárta, J.; Chaput, F.; Bolzinger, M.A.; Pitault, I.; Briançon, S.; Masenelli-Varlot, K.; Bugnet, M.; Dujardin, C.; et al. Synthesis routes of CeO2 nanoparticles dedicated to organophosphorus degradation: A benchmark. CrystEngComm 2020, 22, 1725–1737. [Google Scholar] [CrossRef]
- Cardenas, L.; Molinet-Chinaglia, C.; Loridant, S. Unraveling Ce3+ detection at the surface of ceria nanopowders by UPS analysis. Phys. Chem. Chem. Phys. 2022, 24, 22815–22822. [Google Scholar] [CrossRef] [PubMed]
- Hojo, H.; Hirota, K.; Ito, S.; Einaga, S. Reduction mechanism for CeO2 revealed by direct observation of the oxygen vacancy distribution in shape-controlled CeO2. Adv. Mater. Interfaces 2023, 10, 2201954. [Google Scholar] [CrossRef]
- Bruce, L.A.; Hoang, M.; Hughes, A.E.; Turney, T.W. Surface area control during the synthesis and reduction of high area ceria catalyst supports. Appl. Catal. A 1996, 134, 351–362. [Google Scholar] [CrossRef]
- Holgado, J.P.; Munuera, G. XPS/TPR study of the reducibility of M/CeO2 catalysts (M = Pt, Rh): Does junction effect theory apply? Stud. Surf. Sci. Catal. 1995, 96, 109–122. [Google Scholar] [CrossRef]
- Rao, G.R. Influence of metal particles on the reduction properties of ceria-based materials studied by TPR. Bull. Mater. Sci. 1999, 22, 89–94. [Google Scholar] [CrossRef]
- Nolan, M.; Parker, S.C.; Watson, G.W. The electronic structure of oxygen vacancy defects at the low index surfaces of ceria. Surf. Sci. 2005, 595, 223–232. [Google Scholar] [CrossRef]
- Bernal, S.; Calvino, J.J.; Cifredo, G.A.; Gatica, J.M.; Perez Omil, H.; Pintado, J.M. Hydrogen chemisorption on ceria: Influence of the oxide surface area and degree of reduction. J. Chem. Soc. Faraday Trans. 1993, 89, 3499–3505. [Google Scholar] [CrossRef]
- Tsyganenko, A.A.; Filimonov, V.N. Infrared spectra of surface hydroxyl groups and crystalline structure of oxides. J. Mol. Struct. 1973, 19, 579–589. [Google Scholar] [CrossRef]
- Badri, A.; Binet, C.; Lavalley, J.-C. An FTIR study of surface ceria hydroxy groups during a redox process with H2. J. Chem. Soc. Faraday Trans. 1996, 92, 4669–4673. [Google Scholar] [CrossRef]
- Wu, Z.; Cheng, Y.; Tao, F.; Daemen, L.; Foo, G.S.; Nguyen, L.; Zhang, X.; Beste, A.; Ramirez-Cuesta, A.J. Direct neutron spectroscopy observation of cerium hydride species on a cerium oxide catalyst. J. Am. Chem. Soc. 2017, 139, 9721–9727. [Google Scholar] [CrossRef] [PubMed]
- Zverev, S.M.; Smirnov, K.S.; Tsyganenko, A.A. IR spectroscopic study of low-temperature adsorption of molecular nitrogen on the surface of oxides. Kinet. Catal. 1988, 29, 1251–1257. [Google Scholar]
- Chakarova, K.; Strauss, I.; Mihaylov, M.; Drenchev, N.; Hadjiivanov, K. Evolution of acid and basic sites in UiO-66 and UiO-66-NH2 metal-organic frameworks: FTIR study by probe molecules. Microporous Mesoporous Mater. 2019, 281, 110–122. [Google Scholar] [CrossRef]
- Lustemberg, P.G.; Yang, C.; Wang, Y.; Wöll, C.; Ganduglia-Pirovano, M.V. Vibrational frequencies of CO bound to all three low-index cerium oxide surfaces: A consistent theoretical description of vacancy-induced changes using density functional theory. J. Chem. Phys. 2023, 159, 034704. [Google Scholar] [CrossRef] [PubMed]
- Babaeva, M.A.; Tsyganenko, A.A. Infrared spectroscopic evidence for the formation of carbonite CO22− ions in CO interaction with basic oxide surfaces. React. Kinet. Catal. Lett. 1987, 34, 9–14. [Google Scholar] [CrossRef]
- Kresse, G.; Hafner, J. Ab initio molecular dynamics for liquid metals. Phys. Rev. B 1993, 47, 558–561. [Google Scholar] [CrossRef] [PubMed]
- Vienna Ab Initio Simulation Package (VASP), Version 6.4. A computer program for atomic scale materials modelling. University of Vienna: Vienna, Austria. Available online: https://cmp.univie.ac.at/research/vasp/ (accessed on 19 June 2025).
- Kresse, G.; Joubert, D. From ultrasoft pseudopotentials to the projector augmented-wave method. Phys. Rev. B 1999, 59, 1758–1775. [Google Scholar] [CrossRef]
- Perdew, J.P.; Chevary, J.A.; Vosko, S.H.; Jackson, K.A.; Pederson, M.R.; Singh, D.J.; Fiolhais, C. Erratum: Atoms, molecules, solids, and surfaces: Applications of the generalized gradient approximation for exchange and correlation. Phys. Rev. B 1993, 48, 4978. [Google Scholar] [CrossRef] [PubMed]
- Grimme, S.J. Semiempirical GGA-type density functional constructed with a long-range dispersion correction. J. Comput. Chem. 2006, 27, 1787–1799. [Google Scholar] [CrossRef] [PubMed]
- Anisimov, V.I.; Aryasetiawan, F.; Lichtenstein, A.I. First-principles calculations of the electronic structure and spectra of strongly correlated systems: The LDA+U method. J. Phys. Condens. Matter 1997, 9, 767–808. [Google Scholar] [CrossRef]
- Dudarev, S.L.; Botton, G.A.; Savrasov, S.Y.; Humphreys, C.J.; Sutton, A.P. Electron-energy-loss spectra and the structural stability of nickel oxide: An LSDA+U study. Phys. Rev. B 1998, 57, 1505–1509. [Google Scholar] [CrossRef]
- Blöchl, P.E. Projector augmented-wave method. Phys. Rev. B 1994, 50, 17953–17979. [Google Scholar] [CrossRef] [PubMed]
- Rasetti, F. Incoherent scattered radiation in diatomic molecules. Phys. Rev. 1929, 34, 367. [Google Scholar] [CrossRef]


| Sample | Crystallite Shape | Dominant Facets | Average Crystallite Size [nm] * | SBET [m2 g−1] | Pore Volume [cm3 g−1] | Average Pore Diameter [nm] |
|---|---|---|---|---|---|---|
| CeO2-NC | cubes | {100} | 27.2 | 31 | 0.17 | 22 |
| CeO2-NP | polyhedra | {111} | 29.2 | 29 | 0.19 | 26 |
| CeO2-NR | rods | {110} | 6.3 | 110 | 0.46 | 17 |
| Model | BE [eV] | Calculated Frequency [cm−1] | Experimental Frequency [cm−1] |
|---|---|---|---|
| Gas phase | − | 2252 | 2252 |
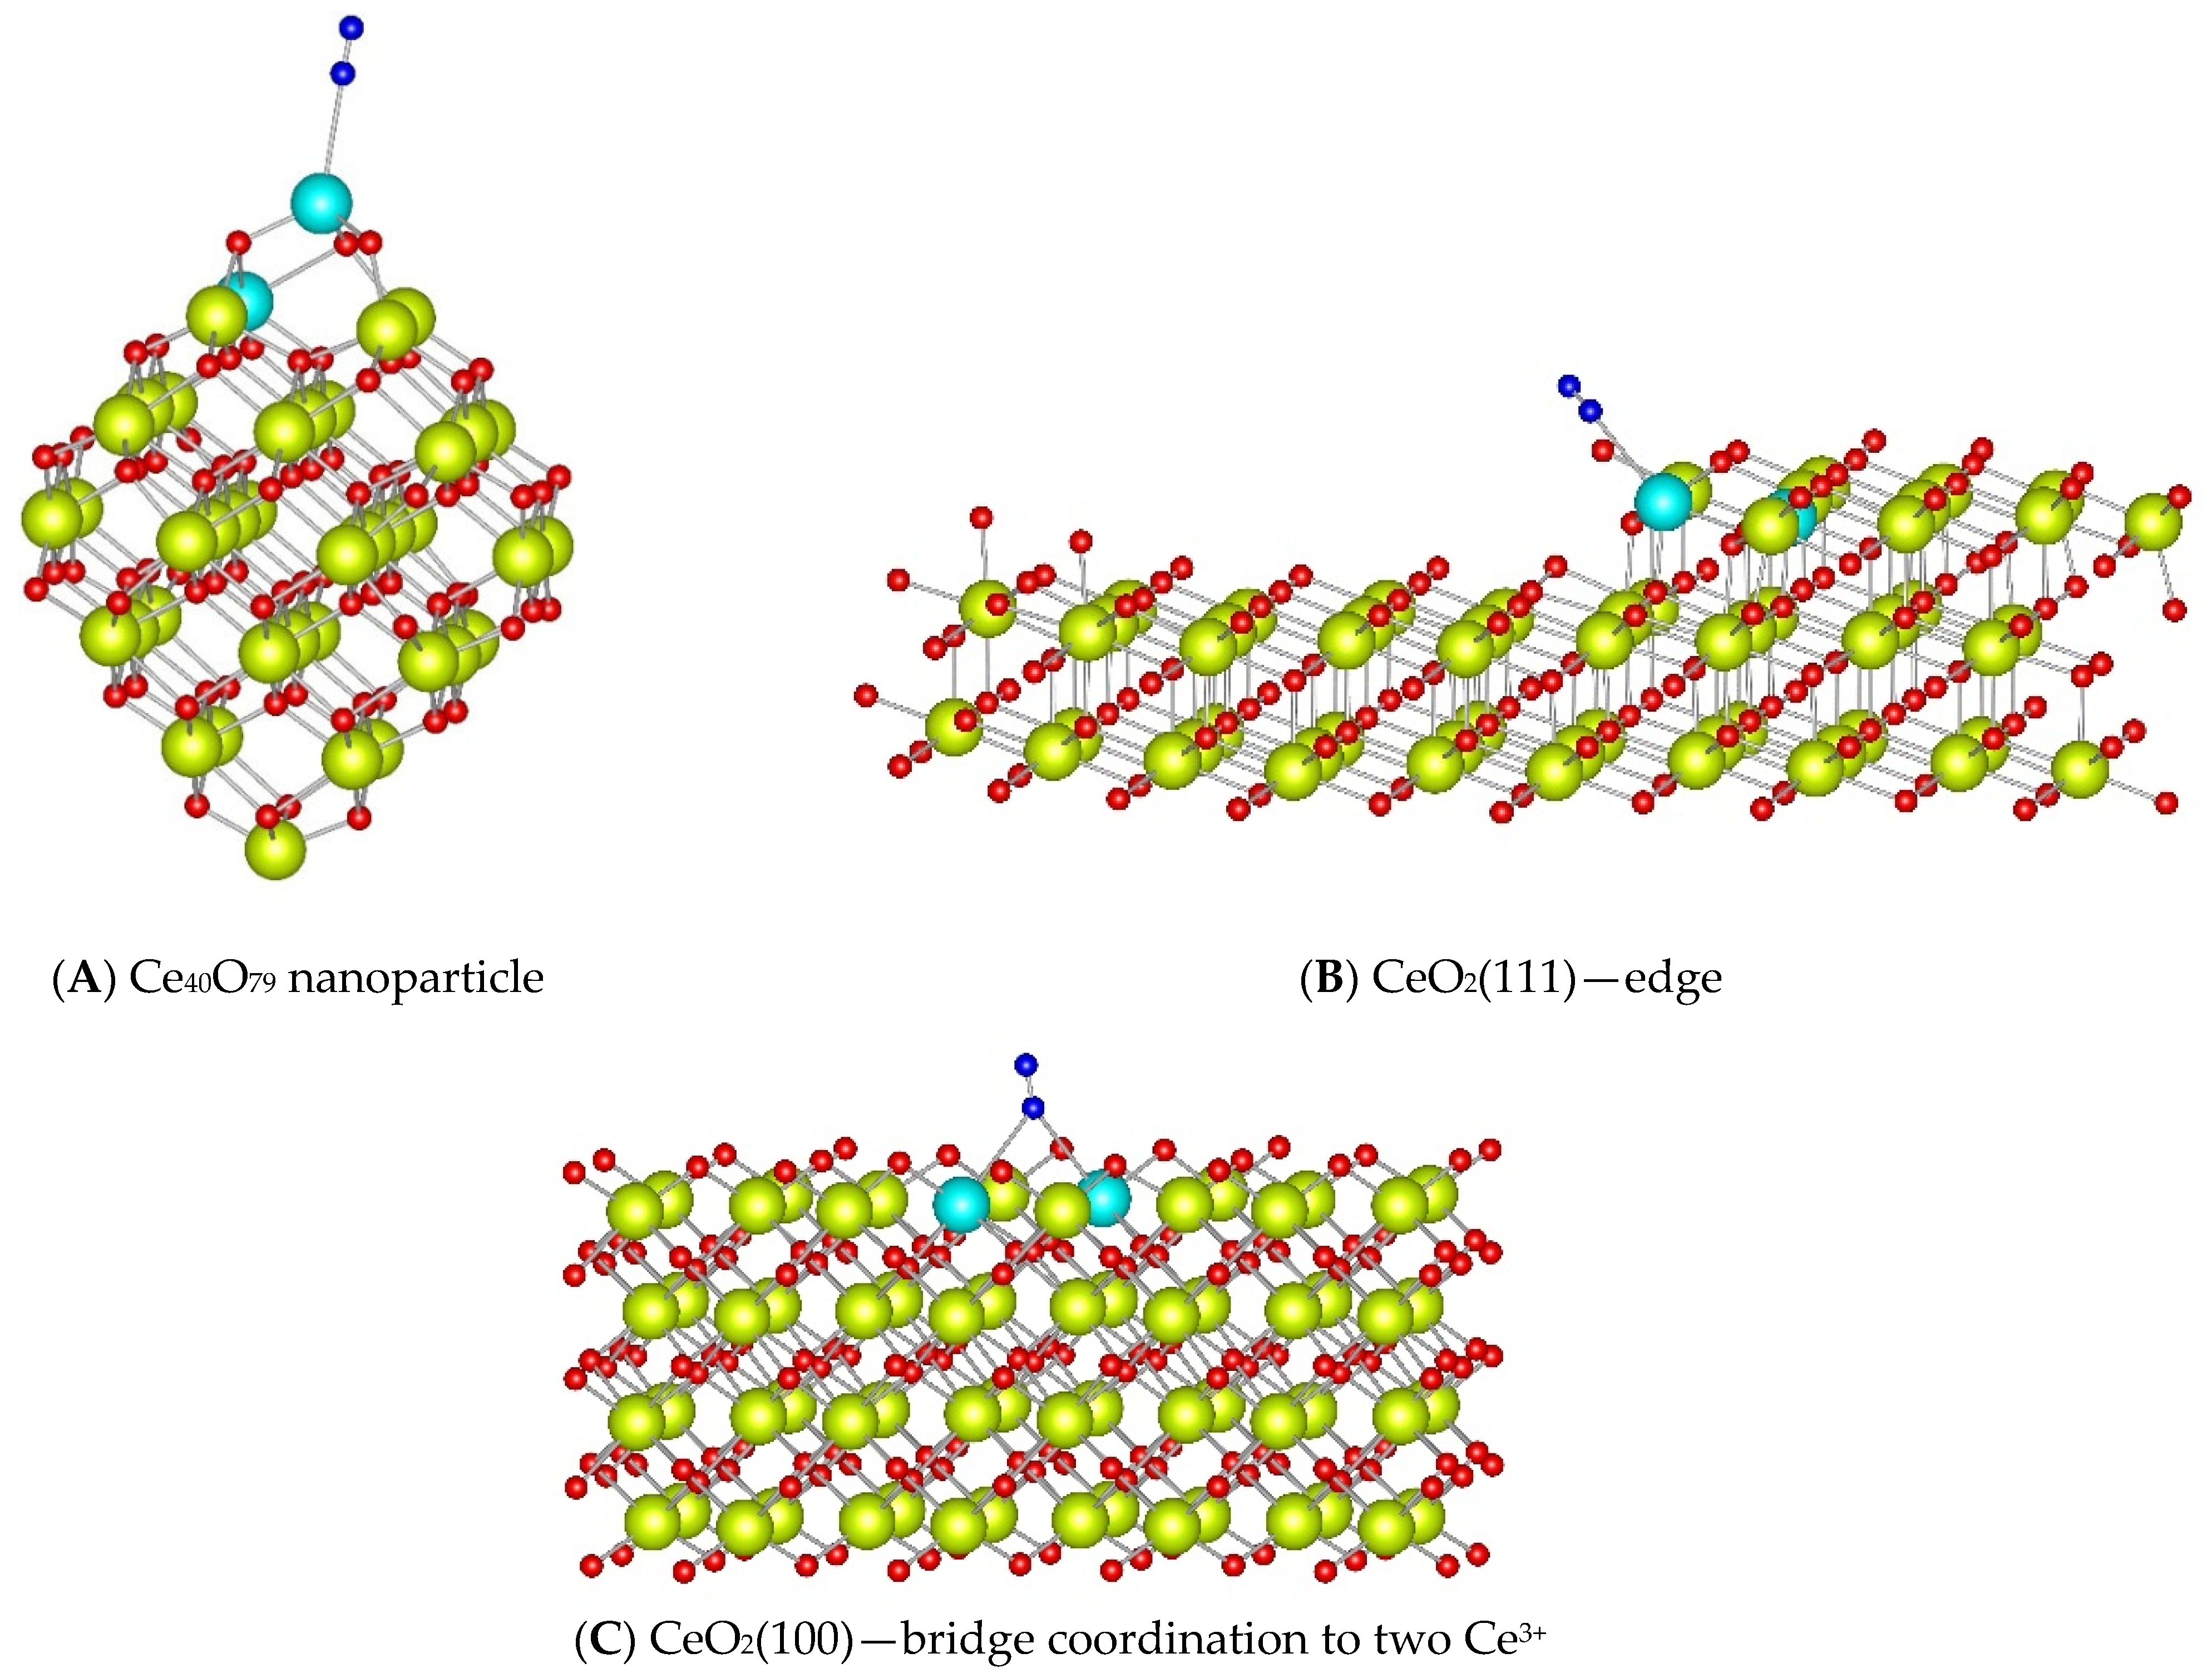
| Nanoparticle | −0.27 | 2249 | 2256–2255 |
| CeO2(111)—edge | −0.34 | 2247 | 2256–2255 |
| CeO2(100)—bridge | −0.40 | 2241 | 2254–2253 |
| CeO2(100)—parallel | −0.60 | 2025, 2018 | − |
| CeO2(110)—parallel | −0.50 | 2083 | − |
Disclaimer/Publisher’s Note: The statements, opinions and data contained in all publications are solely those of the individual author(s) and contributor(s) and not of MDPI and/or the editor(s). MDPI and/or the editor(s) disclaim responsibility for any injury to people or property resulting from any ideas, methods, instructions or products referred to in the content. |
© 2025 by the authors. Licensee MDPI, Basel, Switzerland. This article is an open access article distributed under the terms and conditions of the Creative Commons Attribution (CC BY) license (https://creativecommons.org/licenses/by/4.0/).
Share and Cite
Chakarova, K.K.; Mihaylov, M.Y.; Karapenchev, B.S.; Drenchev, N.L.; Ivanova, E.Z.; Vayssilov, G.N.; Aleksandrov, H.A.; Hadjiivanov, K.I. FTIR Detection of Ce3+ Sites on Shape-Controlled Ceria Nanoparticles Using Adsorbed 15N2 as a Probe Molecule. Molecules 2025, 30, 3100. https://doi.org/10.3390/molecules30153100
Chakarova KK, Mihaylov MY, Karapenchev BS, Drenchev NL, Ivanova EZ, Vayssilov GN, Aleksandrov HA, Hadjiivanov KI. FTIR Detection of Ce3+ Sites on Shape-Controlled Ceria Nanoparticles Using Adsorbed 15N2 as a Probe Molecule. Molecules. 2025; 30(15):3100. https://doi.org/10.3390/molecules30153100
Chicago/Turabian StyleChakarova, Kristina K., Mihail Y. Mihaylov, Bayan S. Karapenchev, Nikola L. Drenchev, Elena Z. Ivanova, Georgi N. Vayssilov, Hristiyan A. Aleksandrov, and Konstantin I. Hadjiivanov. 2025. "FTIR Detection of Ce3+ Sites on Shape-Controlled Ceria Nanoparticles Using Adsorbed 15N2 as a Probe Molecule" Molecules 30, no. 15: 3100. https://doi.org/10.3390/molecules30153100
APA StyleChakarova, K. K., Mihaylov, M. Y., Karapenchev, B. S., Drenchev, N. L., Ivanova, E. Z., Vayssilov, G. N., Aleksandrov, H. A., & Hadjiivanov, K. I. (2025). FTIR Detection of Ce3+ Sites on Shape-Controlled Ceria Nanoparticles Using Adsorbed 15N2 as a Probe Molecule. Molecules, 30(15), 3100. https://doi.org/10.3390/molecules30153100