2.1. Structural Properties of the Catalysts
As shown in
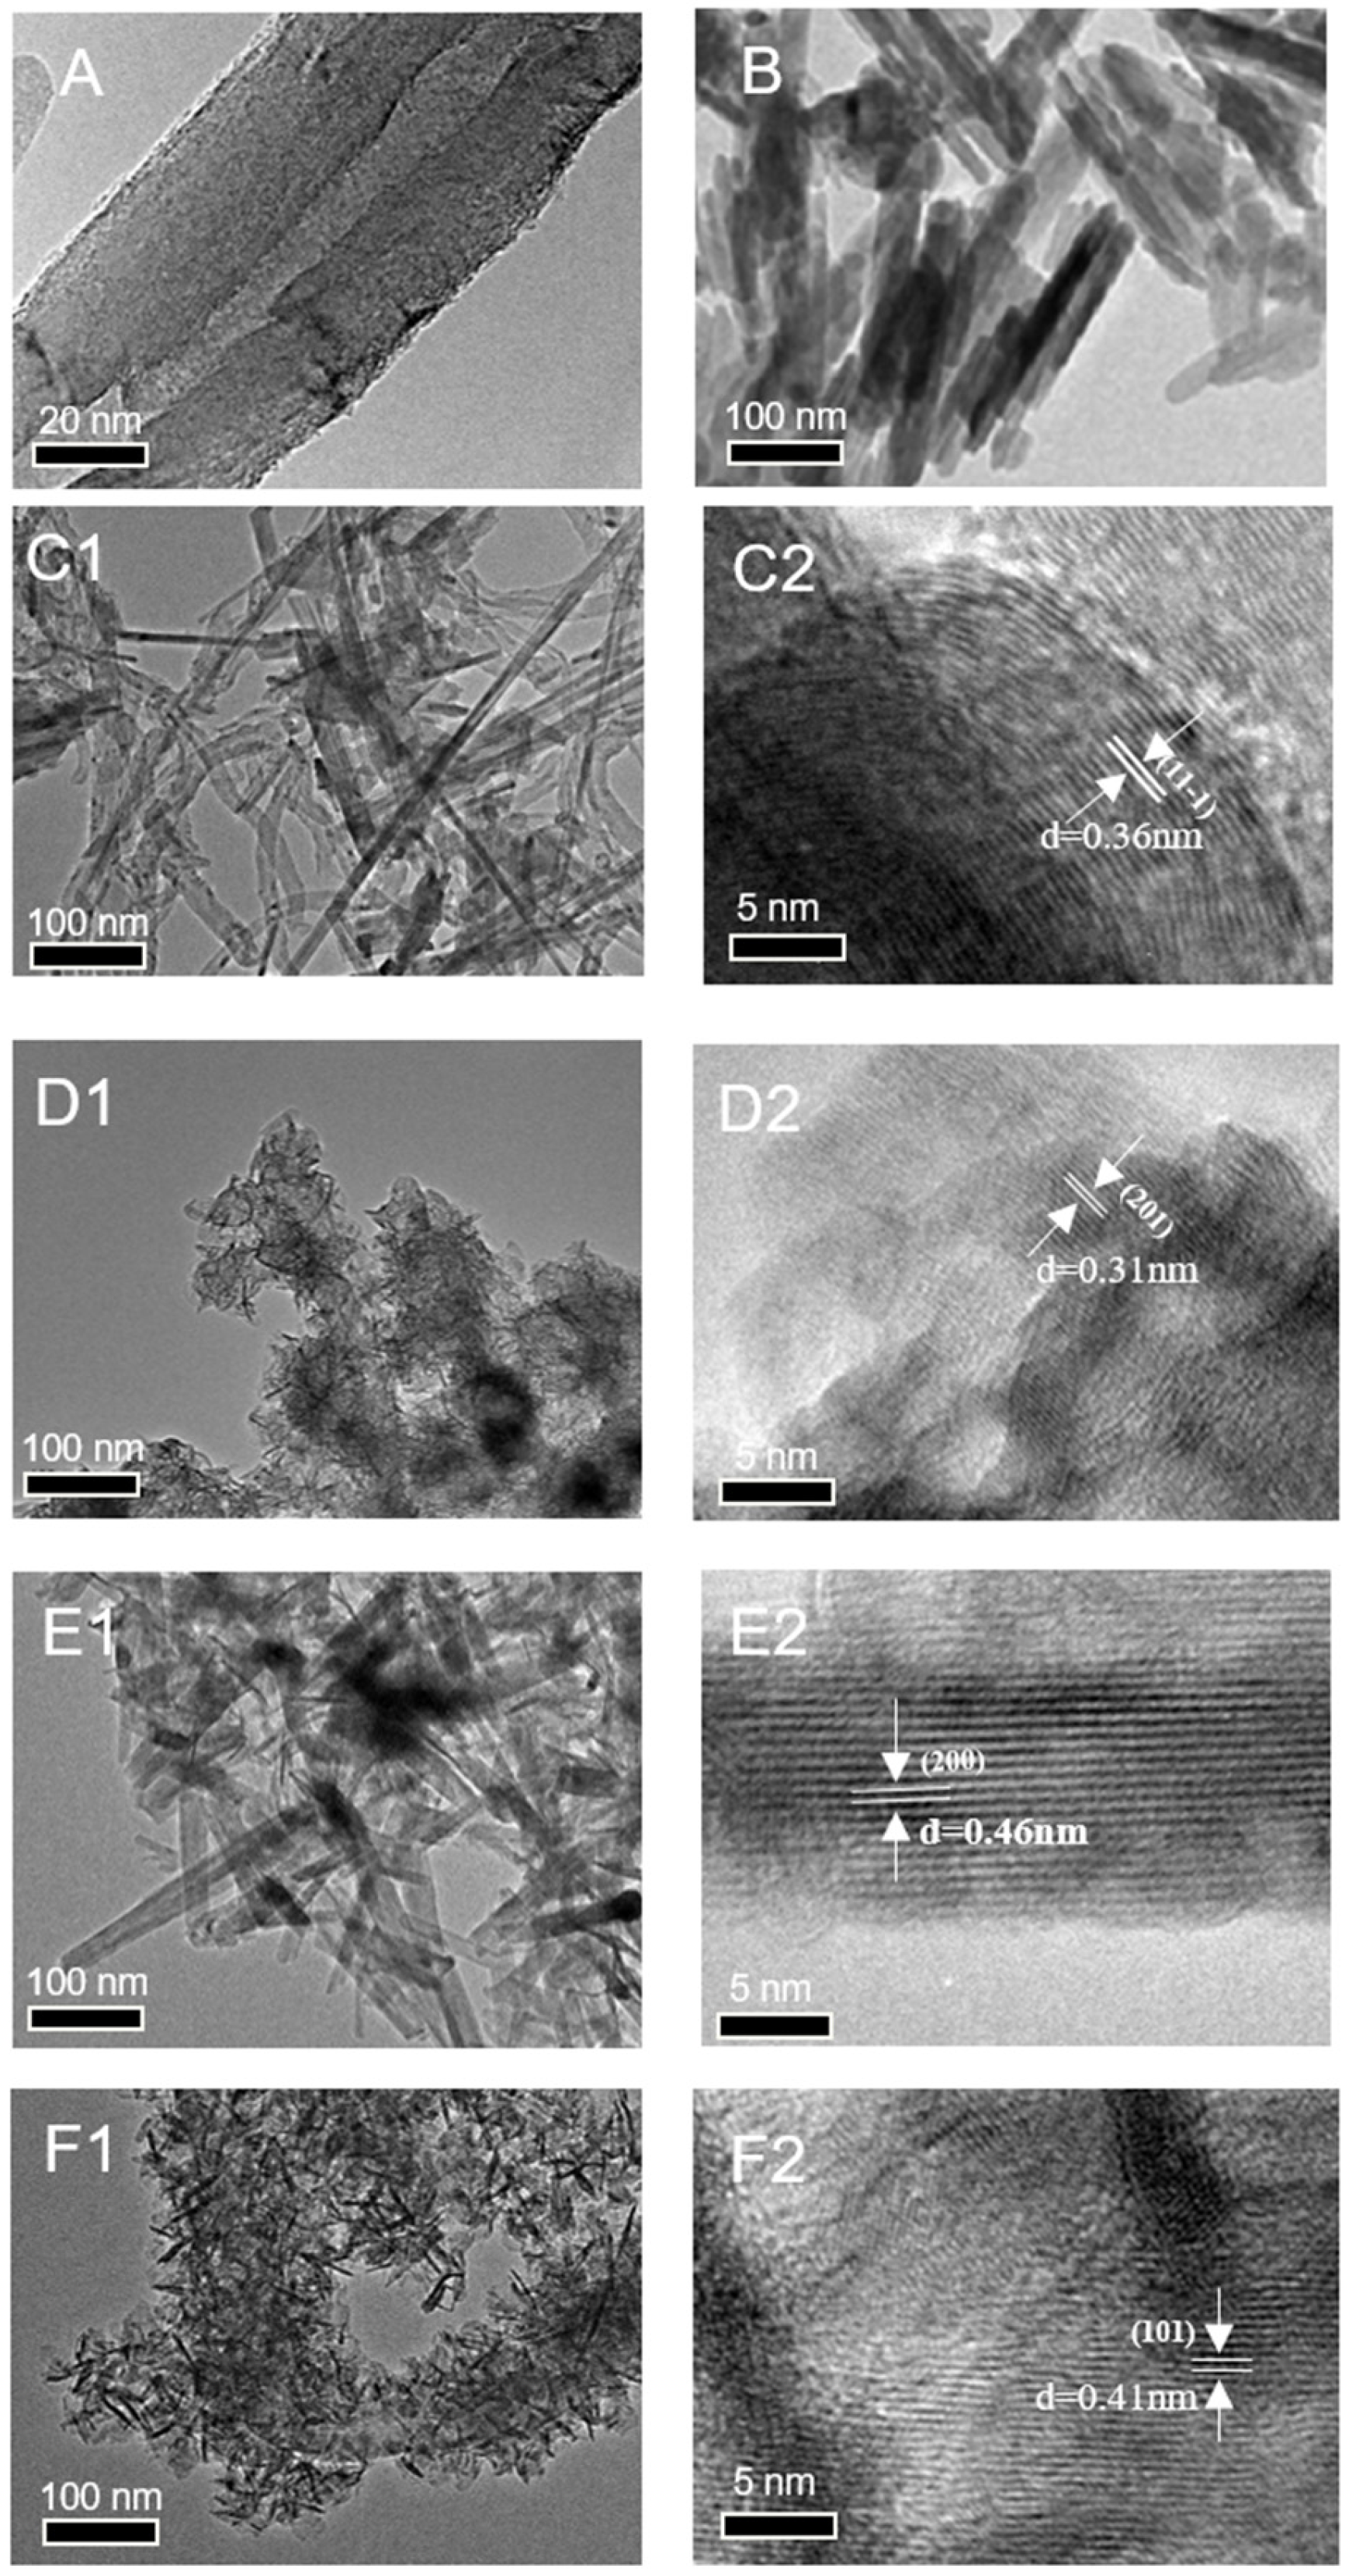
Figure 2A,B, the CNT substrate exhibits a characteristic tubular morphology with well-defined structural integrity, and the commercial manganese dioxide (MnO
x-NR) appears in a short rod shape. TEM characterization of MnO
x/CNT-A1 and MnO
x/CNT-S catalysts (
Figure 2(C1,E1)) reveals the conformal deposition of two-dimensional MnO
2 nanosheets uniformly coating the CNT surfaces. High-resolution TEM (HRTEM) analysis (
Figure 2(C2,E2)) demonstrates distinct lattice fringes with measured d-spacings of 0.36 nm and 0.46 nm, corresponding to the (11-1) crystallographic plane of MnOOH (PDF#41-1379) and the (200) plane of γ-MnO
2 (PDF#44-0142), respectively. In contrast, the MnO
x/CNT-A2 and MnO
x/CNT-C composites exhibit markedly different growth patterns (
Figure 2(D1,F1)). The MnO
x nanostructures display three-dimensional dendritic growth along the CNT axis, forming dense surface coatings with short needle-like protrusions (50–80 nm in length). Furthermore, elemental mapping analysis of the MnO
x/CNT-C catalyst (
Figure S1) corroborates the TEM observations, demonstrating the uniform dispersion of MnO
x nanoparticles over the carbon nanotube (CNT) support surface.
Comparative HRTEM examination (
Figure 2(D2,F2)) reveals relatively diffuse lattice fringes in these catalysts, suggesting lower crystallinity compared to their sheet-type counterparts. The attenuated fringe contrast and broader diffraction maxima indicate a predominant amorphous phase configuration containing structural defects (e.g., oxygen vacancies and lattice distortions), which may contribute to enhanced catalytic activity through increased active site density. Lattice parameter analysis confirms the presence of orthorhombic MnO
2 phases, with measured d-spacings of 0.31 nm and 0.41 nm corresponding to the (201) and (101) planes (PDF#44-0142), respectively.
As illustrated in Raman patterns of
Figure 3A, the CNT matrix exhibits characteristic D and G bands at 1339.58 cm
−1 and 1571.81 cm
−1 respectively, corresponding to disordered to sp
3 carbon and graphitic sp
2 carbon vibrations [
16]. All MnO
x-based composites (MnO
x-NR, MnO
x/CNT-A1, MnO
x/CNT-A2, MnO
x/CNT-S, and MnO
x/CNT-C) display two distinct phonon modes at 574 cm
−1 and 641 cm
−1, characteristic of cryptomelane-type MnO
2 with 2 × 2 tunnel structures. These modes are attributed to the Mn-O stretching vibration and symmetric stretching of MnO
6 octahedra, respectively [
17]. Notably, the well-defined peak at 641 cm
−1 confirms the formation of tetragonal α-MnO
2 with high crystallinity. Upon deposition onto CNT surfaces, the Mn-O stretching intensity undergoes significant attenuation, particularly for MnO
x/CNT-A1 (ΔI ≈ 78%), suggesting optimized interfacial interactions that suppress lattice vibrations. Concurrently, the CNT-derived D/G bands at 1344.35 cm
−1 and 1374.72 cm
−1 exhibit intensity reductions, reveals CNT was encapsulated by manganese dioxide and further evidencing charge transfer between CNT and MnO
x phases.
XRD patterns in
Figure 3B confirm effective MnO
x coating on CNT, as evidenced by the absence of graphitic (002) reflections at ~26°. The hydrothermally synthesized MnO
x/CNT-A1 demonstrates enhanced crystallinity relative to co-precipitated counterparts (MnO
x/CNT-A2/S/C), manifested through sharper (211) and (203) diffraction peaks at 42.2° and 65.7° (2θ). Rietveld refinement identifies MnO(OH) (PDF # 41-1379) and α-MnO
2 (PDF # 44-0141) as primary phases in MnO
x/CNT-A1. Comparatively, co-precipitated composites exhibit structural similarity to MnO
x-NR, with dominant (101), (211), and (203) planes at 22.0°, 42.2°, and 65.7° (2θ). The reduced peak intensity in MnO
x/CNT-C (FWHM increase ~34% vs. MnO
x-NR) implies CNT-induced lattice strain during heterogeneous nucleation, consistent with TEM-observed interfacial bonding (
Figure 2(D1,D2)). This synergistic CNT-MnO
x interaction facilitates electron transport pathways, as corroborated by enhanced cyclohexanol electrooxidation activity (see
Section 2.2).
The H
2-TPR profiles presented in
Figure 4 reveal that all catalysts exhibit two distinct reduction peaks within the temperature range of 150–630 °C, corresponding to the stepwise reduction process: MnO
2 → Mn
2O
3 (or Mn
3O
4) → MnO [
18]. While MnO
x/CNT-A1 and MnO
x/CNT-A2 demonstrate overlapping reduction peaks, the remaining three catalysts (MnO
x/CNT-S, MnO
x/CNT-C, and MnO
x-NR) display analogous peak configurations, suggesting comparable reduction capabilities among these materials. Notably, the first reduction peaks of the synthesized catalysts appear at lower temperatures compared to commercial manganese dioxide (MnO
x-NR), indicating enhanced oxidation capacity, especially MnO
x/CNT-C sample with lowest peak temperature appears at 270 °C. Furthermore, the second reduction peaks of MnO
x/CNT-S, MnO
x/CNT-C and MnO
x-NR appear at higher temperatures, suggesting that their Mn
3+ species exhibit greater resistance to reduction to Mn
2+. This thermal stability difference implies stronger metal-support interactions in the synthesized catalysts.
Figure 5 presents the XPS spectra of Mn 2p, Mn 3s, and O 1s core levels for the investigated catalysts. Deconvolution analysis of Mn 2p spectra (
Figure 5A) demonstrates six characteristic Mn
4+ multiplet splitting features accompanied by a distinct Mn
3+ satellite peak centered at 640.8 eV across all catalyst systems [
19]. Notably, prior mechanistic investigations have identified the oxidation of Mn
3+ to Mn
4+ as the rate-determining step in manganese-based catalytic cycles, highlighting the necessity of maintaining an optimal Mn
3+/Mn
4+ redox equilibrium for enhanced catalytic efficiency [
20]. In
Figure 5B, the Mn 3s splitting phenomenon exhibits characteristic energy separation (ΔE) that correlates with manganese oxidation states. A systematic comparison reveals ΔE values of 5.62 eV for MnO
x/CNT-C and 4.69 eV for MnO
x/CNT-A1, corresponding to higher and lower average manganese oxidation states, respectively. This disparity in ΔE values (ΔE = 0.93 eV) suggests substantial variations in metal-support interactions and electronic structure modulation induced by different synthetic protocols [
21]. In
Figure 5C, O 1s spectral deconvolution identifies three distinct oxygen species: lattice oxygen (O
lat, 529.9 eV), adsorbed oxygen (O
ads, 531.4 eV), and surface hydroxyl groups (533.5 eV) in MnO
x/CNT-A2, –S, and –C catalysts. Intriguingly, the MnO
x/CNT-A1 catalyst exhibits a 0.4 eV negative shift in O
lat binding energy (529.5 eV), indicative of increased low-valent manganese content. This observation aligns with established correlations between oxygen vacancy concentration and O
ads/O
lat ratios [
9]. Comparative analysis reveals that MnO
x incorporation significantly enhances O
ads/O
lat ratios across catalysts. The corresponding electronic structure parameters are systematically compiled in
Table 1 to facilitate the comparative analysis of catalytic performance.
2.2. Electro-Catalytic Performance
Cyclic voltammetry (CV) measurements were performed in K
2SO
4 electrolyte to evaluate the electrocatalytic activity of various catalysts towards cyclohexanol (Cy-OH) oxidation (
Figure S2). After the addition of Cy-OH, due to the electrochemical oxidation of cyclohexanol, the onset potential is significantly reduced, and the current density is increased. For the bare electrode and CNT, although there is an increase in current, it is much lower than that of the MnO
x-based composites, which proves that MnO
x is the key active component for catalyzing the oxidation of Cy-OH. Although variations in background current and capacitance were observed among the catalysts, distinct oxidation peaks corresponding to Cy-OH emerged at potentials exceeding 1.0 V (vs. Ag/AgCl) for all catalysts. For clearer comparison, linear sweep voltammetry (LSV) curves within the potential range of 1.0 to 1.5 V were extracted and analyzed (
Figure 6). Compared to the baseline system without Cy-OH substrate, all catalytic systems exhibited significantly enhanced current responses in their LSV curves when the applied potential exceeded 1.25 V. The observed current density increase in the Cy-OH-free system within this potential window can be attributed to water electrolysis, while the distinct potential-dependent behavior of the Cy-OH-containing systems suggests that substrate introduction effectively enhances electrochemical reaction kinetics, providing indirect evidence for oxidative conversion of Cy-OH at the electrode surface. Notably, MnO
x/CNT-C catalyst demonstrates a 170 mV negative shift in oxidation onset potential (1.08 V) compared to MnO
x/CNT-A1 (1.25 V), indicating superior catalytic activity towards Cy-OH oxidation. As a critical parameter for evaluating electrocatalytic performance, current density directly reflects reaction kinetics at the electrode interface. At the characteristic potential of 1.25 V, MnO
x/CNT-C achieves a peak current density of 0.02 mA·cm
−2, which substantially exceeds those of other comparative catalysts, further confirming its optimal catalytic efficiency.
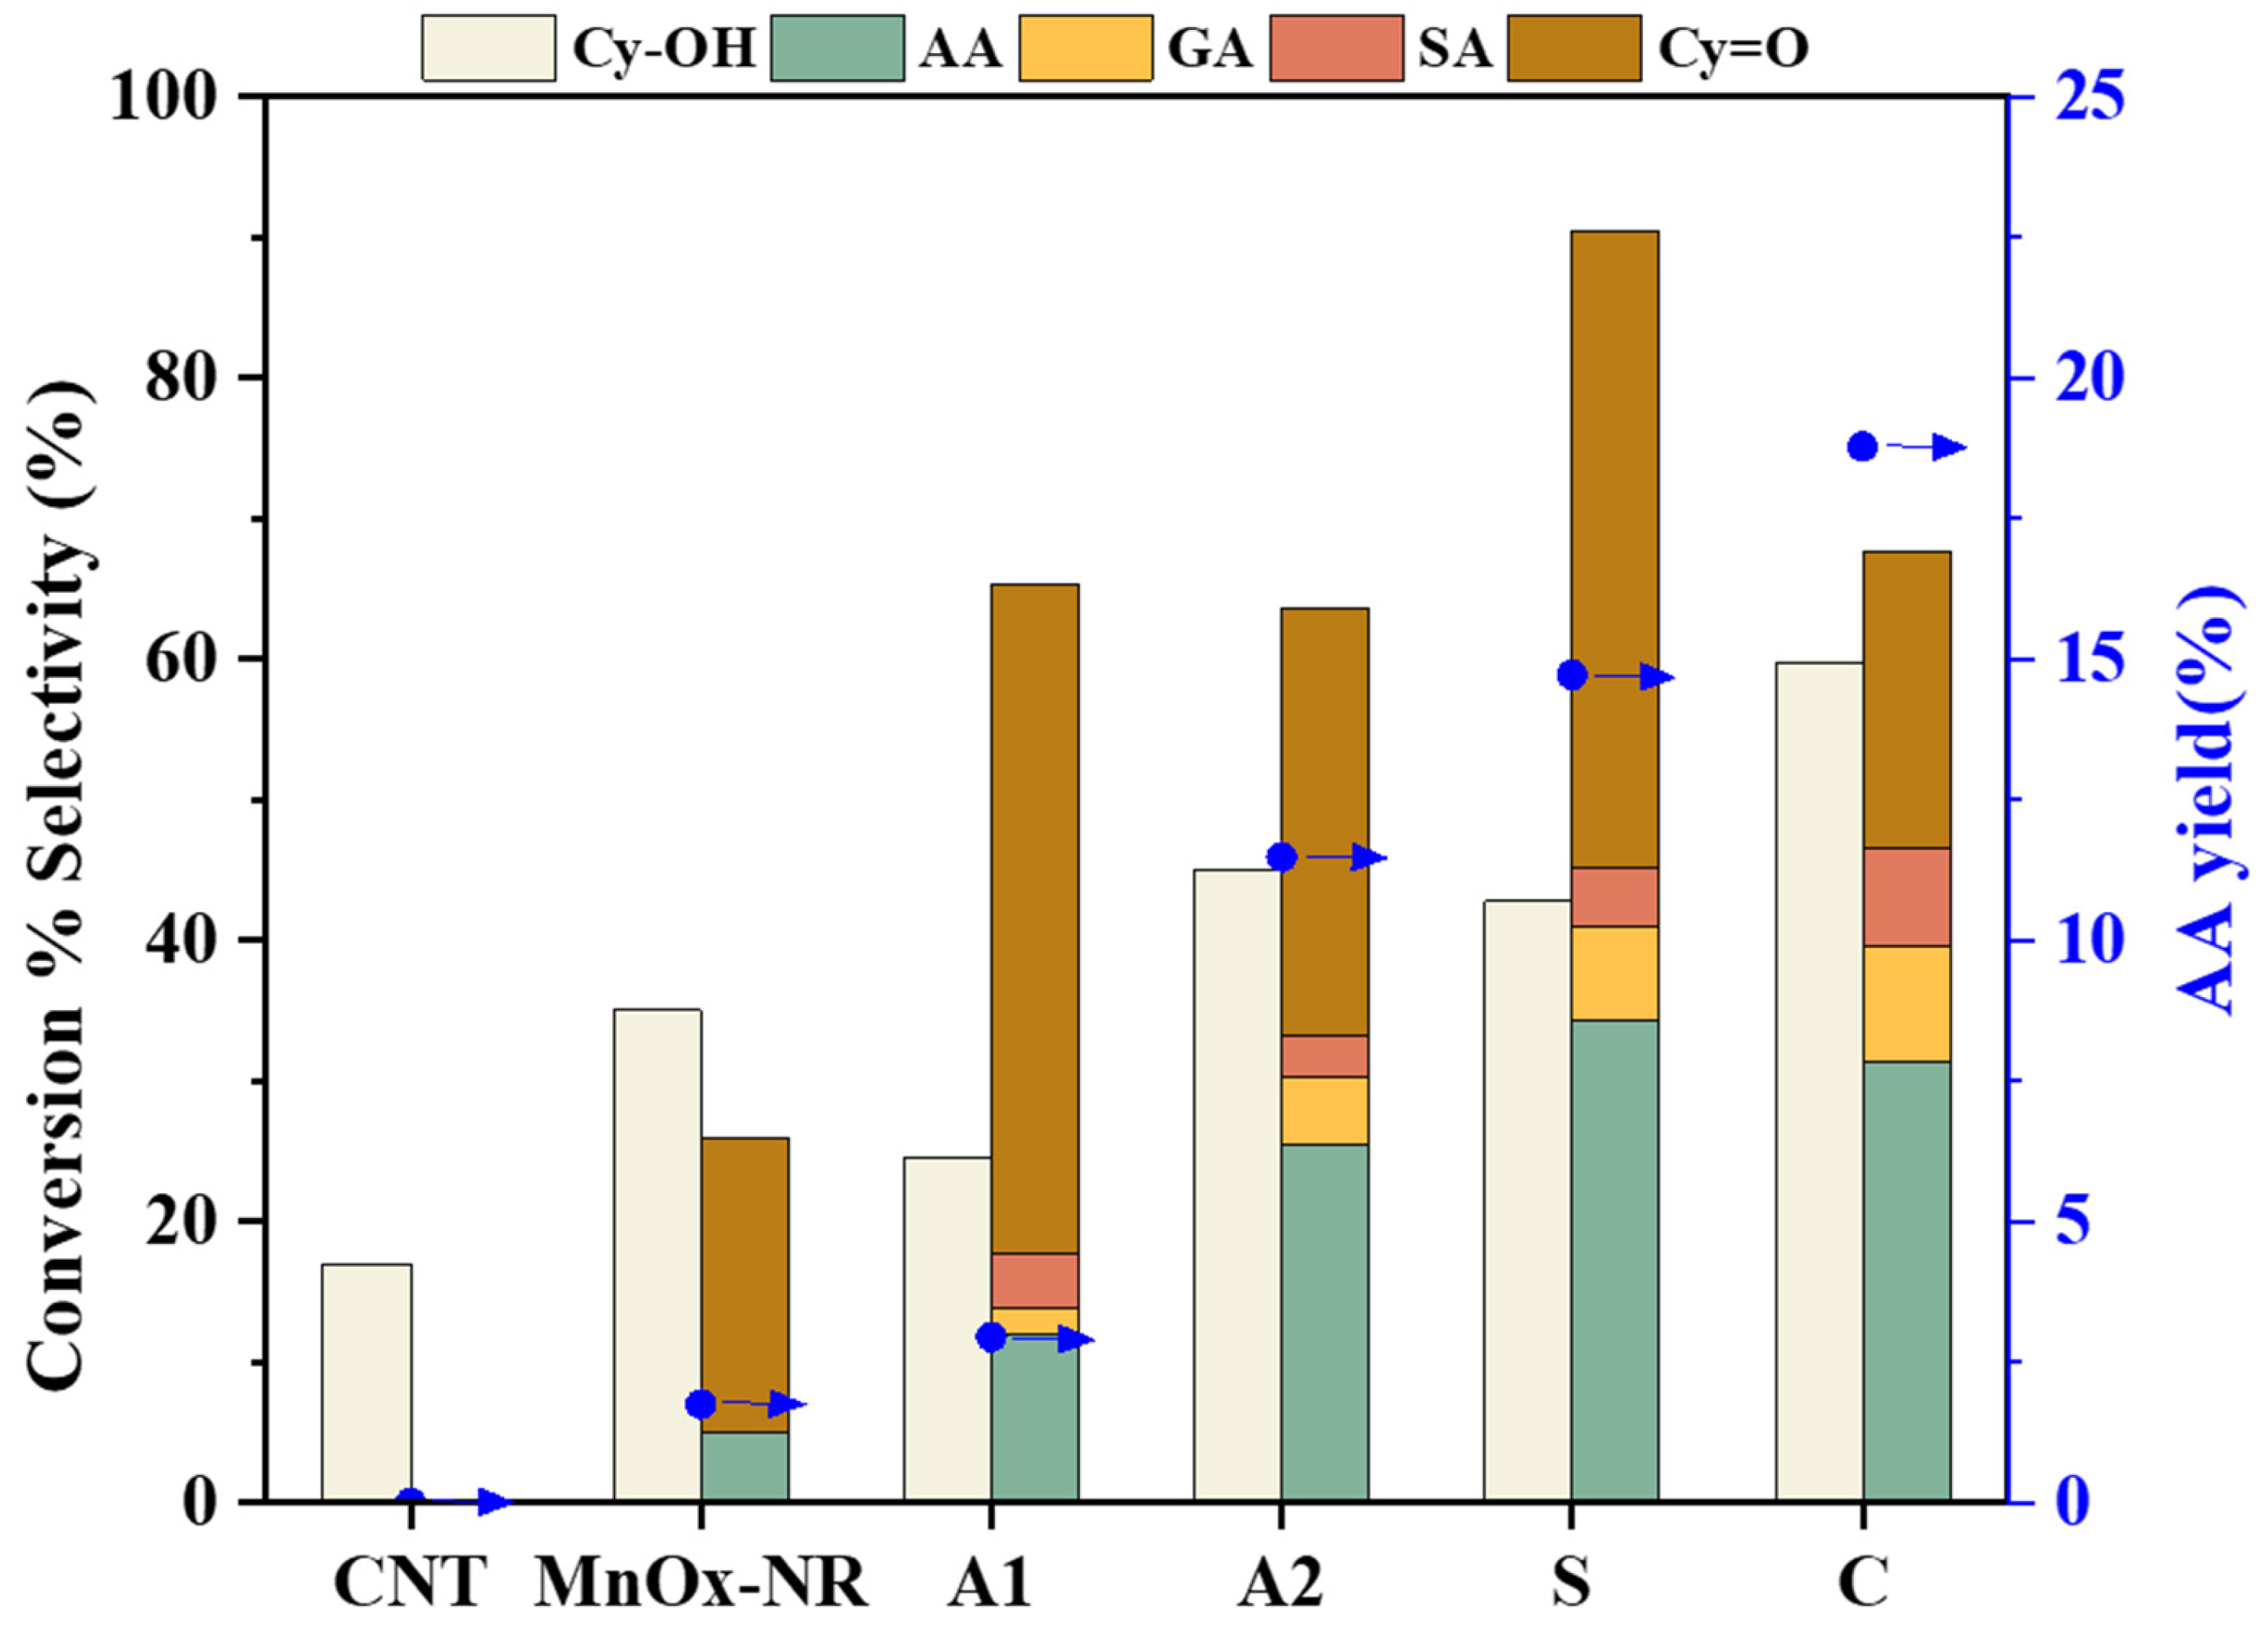
Figure 7 presents the catalytic performance of different catalysts for the electrochemical oxidation of Cy-OH. The CNT-only system exhibited no product formation, though approximately 20% substrate consumption was observed, attributed to voltage-induced polymerization. MnO
x-NR demonstrated limited catalytic activity with 33.9% Cy-OH conversion and only 1.7% AA yield, accompanied by 7% cyclohexanone (Cy=O) formation as an intermediate. In contrast, supported catalysts showed substantially enhanced performance. Notably, the MnO
x/CNT-C catalyst achieved 59.8% Cy-OH conversion and 18.8% AA yield after 24 h reaction, representing optimal catalytic efficiency. These results confirm that MnO
x supported on CNT significantly enhances the selective oxidation of Cy-OH to AA.
The catalytic performance varied significantly with synthesis methodology. Catalysts prepared via co-precipitation (A2, S, and C) exhibited superior conversion rates and AA selectivity compared to the hydrothermal-derived A1 catalyst (140 °C), which showed limited activity (25% conversion). This discrepancy may originate from structural differences: the hydrothermal method produced catalysts with well-crystallized structures and fewer surface defects, potentially reducing active site availability. The enhanced performance of supported catalysts suggests that synergistic interactions between CNT and MnOx components facilitate electron transfer processes, effectively directing the reaction pathway toward AA production.
2.3. Exploration of Reaction Mechanism
From the product distribution profile depicted in
Figure 7, the oxidative transformation pathway of Cy-OH can be mechanistically proposed. The predominant reaction pathway proceeds through sequential oxidation steps is as follows: initial conversion of Cy-OH to Cy=O), followed by subsequent oxidation to AA. A competitive side pathway involves over-oxidation and carbon chain fragmentation of AA, yielding shorter-chain dicarboxylic acids including glutaric acid (GA) and succinic acid (SA). To elucidate this mechanism, we conducted systematic kinetic measurements of the consecutive oxidation steps (Cy-OH → Cy=O and Cy=O → AA) using respective substrates over various catalysts (
Table 1). The experimental data reveal that all supported catalysts (except MnO
x-NR with notably diminished activity due to its low specific surface area of 19.92 m
2/g) maintained initial reaction rates within 50~200 mmol·g
−1·min
−1. Through comparative analysis of surface electronic configurations, MnO
x/CNT-C with the highest Mn
3+/Mn
4+ ratio (0.18) and lowest average oxidation state (AOS = 3.03) demonstrated superior catalytic activity (r
1 = 153.07 mmol·g
−1·min
−1) in the primary oxidation step [
22]. Additionally, the electrochemical behavior of each catalyst was characterized by cyclic voltammetry (CV), and the active sites and electrochemical activity of different catalysts were quantitatively analyzed based on the double-layer capacitance (Cdl).
Figure 8 shows that the Cdl value of MnO
x/CNT-C is 5.30 mF, which is significantly higher than that of other samples. This data difference further indicates that MnO
x/CNT-C has richer active sites, which can accelerate the transfer of β-hydrogen and the release of protons in the dehydrogenation reaction, while promoting the rapid transfer of electrons to the electrode to maintain the regeneration of active sites (O=Mn
3+-H → O=Mn
3+-H). In contrast, low double-layer capacitance, such as that of MnO
x/CNT-S, results in weak charge storage capacity, leading to intermediate accumulation and slow reaction. By optimizing the double-layer capacitance, the catalytic cycle efficiency can be improved, thereby increasing the generation rate and selectivity of target products such as carboxylic acids.
In the secondary oxidation stage, MnO
x/CNT-A2 and MnO
x/CNT-S catalysts with balanced adsorbed-to-lattice oxygen ratios (O
ads/O
lat ≈ 1) achieved enhanced reaction rates of 169.74 and 147.39 mmol·g
−1·min
−1, respectively. This observation aligns with Chen et al.’s findings, emphasizing the critical role of metal valence states in catalytic performance [
23]. Detailed correlation analysis between electronic parameters and catalytic activity (
Table 1) demonstrates that Mn
3+-enriched catalysts with elevated Mn
3+/Mn
4+ ratios in Mn
4+-predominant systems exhibit superior oxidative capability. The inferior performance of MnO
x/CNT-A1 can be attributed to its high crystallinity, reduced defect density, and limited active site accessibility. The optimal O
ads/O
lat ratio ≈ 1 corroborates the Mars-van Krevelen (MvK) mechanism involving lattice oxygen participation in redox cycles [
24]. These findings collectively establish that synergistic coordination between adsorbed and lattice oxygen species is crucial for achieving efficient Cy=O to AA conversion kinetics.
In situ electrochemical FTIR was employed to monitor the dynamic evolution of surface intermediates during the reaction (
Figure 9). Spectral acquisition was conducted in 0.1 M K
2SO
4 containing Cy-OH at 1.25 V applied potential over 30 min. The observed distinct enhancement bands at 1095 cm
−1 (C–O stretching), 1279 cm
−1 (C–C skeletal vibration), and 1633 cm
−1 (C=O stretching) were associated with the formation and subsequent consumption of Cy=O. Emerging characteristic peaks at 1430 cm
−1 (O–H bending) and 1518 cm
−1 (C=O stretching) corresponded to the generation of AA species. Notably, the relatively weak peak intensities suggest limited AA production efficiency under these reaction conditions. A prominent inverted absorption band at 1475 cm
−1 (C–H deformation) [
11,
15,
24] indicates substantial Cy-OH depletion. The enhanced inversion depth observed in this system implies accelerated Cy-OH consumption kinetics, potentially attributable to improved surface reactivity of the MnO
x catalyst.
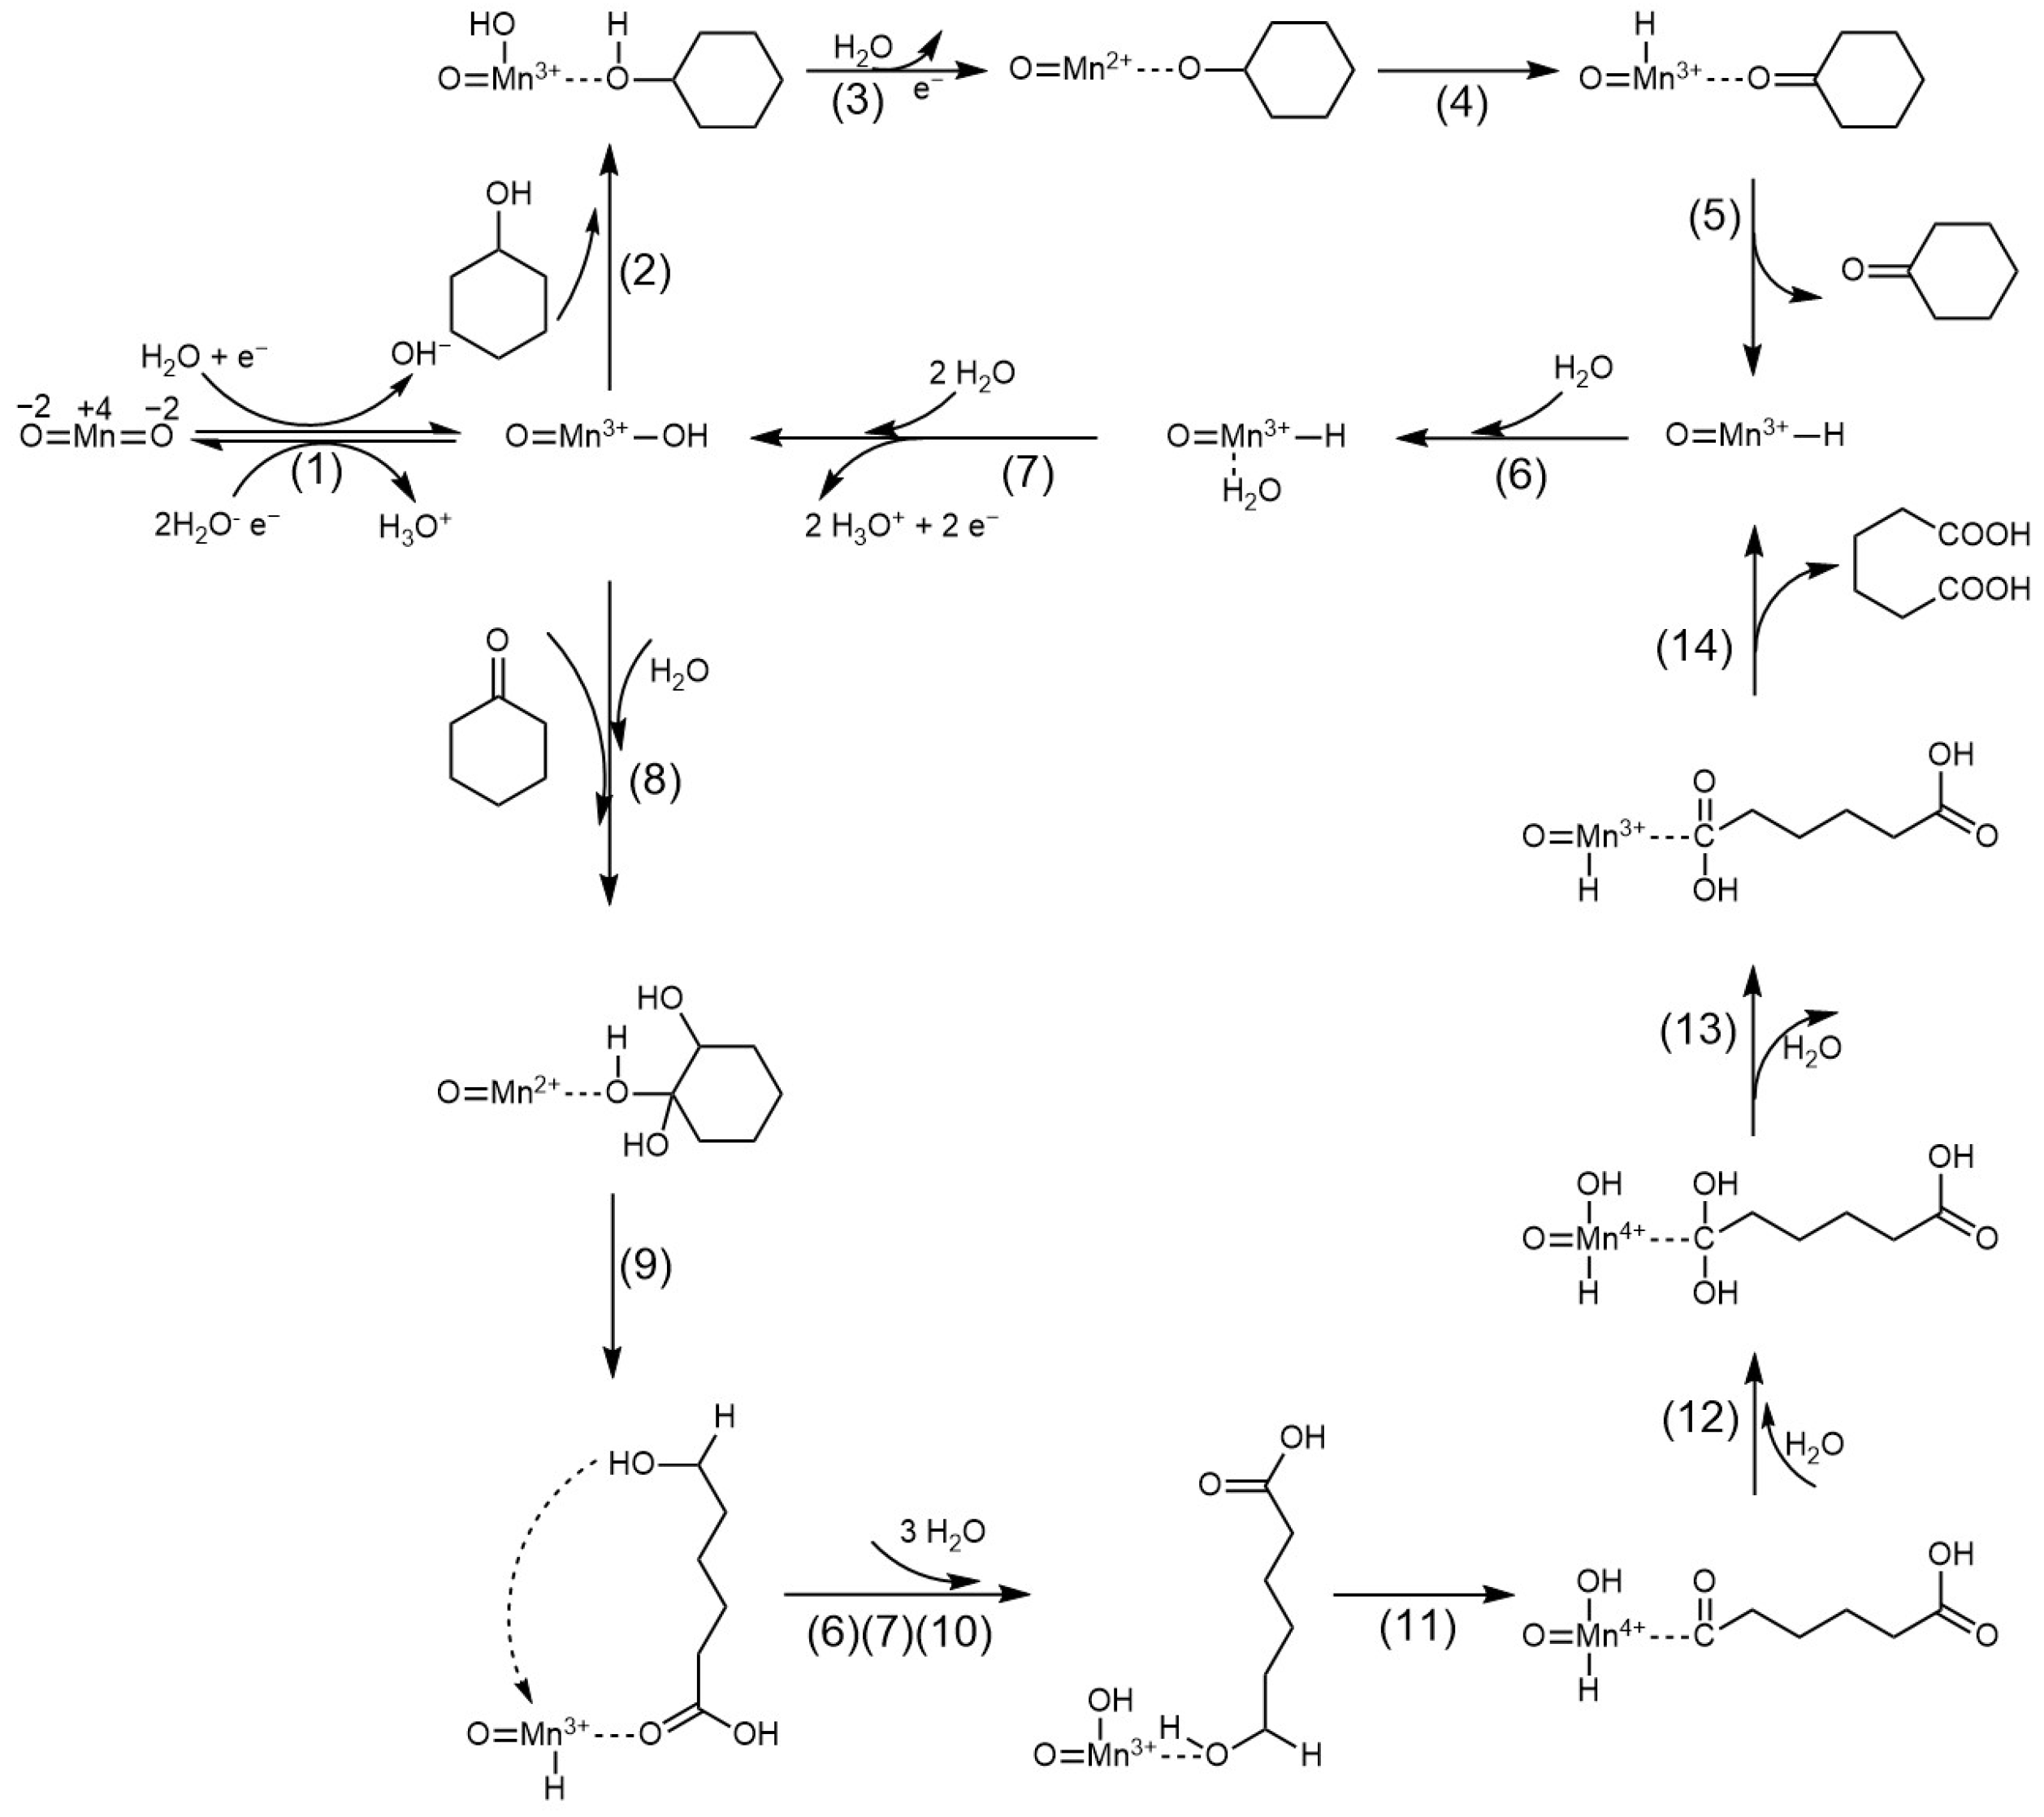
Based on established mechanistic frameworks for Ni-based catalyst [
9,
11] and the mechanism of RuO
2 electrocatalytic alcohol oxidation [
25], a dual-stage catalytic cycle is proposed for the electrocatalytic oxidation of Cy-OH to AA over MnOx catalysts (
Scheme 1). In the initial phase, the Mn
4+ catalytic center accepts an electron (e
−) from a water molecule in the electrolyte and combines with OH
− to form a surface hydroxylated species O=Mn
3+–OH (Step 1). Cyclohexanol (Cy-OH) coordinates via its hydroxyl group (–OH) to the Mn
3+ site, forming an adsorbed state that initiates dehydrogenation (Step 2). Subsequent cleavage of the O–H bond in adsorbed cyclohexanol releases a proton (H
+), which combines with the –OH group in O=Mn
3+–OH to form and liberate a water molecule. Concurrently, O=Mn
3+–OH is oxidized to an O=Mn
2+ species bound to the dehydrogenation intermediate (Step 3). The α-H of this intermediate transfers to the O=Mn
2+ site, generating O=Mn
3+–H and cyclohexanone (Cy=O) (Steps 4–5). Finally, O=Mn
3+–H undergoes hydrolysis with three water molecules to regenerate the active center O=Mn
3+–OH (Steps 6–7) [
26].
In the secondary stage, cyclohexanone first adsorbs to the O=Mn
3+–OH site and combines with H
2O to form a geminal diol (Step 8) [
26]. Simultaneously, the α-hydrogen (α-H) of cyclohexanone bonds to oxygen to generate a hydroxyl group, consuming the hydroxyl group in O=Mn
3+–OH and reducing it to an O=Mn
2+ site (Step 8) [
27]. In the presence of the geminal diol, C–C bond cleavage occurs synchronously with carboxyl and alcohol group formation (Step 9) [
28]; concurrently, one hydrogen from the geminal diol transfers to the Mn site forming O=Mn
3+–H (Step 9). O=Mn
3+–H regenerates to O=Mn
3+–OH via the mechanism in Steps 6–7. This site further adsorbs the alcohol group at the opposite terminus of the intermediate, yielding the Step 10 intermediate. This intermediate undergoes dehydrogenation analogous to Steps 3–4: alcohol group oxidation to aldehyde (Step 11), aldehyde hydration to geminal diol (Step 12), and dehydration to carboxyl group (Step 13). Ultimately, adipic acid (AA) desorbs, leaving an O=Mn
3+–H site (Step 14). During Steps 11–13, the secondary hydroxyl group (–CH(OH)–) in the linear molecule is dehydrogenated via a proton-coupled electron transfer (PCET) mechanism at the Mn
3+ site to form a carbonyl group (–C=O–), which is further oxidized to carboxyl (–COOH). O=Mn
3+–H regenerates to the initial O=Mn
3+–OH (or MnO
2) state via Steps 6, 7, and 1, completing the catalytic cycle from cyclohexanone to adipic acid.
2.4. Optimization of Reaction Conditions
The LSV profiles in
Figure 6 reveal that most of the catalysts exhibit a characteristic oxidation peak of Cy-OH at a potential of approximately 1.15 V (vs. Ag/AgCl). Therefore, taking catalyst MnO
x-CNT-A2 as an example, systematic potentiostatic electrolysis experiments (
Figure 10) were conducted to investigate the electrochemical oxidation behavior under applied potentials of 0.31 V (open circuit potential, OCP), 0.8 V, 1.0 V, 1.25 V, 1.3 V, and 1.35 V. Experimental results demonstrate that no detectable products were formed at OCP (0.31 V), while both Cy-OH conversion and AA yield showed significant enhancement with applied potential increasing from 0.8 to 1.3 V. Kinetic analysis reveals a non-monotonic dependence of Cy-OH conversion on potential, initially increasing then decreasing, whereas AA selectivity stabilized after reaching a plateau value. This confirms the critical role of working potential in regulating substrate conversion. Notably, at the optimized potential of 1.25 V, the system achieved superior synergistic performance: Cy-OH conversion exceeded 40% with concomitant AA yield of 12% and selectivity of 25%. When the potential increased to 1.30 V, although Cy-OH conversion improved to ~60%, the carbon mass balance significantly decreased from 90% to 75%, indicating the activation of parasitic reaction pathways. Further elevation to 1.35 V unexpectedly reduced Cy-OH conversion to 50%, likely due to competing oxygen evolution reactions at the catalyst surface under excessive potentials. Comprehensive evaluation suggests that 1.25 V represents the optimal working potential, effectively balancing reaction efficiency with suppression of side reactions in this electrocatalytic system.
The temperature-dependent electrochemical oxidation performance of Cy-OH over MnO
x/CNT-A2 catalyst was systematically investigated at 1.25 V applied potential across four temperatures (45 °C, 60 °C, 80 °C, and 90 °C), as illustrated in
Figure 11. Initial experiments revealed limited conversion efficiencies of 12.1% and 15.8% at 45 °C and 60 °C, respectively. Notably, the target product AA first emerged at 60 °C, though with a modest yield of 1.7%. Both conversion efficiency and product selectivity exhibited positive temperature dependence, while the carbon balance demonstrated an inverse correlation with temperature elevation. This carbon loss principally originated from two pathways: (1) enhanced formation of dicarboxylic acid byproducts (SA and GA), and (2) concentration-driven oligomerization/polymerization of reaction products. At 90 °C, despite achieving a substantial conversion rate of 70.3%, the carbon balance significantly deteriorated to 66.6%, likely attributable to thermal cleavage of C–C bonds. Comprehensive analysis of the data suggests 80 °C as the optimal reaction temperature, balancing a 45% conversion rate with 11.5% AA yield while maintaining 85.3% carbon balance.
Figure 12 illustrates the temporal evolution of Cy-OH conversion and product distribution under optimized conditions (80 °C, 1.25 V, 40 mg catalyst). The Cy-OH conversion exhibited a monotonic increase until complete substrate depletion. Notably, approximately 95% of Cy-OH was rapidly consumed within the initial 9 h period. The intermediate product cyclohexanone (Cy=O) displayed characteristic volcano-type behavior, reaching maximum yield before subsequent depletion to form AA, SA, or GA. The target product AA achieved peak yield (56.4%) at 15 h reaction time, followed by a gradual decline potentially attributed to concentration-dependent polymerization phenomena. Mechanistic analysis suggests an eight-electron transfer process during the reaction. The calculated FE reached 94.5% at the 15 h timepoint.
After the completion of the catalytic reaction, the morphology of the catalyst was characterized. The TEM and HRTEM images (
Figure S3) reveal that the overall morphology and dispersion of MnO
X nanoparticles on the CNT support remain largely unchanged after the reaction, indicating good structural stability under the applied electrochemical conditions.
Figure S4 shows the XPS spectra of Mn 2p, Mn 3s, and O 1s core levels for the invested catalysts after the electrocatalytic oxidation reaction. Through comparison, it can be found that the peak positions of each main peak basically remain unchanged. It indicates that each catalyst remains relatively stable. Calculations (
Table S1) show that Mn
3+/Mn
4+ has significantly increased, except for MnOX/CNT-A1. Catalysts with a higher Mn
3+/Mn
4+ ratio are more favorable for the alcohol oxidation stage. Each catalyst exposes more active sites, leading to an accelerated electron transfer rate and an increased reaction rate, which is beneficial for the progression of the catalytic reaction. This corresponds to the increase in their AOS (average oxidation state) values. For MnOX/CNT-A1, it may be related to its catalyst preparation method. The catalyst MnOX/CNT-A1 prepared by the hydrothermal method has a good crystalline structure and fewer surface defects, which may reduce the availability of active sites.


 ,
, 


