

The Application of Box–Behnken Design for Investigating the Supercritical CO2 Foaming Process: A Case Study of Thermoplastic Polyurethane 85A


Abstract
1. Introduction
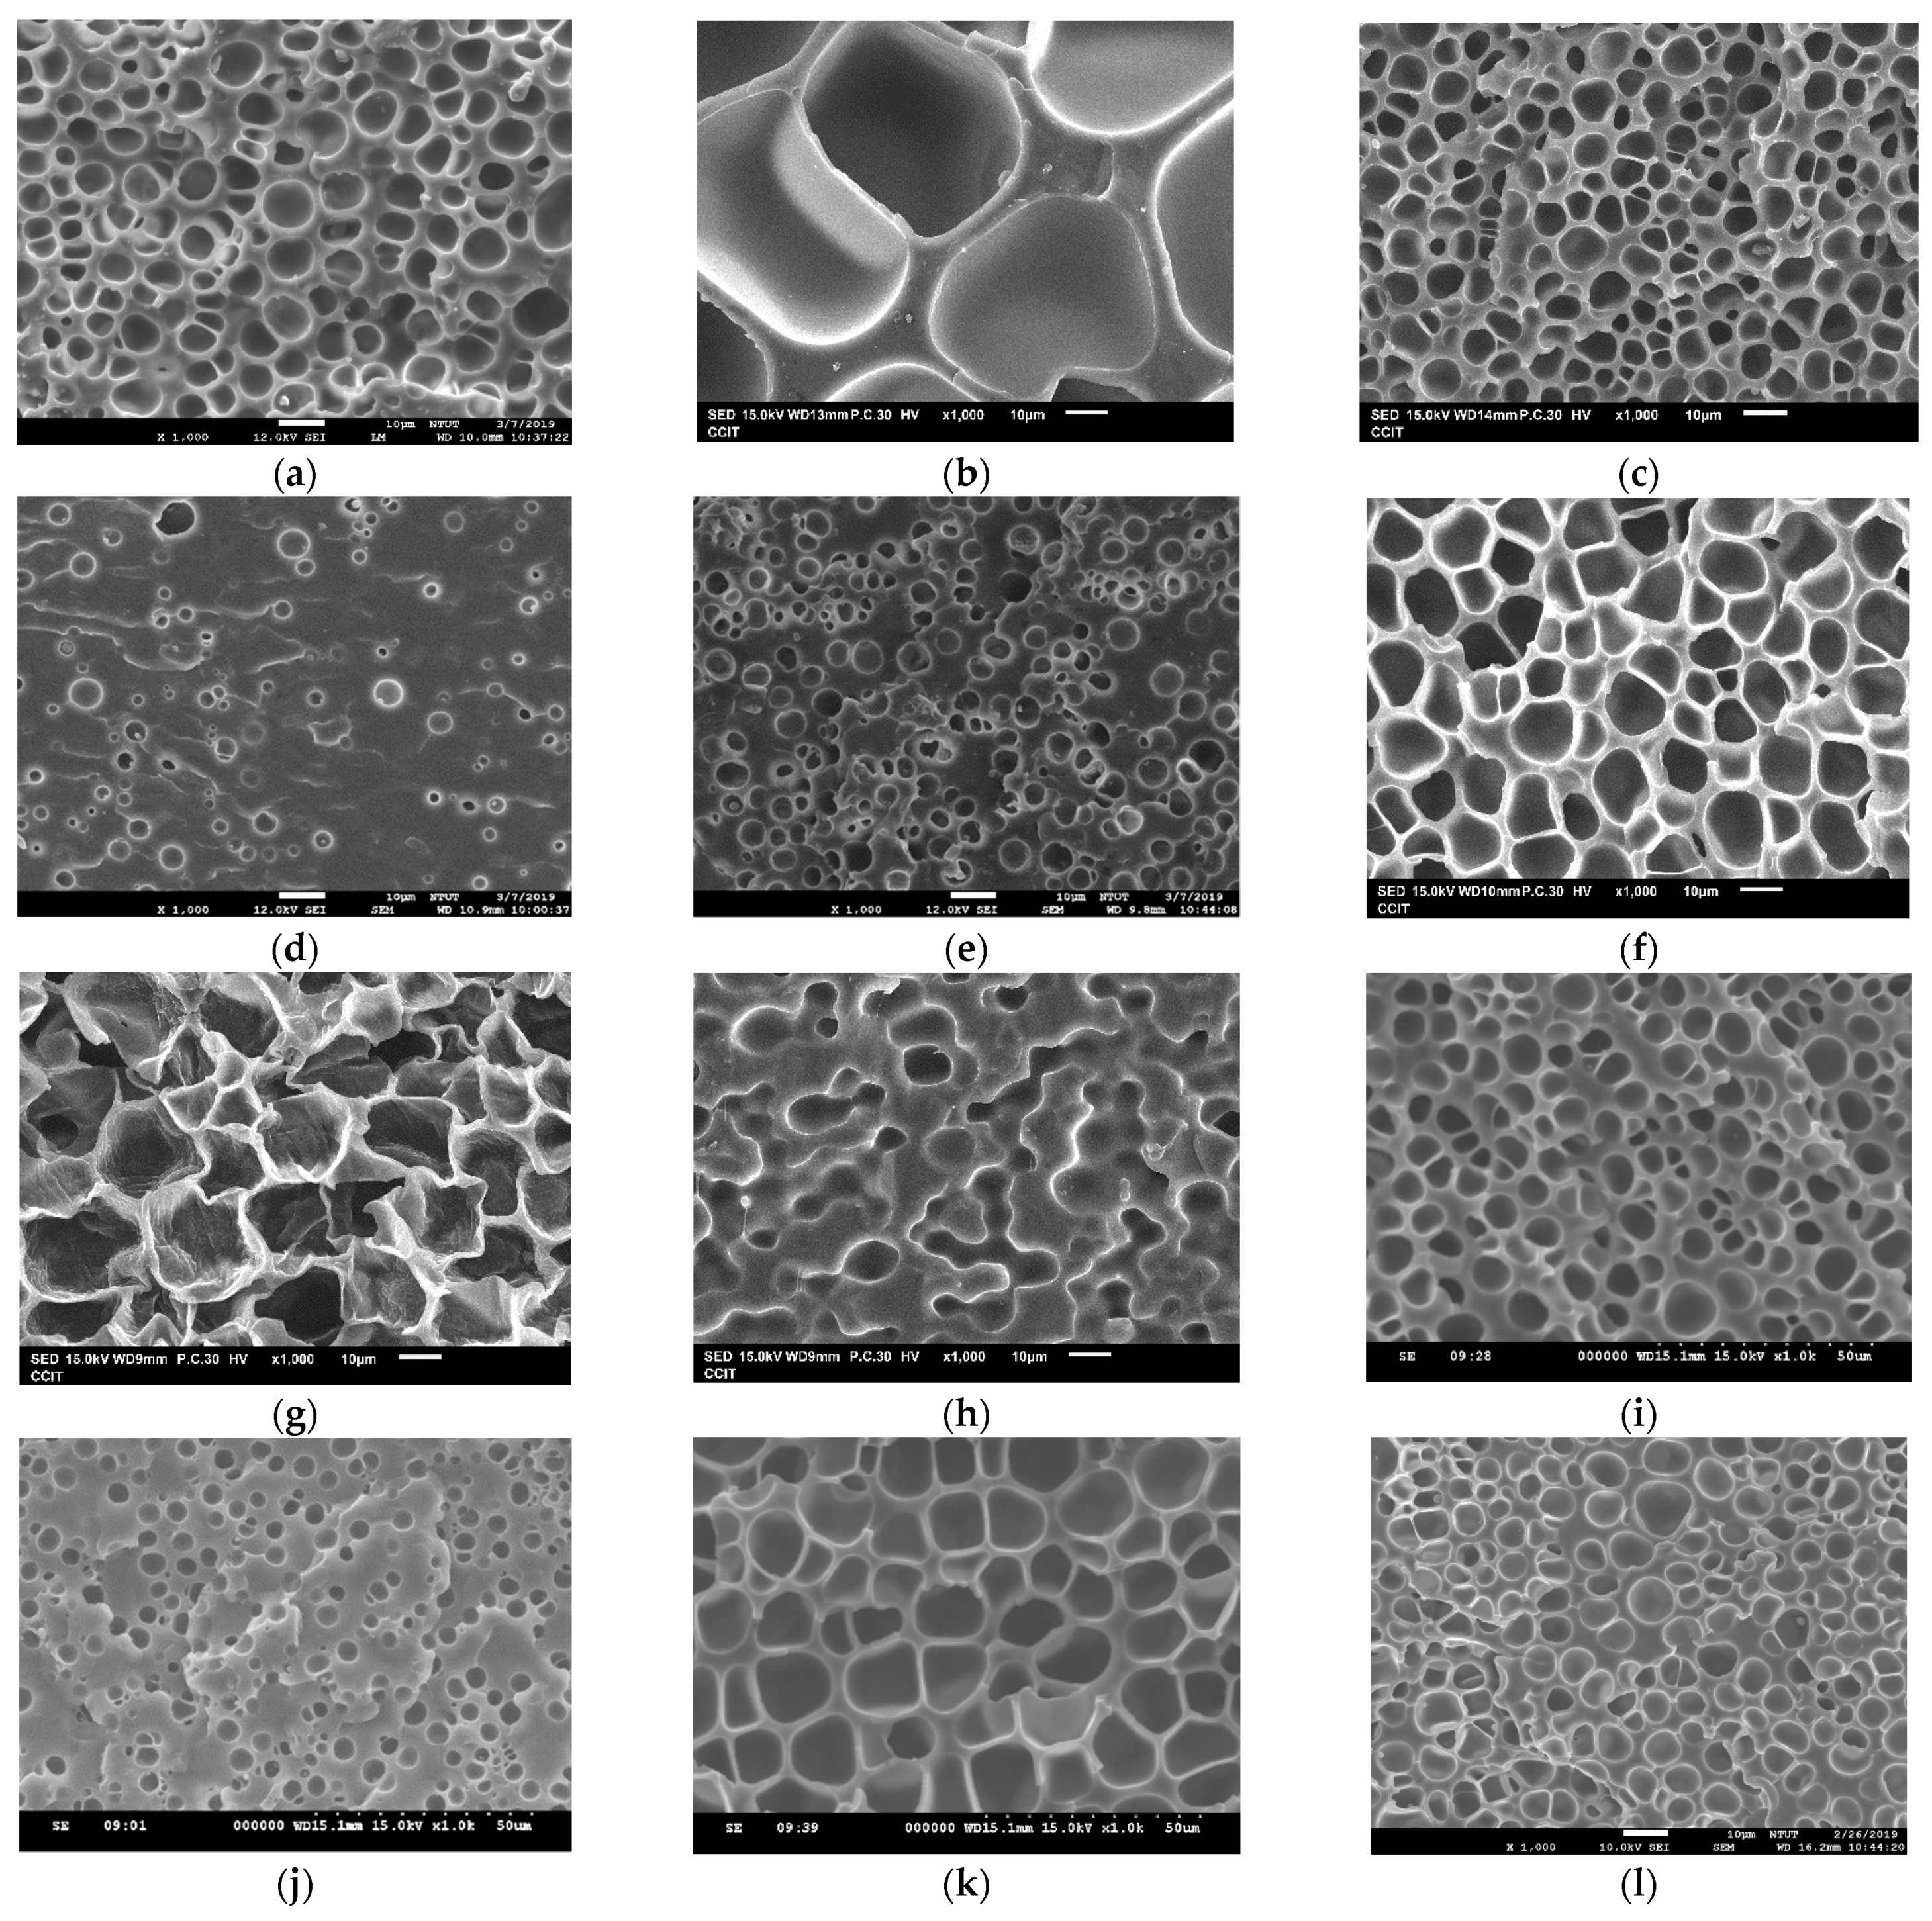
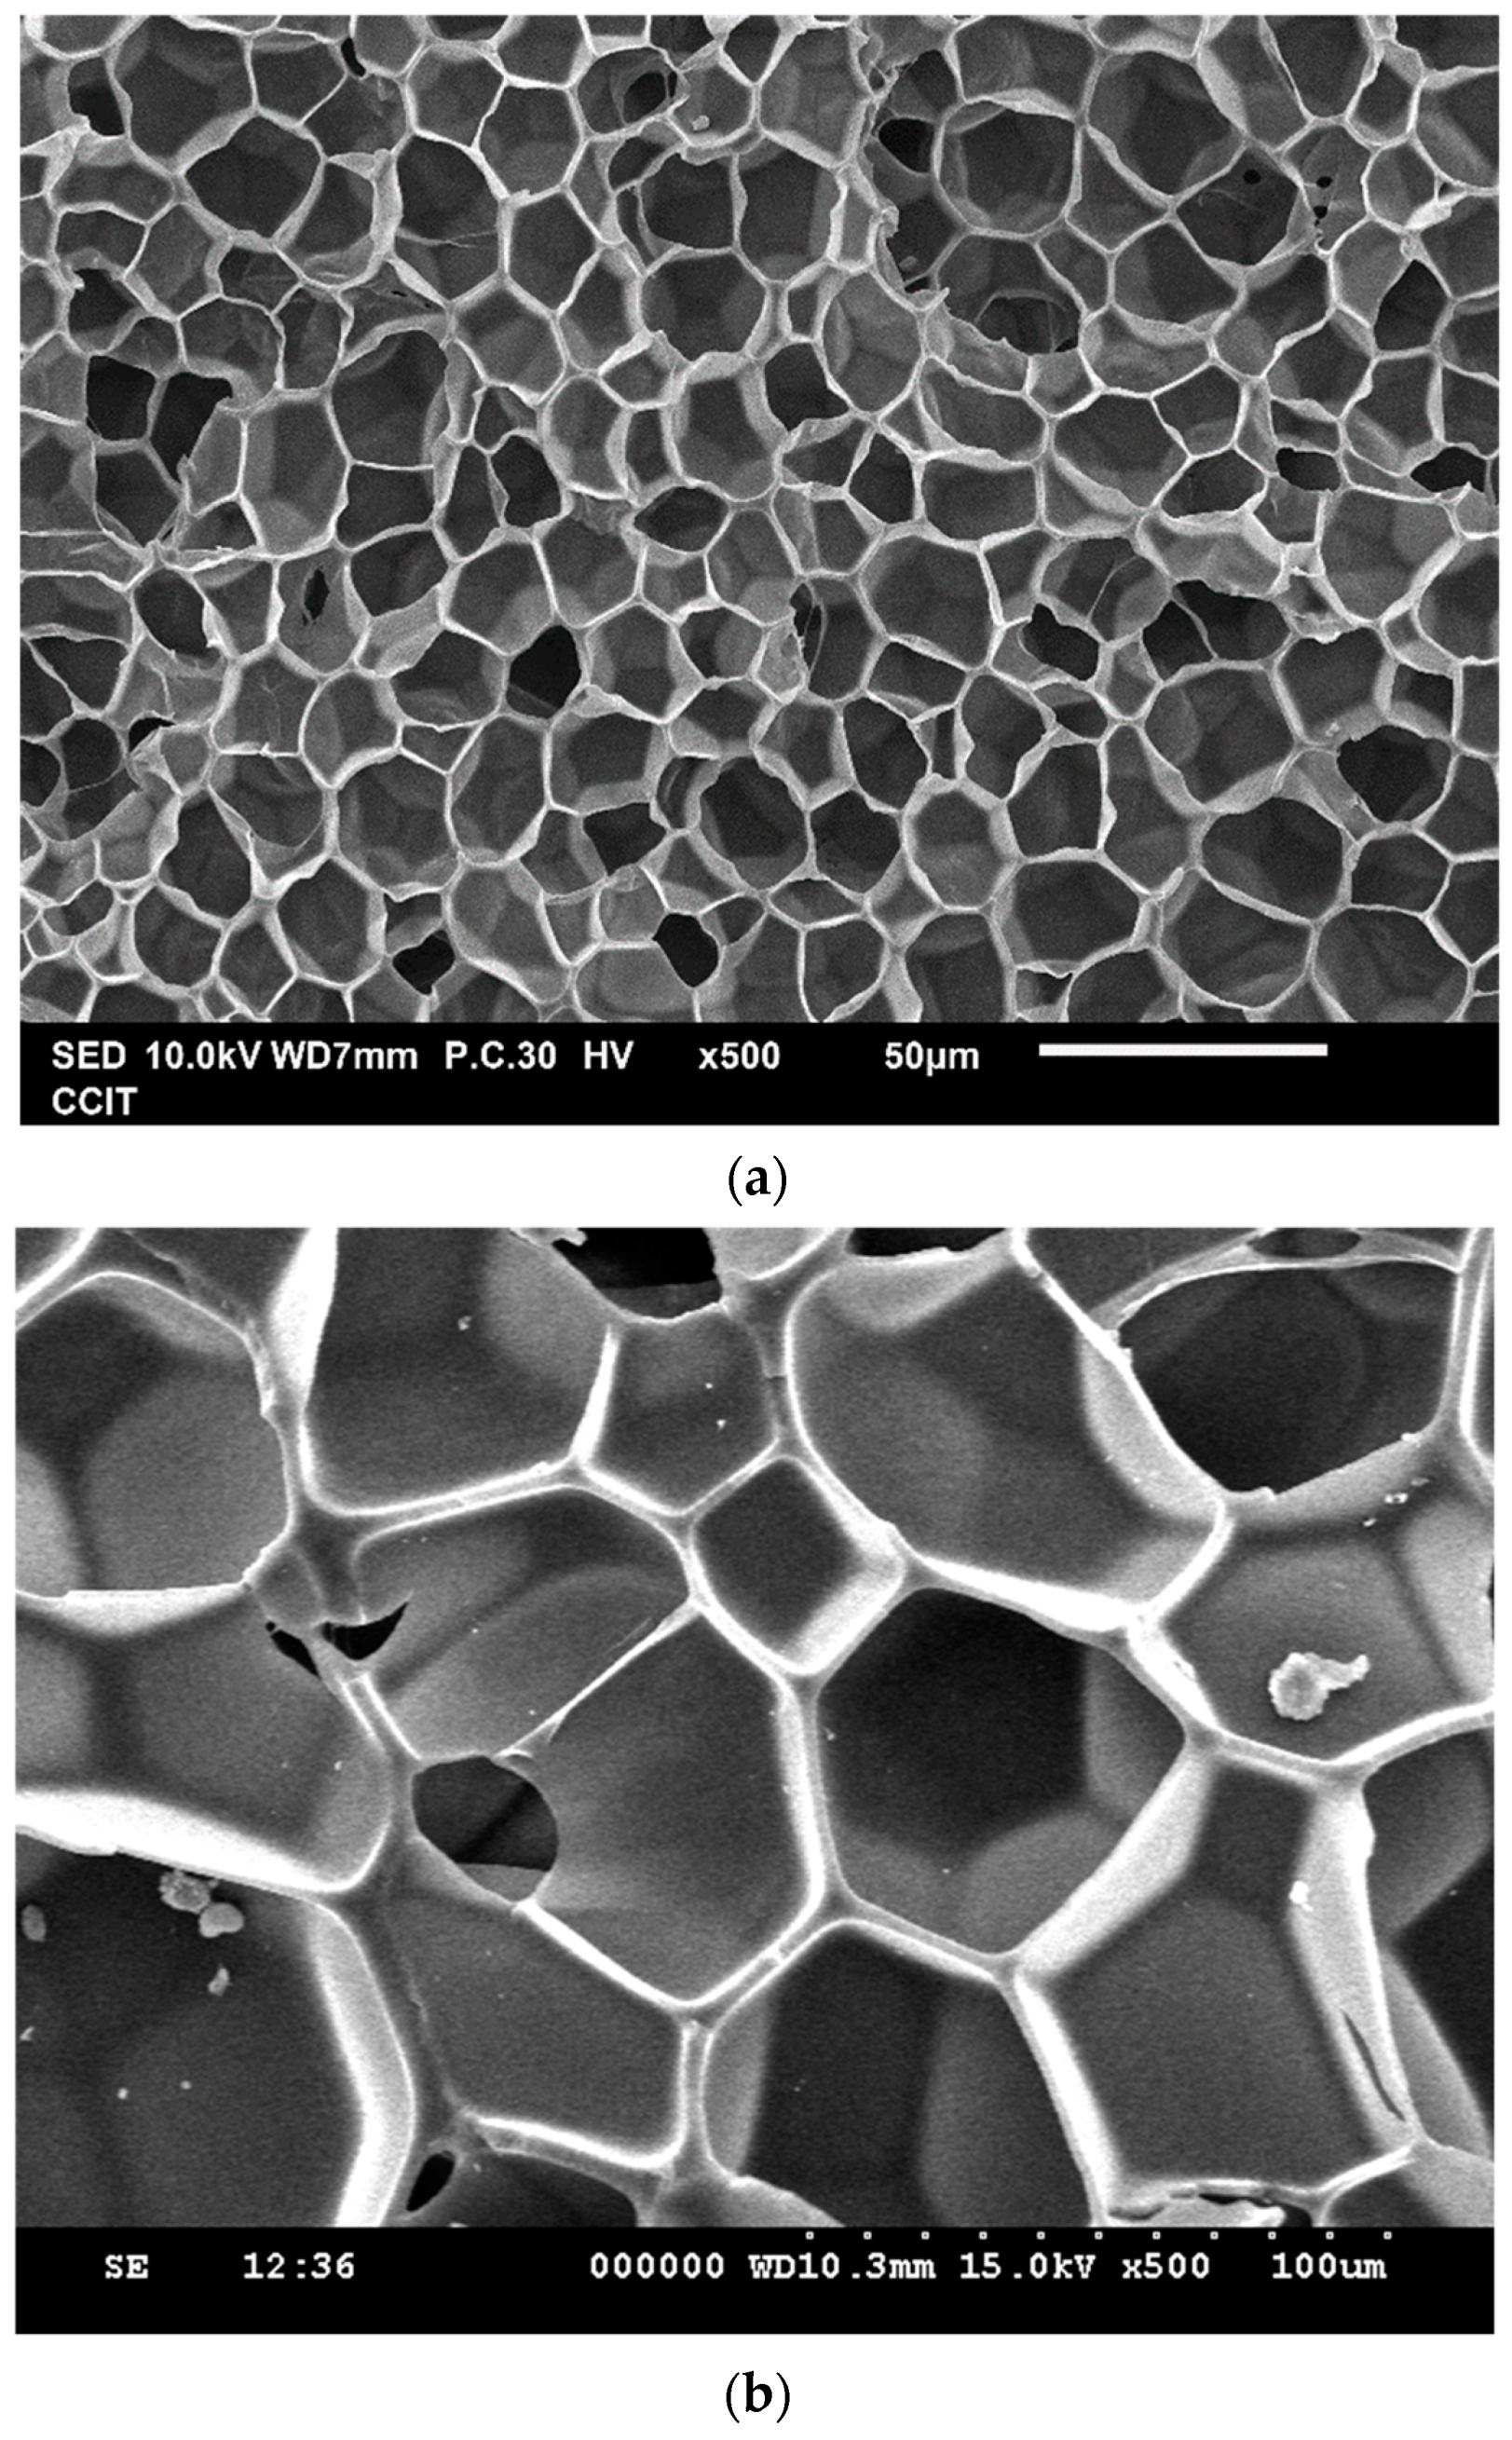
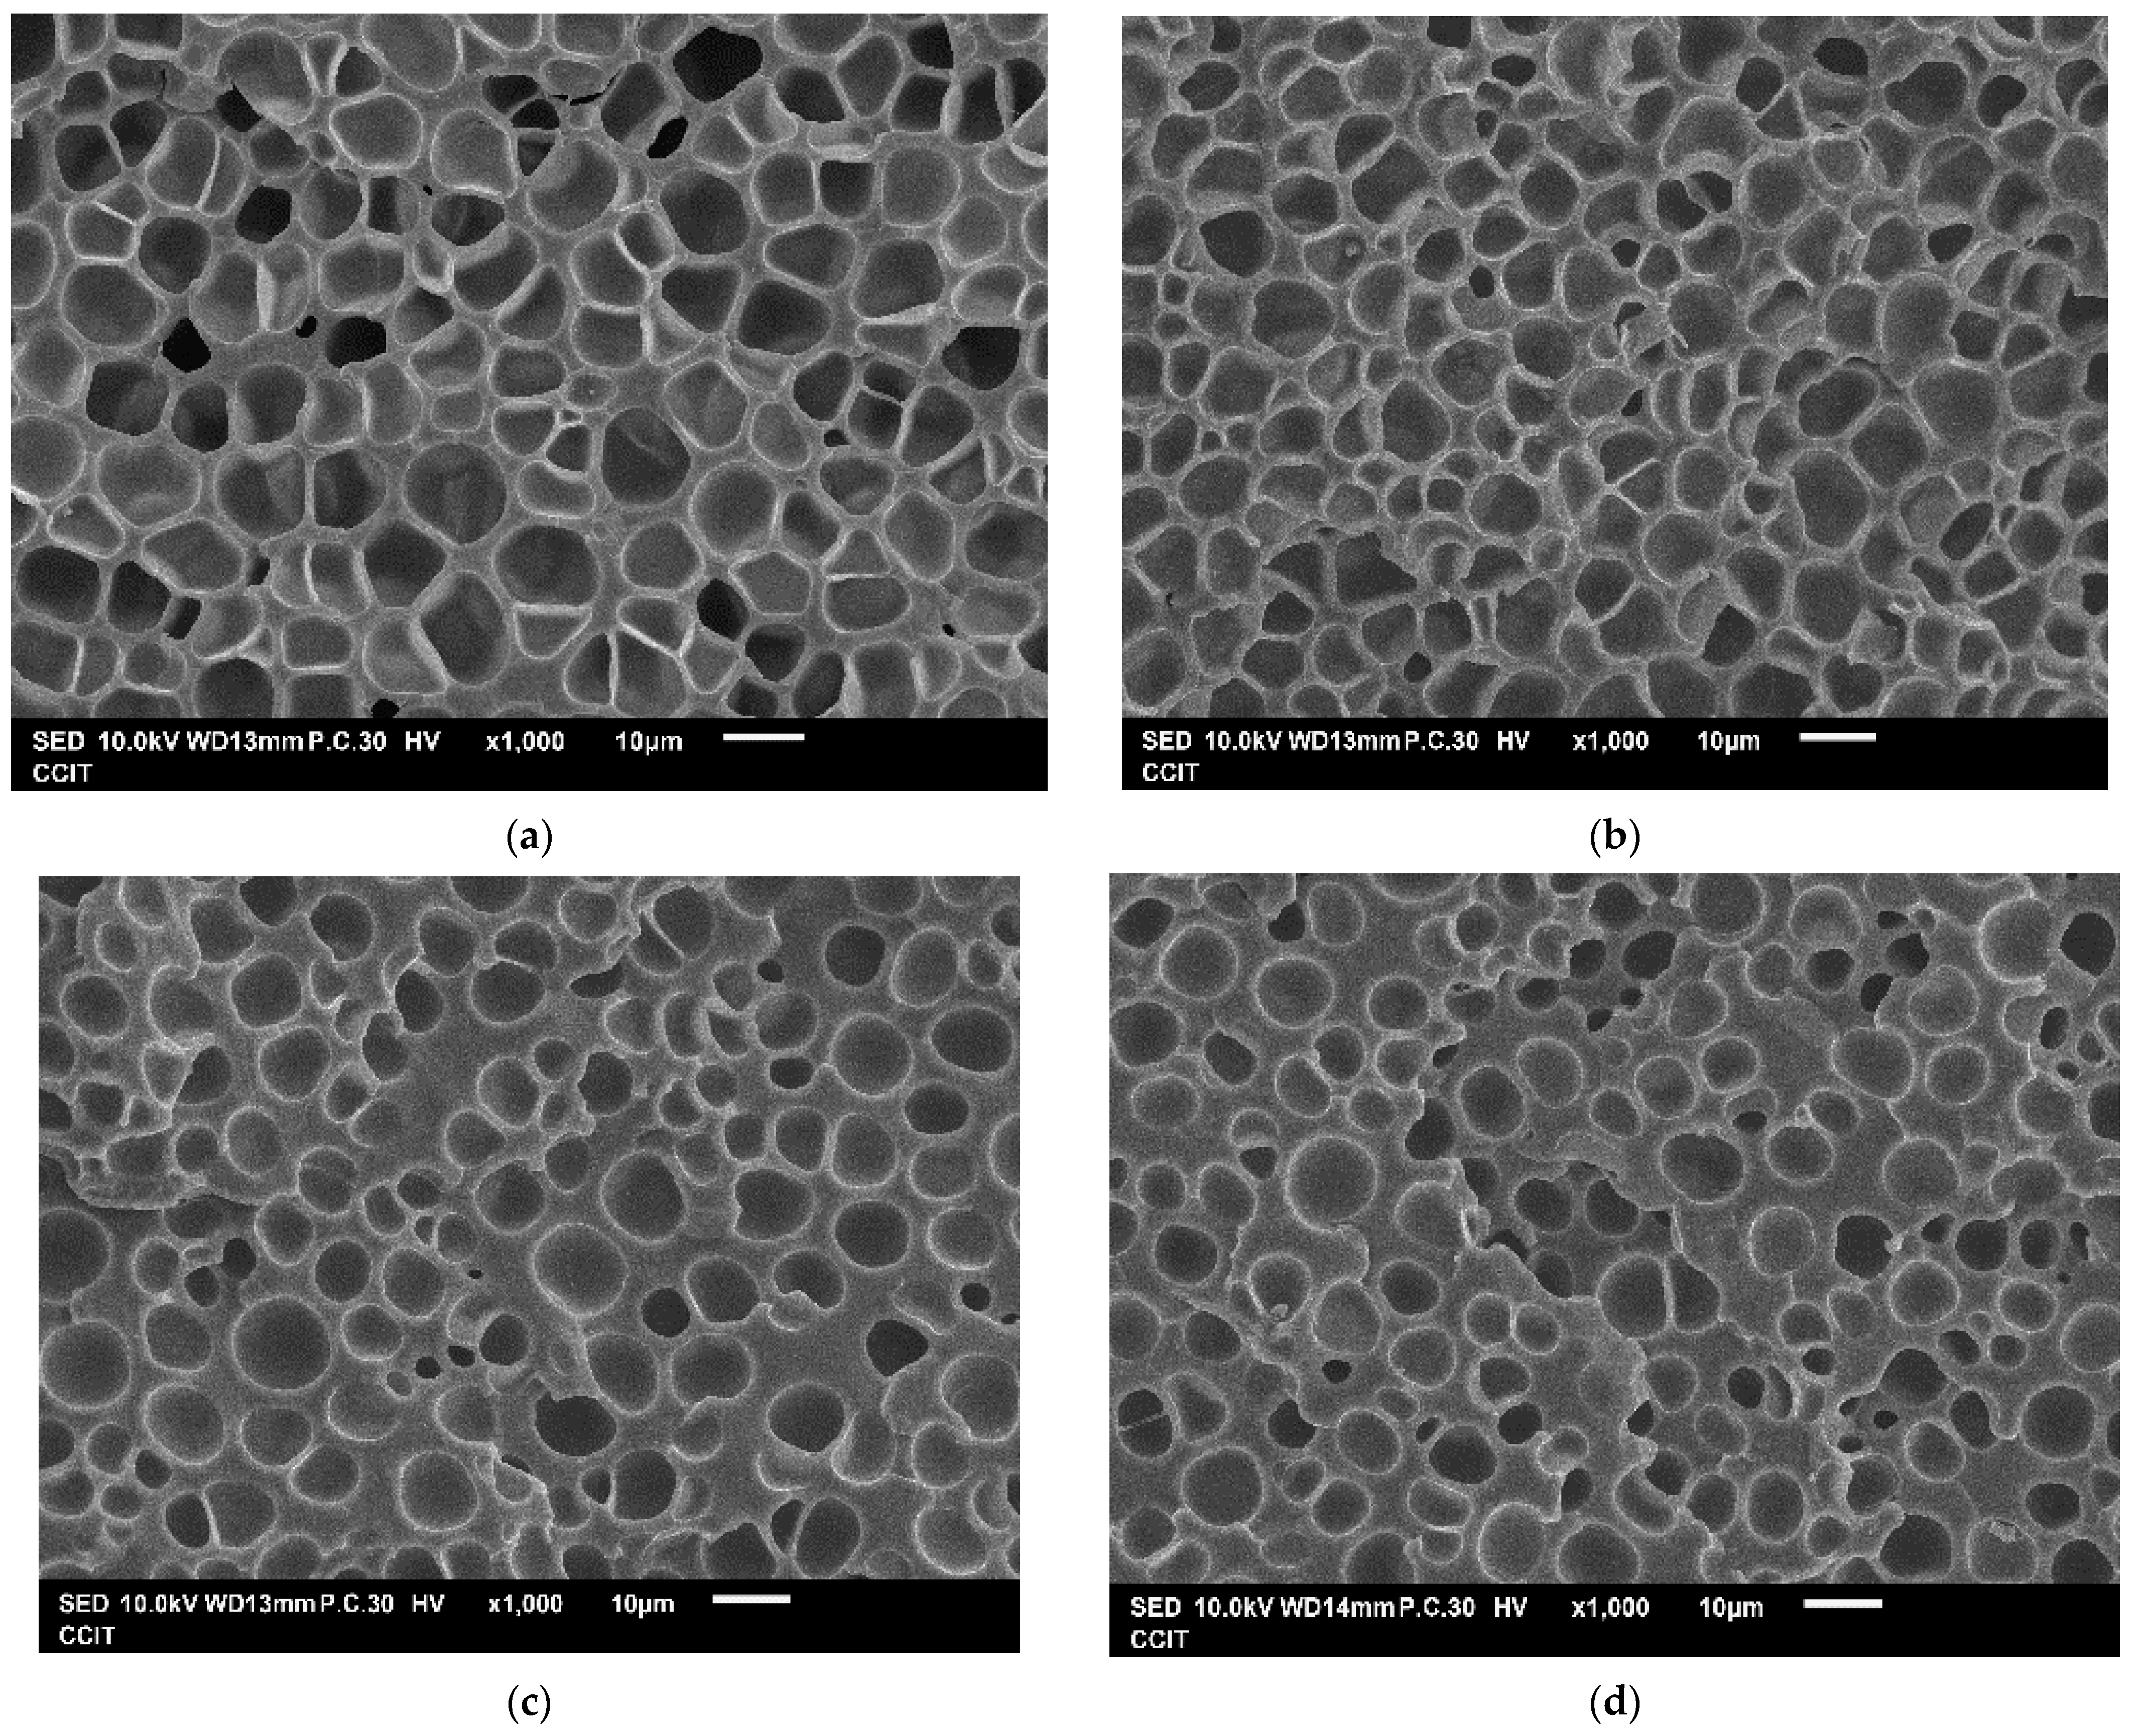
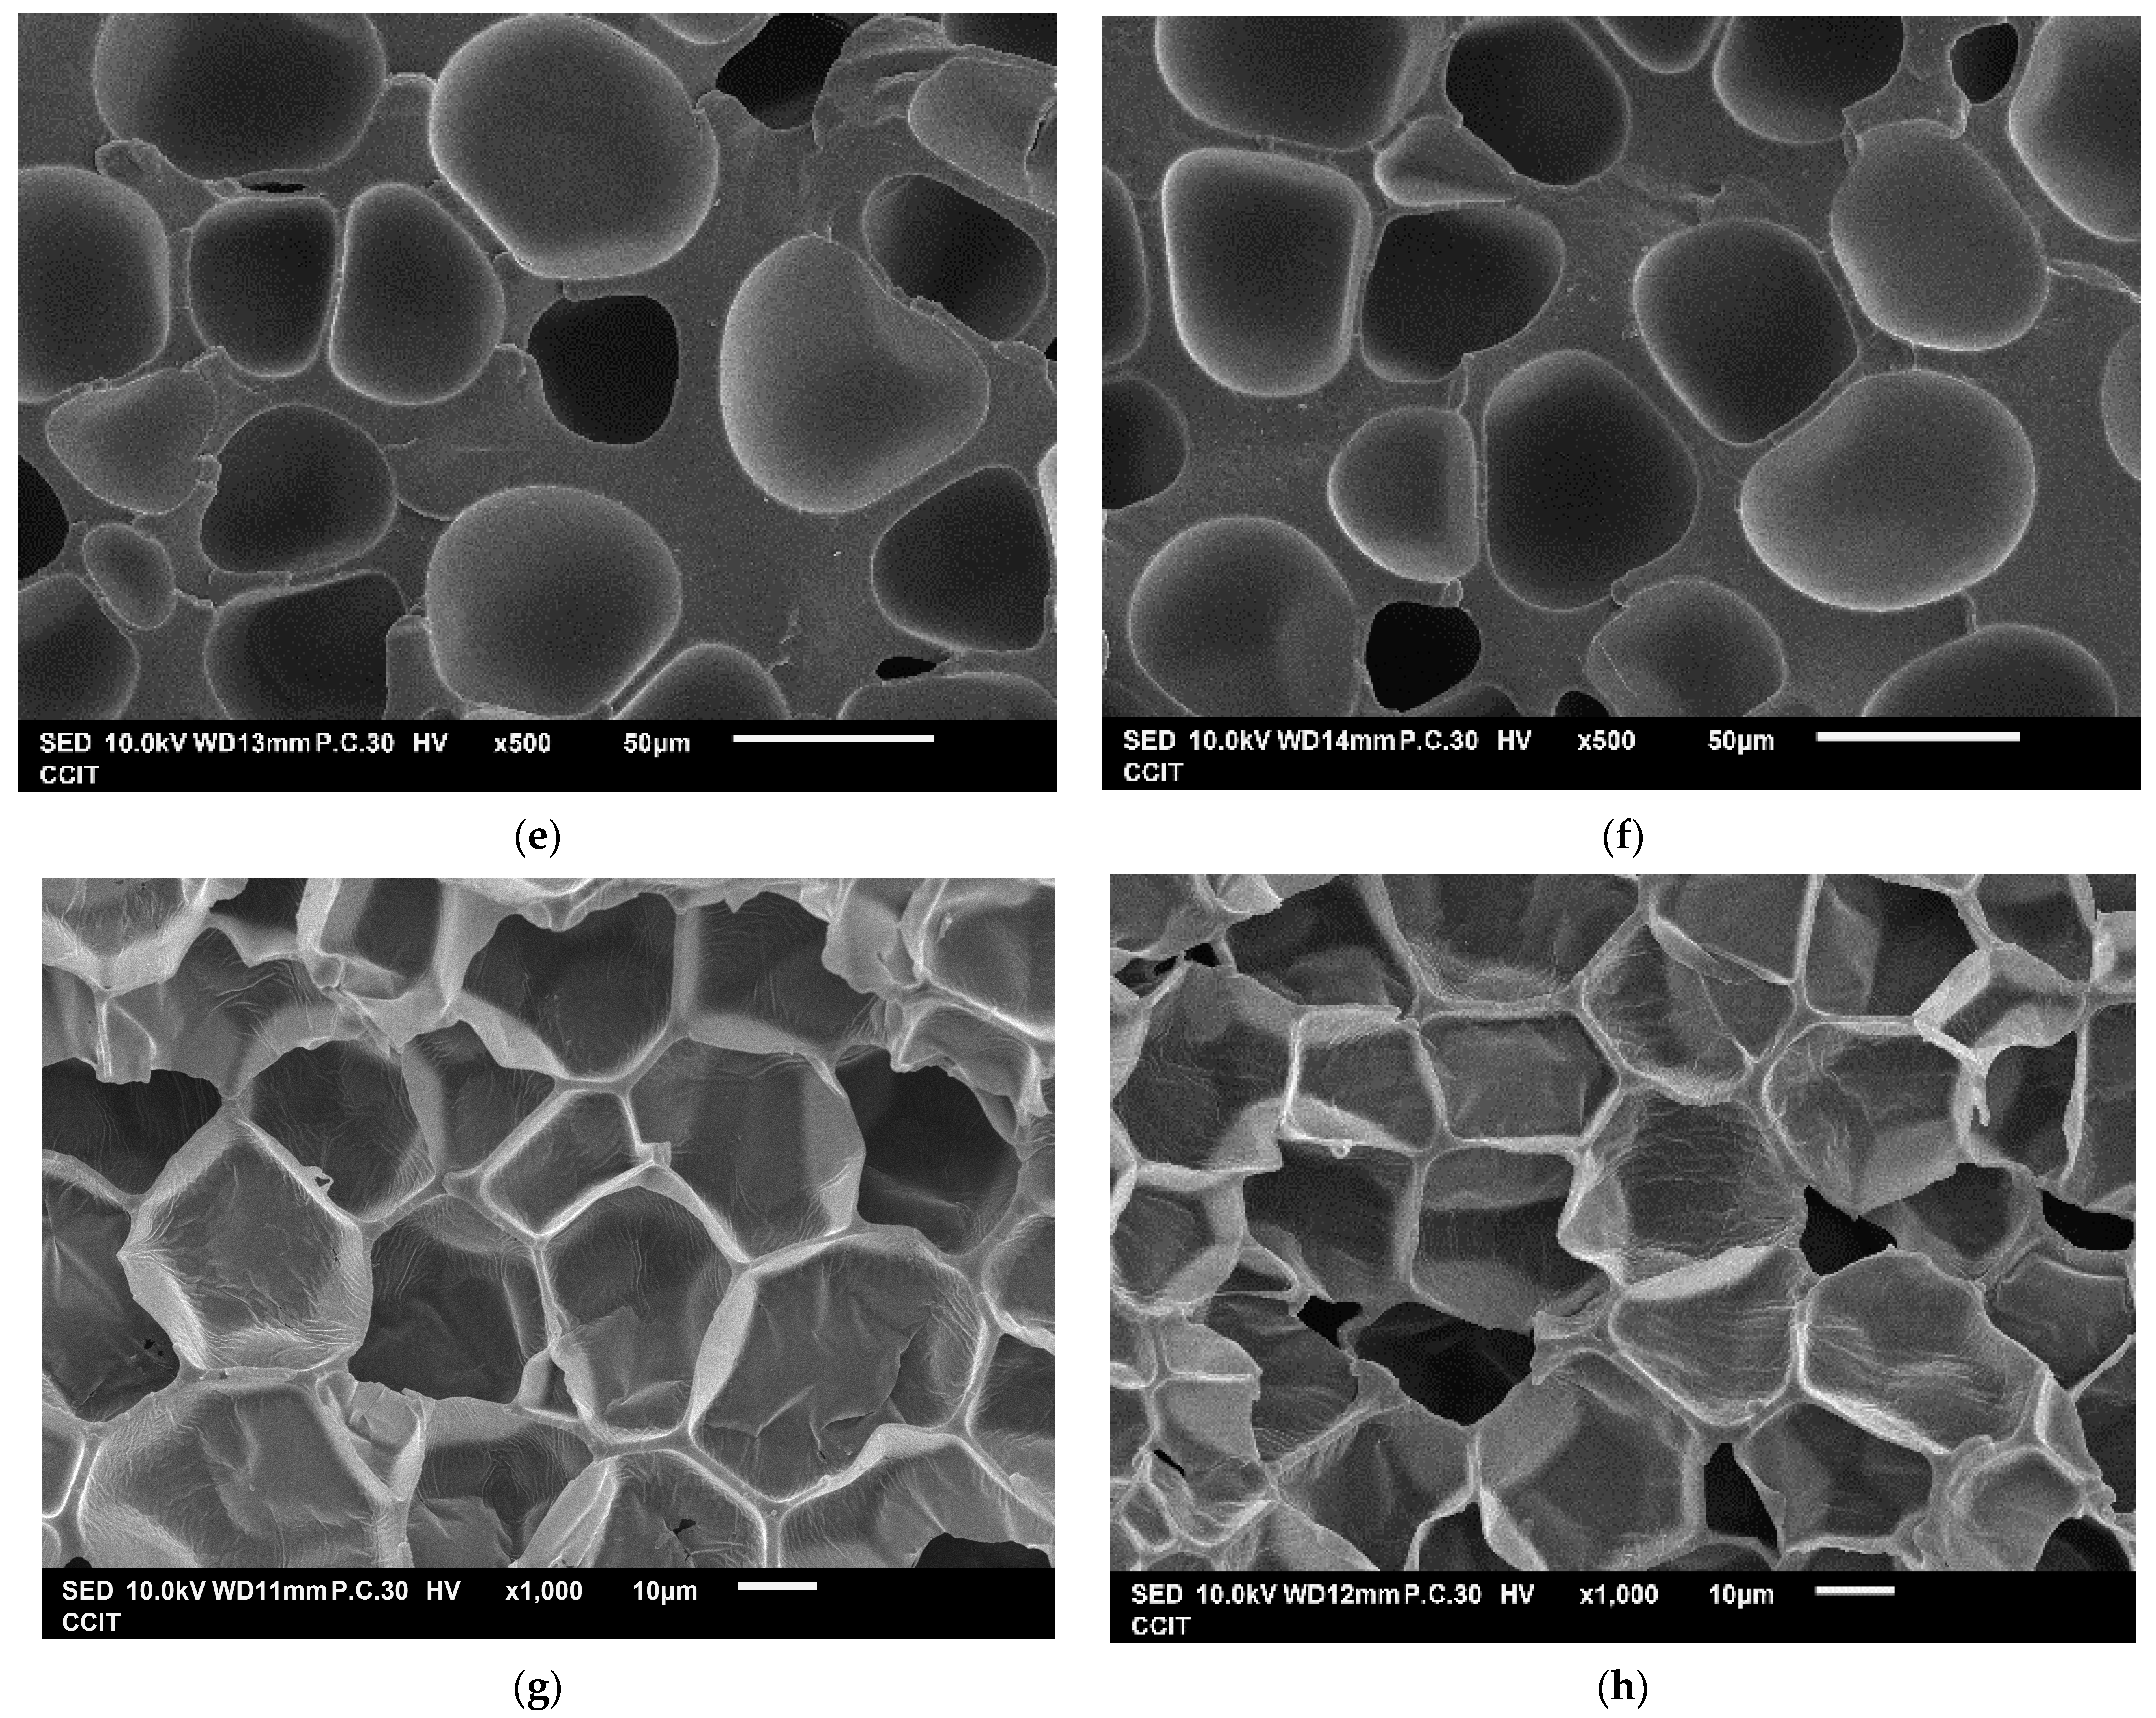
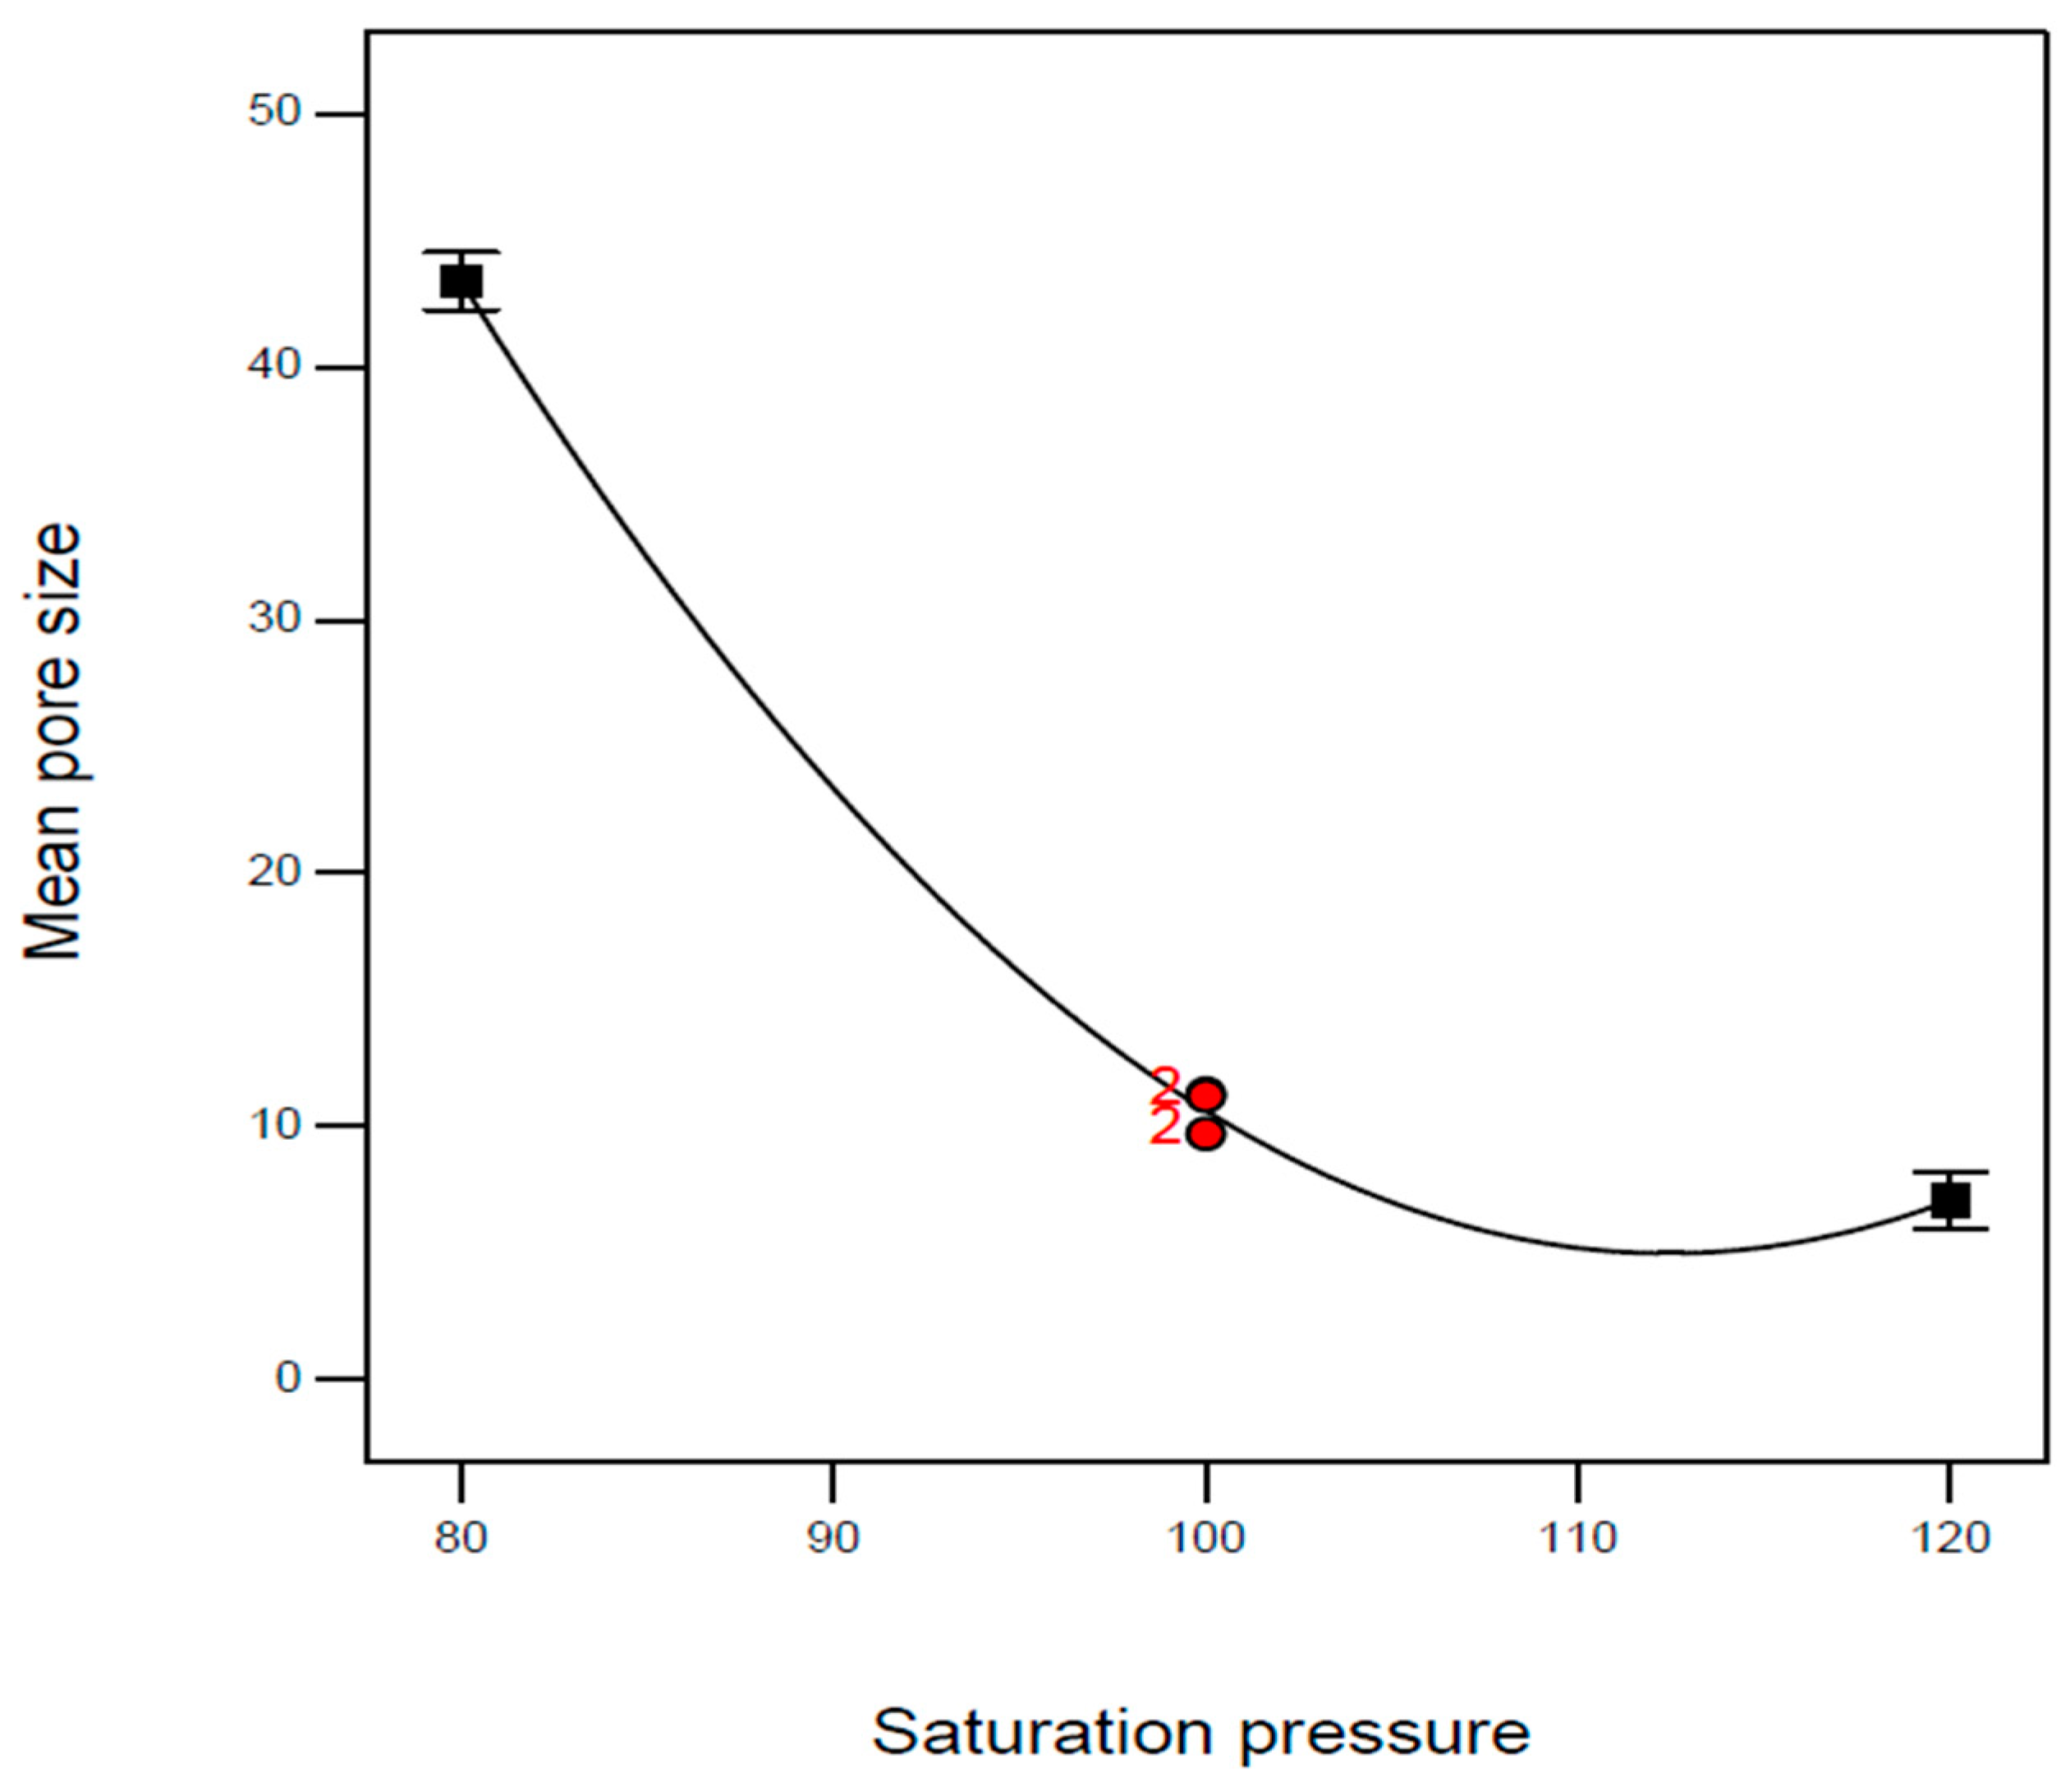
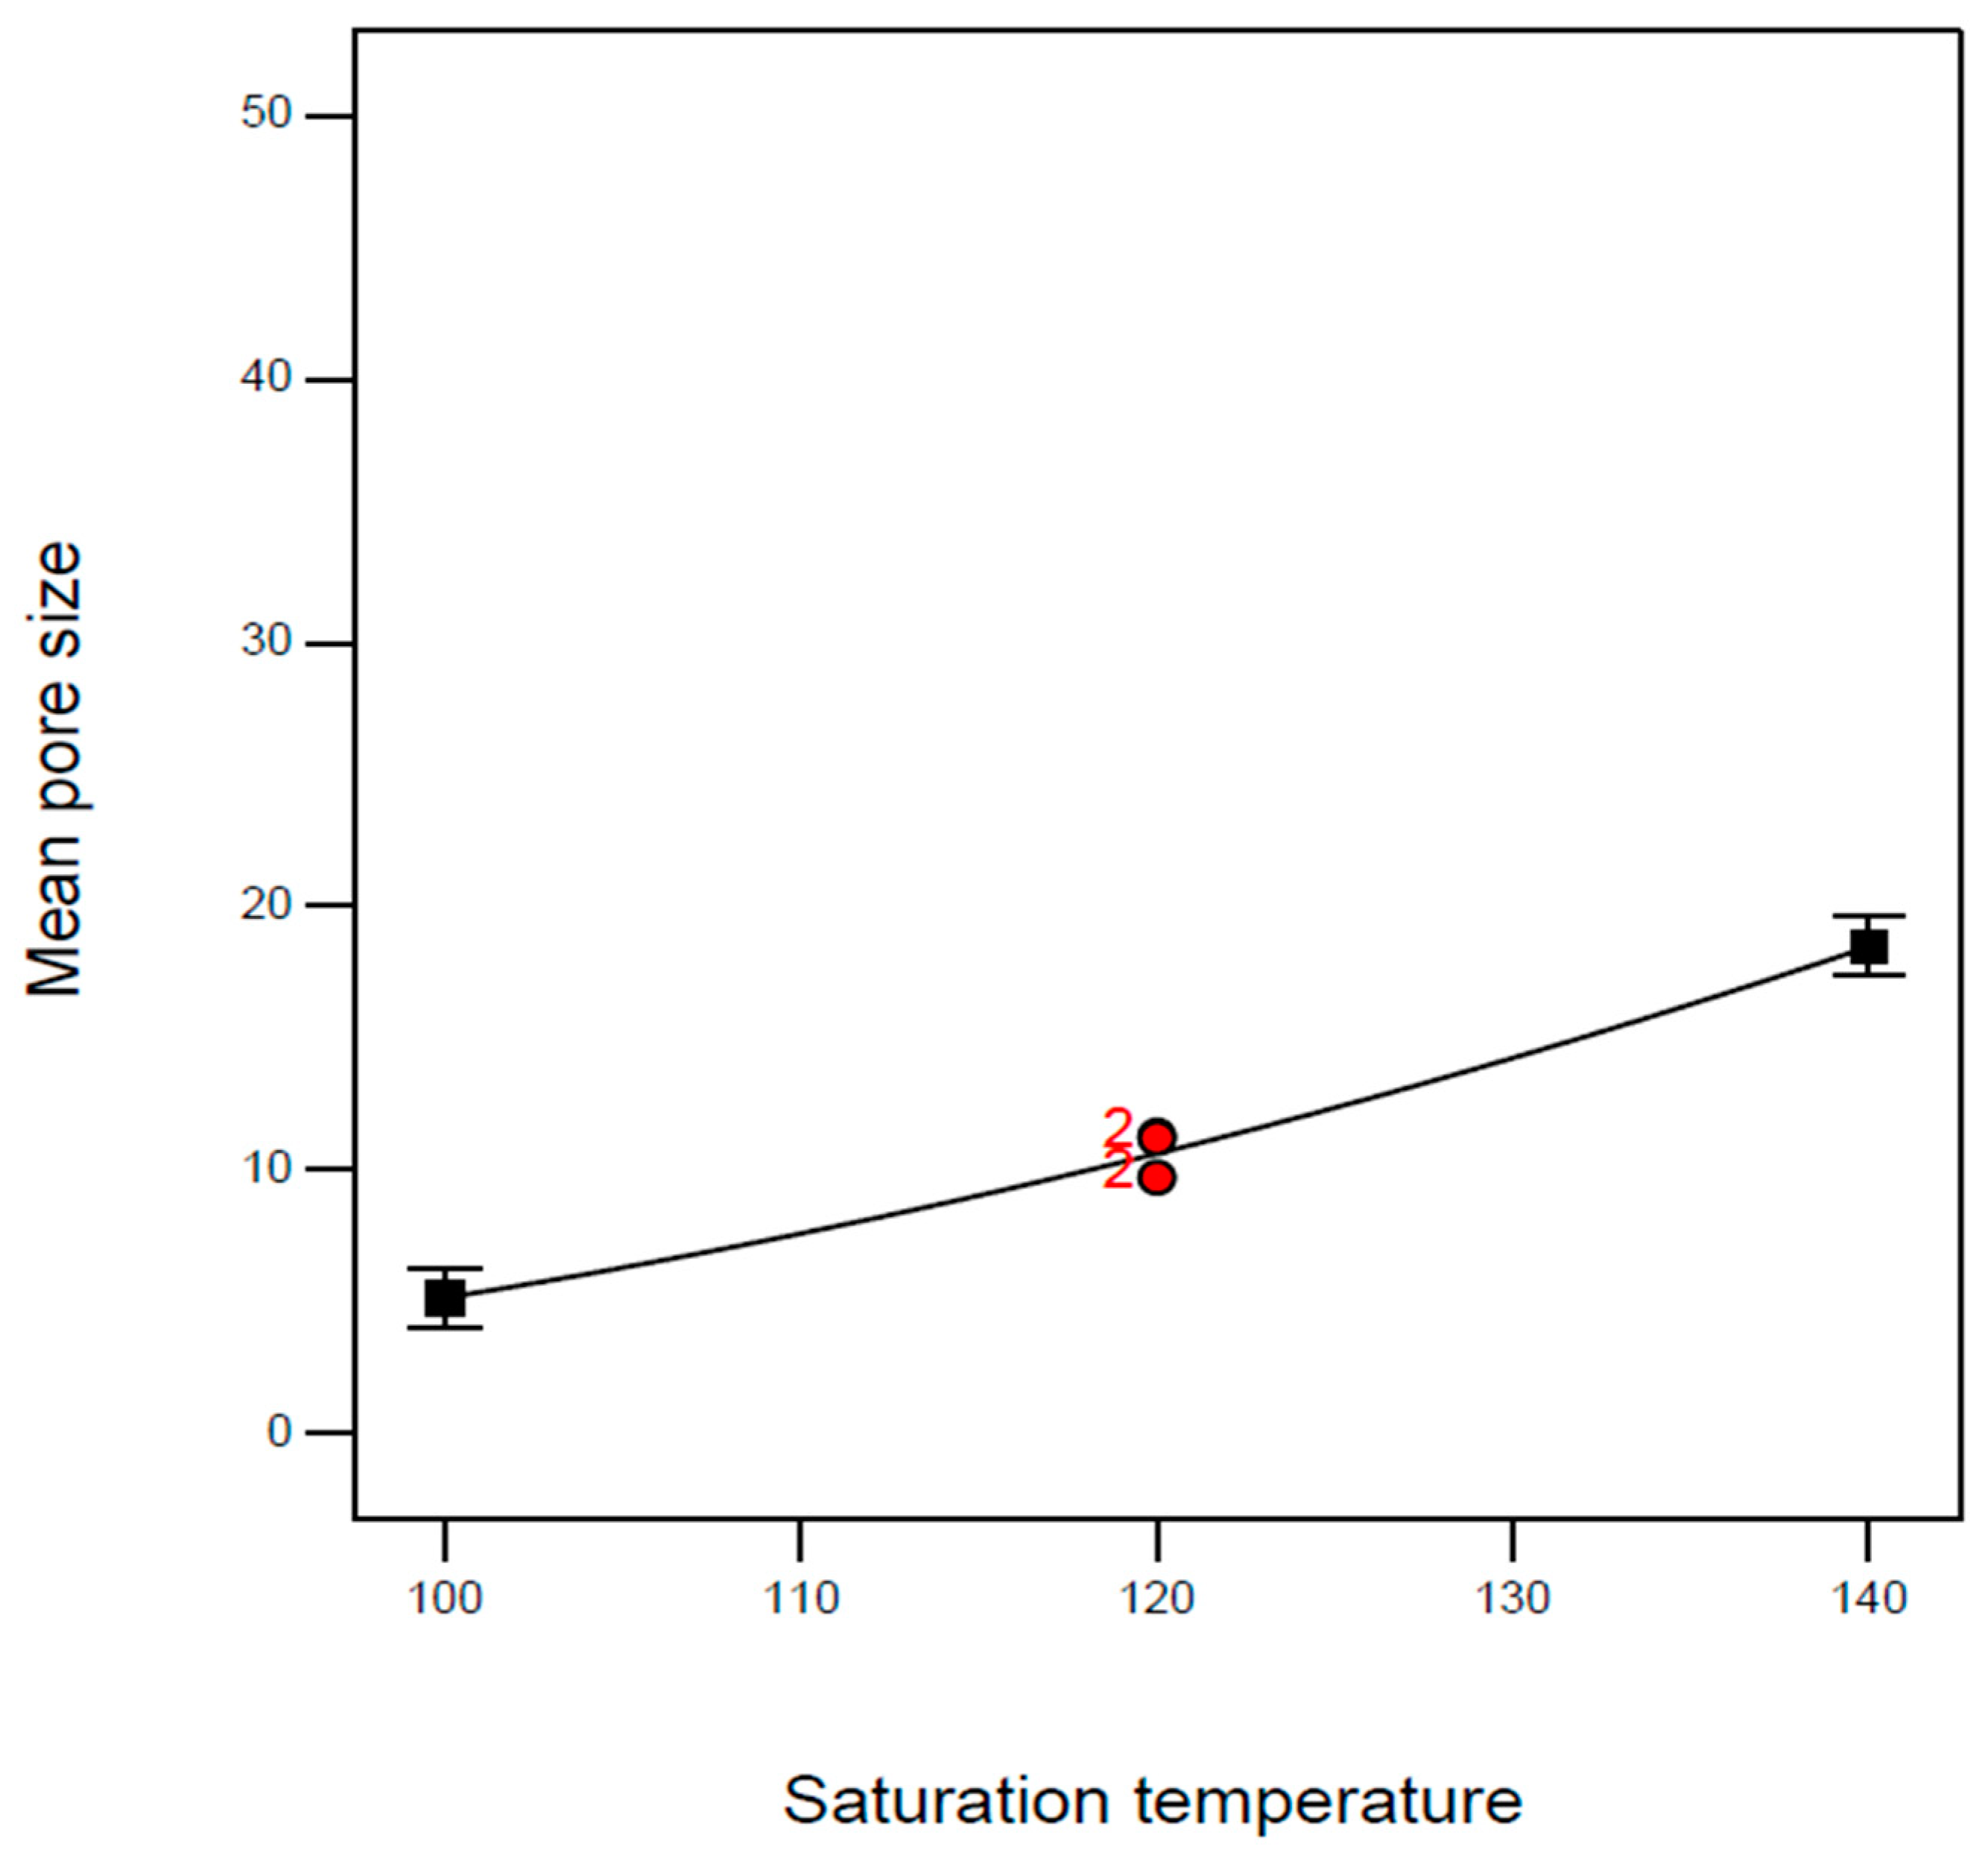
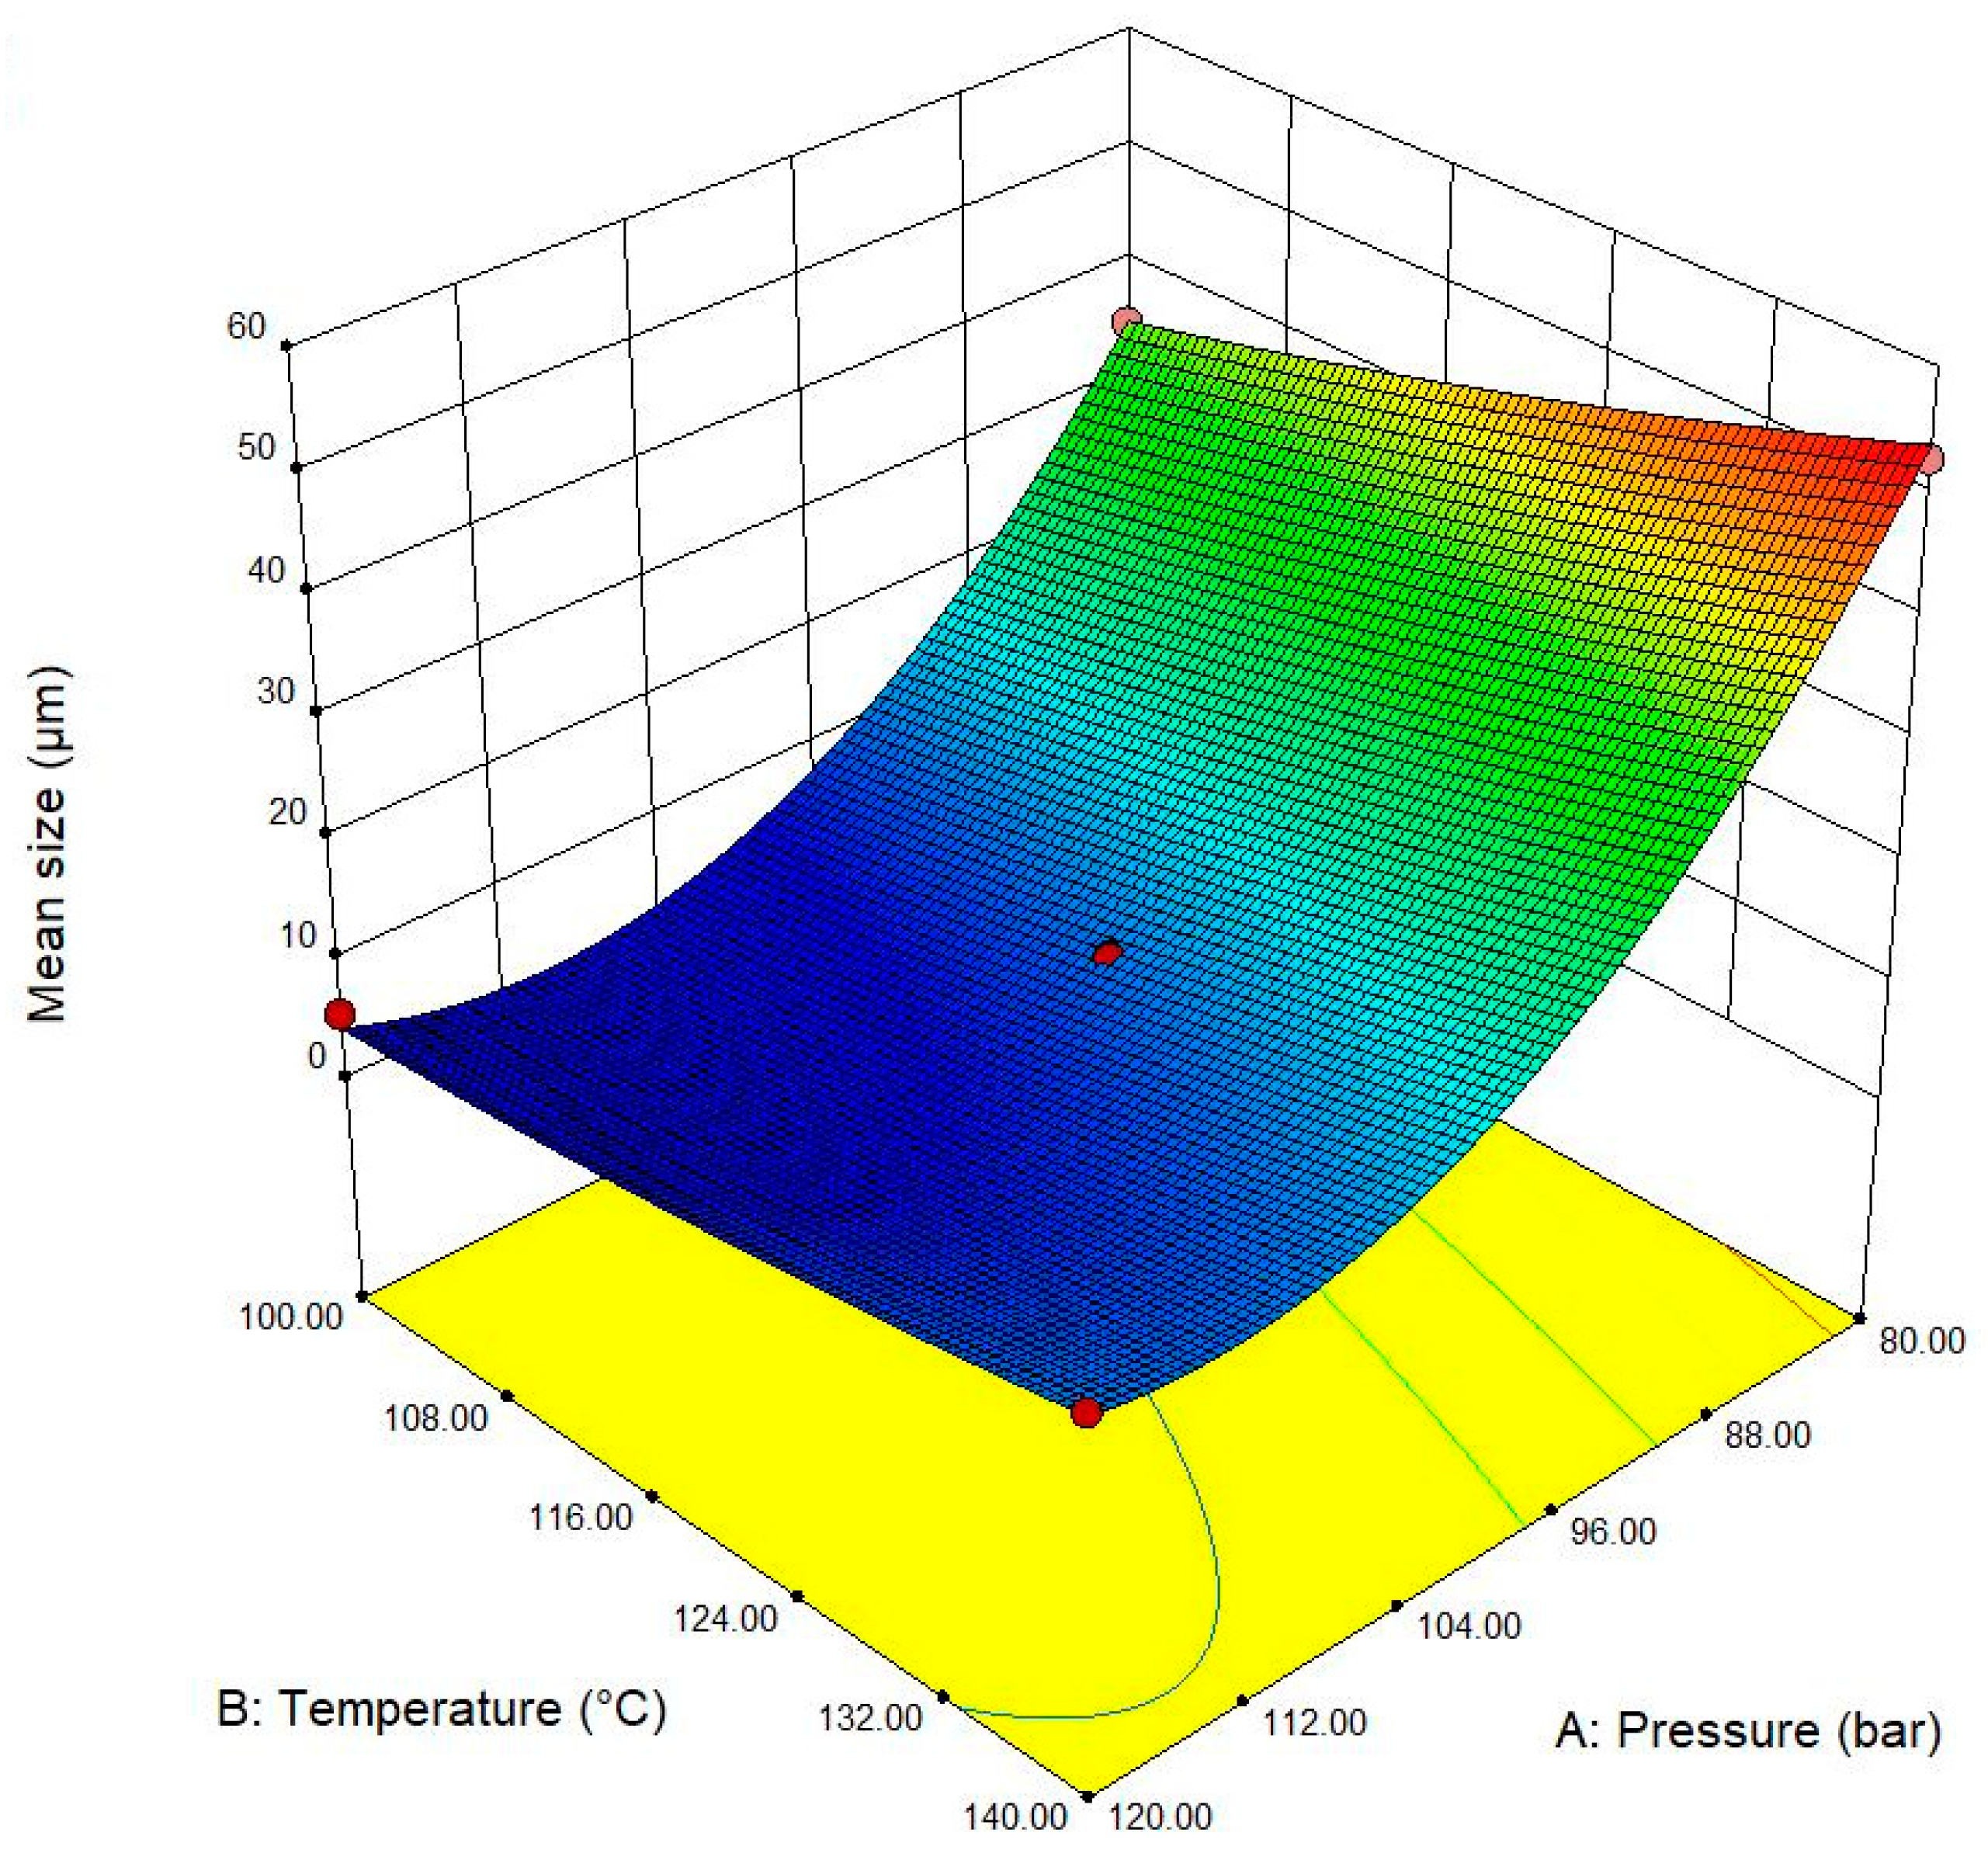
2. Results
3. Discussion
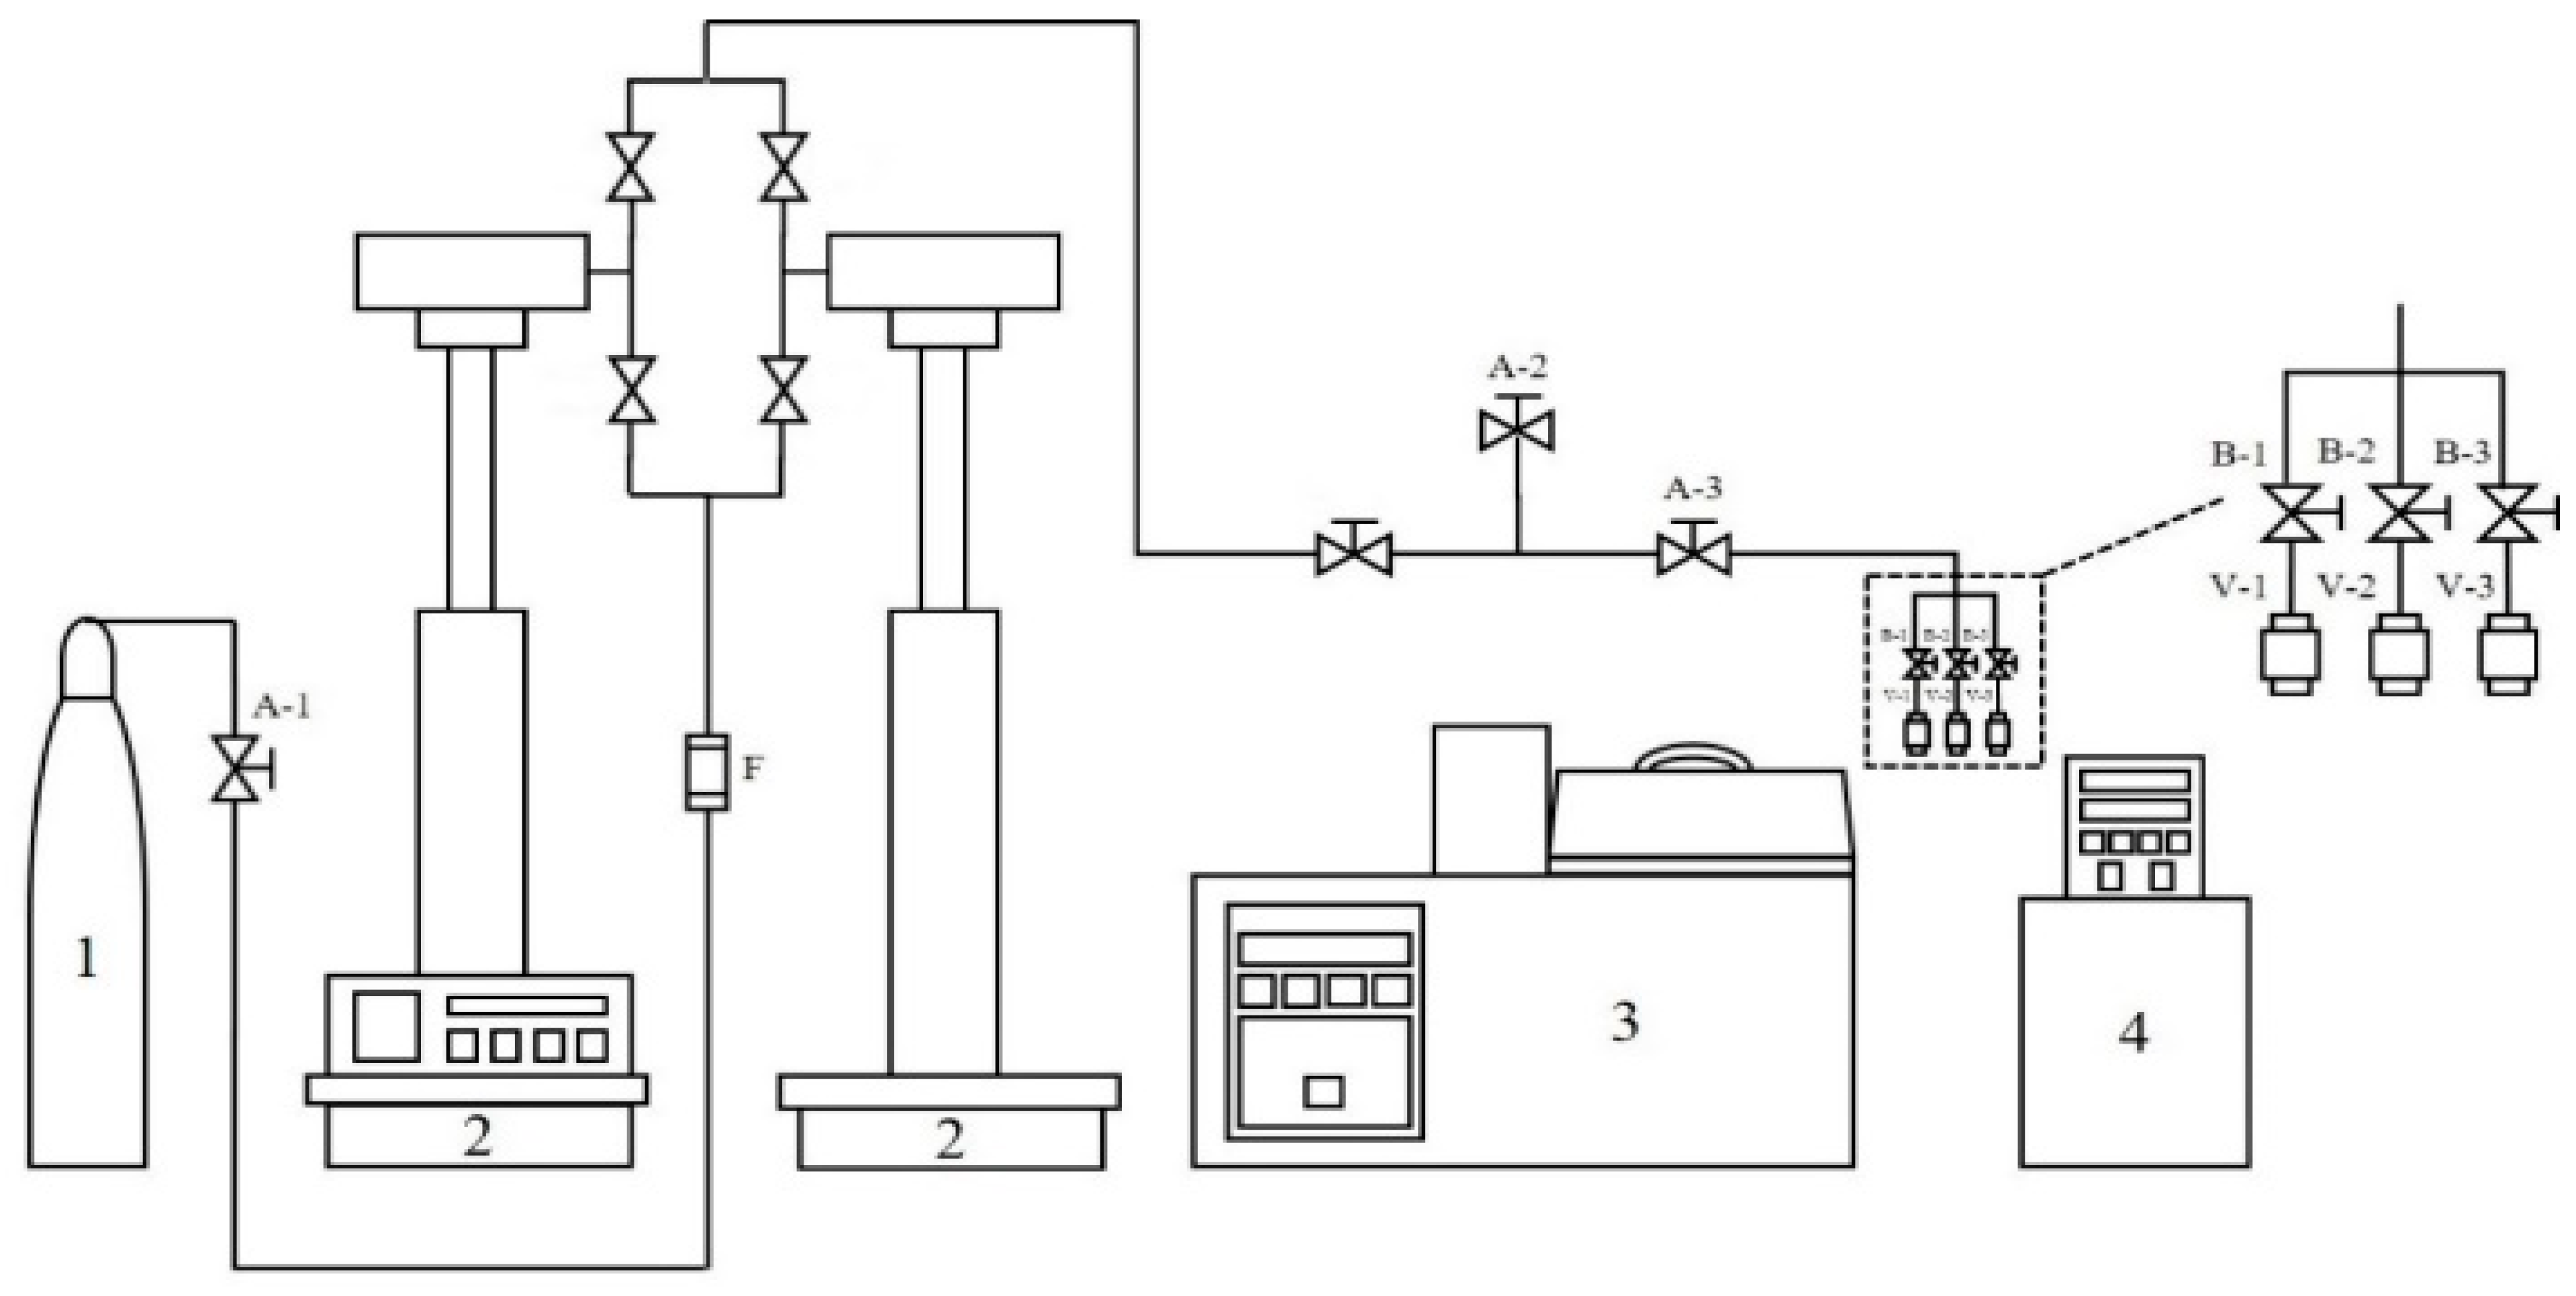
4. Materials and Methods
5. Conclusions
Author Contributions
Funding
Institutional Review Board Statement
Informed Consent Statement
Data Availability Statement
Conflicts of Interest
References
- Jin, F.L.; Zhao, M.; Park, M.; Park, S.J. Recent trends of foaming in polymer processing: A review. Polymers 2019, 11, 953. [Google Scholar] [CrossRef] [PubMed]
- Villamil Jiménez, J.A.; Le Moigne, N.; Bénézet, J.-C.; Sauceau, M.; Sescousse, R.; Fages, J. Foaming of PLA composites by supercritical fluid-assisted processes: A review. Molecules 2020, 25, 3408. [Google Scholar] [CrossRef] [PubMed]
- Chauvet, M.; Sauceau, M.; Fages, J. Extrusion assisted by supercritical CO2: A review on its application to biopolymers. J. Supercrit. Fluids 2017, 120, 408–420. [Google Scholar] [CrossRef]
- Chen, B.; Jiang, J.; Li, Y.; Zhou, M.; Wang, Z.; Wang, L.; Zhai, W. Supercritical fluid microcellular foaming of high-hardness TPU via a pressure-quenching process: Restricted foam expansion controlled by matrix modulus and thermal degradation. Molecules 2022, 27, 8911. [Google Scholar] [CrossRef] [PubMed]
- Haurat, M.; Dumon, M. Amorphous polymers’ foaming and blends with organic foaming-aid structured additives in supercritical CO2, a way to fabricate porous polymers from macro to nano porosities in batch or continuous processes. Molecules 2020, 25, 5320. [Google Scholar] [CrossRef] [PubMed]
- Bao, J.B.; Liu, T.; Zhao, L.; Hu, G.H. A two-step depressurization batch process for forming bi-modal cell structure polystyrene foams using scCO2. J. Supercrit. Fluids 2011, 55, 1104–1114. [Google Scholar] [CrossRef]
- Yang, C.-G.; Wang, M.-H.; Zhang, M.-X.; Li, X.-H.; Wang, H.-L.; Xing, Z.; Ye, L.-F.; Wu, G.-Z. Supercritical CO2 foaming of radiation cross-linked isotactic polypropylene in the presence of TAIC. Molecules 2016, 21, 1660. [Google Scholar] [CrossRef] [PubMed]
- Dai, C.; Zhang, C.; Huang, W.; Chang, K.C.; Lee, L.J. Thermoplastic polyurethane microcellular fibers via supercritical carbon dioxide based extrusion foaming. Polym. Eng. Sci. 2013, 53, 2360–2369. [Google Scholar] [CrossRef]
- Jahani, D.; Ameli, A.; Saniei, M.; Ding, W.; Park, C.B.; Naguib, H.E. Characterization of the structure, acoustic property, thermal conductivity, and mechanical property of highly expanded open-cell polycarbonate foams. Macromol. Mater. Eng. 2015, 300, 48–56. [Google Scholar] [CrossRef]
- Wang, G.; Wan, G.; Chai, J.; Li, B.; Zhao, G.; Mu, Y.; Park, C.B. Structure-tunable thermoplastic polyurethane foams fabricated by supercritical carbon dioxide foaming and their compressive mechanical properties. J. Supercrit. Fluids 2019, 149, 127–137. [Google Scholar] [CrossRef]
- Nofar, M.; Küçük, E.B.; Batı, B. Effect of hard segment content on the microcellular foaming behavior of TPU using supercritical CO2. J. Supercrit. Fluids 2019, 153, 104590. [Google Scholar] [CrossRef]
- Nofar, M.; Batı, B.; Küçük, E.B.; Jalali, A. Effect of soft segment molecular weight on the microcellular foaming behavior of TPU using supercritical CO2. J. Supercrit. Fluids 2020, 160, 104816. [Google Scholar] [CrossRef]
- Jiang, X.; Zhao, L.; Feng, L.; Chen, C. Microcellular thermoplastic polyurethanes and their flexible properties prepared by mold foaming process with supercritical CO2. J. Cell. Plast. 2019, 55, 615–631. [Google Scholar] [CrossRef]
- Yeh, S.K.; Liu, Y.C.; Chu, C.C.; Chang, K.C.; Wang, S.F. Mechanical properties of microcellular and nanocellular thermoplastic polyurethane nanocomposite foams created using supercritical carbon dioxide. Ind. Eng. Chem. Res. 2017, 56, 8499–8507. [Google Scholar] [CrossRef]
- Yeh, S.K.; Chen, Y.R.; Kang, T.W.; Tseng, T.J.; Peng, S.P.; Chu, C.C.; Rwei, S.P.; Guo, W.J. Different approaches for creating nanocellular TPU foams by supercritical CO2 foaming. J. Polym. Res. 2018, 25, 30. [Google Scholar] [CrossRef]
- Prasad, A.; Fotou, G.; Li, S. The effect of polymer hardness, pore size, and porosity on the performance of thermoplastic polyurethane-based chemical mechanical polishing pads. J. Mater. Res. 2013, 28, 2380–2393. [Google Scholar] [CrossRef]
- Zhang, T.; Lee, S.J.; Yoo, Y.H.; Park, K.H.; Kang, H.J. Compression molding of thermoplastic polyurethane foam sheets with beads expanded by supercritical CO2 foaming. Polymers 2021, 13, 656. [Google Scholar] [CrossRef] [PubMed]
- Wang, J.; Fa, H.; Lu, H. Investigation into the effects of foaming variables on the cellular structure and expansion ratio of foamed TPU using response surface methodology. J. Cell. Plast. 2023, 59, 147–164. [Google Scholar] [CrossRef]
- Zhao, D.; Wang, G.; Wang, M. Investigation of the effect of foaming process parameters on expanded thermoplastic polyurethane bead foams properties using response surface methodology. J. Appl. Polym. Sci. 2018, 135, 46327. [Google Scholar] [CrossRef]
- Atapour, M.; Kariminia, H.R.; Moslehabadi, P.M. Optimization of biodiesel production by alkali-catalyzed transesterification of used frying oil. Process. Saf. Environ. Prot. 2014, 92, 179–185. [Google Scholar] [CrossRef]
- Herrero, M.; Martín-Álvarez, P.J.; Señoráns, F.J.; Cifuentes, A.; Ibáñez, E. Optimization of accelerated solvent extraction of antioxidants from Spirulina platensis microalga. Food Chem. 2005, 93, 417–423. [Google Scholar] [CrossRef]
- Gülüm, M.; Yesilyurt, M.K.; Bilgin, A. The performance assessment of cubic spline interpolation and response surface methodology in the mathematical modeling to optimize biodiesel production from waste cooking oil. Fuel 2019, 255, 115778. [Google Scholar] [CrossRef]
- Li, R.; Lee, J.H.; Wang, C.; Mark, L.H.; Park, C.B. Solubility and diffusivity of CO2 and N2 in TPU and their effects on cell nucleation in batch foaming. J. Supercrit. Fluids 2019, 154, 104623. [Google Scholar] [CrossRef]
- Primel, A.; Férec, J.; Ausias, G.; Tirel, Y.; Veillé, J.M.; Grohens, Y. Solubility and interfacial tension of thermoplastic polyurethane melt in supercritical carbon dioxide and nitrogen. J. Supercrit. Fluids 2017, 122, 52–57. [Google Scholar] [CrossRef]
- Wasserstein, R.L.; Lazar, N.A. The ASA’s statement on p-values: Context, process and purpose. Am. Stat. 2016, 70, 129–133. [Google Scholar] [CrossRef]
- Hsiao, Y.T.; Hsieh, C.M.; Yang, T.M.; Su, C.S. Preparation of microcellular foams by supercritical carbon dioxide: A case study of thermoplastic polyurethane 70A. Processes 2021, 9, 1650. [Google Scholar] [CrossRef]
- Yuan, S.; Bai, J.; Chua, C.; Zhou, K.; Wei, J. Characterization of creeping and shape memory effect in laser sintered thermoplastic polyurethane. J. Comput. Inf. Sci. Eng. 2016, 16, 041007. [Google Scholar] [CrossRef]
- Yuan, S.; Shen, F.; Bai, J.; Chua, C.K.; Wei, J.; Zhou, K. 3D soft auxetic lattice structures fabricated by selective laser sintering: TPU powder evaluation and process optimization. Mater. Des. 2017, 120, 317–327. [Google Scholar] [CrossRef]
- Ameri, A.; Sodeifian, G.; Sajadian, S.A. Lansoprazole loading of polymers by supercritical carbon dioxide impregnation: Impacts of process parameters. J. Supercrit. Fluids 2020, 164, 104892. [Google Scholar] [CrossRef]
- Daneshyan, S.; Sodeifian, G. Synthesis of cyclic polystyrene in supercritical carbon dioxide green solvent. J. Supercrit. Fluids 2022, 188, 105679. [Google Scholar] [CrossRef]
- Fathi, M.; Sodeifian, G.; Sajadian, S.A. Experimental study of ketoconazole impregnation into polyvinyl pyrrolidone and hydroxyl propyl methyl cellulose using supercritical carbon dioxide: Process optimization. J. Supercrit. Fluids 2022, 188, 105674. [Google Scholar] [CrossRef]
- Gunasekaran, H.B.; Ponnan, S.; Thirunavukkarasu, N.; Laroui, A.; Wu, L.; Wang, J. Rapid carbon dioxide foaming of 3D printed thermoplastic polyurethane elastomers. ACS Appl. Polym. Mater. 2022, 4, 1497–1511. [Google Scholar] [CrossRef]
- Michaeli, W.; Heinz, R. Foam extrusion of thermoplastic polyurethanes (TPU) using CO2 as a blowing agent. Macromol. Mater. Eng. 2000, 284–285, 35–39. [Google Scholar] [CrossRef]
- Belmonte, P.; Ramos, M.J.; Rodríguez, J.F.; Garrido, I.; García, M.T.; García-Vargas, J.M. Transformation of TPU elastomers into TPU foams using supercritical CO2. A new reprocessing approach. J. Supercrit. Fluids 2023, 192, 105806. [Google Scholar] [CrossRef]


| Exp. No. | P (bar) | T (°C) | t (h) | Expansion Ratio (-) |
|---|---|---|---|---|
| A1 | 100 | 100 | 2 | 1.81 |
| A2 | 80 | 100 | 2 | 1.38 |
| A3 | 120 | 100 | 2 | 2.02 |
| A4 | 100 | 60 | 2 | 1.08 |
| A5 | 100 | 80 | 2 | 1.30 |
| A6 | 100 | 120 | 2 | 3.18 |
| A7 | 100 | 140 | 2 | 5.44 |
| A8 | 100 | 160 | 2 | 1.29 |
| A9 | 100 | 100 | 4 | 1.83 |
| A10 | 100 | 80 | 4 | 1.26 |
| A11 | 100 | 120 | 4 | 3.07 |
| A12 | 120 | 100 | 4 | 1.85 |
| Independent Variable | Symbol | Level | ||
|---|---|---|---|---|
| −1 | 0 | 1 | ||
| A: Saturation pressure | P (bar) | 80 | 100 | 120 |
| B: Saturation temperature | T (°C) | 100 | 120 | 140 |
| C: Immersion time | t (hr) | 2 | 4 | 6 |
| Exp. No. | Operating Parameter | Results | ||||
|---|---|---|---|---|---|---|
| P (bar) | T (°C) | t (hr) | Exp. Ratio (-) | Pore Size (μm) | Cell Density (cells/cm3) | |
| B1 | 100 | 120 | 4 | 2.87 | 11.3 | 109 |
| B2 | 100 | 120 | 4 | 2.42 | 11.2 | 109 |
| B3 | 80 | 140 | 4 | 6.00 | 52.7 | 107 |
| B4 | 120 | 120 | 6 | 2.92 | 7.8 | 109 |
| B5 | 100 | 120 | 4 | 2.56 | 9.7 | 109 |
| B6 | 100 | 100 | 2 | 1.56 | 6.7 | 109 |
| B7 | 100 | 140 | 2 | 5.88 | 22.6 | 108 |
| B8 | 100 | 120 | 4 | 2.50 | 9.7 | 109 |
| B9 | 120 | 120 | 2 | 2.86 | 9.2 | 109 |
| B10 | 100 | 100 | 6 | 1.53 | 7.2 | 109 |
| B11 | 80 | 120 | 2 | 2.03 | 47.0 | 107 |
| B12 | 120 | 140 | 4 | 5.43 | 12.7 | 109 |
| B13 | 100 | 140 | 6 | 6.22 | 19.5 | 108 |
| B14 | 80 | 100 | 4 | 1.35 | 34.9 | 106 |
| B15 | 80 | 120 | 6 | 2.09 | 45.7 | 107 |
| B16 | 120 | 100 | 4 | 1.80 | 5.4 | 109 |
| B17 | 100 | 120 | 4 | 2.46 | 11.2 | 109 |
| Results | Model | ||
|---|---|---|---|
| Linear | 2FI | Quadratic | |
| Expansion ratio | |||
| R2 | 0.8428 | 0.8493 | 0.9867 |
| p-value of lack of fit test | 0.0040 | 0.0022 | 0.0814 |
| Mean pore size | |||
| R2 | 0.7506 | 0.7583 | 0.9978 |
| p-value of lack of fit test | <0.0001 | <0.0001 | 0.1702 |
| Response | Equation | AARD (%) |
|---|---|---|
| Expansion ratio (-) | 22.42 + 0.145 A − 0.559 B − 0.316 C − 0.0003 A2 + 0.003007 B2 + 0.0082 C2 − 0.00064 AB + 0.00231 BC | 7.1 |
| Mean pore size (μm) | 389.9 − 7.43 A + 0.365 B − 1.95 C + 0.03654 A2 + 0.003 B2 + 0.55 C2 − 0.00656 × 10⁻³ AB − 0.0225 BC | 6.0 |
| Exp. No. | P (bar) | T (°C) | t (h) | Expansion Ratio (-) | Pore Size (μm) | ||
|---|---|---|---|---|---|---|---|
| Exp. (a) | Pred. (b) | Exp. (a) | Pred. (b) | ||||
| C1 | 120 | 140 | 4.7 | 5.54 | 5.69 | 12.7 | 12.4 |
| C2 | 80 | 140 | 6 | 6.76 | 5.98 | 60.6 | 55.0 |
| Source | p-Value (a) | |
|---|---|---|
| Expansion Ratio (-) | Mean Pore Size (μm) | |
| Model | <0.0001 | <0.0001 |
| A | 0.1044 | <0.0001 |
| B | <0.0001 | <0.0001 |
| C | 0.6186 | 0.1393 |
| A2 | 0.4277 | <0.0001 |
| B2 | <0.0001 | 0.0663 |
| C2 | 0.8245 | 0.0052 |
| AB | 0.1241 | 0.0023 |
| AC | 1.0000 | 0.9657 |
| BC | 0.5464 | 0.1532 |
Disclaimer/Publisher’s Note: The statements, opinions and data contained in all publications are solely those of the individual author(s) and contributor(s) and not of MDPI and/or the editor(s). MDPI and/or the editor(s) disclaim responsibility for any injury to people or property resulting from any ideas, methods, instructions or products referred to in the content. |
© 2024 by the authors. Licensee MDPI, Basel, Switzerland. This article is an open access article distributed under the terms and conditions of the Creative Commons Attribution (CC BY) license (https://creativecommons.org/licenses/by/4.0/).
Share and Cite
Khudaida, S.H.; Yen, S.-K.; Su, C.-S. The Application of Box–Behnken Design for Investigating the Supercritical CO2 Foaming Process: A Case Study of Thermoplastic Polyurethane 85A. Molecules 2024, 29, 363. https://doi.org/10.3390/molecules29020363
Khudaida SH, Yen S-K, Su C-S. The Application of Box–Behnken Design for Investigating the Supercritical CO2 Foaming Process: A Case Study of Thermoplastic Polyurethane 85A. Molecules. 2024; 29(2):363. https://doi.org/10.3390/molecules29020363
Chicago/Turabian StyleKhudaida, Salal Hasan, Shih-Kuo Yen, and Chie-Shaan Su. 2024. "The Application of Box–Behnken Design for Investigating the Supercritical CO2 Foaming Process: A Case Study of Thermoplastic Polyurethane 85A" Molecules 29, no. 2: 363. https://doi.org/10.3390/molecules29020363
APA StyleKhudaida, S. H., Yen, S.-K., & Su, C.-S. (2024). The Application of Box–Behnken Design for Investigating the Supercritical CO2 Foaming Process: A Case Study of Thermoplastic Polyurethane 85A. Molecules, 29(2), 363. https://doi.org/10.3390/molecules29020363