
Highly Porous Carbon Flakes Derived from Cellulose and Nickel Phosphide Heterostructure towards Efficient Electrocatalysis of Oxygen Evolution Reaction


Abstract
1. Introduction
2. Results
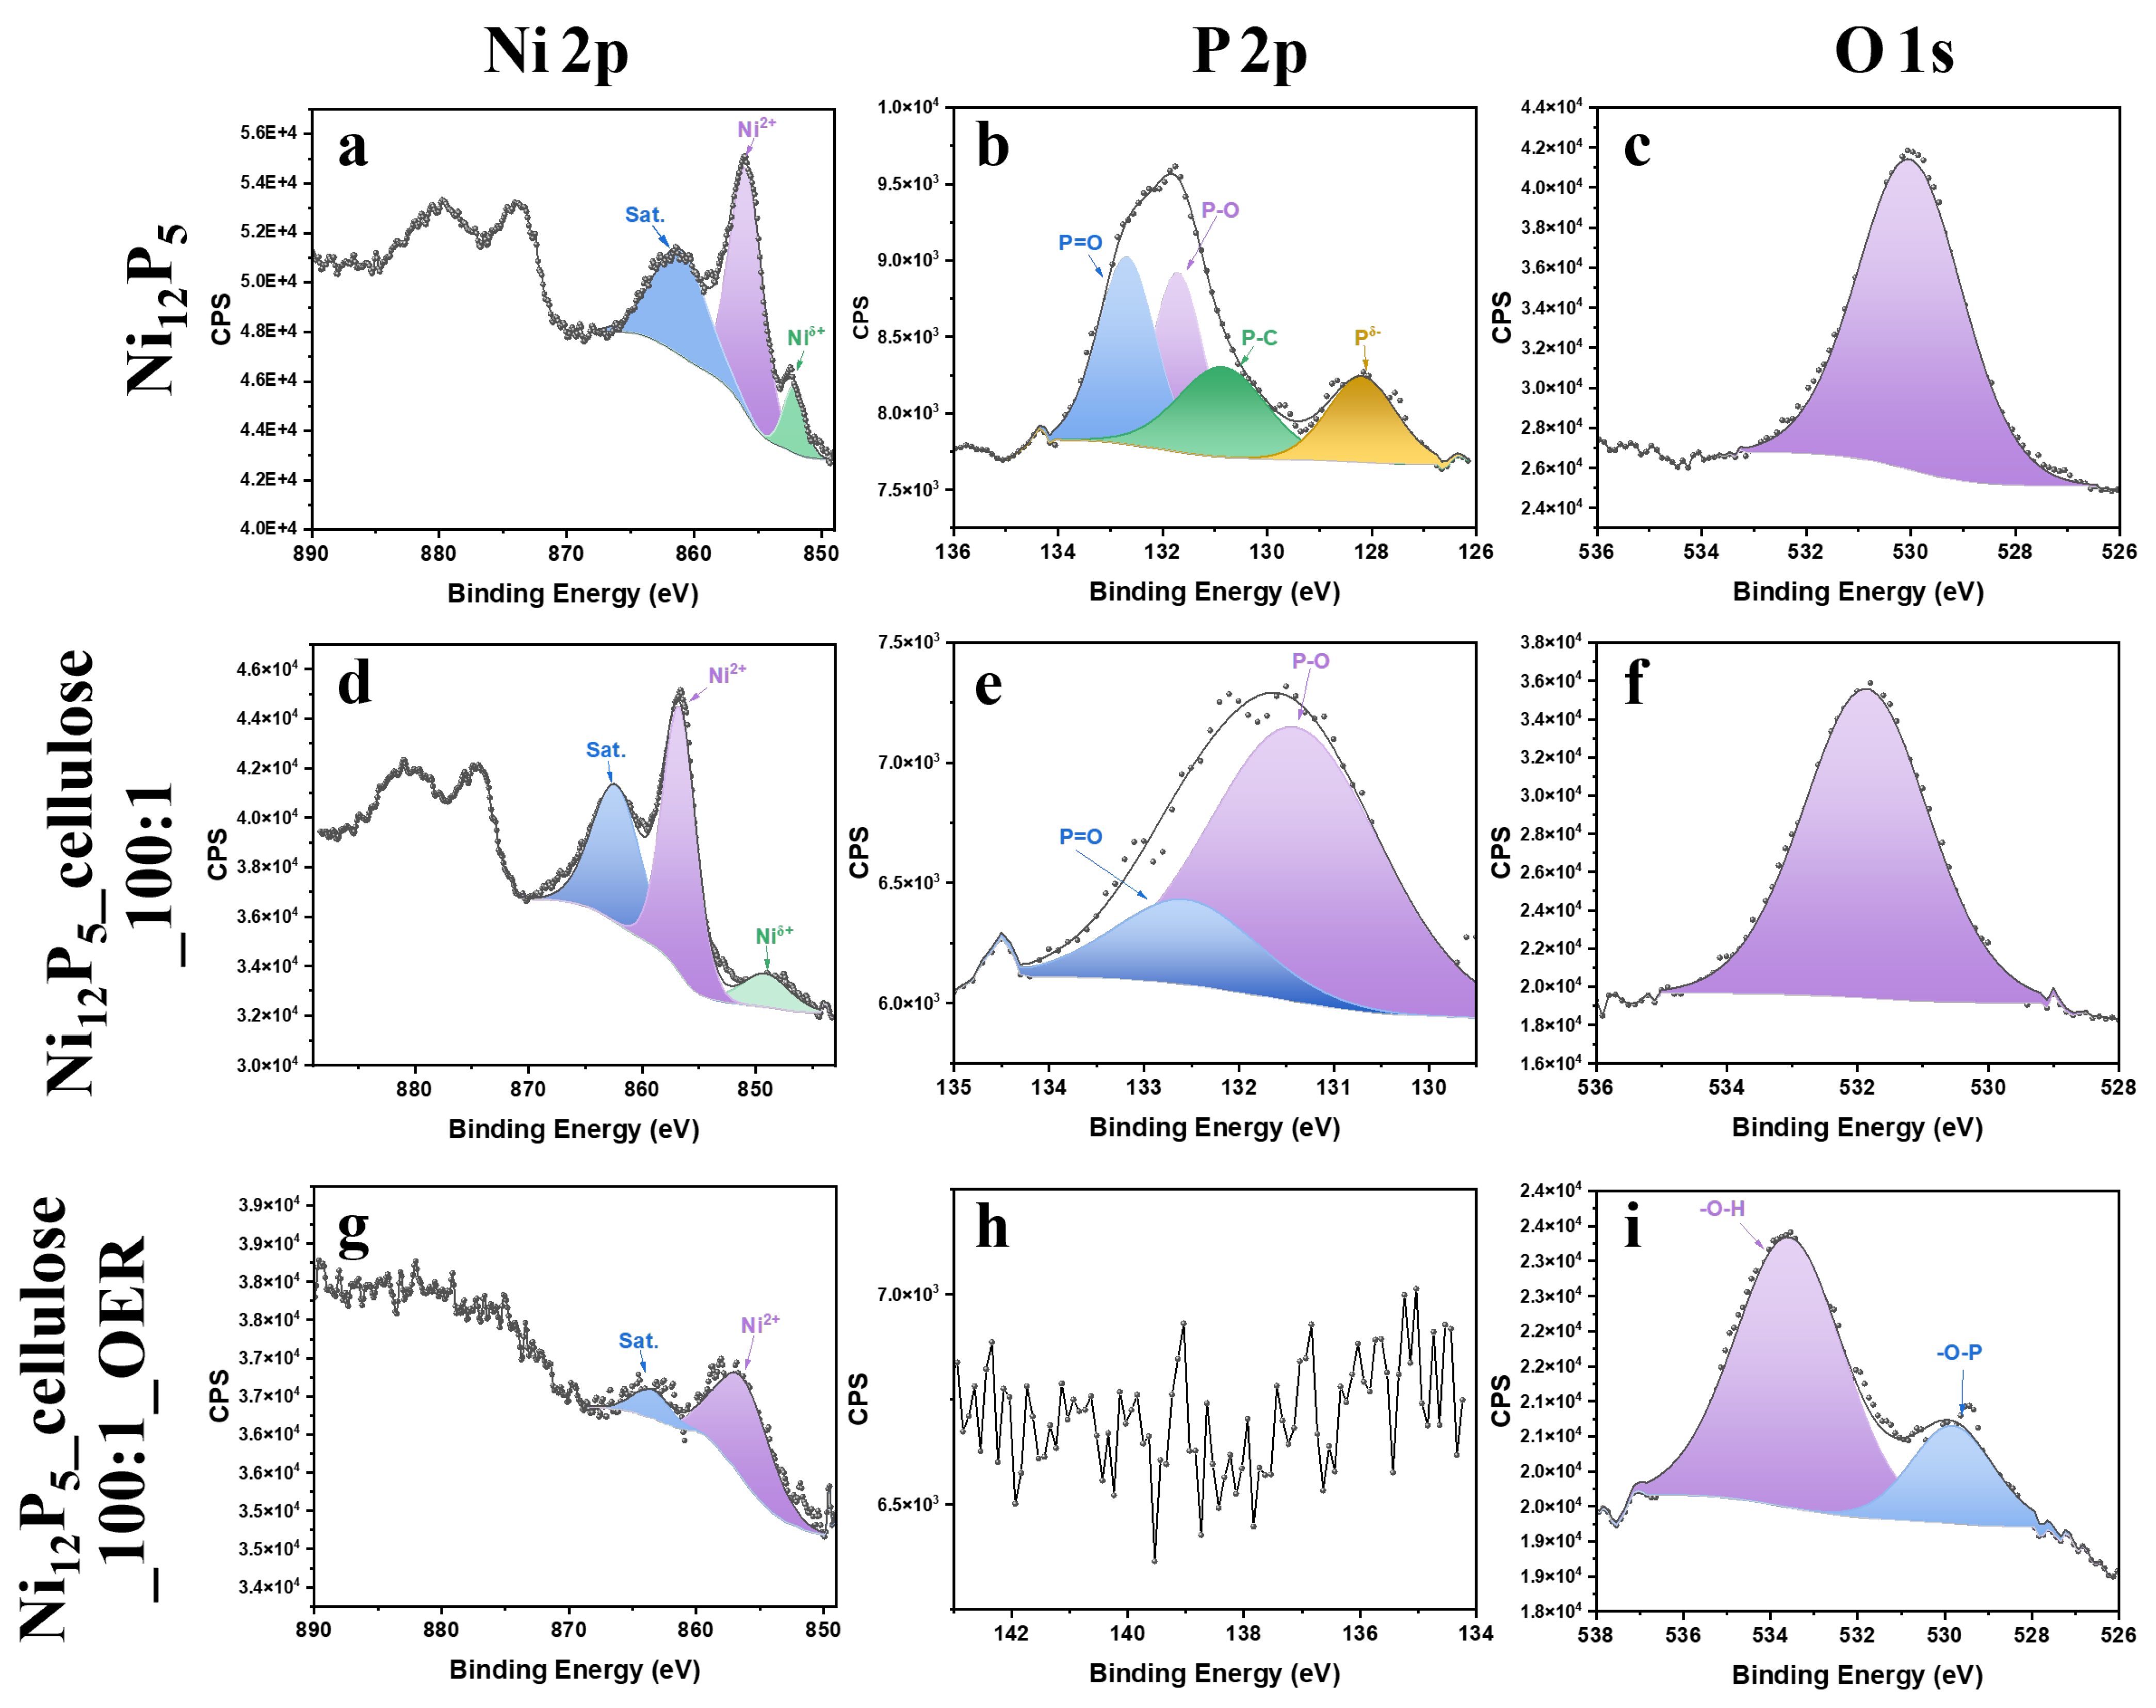
2.1. XPS Analysis
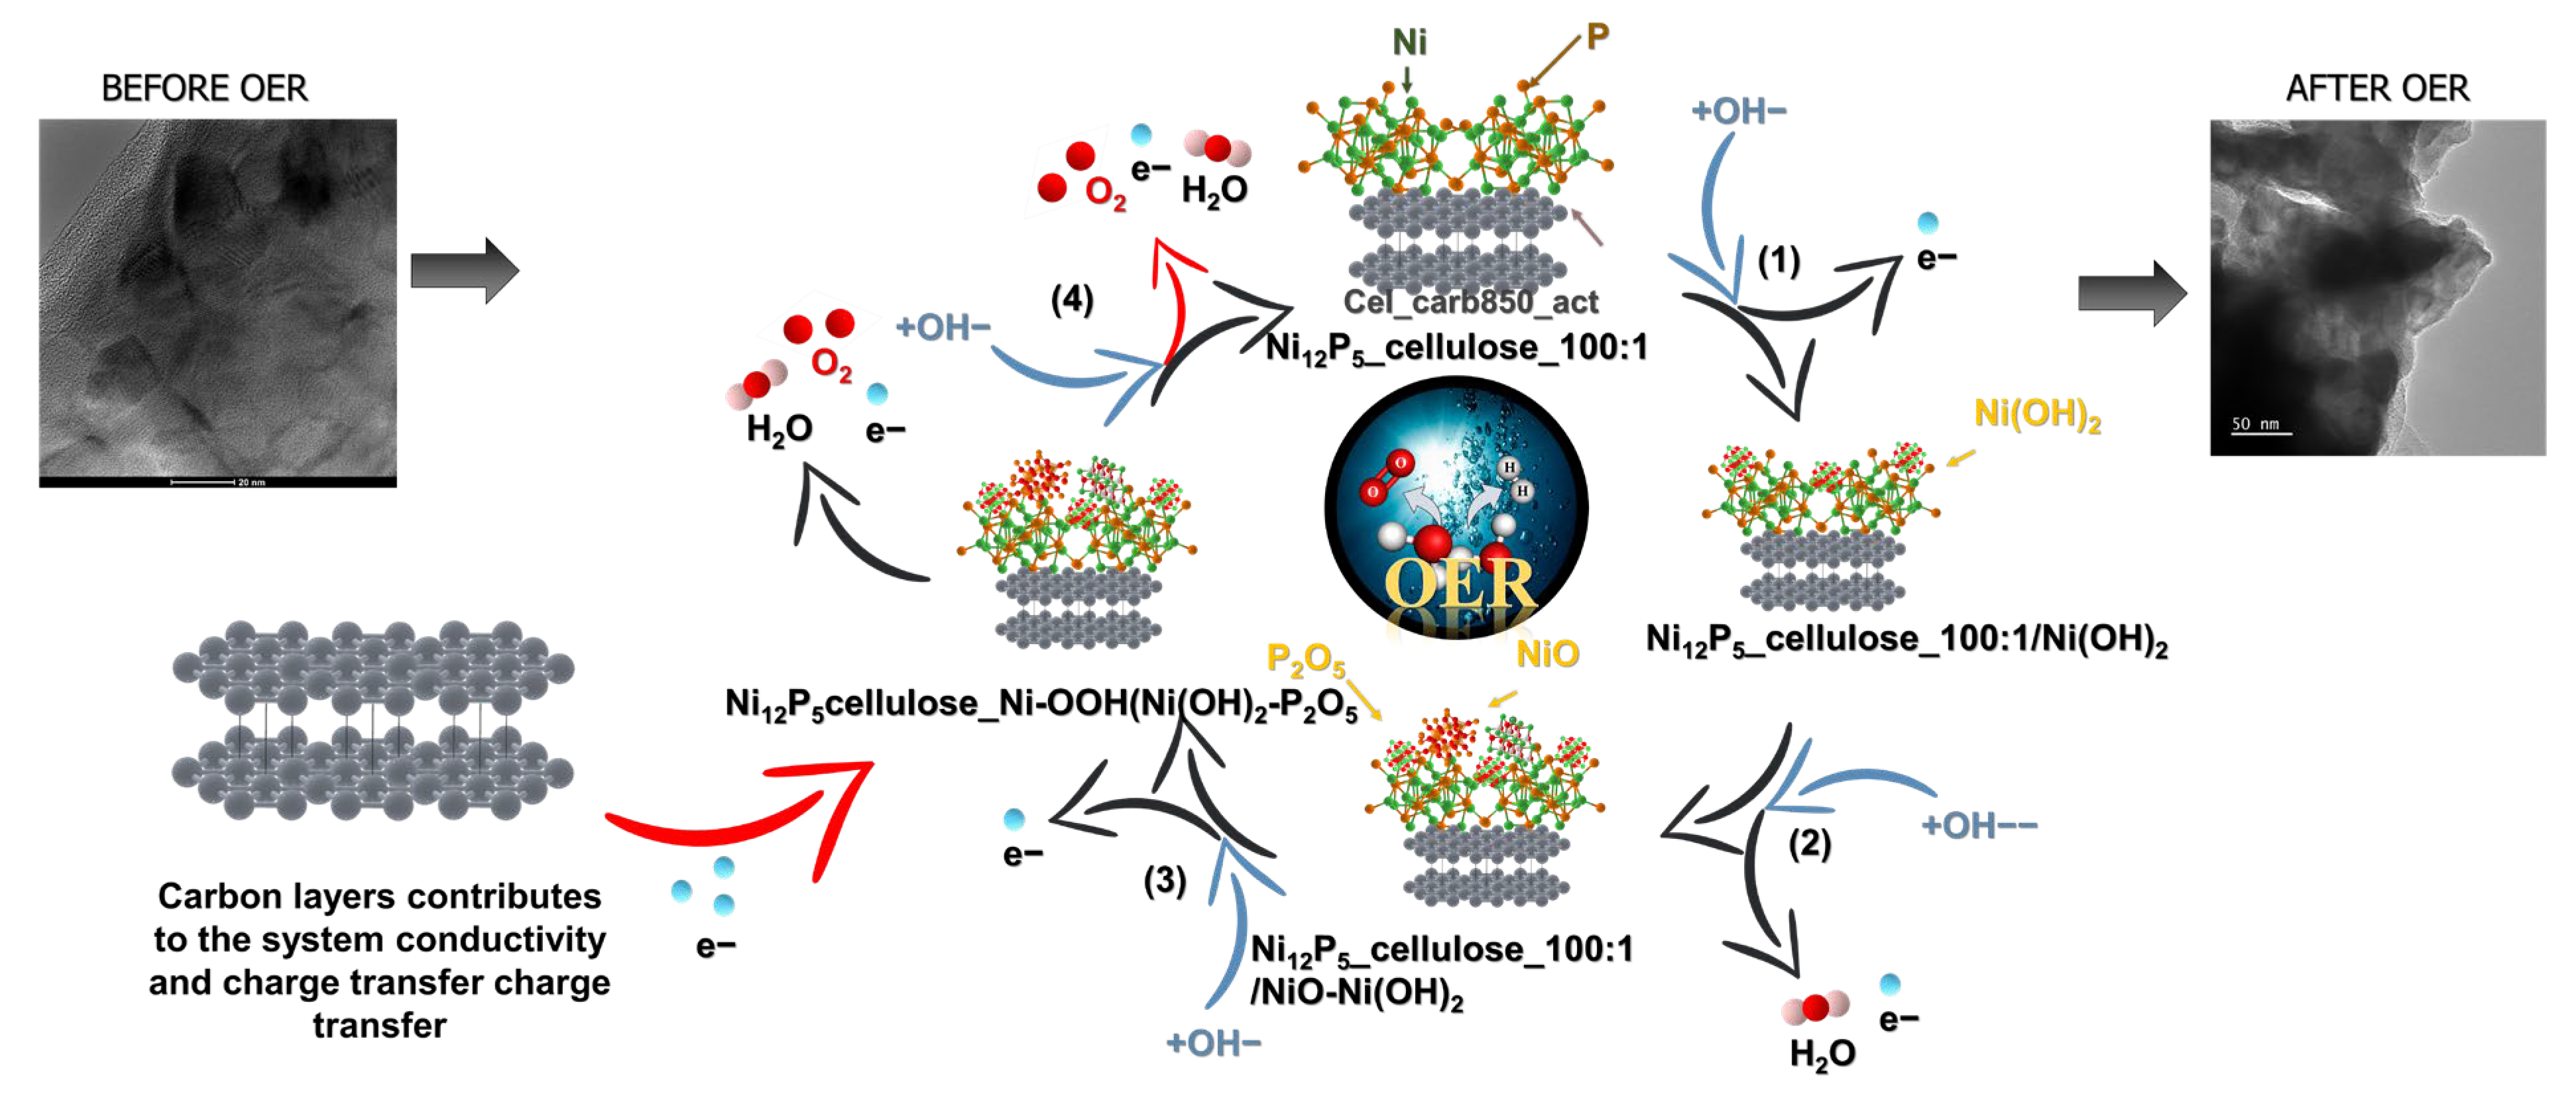
2.2. Proposed Mechanism
3. Experimental Section
3.1. Materials and Chemicals
3.1.1. Preparation of Cellulose Fibers
3.1.2. Carbonization of Cellulose
3.1.3. Activation of Carbonized Cellulose
3.1.4. Synthesis of Nickel Phosphide (Ni12P5)
3.1.5. Synthesis of Cellulose and Nickel Phosphide Composite (Ni12P5_Cellulose)
3.2. Characterization Methods
3.3. Electrochemical Measurements
4. Conclusions
Supplementary Materials
Author Contributions
Funding
Institutional Review Board Statement
Informed Consent Statement
Data Availability Statement
Acknowledgments
Conflicts of Interest
References
- Friedlingstein, P.; O’sullivan, M.; Jones, M.W.; Andrew, R.M.; Gregor, L.; Hauck, J.; Le Quéré, C.; Luijkx, I.T.; Olsen, A.; Peters, G.P.; et al. Global Carbon Budget 2022. Earth Syst. Sci. Data 2022, 14, 4811–4900. [Google Scholar] [CrossRef]
- Miranda, M.W.; Ogland-Hand, J.D.; Bielicki, J.M.; Moghanloo, R.G.; DaneshFar, J.; Middleton, R.S. Developing a Roadmap for Carbon Capture, and Storage in Oklahoma by Assessing the Viability of Stacked Storage. Greenh. Gases Sci. Technol. 2023, 13, 763–779. [Google Scholar] [CrossRef]
- Aghel, B.; Janati, S.; Wongwises, S.; Shadloo, M.S. Review on CO2 Capture by Blended Amine Solutions. Int. J. Greenh. Gas. Control 2022, 119, 103715. [Google Scholar] [CrossRef]
- Balat, M.; Balat, M. Political, Economic and Environmental Impacts of Biomass-Based Hydrogen. Int. J. Hydrogen Energy 2009, 34, 3589–3603. [Google Scholar] [CrossRef]
- Anika, O.C.; Nnabuife, S.G.; Bello, A.; Okoroafor, E.R.; Kuang, B.; Villa, R. Prospects of Low and Zero-Carbon Renewable Fuels in 1.5-Degree Net Zero Emission Actualisation by 2050: A Critical Review. Carbon Capture Sci. Technol. 2022, 5, 100072. [Google Scholar] [CrossRef]
- Barbir, F. Transition to Renewable Energy Systems with Hydrogen as an Energy Carrier. Energy 2009, 34, 308–312. [Google Scholar] [CrossRef]
- Dash, S.K.; Chakraborty, S.; Elangovan, D. A Brief Review of Hydrogen Production Methods and Their Challenges. Energies 2023, 16, 1141. [Google Scholar] [CrossRef]
- Ishaq, H.; Dincer, I.; Crawford, C. A Review on Hydrogen Production and Utilization: Challenges and Opportunities. Int. J. Hydrogen Energy 2022, 47, 26238–26264. [Google Scholar] [CrossRef]
- Younas, M.; Shafique, S.; Hafeez, A.; Javed, F.; Rehman, F. An Overview of Hydrogen Production: Current Status, Potential, and Challenges. Fuel 2022, 316, 123317. [Google Scholar] [CrossRef]
- Kalamaras, C.M.; Efstathiou, A.M. Hydrogen Production Technologies: Current State and Future Developments. Conf. Pap. Energy 2013, 2013, 690627. [Google Scholar] [CrossRef]
- Karkach, B.; Tahiri, M.; Haibi, A.; Bouya, M.; Kifani-Sahban, F. Review on Fast Pyrolysis of Biomass for Biofuel Production from Date Palm. Appl. Sci. 2023, 13, 10463. [Google Scholar] [CrossRef]
- Monteiro, E.; Ferreira, S. Biomass Waste for Energy Production. Energies 2022, 15, 5943. [Google Scholar] [CrossRef]
- Muscat, A.; de Olde, E.M.; de Boer, I.J.M.; Ripoll-Bosch, R. The Battle for Biomass: A Systematic Review of Food-Feed-Fuel Competition. Glob. Food Sec. 2020, 25, 100330. [Google Scholar] [CrossRef]
- Calvo-Serrano, R.; Guo, M.; Pozo, C.; Galán-Martín, Á.; Guillén-Gosálbez, G. Biomass Conversion into Fuels, Chemicals, or Electricity? A Network-Based Life Cycle Optimization Approach Applied to the European Union. ACS Sustain. Chem. Eng. 2019, 7, 10570–10582. [Google Scholar] [CrossRef]
- Rey, J.; Segura, F.; Andújar, J.M. Green Hydrogen: Resources Consumption, Technological Maturity, and Regulatory Framework. Energies 2023, 16, 6222. [Google Scholar] [CrossRef]
- Shi, J.; Zhu, Y.; Feng, Y.; Yang, J.; Xia, C. A Prompt Decarbonization Pathway for Shipping: Green Hydrogen, Ammonia, and Methanol Production and Utilization in Marine Engines. Atmosphere 2023, 14, 584. [Google Scholar] [CrossRef]
- Demirbas, A. Future Hydrogen Economy and Policy. Energy Sources Part B Econ. Plan. Policy 2017, 12, 172–181. [Google Scholar] [CrossRef]
- Abe, J.O.; Popoola, A.P.I.; Ajenifuja, E.; Popoola, O.M. Hydrogen Energy, Economy and Storage: Review and Recommendation. Int. J. Hydrogen Energy 2019, 44, 15072–15086. [Google Scholar] [CrossRef]
- Nikolaidis, P.; Poullikkas, A. A Comparative Overview of Hydrogen Production Processes. Renew. Sustain. Energy Rev. 2017, 67, 597–611. [Google Scholar] [CrossRef]
- Acar, E.G.; Yılmaz, S.; Eroglu, Z.; Çekceoğlu, İ.A.; Aslan, E.; Patır, İ.H.; Metin, O. Black Phosphorus/WS2-TM (TM: Ni, Co) Heterojunctions for Photocatalytic Hydrogen Evolution under Visible Light Illumination. Catalysts 2023, 13, 1006. [Google Scholar] [CrossRef]
- Sahin, N.E.; Pech-Rodríguez, W.J.; Meléndez-González, P.C.; Lopez Hernández, J.; Rocha-Rangel, E. Water Splitting as an Alternative for Electrochemical Hydrogen and Oxygen Generation: Current Status, Trends, and Challenges. Energies 2023, 16, 5078. [Google Scholar] [CrossRef]
- Pan, Y.; Yang, N.; Chen, Y.; Lin, Y.; Li, Y.; Liu, Y.; Liu, C. Nickel Phosphide Nanoparticles-Nitrogen-Doped Graphene Hybrid as an Efficient Catalyst for Enhanced Hydrogen Evolution Activity. J. Power Sources 2015, 297, 45–52. [Google Scholar] [CrossRef]
- Liu, H.; Xi, C.; Xin, J.; Zhang, G.; Zhang, S.; Zhang, Z.; Huang, Q.; Li, J.; Liu, H.; Kang, J. Free-Standing Nanoporous NiMnFeMo Alloy: An Efficient Non-Precious Metal Electrocatalyst for Water Splitting. Chem. Eng. J. 2021, 404, 126530. [Google Scholar] [CrossRef]
- Krishnamurthy, P.; Maiyalagan, T.; Panomsuwan, G.; Jiang, Z.; Rahaman, M. Iron-Doped Nickel Hydroxide Nanosheets as Efficient Electrocatalysts in Electrochemical Water Splitting. Catalysts 2023, 13, 1095. [Google Scholar] [CrossRef]
- Hisatomi, T.; Domen, K. Overall Water Splitting: What’s next? Next Energy 2023, 1, 100006. [Google Scholar] [CrossRef]
- Hu, C.; Lv, C.; Liu, S.; Shi, Y.; Song, J.; Zhang, Z.; Cai, J.; Watanabe, A. Nickel Phosphide Electrocatalysts for Hydrogen Evolution Reaction. Catalysts 2020, 10, 188. [Google Scholar] [CrossRef]
- Xiang, D.; Zhang, B.; Zhang, H.; Shen, L. One-Step Synthesis of Bifunctional Nickel Phosphide Nanowires as Electrocatalysts for Hydrogen and Oxygen Evolution Reactions. Front. Chem. 2021, 9, 773018. [Google Scholar] [CrossRef] [PubMed]
- Shahroudi, A.; Esfandiari, M.; Habibzadeh, S. Nickel Sulfide and Phosphide Electrocatalysts for Hydrogen Evolution Reaction: Challenges and Future Perspectives. RSC Adv. 2022, 12, 29440–29468. [Google Scholar] [CrossRef]
- Lin, Y.; Zhang, J.; Pan, Y.; Liu, Y. Nickel Phosphide Nanoparticles Decorated Nitrogen and Phosphorus Co-Doped Porous Carbon as Efficient Hybrid Catalyst for Hydrogen Evolution. Appl. Surf. Sci. 2017, 422, 828–837. [Google Scholar] [CrossRef]
- Hu, C.; Lv, C.; Zeng, N.; Liu, A.; Liu, Y.; Hu, L.; Li, P.; Yao, Y.; Cai, J.; Tang, T. Recent Advances in Ni-Based Electrocatalysts for Hydrogen Evolution Reaction. Energy Technol. 2023, 11, 2201048. [Google Scholar] [CrossRef]
- Putri, L.K.; Ng, B.J.; Yeo, R.Y.Z.; Ong, W.J.; Mohamed, A.R.; Chai, S.P. Engineering Nickel Phosphides for Electrocatalytic Hydrogen Evolution: A Doping Perspective. Chem. Eng. J. 2023, 461, 141845. [Google Scholar] [CrossRef]
- Kumaravel, S.; Karthick, K.; Sam Sankar, S.; Karmakar, A.; Madhu, R.; Bera, K.; Kundu, S. Recent Progresses in Engineering of Ni and Co Based Phosphides for Effective Electrocatalytic Water Splitting. ChemElectroChem 2021, 8, 4638–4685. [Google Scholar] [CrossRef]
- Yan, L.; Jiang, H.; Xing, Y.; Wang, Y.; Liu, D.; Gu, X.; Dai, P.; Li, L.; Zhao, X. Nickel Metal–Organic Framework Implanted on Graphene and Incubated to Be Ultrasmall Nickel Phosphide Nanocrystals Acts as a Highly Efficient Water Splitting Electrocatalyst. J. Mater. Chem. A Mater. 2018, 6, 1682–1691. [Google Scholar] [CrossRef]
- Lu, Y.; Deng, Y.; Lu, S.; Liu, Y.; Lang, J.; Cao, X.; Gu, H. MOF-Derived Cobalt–Nickel Phosphide Nanoboxes as Electrocatalysts for the Hydrogen Evolution Reaction. Nanoscale 2019, 11, 21259–21265. [Google Scholar] [CrossRef]
- Dutta, A.; Pradhan, N. Developments of Metal Phosphides as Efficient OER Precatalysts. J. Phys. Chem. Lett. 2017, 8, 144–152. [Google Scholar] [CrossRef]
- Aziz, T.; Farid, A.; Haq, F.; Kiran, M.; Ullah, A.; Zhang, K.; Li, C.; Ghazanfar, S.; Sun, H.; Ullah, R.; et al. A Review on the Modification of Cellulose and Its Applications. Polymers 2022, 14, 3206. [Google Scholar] [CrossRef] [PubMed]
- Agarwal, U.P. Analysis of Cellulose and Lignocellulose Materials by Raman Spectroscopy: A Review of the Current Status. Molecules 2019, 24, 1659. [Google Scholar] [CrossRef]
- Kishore, B.; Shanmughasundaram, D.; Penki, T.R.; Munichandraiah, N. Coconut Kernel-Derived Activated Carbon as Electrode Material for Electrical Double-Layer Capacitors. J. Appl. Electrochem. 2014, 44, 903–916. [Google Scholar] [CrossRef]
- Mori, F.; Kubouchi, M.; Arao, Y. Effect of Graphite Structures on the Productivity and Quality of Few-Layer Graphene in Liquid-Phase Exfoliation. J. Mater. Sci. 2018, 53, 12807–12815. [Google Scholar] [CrossRef]
- Petrova, E.; Tinchev, S.; Nikolova, P. Interference Effects on the ID/IG Ratio of the Raman Spectra of Diamond-like Carbon Thin Films. arxiv 2011, arXiv:1112.0897. [Google Scholar] [CrossRef]
- Schüpfer, D.B.; Badaczewski, F.; Peilstöcker, J.; Guerra-Castro, J.M.; Shim, H.; Firoozabadi, S.; Beyer, A.; Volz, K.; Presser, V.; Heiliger, C.; et al. Monitoring the Thermally Induced Transition from Sp3-Hybridized into Sp2-Hybridized Carbons. Carbon. N. Y. 2021, 172, 214–227. [Google Scholar] [CrossRef]
- Kajama, M.N.; Nwogu, N.C.; Gobina, E. Hydrogen Permeation Using Nanostructured Silica Membranes. WIT Trans. Ecol. Environ. 2015, 193, 447–456. [Google Scholar] [CrossRef]
- Kumar, K.V.; Gadipelli, S.; Wood, B.; Ramisetty, K.A.; Stewart, A.A.; Howard, C.A.; Brett, D.J.L.; Rodriguez-Reinoso, F. Characterization of the Adsorption Site Energies and Heterogeneous Surfaces of Porous Materials. J. Mater. Chem. A Mater. 2019, 7, 10104–10137. [Google Scholar] [CrossRef]
- Mazzoni, A.D.; Conconi, M.S. Synthesis of Group IVB Metals Oxicarbides by Carboreduction Reactions. Mater. Res. 2002, 5, 459–466. [Google Scholar] [CrossRef]
- Schlender, P.; Adam, A.E.W. Combined Carboreduction-Iodination Reaction of TiO2 and FeTiO3 as the Basic Step toward a Shortened Titanium Production Process. Ind. Eng. Chem. Res. 2017, 56, 6572–6578. [Google Scholar] [CrossRef]
- Xiong, L.; Liu, B.; Wang, H.; Lin, X. Lignin-Derived CoO-Ni7P3@C Heterojunction Electrocatalysts with Excellent Oxygen Evolution Reaction Properties Prepared by a Simple and Scale-Up In Situ Method. Ind. Eng. Chem. Res. 2023, 62, 7040–7047. [Google Scholar] [CrossRef]
- Shanmugam, S.; Sivanantham, A.; Matsunaga, M.; Simon, U.; Osaka, T. Metal Phosphide Nanoparticles Embedded in Carbon as Efficient Electrocatalyst for Oxygen Evolution Reaction. Electrochim. Acta 2019, 297, 749–754. [Google Scholar] [CrossRef]
- Aziz, S.T.; Malik, B.; Sadhanala, H.K.; Gedanken, A.; Noked, M.; Nessim, G.D. Nickel-Rich Phosphide (Ni12P5) Nanosheets Coupled with Oxidized Multiwalled Carbon Nanotubes for Oxygen Evolution. ACS Appl. Nano Mater. 2020, 3, 10914–10921. [Google Scholar] [CrossRef]
- Tang, K.; Wang, X.; Wang, M.; Xie, Y.; Zhou, J.; Yan, C.; Tang, K.; Wang, X.; Wang, M.; Xie, Y.; et al. Ni/Fe Ratio Dependence of Catalytic Activity in Monodisperse Ternary Nickel Iron Phosphide for Efficient Water Oxidation. ChemElectroChem 2017, 4, 2150–2157. [Google Scholar] [CrossRef]
- Chen, B.X.; Tan, J.; Yie, Y.J.; Tang, S.R.; Deng, X.; Xie, H.Y.; Liu, W.T.; Liu, X.; Xu, W.Q.; Lin, C.C.; et al. Pure Phase Ni12P5 Anchored on N, P-Codoped Carbon Nanosheet: A Stable and Highly Efficient Catalyst to Reduce Toxic Organic Compounds for Continuous-Flow Application. Appl. Surf. Sci. 2023, 625, 157196. [Google Scholar] [CrossRef]
- Tian, F.Y.; Hou, D.; Zhang, W.M.; Qiao, X.Q.; Li, D.S. Synthesis of a Ni2P/Ni12P5 Bi-Phase Nanocomposite for the Efficient Catalytic Reduction of 4-Nitrophenol Based on the Unique n–n Heterojunction Effects. Dalton Trans. 2017, 46, 14107–14113. [Google Scholar] [CrossRef] [PubMed]
- Li, Y.; Xu, J.; Liu, Z.; Yu, H. Synthesis of Ni12P5 on Co3S4 Material for Effectively Improved Photocatalytic Hydrogen Production from Water Splitting under Visible Light. J. Mater. Sci. Mater. Electron. 2019, 30, 11694–11705. [Google Scholar] [CrossRef]
- Liu, L.; Wang, J.; Hou, Y.; Chen, J.; Liu, H.K.; Wang, J.; Wu, Y. Self-Assembled 3D Foam-Like NiCo2O4 as Efficient Catalyst for Lithium Oxygen Batteries. Small 2016, 12, 602–611. [Google Scholar] [CrossRef] [PubMed]
- Cheng, M.; Fan, H.; Song, Y.; Cui, Y.; Wang, R. Interconnected Hierarchical NiCo2O4 Microspheres as High-Performance Electrode Materials for Supercapacitors. Dalton Trans. 2017, 46, 9201–9209. [Google Scholar] [CrossRef]
- Yu, J.; Zhong, Y.; Wu, X.; Sunarso, J.; Ni, M.; Zhou, W.; Shao, Z. Bifunctionality from Synergy: CoP Nanoparticles Embedded in Amorphous CoOx Nanoplates with Heterostructures for Highly Efficient Water Electrolysis. Adv. Sci. 2018, 5, 1800514. [Google Scholar] [CrossRef]
- Peng, L.; Shah, S.S.A.; Wei, Z. Recent Developments in Metal Phosphide and Sulfide Electrocatalysts for Oxygen Evolution Reaction. Chin. J. Catal. 2018, 39, 1575–1593. [Google Scholar] [CrossRef]
- Zhang, P.; Qiu, H.; Li, H.; He, J.; Xu, Y.; Wang, R. Nonmetallic Active Sites on Nickel Phosphide in Oxygen Evolution Reaction. Nanomaterials 2022, 12, 1130. [Google Scholar] [CrossRef]
- Sun, H.; Min, Y.; Yang, W.; Lian, Y.; Lin, L.; Feng, K.; Deng, Z.; Chen, M.; Zhong, J.; Xu, L.; et al. Morphological and Electronic Tuning of Ni 2 P through Iron Doping toward Highly Efficient Water Splitting. ACS Catal. 2019, 9, 8882–8892. [Google Scholar] [CrossRef]
- Mattick, V.F.; Jin, X.; White, R.E.; Huang, K. Understanding the Role of Carbon in Alkaline Oxygen Electrocatalysis: A Case Study on La0.6Sr0.4CoO3-δ/Vulcan Carbon Composite Electrocatalyst. Int. J. Hydrogen Energy 2019, 44, 2760–2769. [Google Scholar] [CrossRef]

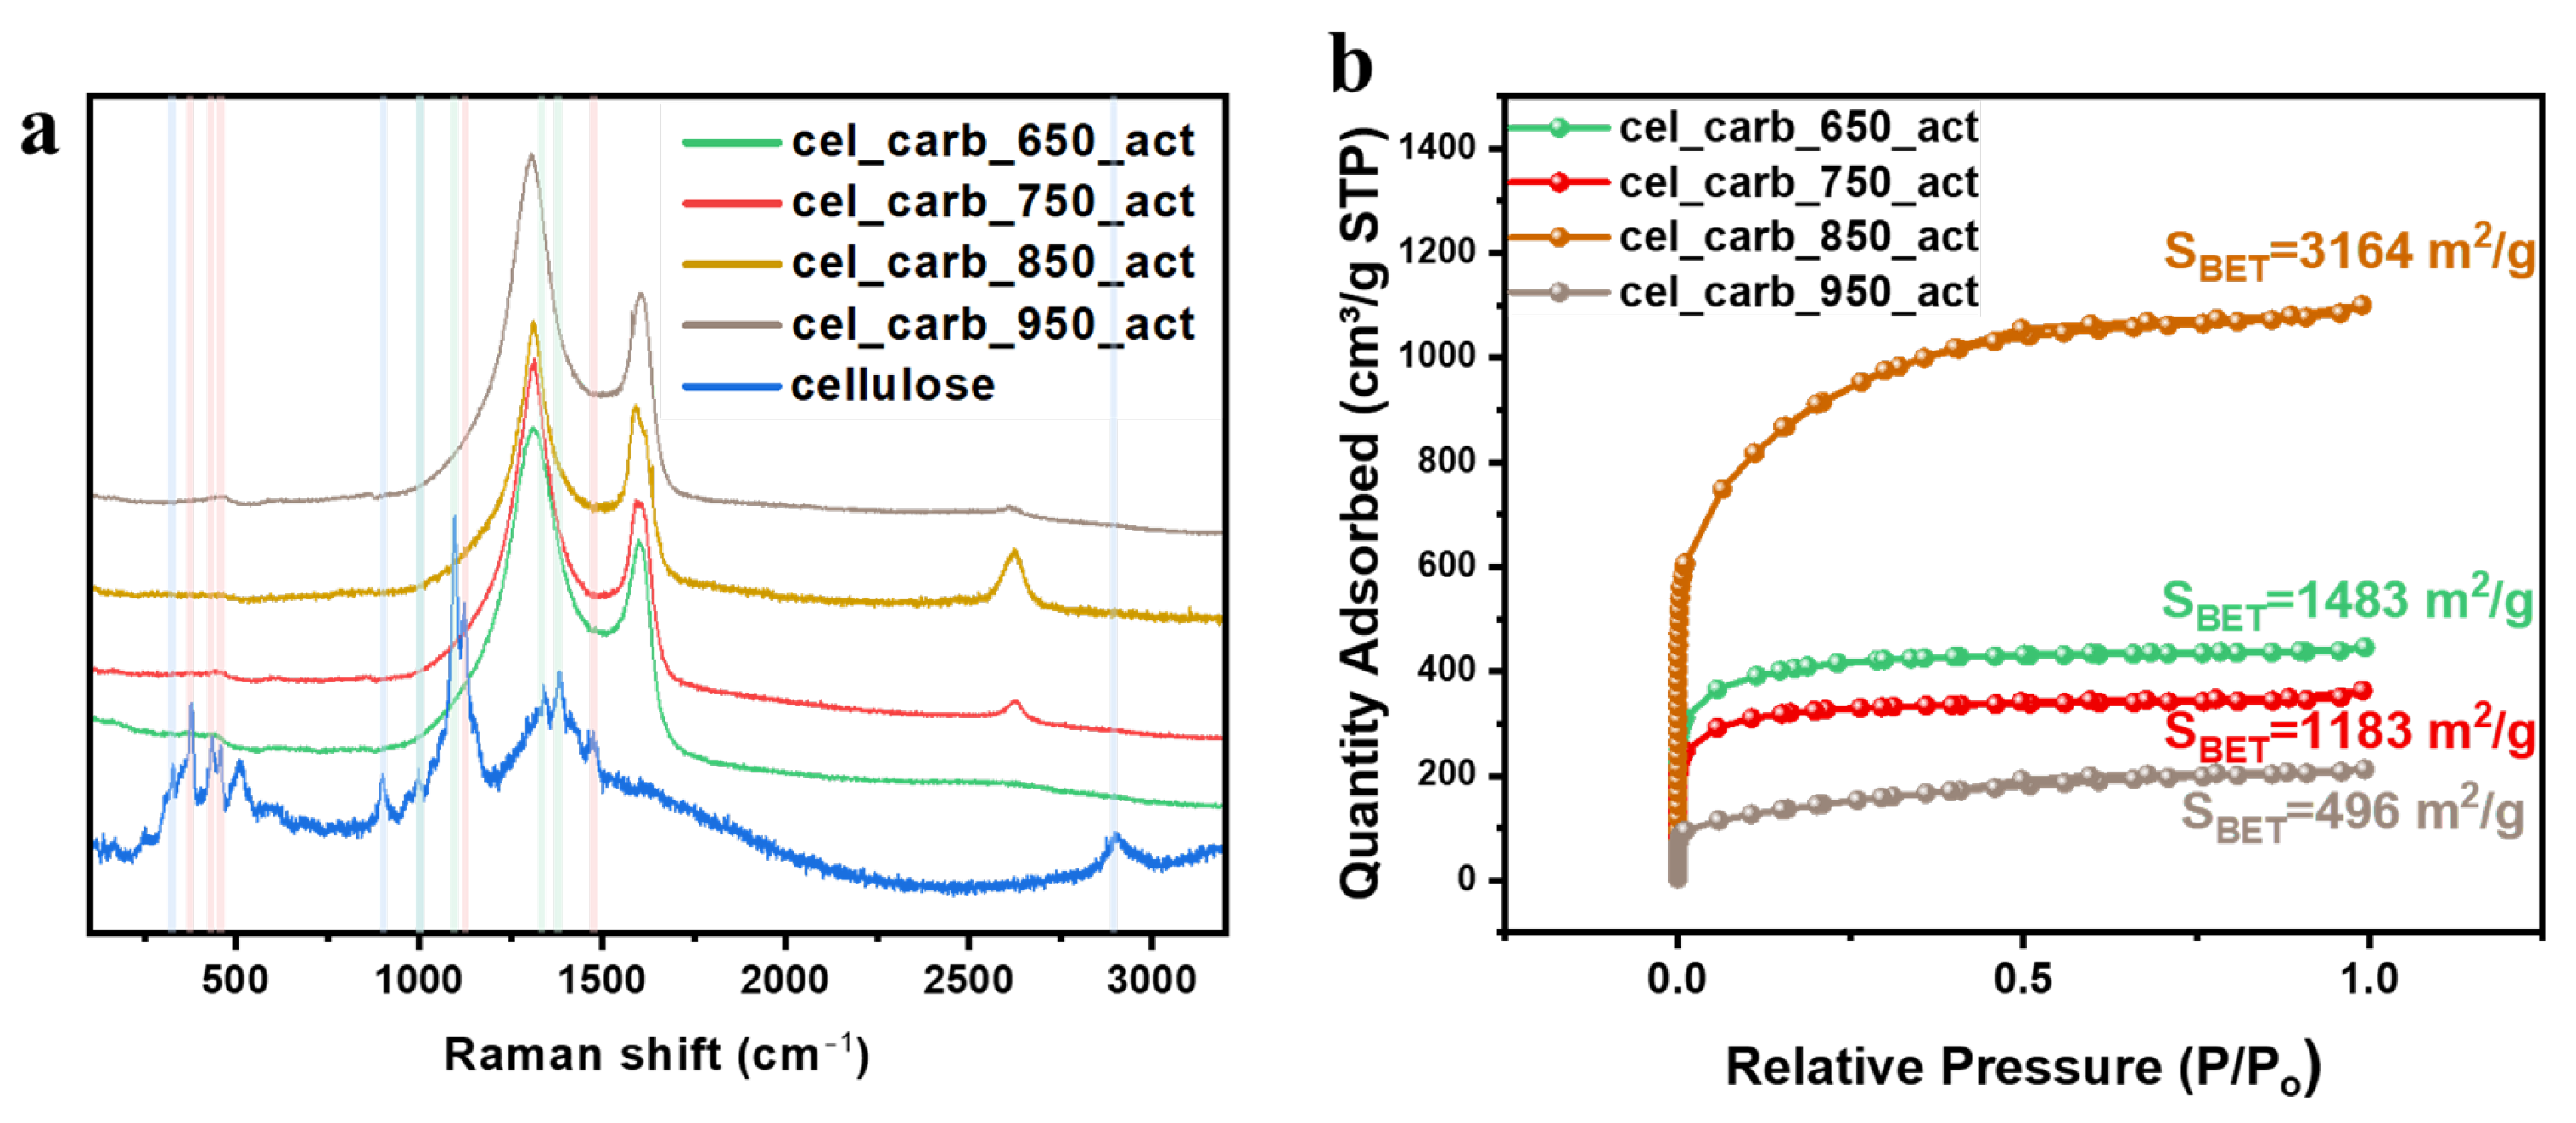
| Sample | ID/IG | Specific Surface Area (m2/g) | Micropore Volume (cm3/g) | Micropore Area (m2/g) |
|---|---|---|---|---|
| cel_carb_650_act | 1.41 | 1483 | 0.46 | 1100 |
| cel_carb_750_act | 1.56 | 1183 | 0.38 | 904 |
| cel_carb_850_act | 1.39 | 3164 | 2.25 | 2543 |
| cel_carb_950_act | 1.53 | 496 | 0.29 | 548 |
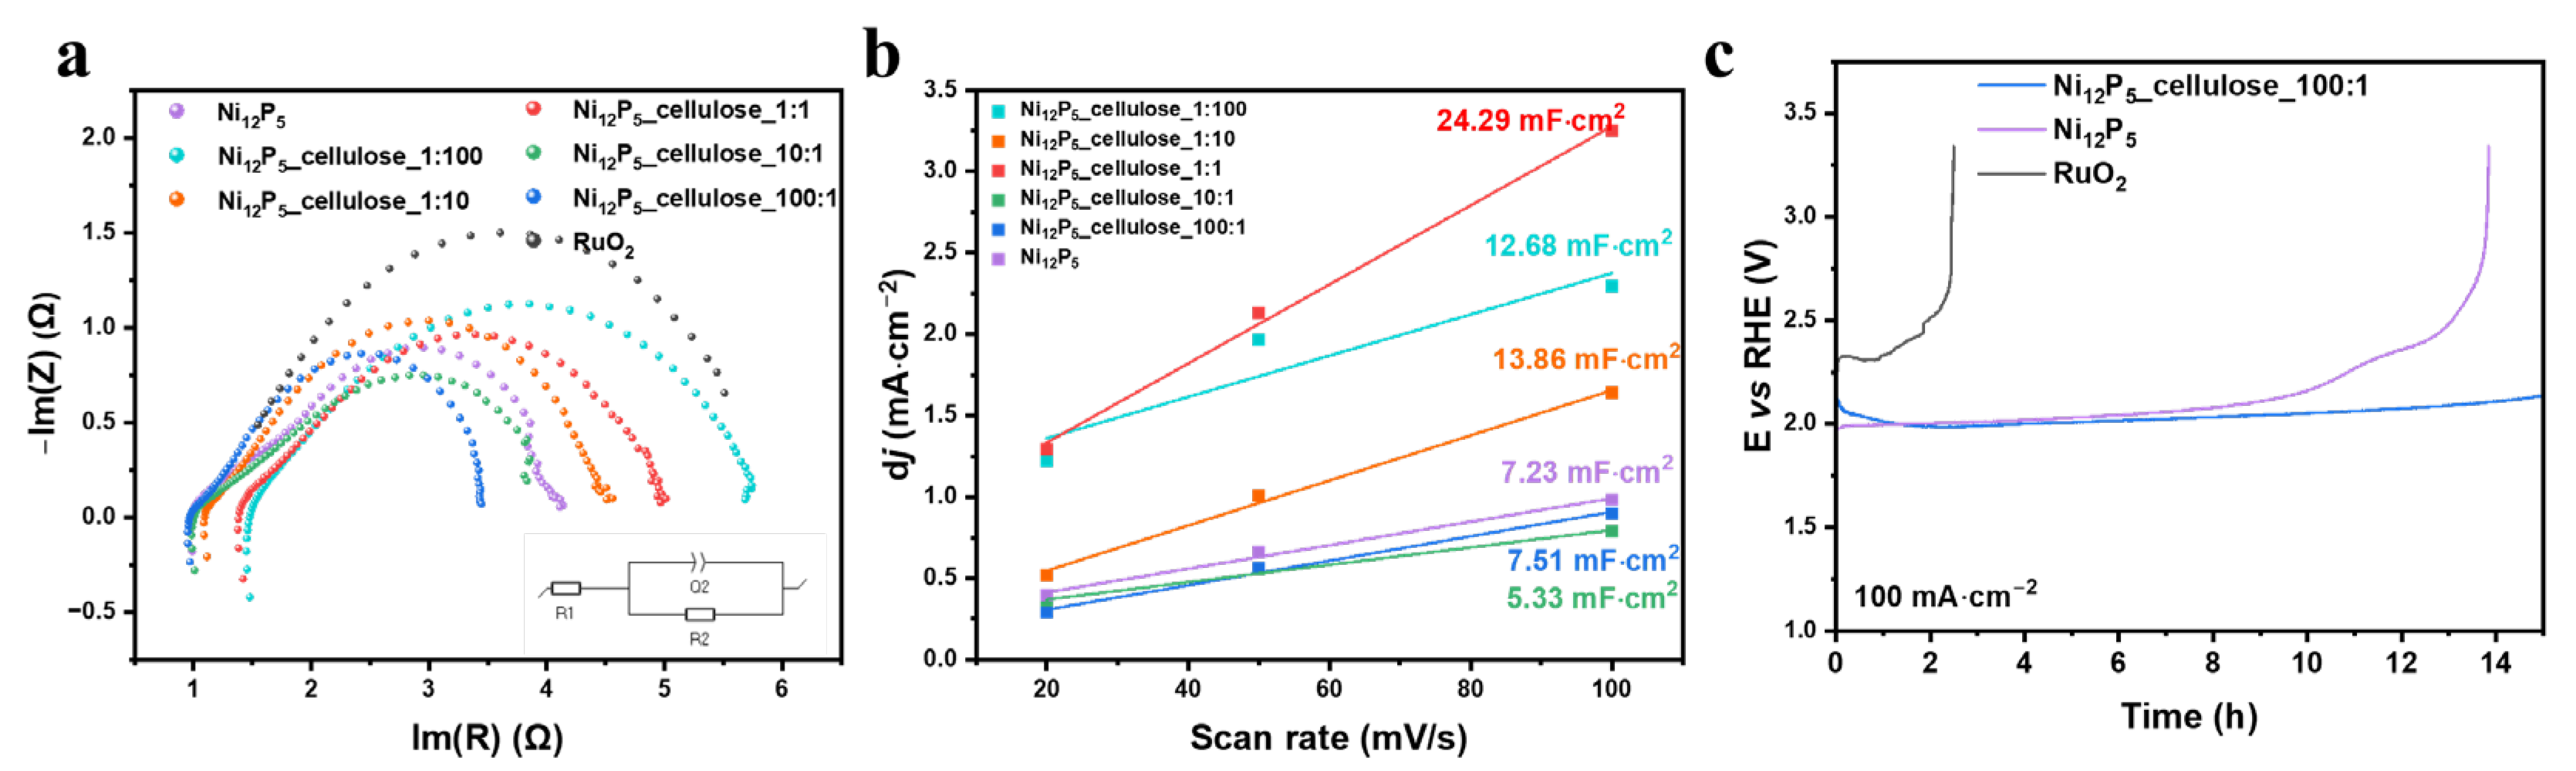
| R1 | R2 | Q2 | |
|---|---|---|---|
| Ni12P5 | 0.988 | 3.47 | 0.02771 |
| Ni12P5_cellulose_1:100 | 1.470 | 4.473 | 0.00993 |
| Ni12P5_cellulose_1:10 | 1.128 | 3.542 | 0.001172 |
| Ni12P5_cellulose_1:1 | 1.400 | 3.770 | 0.01152 |
| Ni12P5_cellulose_10:1 | 1.002 | 3.758 | 0.0090 |
| Ni12P5_cellulose_100:1 | 1 | 2.701 | 0.0031 |
| RuO2 | 1.131 | 3.927 |
Disclaimer/Publisher’s Note: The statements, opinions and data contained in all publications are solely those of the individual author(s) and contributor(s) and not of MDPI and/or the editor(s). MDPI and/or the editor(s) disclaim responsibility for any injury to people or property resulting from any ideas, methods, instructions or products referred to in the content. |
© 2024 by the authors. Licensee MDPI, Basel, Switzerland. This article is an open access article distributed under the terms and conditions of the Creative Commons Attribution (CC BY) license (https://creativecommons.org/licenses/by/4.0/).
Share and Cite
Mijowska, E.; Pietrusewicz, K.; Maślana, K. Highly Porous Carbon Flakes Derived from Cellulose and Nickel Phosphide Heterostructure towards Efficient Electrocatalysis of Oxygen Evolution Reaction. Molecules 2024, 29, 352. https://doi.org/10.3390/molecules29020352
Mijowska E, Pietrusewicz K, Maślana K. Highly Porous Carbon Flakes Derived from Cellulose and Nickel Phosphide Heterostructure towards Efficient Electrocatalysis of Oxygen Evolution Reaction. Molecules. 2024; 29(2):352. https://doi.org/10.3390/molecules29020352
Chicago/Turabian StyleMijowska, Ewa, Karolina Pietrusewicz, and Klaudia Maślana. 2024. "Highly Porous Carbon Flakes Derived from Cellulose and Nickel Phosphide Heterostructure towards Efficient Electrocatalysis of Oxygen Evolution Reaction" Molecules 29, no. 2: 352. https://doi.org/10.3390/molecules29020352
APA StyleMijowska, E., Pietrusewicz, K., & Maślana, K. (2024). Highly Porous Carbon Flakes Derived from Cellulose and Nickel Phosphide Heterostructure towards Efficient Electrocatalysis of Oxygen Evolution Reaction. Molecules, 29(2), 352. https://doi.org/10.3390/molecules29020352