Article

Abietane Diterpenes from Medusantha martiusii and Their Anti-Neuroinflammatory Activity

by
Edileuza B. de Assis
1,
Rodrigo S. de Andrade
1,
Joanda P. R. e Silva
1,
Lucas H. Martorano
2,
Geraldo M. W. Amorim
1,
Paulo B. A. Loureiro
1,
Lucas S. Abreu
2,
Marianna V. Sobral
1,
Marcus T. Scotti
1,
Fernando M. dos Santos Junior
2,
Maria de Fátima Agra
1,
Josean F. Tavares
1,* and
Marcelo S. da Silva
1,*
1
Postgraduate Program in Natural and Synthetic Bioactive Products, Federal University of Paraiba, João Pessoa 58051-900, Brazil
2
Department of Organic Chemistry, Fluminense Federal University, Niterói 24020-141, Brazil
*
Authors to whom correspondence should be addressed.
Molecules 2024, 29(12), 2723; https://doi.org/10.3390/molecules29122723
Submission received: 10 May 2024 / Revised: 23 May 2024 / Accepted: 27 May 2024 / Published: 7 June 2024
(This article belongs to the Section Natural Products Chemistry)

Abstract

:
Seven new abietane diterpenoids, comprising medusanthol A–G (13, 5, 79) and two previously identified analogs (4 and 6), were isolated from the hexane extract of the aerial parts of Medusantha martiusii. The structures of the compounds were elucidated by HRESIMS, 1D/2D NMR spectroscopic data, IR spectroscopy, NMR calculations with DP4+ probability analysis, and ECD calculations. The anti-neuroinflammatory potential of compounds 17 was evaluated by determining their ability to inhibit the production of nitric oxide (NO) and the proinflammatory cytokine TNF-α in BV2 microglia stimulated with LPS and IFN-γ. Compounds 14 and 7 exhibited decreased NO levels at a concentration of 12.5 µM. Compound 1 demonstrated strong activity with an IC50 of 3.12 µM, and compound 2 had an IC50 of 15.53 µM; both compounds effectively reduced NO levels compared to the positive control quercetin (IC50 11.8 µM). Additionally, both compounds significantly decreased TNF-α levels, indicating their potential as promising anti-neuroinflammatory agents.

Graphical Abstract

1. Introduction

The Lamiaceae family, which consists of plants and shrubs, is composed of approximately 258 genera and 7193 species. In Brazil, over 500 species from the Lamiaceae family are distributed across 46 genera, with nearly half of these species belonging to the subfamily Nepetoideae [1,2], which is a well-known source of abietane-type diterpenoids [3,4]. The broad spectrum of biological activities associated with these compounds has garnered special attention, with many demonstrating anti-inflammatory [5], anticancer [6], antimicrobial [7], and antiprotozoal [8] properties.
Medusantha martiusii (Benth.) Harley and J. F. B. Pastore (syn: Hyptis martiusii), commonly known as “cidreira brava” or “cidreira-do-campo,” is a shrub native and endemic to Brazil and belongs to the subfamily Nepetoideae. This species is predominantly found in the Northeast region, specifically in the Caatinga, a unique semiarid biome exclusive to Brazil. In traditional Brazilian medicine, the infusion or decoction of M. martiusii leaves is used to combat intestinal and stomach disorders, while the decoction of roots is commonly used to combat inflammation of the ovaries [9,10]. Previous phytochemical investigations of M. martiusii have documented the isolation of abietane diterpenes from its roots and aerial parts, as well as the phytochemical profiling of its essential oil and its pharmacological activities [11,12,13,14]. However, to the best of our knowledge, there is no evidence in the literature with respect to the anti-inflammatory activity of the isolated compounds. As part of our investigation into species from the Brazilian semiarid region, we conducted a chemical reinvestigation of M. martiusii, which led to the isolation of nine abietane diterpenes, including seven previously undescribed compounds named medusanthol A–G (13, 5, 79) and two known analogs (4 and 6). Here, we describe the isolation, structural elucidation, and anti-neuroinflammatory activity of these isolates.

2. Results and Discussion

2.1. Structure Elucidation of the Compounds

The hexanic extract of the aerial parts was fractionated into six fractions by vacuum liquid chromatography. The EtOAc fraction was purified using HPLC, yielding seven previously unknown (13, 5, 79) and two known (4 and 6) abietanes (Figure 1).
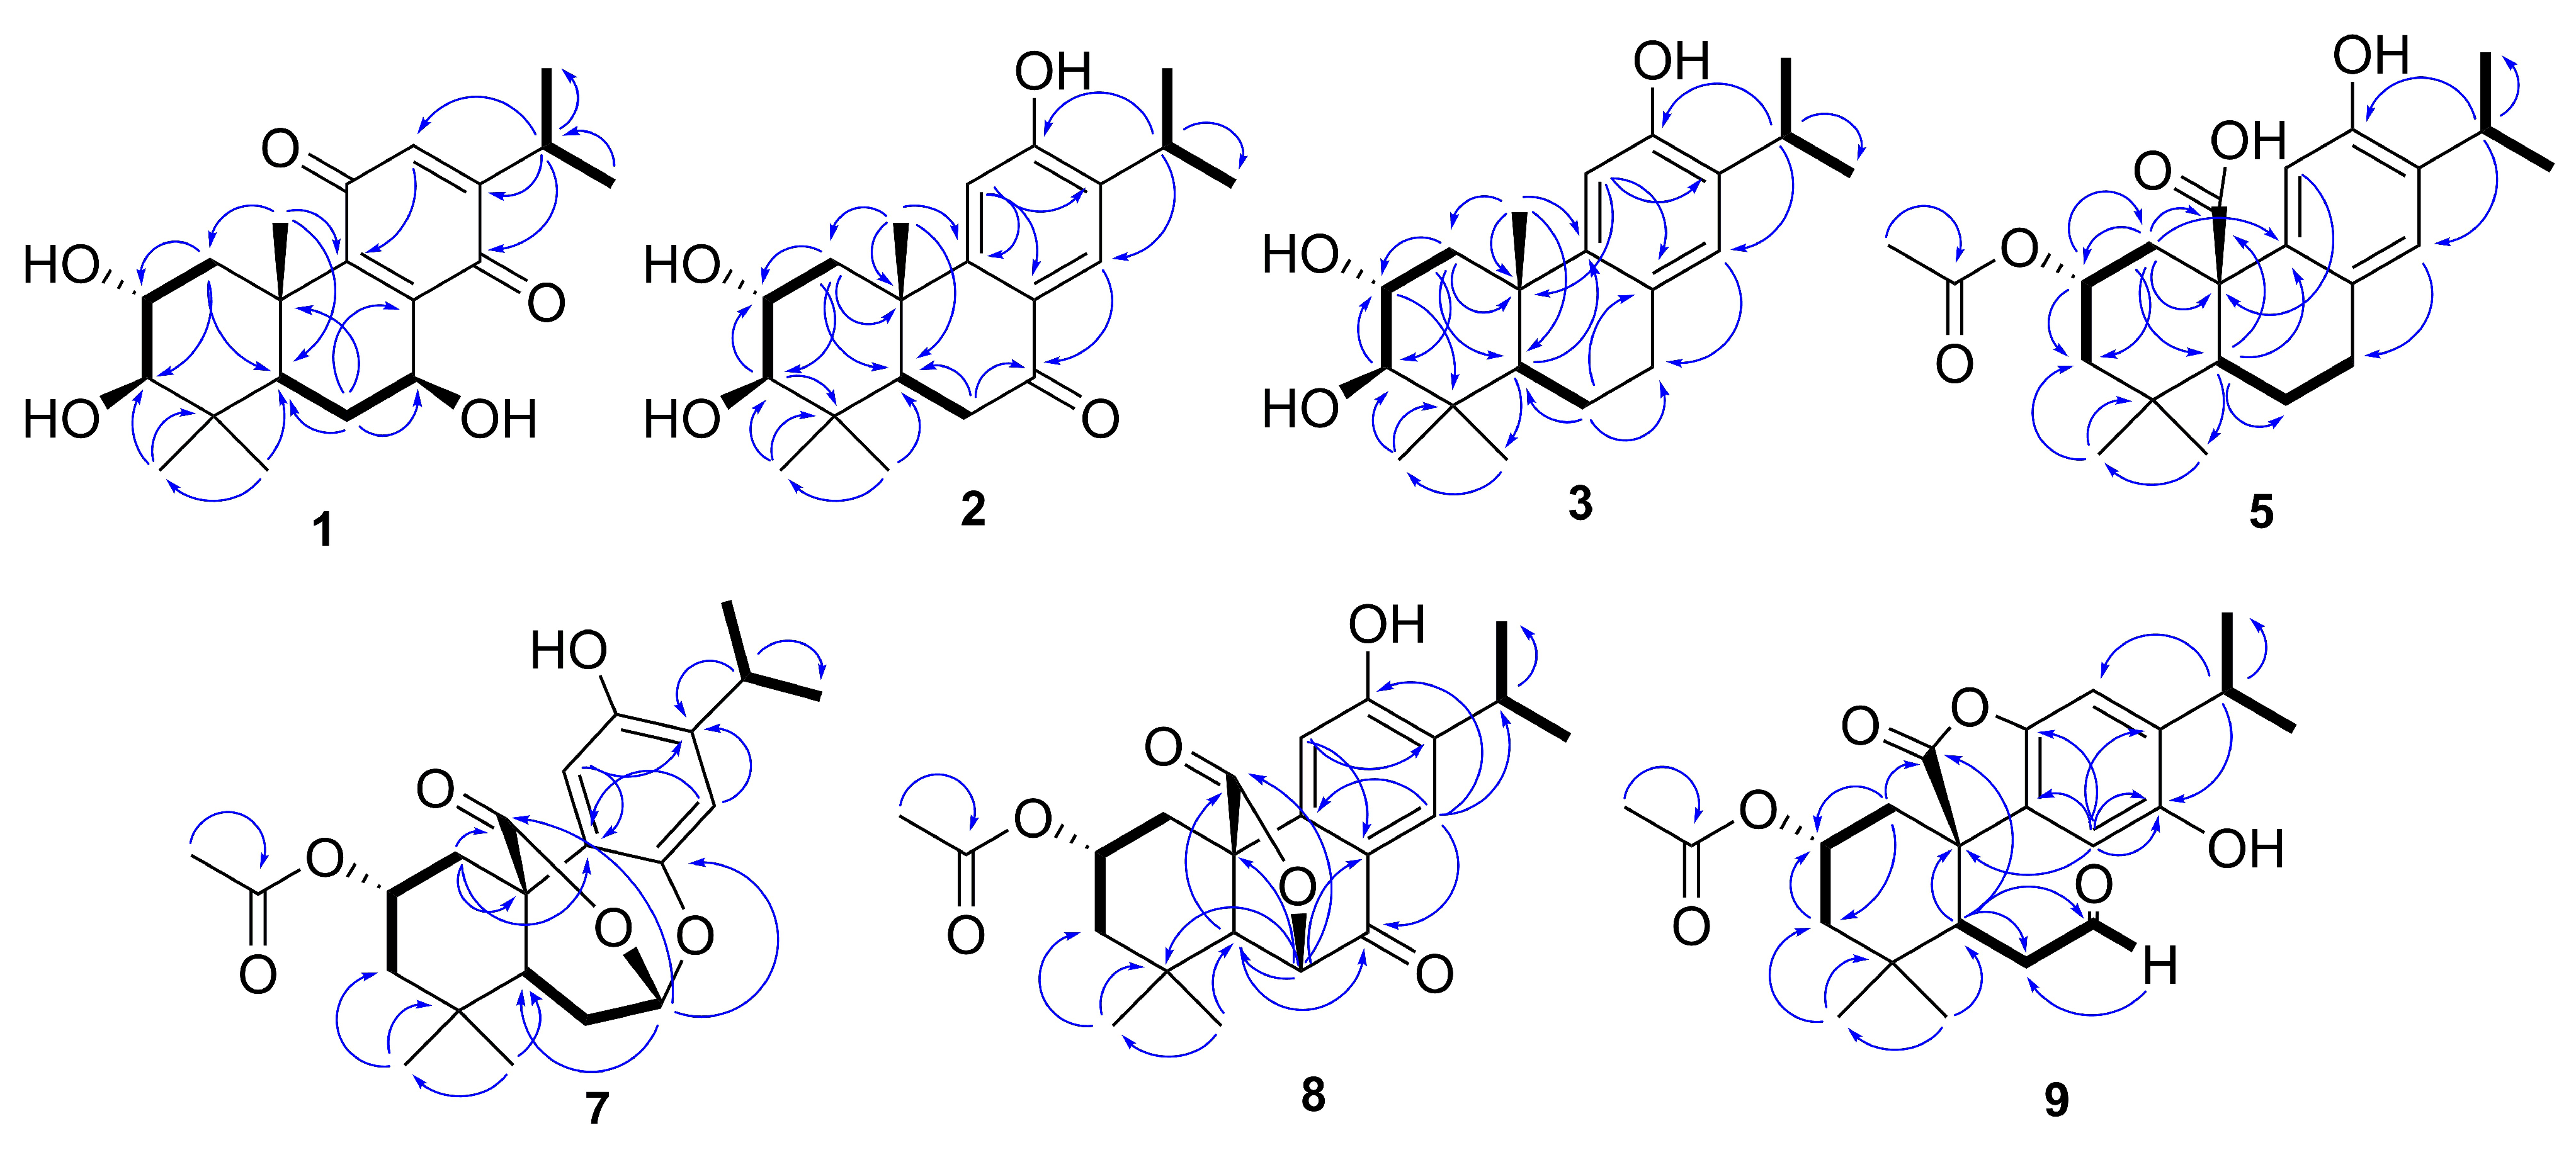
Compound 1 was isolated as an amorphous brown powder and assigned the molecular formula C20H28O5 based on its HRESIMS ion at m/z 331.1896 ([M − H2O + H]+, calcd for C20H27O4, 331.1904, Δ = 2.2 ppm), corresponding to seven degrees of hydrogen deficiency. The IR spectrum displayed absorption bands for hydroxy (3363 cm−1) and conjugated keto carbonyl (1706 and 1645 cm−1) groups. The 13C NMR (Table 1) spectrum exhibited resonances for 20 carbons, including signals for two conjugated carbonyls at δC 188.0 and 190.1 and four olefinic carbons (three non-hydrogenated at δC 141.9, 150.6, and 153.6, and one hydrogenated at δC 132.4), consistent with the presence of a para-benzoquinone unit [15]. With the aid of the HSQC experiment, the remaining signals were assigned to five methyl carbons (δC 21.5, 21.4, 28.8, 17.0, 21.1), two methylene carbons (δC 42.3, 26.1), five methine carbons (including three sp3 oxymethine at δC 82.8, 68.8, and 67.9 and one nonoxygenated sp3 methine at δC 48.3), and two quaternary carbons (δC 38.9, 40.0). An analysis of 1H NMR data (Table 2) revealed the presence of an isopropyl group connected to para-benzoquinone through the signals of a methine hydrogen at δH 2.97 (1H, m, H-15) and two methyl groups at δH 1.10 and 1.08 (6H, s, H3-16/H3-17) [12]. Similarly, signals for three oxymethine hydrogens at δH 4.79 (1H, dd, J = 10.2, 7.5 Hz, H-7), δH 3.01 (1H, d, J = 9.6 Hz, H-3), and δH 3.82 (1H, ddd, J = 11.5, 9.6, 4.4 Hz, H-2) were observed, as shown in Table 1. Based on the HSQC spectrum, the signal at δH 6.36 (1H, d, J = 1.2 Hz, H-12) was attributed to the olefinic hydrogen of the para-benzoquinone unit, the signals for methylene hydrogens at δH 1.15 (1H, m) and 3.06 (1H, dd, J = 12.7, 4.4 Hz) were assigned to H2-1, and δH 2.20 (1H, m) and 1.64 (1H, m) were assigned to H2-6. The aforementioned evidence suggests that compound 1 is an abietane quinone. In the HMBC spectrum, the correlations of the signal at δH 1.40 (3H, s) with the carbons at δC 42.3, 48.3, and 150.6 defined the methyl group CH3-20 and the chemical shifts of carbons C-1, C-5, and C-9, respectively (Figure 2).
Furthermore, the correlations of the signals at δH 1.07 and 0.91 (6H, s, H3-18/H3-19) with the carbon signals at δC 38.9, 82.8, and 48.3 identified the two geminal methyl groups linked to C-4 and defined the chemical shifts of carbons C-4, C-3, and C-5, respectively. The presence of vicinal hydroxyl groups at C-2 and C-3 in the A ring of compound 1 was supported by the HSQC correlations of the oxymethine proton at δH 3.01 (1H, d, J = 9.6 Hz, H-3) with carbon at δC 82.8 (C-3), as well as the spin system H2-1(δH 3.01)/H-2/H-3 observed in the COSY spectrum. The correlation between the signals at δH 4.79 (1H, dd, J = 10.2, 7.5 Hz, H-7) and δC 67.9 (C-7) in the HSQC spectrum suggested the presence of a third hydroxyl group at C-7. The correlation of H-5/H2-6/H-7 in the COSY spectrum established the location of the hydroxyl group at this position. The correlations of the methine proton H-12 (δH 6.36, d, J = 1.2 Hz) with C-9, C-14, and C-15 and H-15 (δH 2.97, m) with C-12, C-14, C-16, and C-17 in the HMBC spectrum substantiated the attachment of the isopropyl group to para-benzoquinone and suggested that the quaternary carbon at δC 188.0 was linked to C-11.
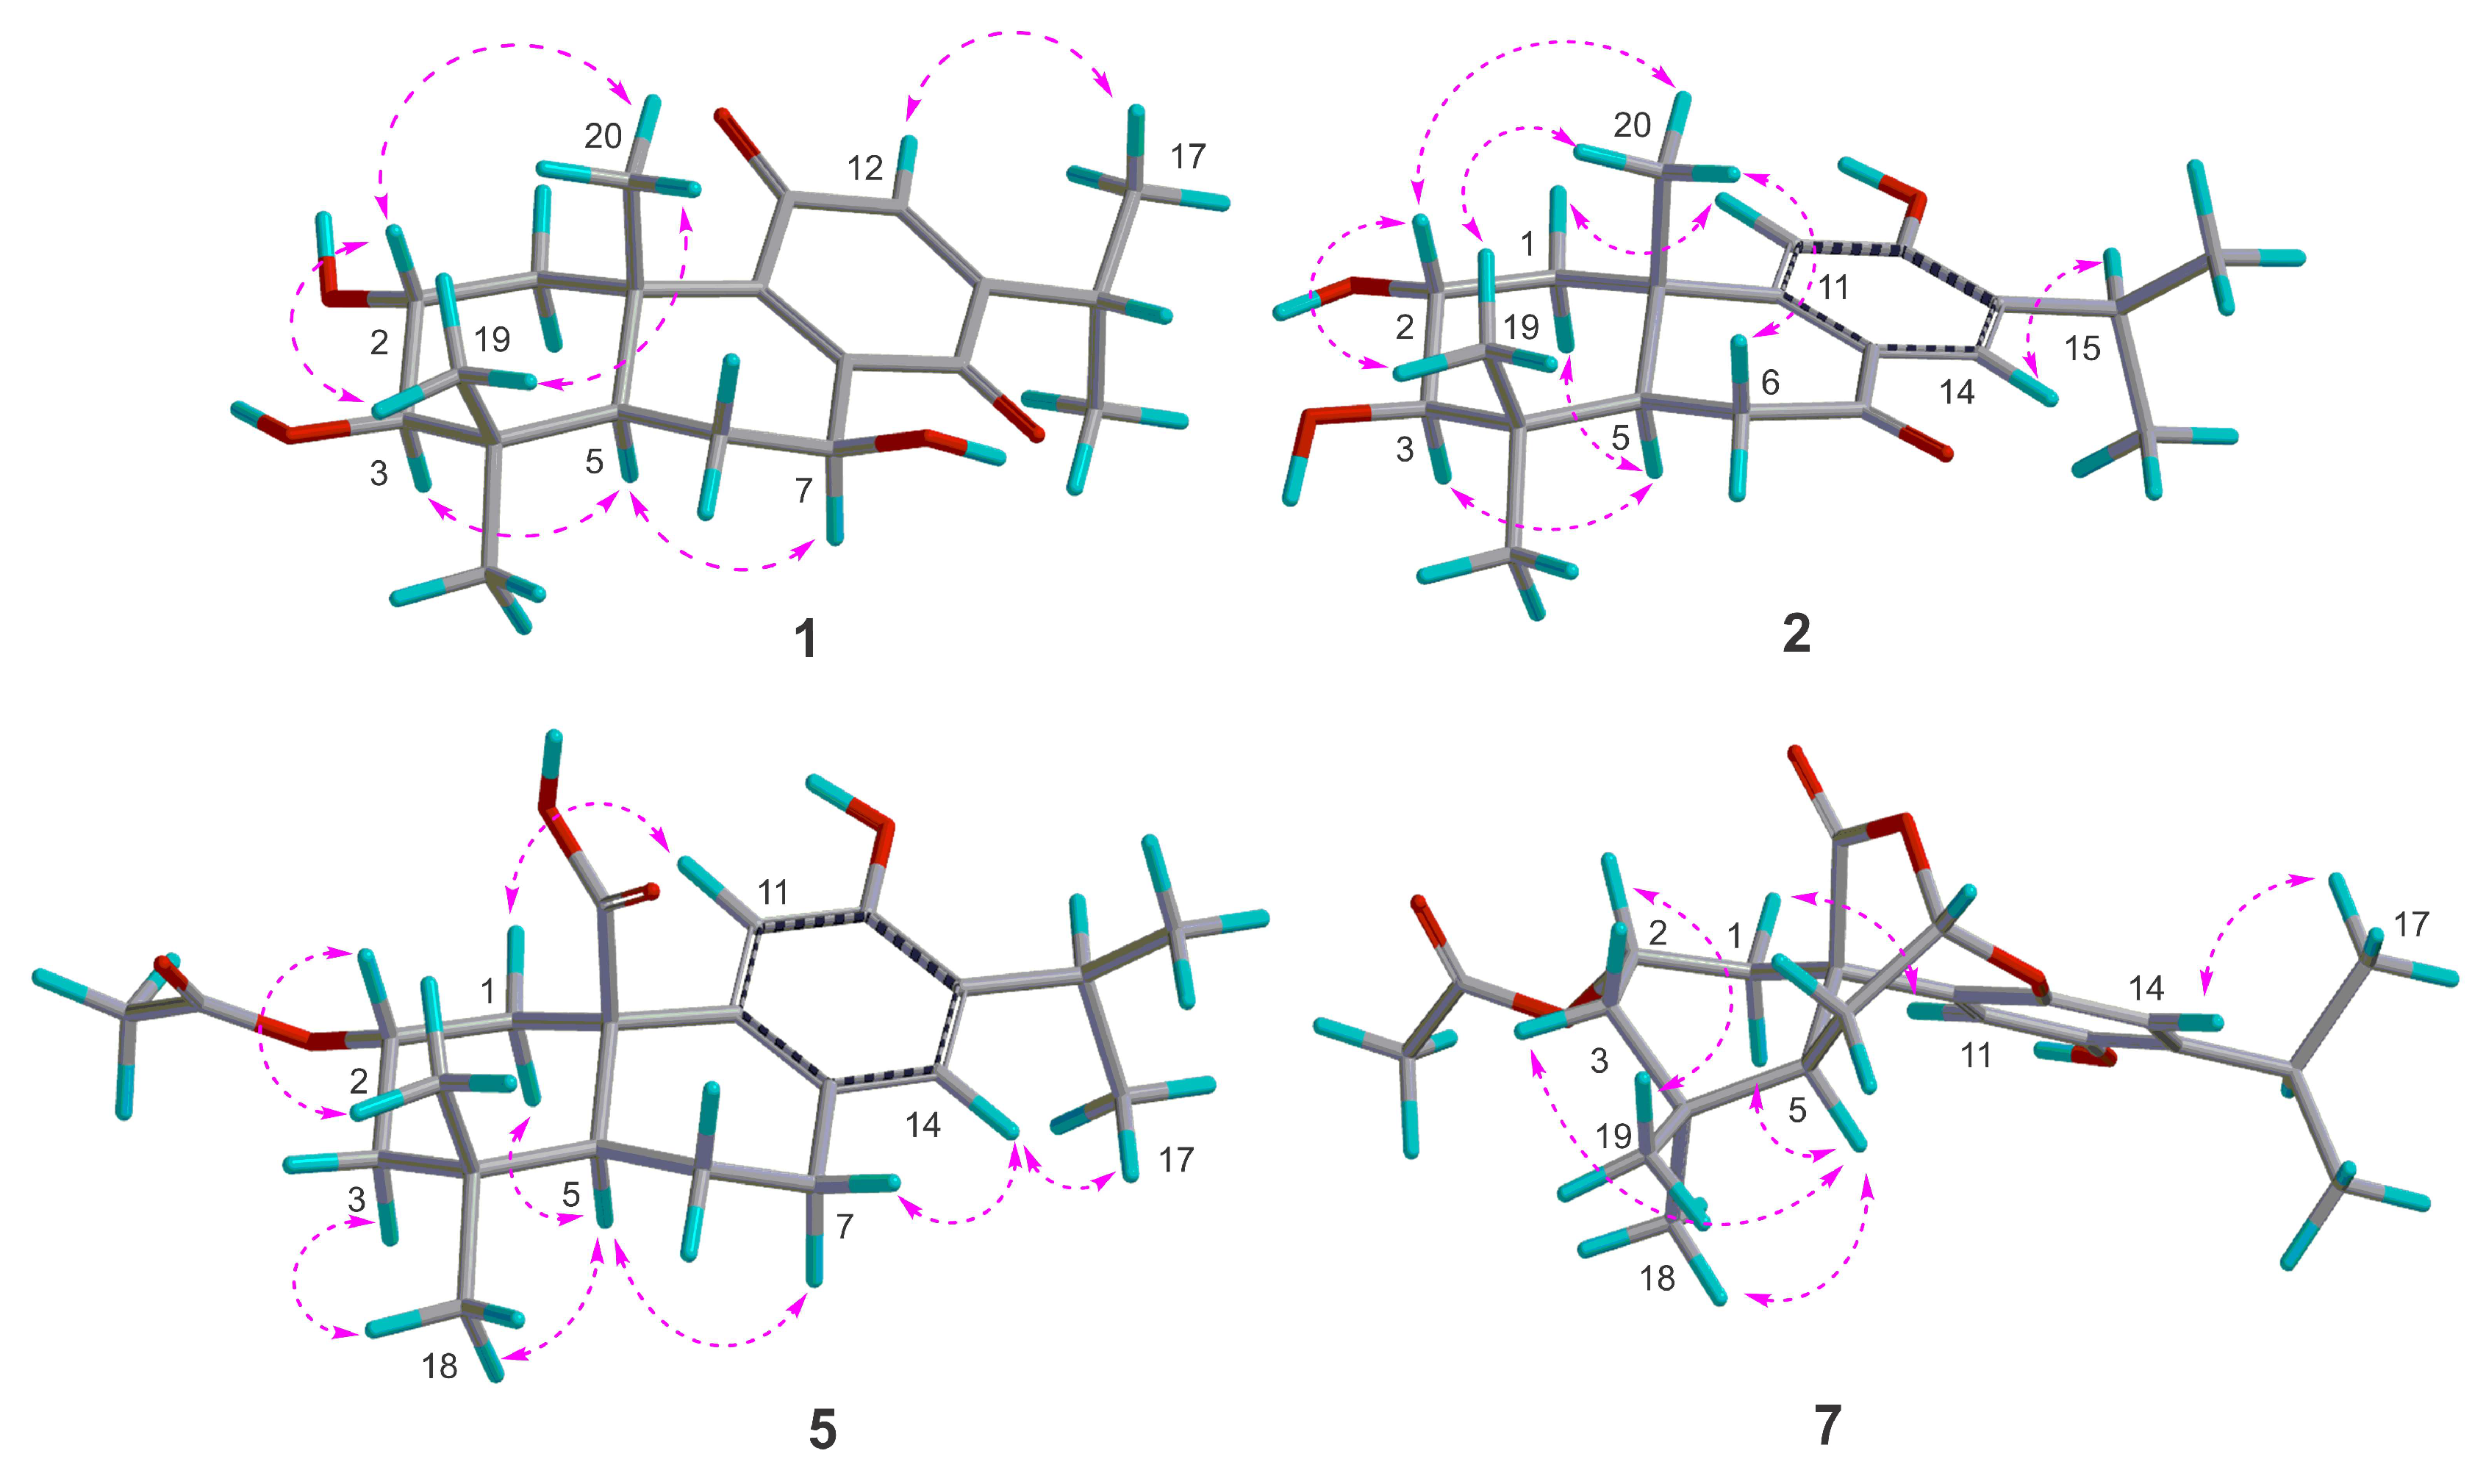
Based on biosynthetic considerations and chemotaxonomic data, this study provides support for the connection between transfused A/B rings in abietanes of the genus Medusantha, with CH3-20 β-axial and H-5 α-axial rings [11,12,13,16,17,18]. The relative configuration of compound 1 was determined through NOESY correlations and coupling constant analysis (Figure 3). The NOESY correlation with H-2/H3-19/H3-20 confirmed the cofacial arrangement of these protons, confirming their β orientation. Furthermore, a coupling constant of 9.6 Hz, consistent with an approximate dihedral angle of 168° between H-2 (ddd, J = 11.5, 9.6, 4.4 Hz) and H-3 (d, J = 9.6 Hz), supported the proposition of a trans-diaxial orientation of these protons, indicating an α-axial orientation for H-3. The NOESY correlation of H-5/H-7 confirmed the β orientation of the 7-OH. To corroborate the proposed relative configuration for C-2, C-3, and C-7, 1H and 13C NMR data for eight isomers (1a–1h) were calculated using the gauge including atomic orbital (GIAO) method at the GIAO-mPW1PW91/6-31+G(d,p) level and then subjected to DP4+ probability analysis. The isomer (2R*,3R*,5R*,7S*,10S*)–1h exhibited a DP4+ probability of 100% (Figure S150). The absolute configuration was determined by comparing the experimental and calculated ECD data and was assigned as 2R,3R,5R,7S,10S (Figure 4). Thus, compound 1 was identified as a new abietane named medusanthol A.
Compound 2 was obtained as a white amorphous powder and exhibited a molecular formula of C20H28O4 with seven degrees of hydrogen deficiency, as determined by its HRESIMS peak at m/z 687.3863 [2M + Na]+ (calcd for C40H56NaO8, 687.3867, Δ = 0.6 ppm). The IR spectrum showed bands attributed to hydroxyl groups (3448 cm−1), conjugated keto carbonyl groups (1658 cm−1), and aromatic rings (1595 and 1460 cm−1). The 13C NMR spectrum exhibited 20 carbon signals (Table 1), including resonances assigned to one conjugated keto carbonyl carbon (δC 200.6), six aromatic carbons (two sp2 methine carbons at δC 110.6 and 127.3), two sp3 methine carbons (δC 50.3 and 27.9), and five methyl groups, as shown in Table 1. In the 1H NMR spectrum, a septet at δH 3.22 (1H, J = 6.8 Hz, H-15) and two doublet methyl groups at δH 1.19 (3H, d, J = 6.8 Hz, H-16) and 1.21 (3H, d, J = 6.8 Hz, H-17) suggested the presence of an isopropyl group characteristic of the diterpene abietane. Furthermore, the singlets at δH 6.76 (1H, H-11) and 7.80 (1H, H-14) were assigned to the para-aromatic hydrogens of the tetrasubstituted C ring (Table 2).
Analysis of the NMR data of compound 2 indicated a close resemblance to 6, identified as 2α-hydroxysugiol, a recognized aromatic abietane [19]. The only distinction between the two compounds was the replacement of a methylene carbon signal at δC 50.4 in C-3 with an oxymethine carbon at δC 83.5, suggesting the presence of an additional hydroxyl group at this position in compound 2. In the HMBC spectrum, the correlation between δH 1.06 and 0.98 (6H, s, H3-18/H3-19) and C-3 (δC 83.5) confirmed the presence of the proposed connectivity (Figure 2). Similar to medusanthol A (1), compound 2 also contained vicinal hydroxyl groups attached to C-2 (δC 69.4) and C-3 (δC 83.5). Additionally, the correlation between the signal at δH 7.80 (1H, s, H-14) and the carbon at δC 200.6 in the HMBC spectrum confirmed the insertion of the carbonyl group at C-7. The NOESY correlations were consistent with the same relative configuration as medusanthol A (1). The NOESY correlations of H-2/H3-19/H3-20 and H-3/H-5, as well as the coupling constant 3JH-2/H-3 = 9.2 Hz, suggested that H-2/H3-19/H3-20 were β-oriented, while H-3/H-5 adopted the α orientation (Figure 3). NMR shift calculations and DP4+ probability analysis supported the relative configuration assigned, with 100% probability ascribed to the 2R*,3R*,5R*,10S*–2b isomer (Figure S153). The absolute configuration was determined by comparing the experimental and calculated ECD data, and the products were assigned as 2R,3R,5R,10S (Figure 4). Accordingly, compound 2 was designated medusanthol B.
Compound 3, a needle crystal, was shown to have a molecular formula of C20H30O2 according to its HRESIMS peak at m/z 659.4276 ([2M + Na]+, calcd for C40H60NaO6, 659.4282, Δ = 0.9 ppm), indicating six degrees of hydrogen deficiency. In the IR spectrum, characteristic absorption bands were observed for a hydroxyl group (3361 cm−1) and an aromatic ring (1618 and 1425 cm−1). The 1D and 2D NMR data revealed that compound 3 is also an aromatic abietane, displaying significant structural similarity to medusanthol B (2), except for the substitution of the carbonyl group at δC 200.6 for the methylene carbon at δC 31.1 in C-7 (Table 1). In the 1H NMR spectrum, the shielding of the aromatic proton H-14 (δH 6.75, 1H, s) compared to that of medusanthol B (2) (Table 2), along with the cross-peak of H-14 with C-7 (δC 31.1) in the HMBC spectrum, supported the absence of a carbonyl group at C-7 (Figure 2).
Further comprehensive analysis of the NMR data revealed that compound 3 shares an identical planar structure with 2,3-dihydroxyferruginol, which was isolated from the leaves of Podocarpus nagi [20]. The only distinction between these compounds is observed in the configuration at the C-2 center, suggesting a potential stereoisomer. In the NOESY spectrum, correlations between H-2 and H3-19/H3-20, along with those between H-3 and H-5/H3-18, allowed the determination of the α orientation of the 2-OH in compound 3, which contrasts with the β orientation reported for this group in 2,3-dihydroxyferruginol. Furthermore, the 9.6 Hz coupling constant between H-2 and H-3 in compound 3 is distinct from the 2.9 Hz observed for these protons in 2,3-dihydroxyferruginol, further substantiating the aforementioned proposition. NMR calculations and DP4+ analyses supported the relative configuration of 3 as 2R*,3R*,5R*,10S*–3b with a probability of 100% (Figure S156). Ultimately, the absolute configuration was determined to be 2R,3R,5R,10S by comparing the experimental and calculated ECD data (Figure 4), suggesting that 3 is an epimer of 2,3-dihydroxyferruginol. Biogenetically, the configuration of 3 is proposed to be the same as that of 1 and 2. Therefore, compound 3 was identified as a new abietane named medusanthol C.
Compound 5, a white amorphous powder, exhibited a molecular formula of C22H30NaO5 (m/z 397.1974 [M + Na]+, calcd for C22H30NaO5, 397.1985, Δ = 2.8 ppm), suggesting the presence of an aromatic abietane with eight degrees of hydrogen deficiency. The infrared spectrum displayed characteristic absorptions at 3431 cm−1 (hydroxyl), 1735 and 1269 cm−1 (ester), 1710 cm−1 (carboxylic acid), and 1658, 1510, and 1421 cm−1 (aromatic ring). The 13C NMR data of the compound indicated a significant resemblance to medusanthol C (3) (Table 1). However, the presence of a single oxygenation on ring A for compound 5 was suggested by the replacement of the oxymethine carbon at δC 84.3 (C-3) in medusanthol C with a methylene carbon at δC 47.7. Furthermore, the 1D NMR spectrum revealed the deshielding of the oxymethine proton H-2 (δH 5.42, 1H, tt, J = 11.7, 4.5 Hz), as well as the presence of characteristic signals for an acetoxy group at δH 2.02 (3H, s), δC 21.4, and δC 172.6 (Table 1 and Table 2). This finding was consistent with the presence of a 2-OCOCH3 group in 5, similar to miltiorin A, which is isolated from the roots of Salvia miltiorrhiza [21]. In the HMBC spectrum, the correlation between the signals at δH 1.02 and 0.93 (6H, s, H3-18/H3-19) and the signal at δC 47.7 assigned to C-3 confirmed the absence of a hydroxyl group at this position (Figure 2). According to the 13C NMR spectrum, compound 5 also differed from compound 3 in that it displayed signals for only four methyl groups, indicating the absence of a signal corresponding to CH3-20, as observed for compound 3 (δC 26.3). Therefore, the presence of a signal at δC 179.0 was attributed to C-20, indicating oxidation to a carboxylic acid at this position. The HMBC correlations of H-1 (δH 3.09, 1H, ddd, J = 12.1, 4.5, 2.8 Hz) with C-2 (δC 70.8) and C-20 (δC 179.0) confirmed the localization of the acetoxy and carboxylic acid functionalities, respectively (Figure 2).
The relative configuration of 5 was proposed by the NOESY correlations. The NOESY cross peaks of H-2/H3-19, H-1(δH 3.09)/H3-19, H-1(δH 3.09)/H-11 and H-5/H3-18 indicated that H-2 and CH3-19 were β-oriented, whereas CH3-18 and H-5 were α-oriented (Figure 3). NMR calculations and DP4+ analysis confirmed that the relative stereochemistry of the C-2 center was 2S*, with a probability of 100% (Figure S162). The absolute configuration of compound 5 was determined by ECD analysis. The experimental ECD spectrum matched well with the calculated curve (Figure 4), defined as (2S,5S,10R). Thus, 5 was designated medusanthol D.
Compound 7 was obtained as a white amorphous powder with a molecular formula of C22H28O6, as determined by its HRESIMS peak at m/z 799.3652 [2M + Na]+ (calculated for C44H56NaO12, 799.3664, Δ = 1.5 ppm), implying nine degrees of hydrogen deficiency. The IR spectrum displayed characteristic bands for hydroxyl (3446 cm−1) and lactone (1741 cm−1) groups. The 1D and 2D NMR data of 7 showed similarities to those of medusanthol D (5), with an acetoxy group at C-2, a tetra-substituted aromatic ring, and four methyl groups in its structure, as shown in Table 1. However, differences between the two compounds were also detected. The 1H NMR and HSQC spectra of compound 7 revealed an extra oxymethine signal at δH 5.94 (1H, d, J = 6.5 Hz) and correlations for only three methylene hydrogen groups. Similarly, the HMBC correlation of the signal at δH 1.85 (1H, t, J = 11.7 Hz, H-1) with the carbon at δC 170.9 suggested oxidation at the C-20 position, consistent with a lactone carbonyl [22] (Figure 2). In particular, the data of 7 notably differed from those of 5 due to the presence of a carbon at δC 95.4 and the deshielding of C-8 (ΔδC + 17.1 ppm) (Table 1).
Moreover, the correlation between δH 5.94 and δC 95.4 in the HSQC spectrum, along with the spin system H-5/H2-6/H-7 as determined by the COSY spectrum, provided substantial evidence for the presence of an acetal group at C-7. The aforementioned data, along with the HMBC correlations of the acetalic hydrogen H-7 (δH 5.94, d, J = 6.5 Hz) and resonances at δC 50.6 (C-5), δC 145.8 (C-8), and δC 170.9 (C-20), established the C-20-O-C-7 and C-7-O-C-8 connections, confirming a δ-lactone ring between C-20 and C-7 and an acetal functional group at C-7 with ring closure via C-8 (Figure 2).
The relative stereochemistry of compound 7 was deduced from NOESY correlations, similar to those observed for medusanthol E (5). The cross-peaks between H-2/H3-19 and H-5/H3-18 in the NOESY spectrum suggested that H-2 and H3-19 adopted a β orientation, while CH3-18 and H-5 assumed an α orientation (Figure 3). To further determine the relative configuration of compound 7, the NMR data of two candidates (7a and 7b) were calculated. DP4+ analyses indicated that (2S*,5S*,7S*,10R*)–7b was highly likely at 99.81% (Figure S168). Furthermore, the absolute configuration of 7 was determined to be 2S,5S,7S,10R through comparison of the experimental and calculated ECD spectra (Figure 4). Ultimately, 7 was denominated medusanthol E.
Compound 8 was isolated as a white amorphous powder with the molecular formula C22H26O6, as deduced from its HRESIMS signal at m/z 409.1612 [M + Na]+ (calcd for C22H26NaO6, 409.1622, Δ = 2.3 ppm), corresponding to ten degrees of hydrogen deficiency. In the IR spectrum, characteristic absorption bands for hydroxyl (3446 cm−1), lactonic (1786 cm−1), ester (1720 cm−1), and conjugated ketone (1695 cm−1) groups were observed. The 13C NMR spectrum of 8 showed signals between δC 189.1 and 111.0, similar to those observed for compound 2, which were attributed to the aromatic carbons of the C ring and the carbonyl of the ketone at C-7 (Table 1). On the other hand, compound 8 also exhibited structural similarities to compound 7, as evidenced by the signals detected at δC 176.0 and δC 66.4, suggesting the presence of a lactone group at C-20 and an acetoxy group at C-2, respectively. In addition, the signals at δC 22.3, 22.4, 22.7, and 31.4, corresponding to the four methyl groups, also align with those found in compound 7. However, the absence of signals at δC 95.4 and 145.8 and the presence of a signal at δC 81.4 in the 13C NMR spectrum of 8 suggested the formation of a lactonic ring via C-20 and C-6, supporting the keto carbonyl at C-7 (δC 189.1). The shielding of the oxymethylene hydrogen signal from δH 5.94 (1H, d, J = 6.5 Hz, H-7) in 7 to δH 4.77 (1H, s, H-6) in conjunction with the signal at δC 81.4 (C-6) in the HSQC spectrum was consistent with the proposed lactonization of 8. The HMBC correlations of H-6 (δH 4.77) with signals at δC 34.0 (C-4), δC 49.2 (C-10), δC 121.8 (C-8), and δC 176.0 (C-20) confirmed that the bridge between C-20 and C-6 formed a γ-lactone ring (Figure 2).
The relative stereochemistry of C-6 was determined by analyzing the dihedral angle between singlets H-5 (δH 2.41, 1H) and H-6 (δH 4.77, 1H). These protons displayed an approximately 90° dihedral angle, indicating a pseudoequatorial arrangement for H-6, while H-5 exhibited an α-axial disposition. However, the relative configuration of the C-2 chiral center could not be conclusively determined by NOESY. In this way, the quantum GIAO method was utilized to calculate the 13C and 1H NMR chemical shifts of two potential isomers, (2R*,5S*,6S*,10R*)–8a and (2S*,5S*,6S*,10R*)–8b. Subsequently, comparison of these computed values with experimental data through DP4+ probability analysis indicated that the most likely relative configuration was (2S*,5S*,6S*,10R*)–8b, with a 76.92% probability (Figure S171). To determine the absolute configuration, the calculated and experimental ECD data were compared (Figure 4). The calculated ECD spectrum of 8b aligned closely with the experimental curve for 8, suggesting the absolute configuration of 2S,5S,6S,10R. Ultimately, its structure was denoted as medusanthol F.
Compound 9 was obtained as a yellow amorphous powder, with an HRESIMS peak at m/z 799.3637 [2M + Na]+ (calcd for C44H56NaO12, 799.3664, Δ = 3.4 ppm), indicating a molecular formula of C22H28O6 and suggesting nine degrees of hydrogen deficiency. The infrared spectrum exhibited absorption bands for hydroxyl (3427 cm−1), lactonic (1791 cm−1), and aldehydic (1724 cm−1) groups. 13C NMR analysis of compound 9 indicated similar chemical shifts in the A ring to those of compounds 58. However, differences in the chemical shifts of the B and C rings were observed compared to those of compounds 18 identified in this study (Table 1). According to the 13C NMR and DEPT spectra of compound 9, six aromatic carbons were identified, including two oxygenated carbons at δC 150.2 and 146.6, two methine carbons at δC 110.8 and 108.6, and two nonhydrogenated carbons at δC 137.1 and 128. Furthermore, the resonance observed at δC 177.9 in the 13C NMR spectrum was assigned to C-20, indicating the presence of a lactone carbonyl in 9. In the HMBC spectrum, the correlation of the signal at δH 3.16 (1H, sept., J = 6.9 Hz, H-15) with the signals at δC 108.6 and 150.2 confirmed the chemical shifts of C-12 and C-14, respectively (Figure 2). Consequently, the HSQC correlation between the proton at δH 6.57 (1H, s) and the carbon at δC 110.2, as well as the signal at δH 6.86 (1H, s) with the carbon at δC 108.6, confirmed the chemical shifts of the two hydrogenated aromatic carbons at C-8 and C-12, respectively. According to the information provided, it is suggested that the lactone ring in compound 9 formed via the C ring. HMBC correlations from H-8 (δH 6.57, 1H, s) to C-14 (δC 150.2), C-11 (δC 146.6), C-13 (δC 137.1), C-9 (δC 128.3), and C-10 (δC 53.1) confirmed that C-9, C-10, C-11, and C-20, along with an oxygen atom, formed a γ-lactone ring (Figure 2).
In addition, the presence of a signal at δH 9.19 (1H, t, J = 1.5 Hz) in the 1H NMR spectrum, along with the correlation of this proton with the carbon at δC 199.5 in the HSQC spectrum, suggested the presence of an aldehydic group in 9. The correlation of the aldehydic proton (δH 9.19, 1H, t, J = 1.5 Hz) and H-5 (δH 2.34, 1H, dd, J = 6.1, 4.6 Hz) with the C-6 carbon (δC 41.8) in the HMBC spectrum (Figure 2), along with the COSY spin system H-5/H-6/H-7, determined the position of the aldehyde group at C-7. The conjunction of these correlations established that 9 is a 7-8-seco-abietane.
For the same reason as mentioned for compound 8, the relative configuration of C-2 in 9 was proposed using quantum GIAO NMR chemical shift calculations and DP4+ analysis. The 13C and 1H NMR data of two possible isomers, (2R*,5S*,10R*)–9a and (2S*,5S*,10R*)–9b, were calculated. The DP4+ probability assessment indicated that the (2S*,5S*,10R*)–9b isomer was highly probable, at 100% (Figure S174). To determine the absolute configuration of 9, the experimental and calculated ECD results were compared, and 9 was identified as 2S,5S,10R (Figure 4). Ultimately, compound 9 was named medusanthol F.
Furthermore, the structures of the identified known diterpenoids, salviol (4) [23] and 2α-hydroxysugiol (6) [19], were confirmed by comparing their spectroscopic data with reported values in the literature. Here, we present the 1D NMR, HRESIMS, ECD, and IR data, along with 13C and 1H NMR calculations and DP4+ probability analysis for compounds 4 and 6 (see Supplementary Materials).

2.2. Biological Activity

Anti-Neuroinflammatory Activity

Neuroinflammation is characterized by the prolonged activation of glial cells and the influx of immune cells into the nervous system and plays a significant role in the progression of neurodegenerative disorders such as Alzheimer’s disease, Parkinson’s disease, amyotrophic lateral sclerosis, and traumatic brain injury [24]. Research has shown that abietanes in the Lamiaceae family have the potential to reduce neuroinflammation and act as antioxidants [25,26].
The noncytotoxic concentrations of compounds 17 in BV2 cells were determined using the MTT assay. Our results showed that at 50 µM, most compounds reduced cell viability by more than 20%. On the other hand, at 12.5 and 25 µM, cell viability greater than 80% was observed for all the compounds (Table 3). Therefore, 12.5 µM was considered a safe concentration for assessing the anti-neuroinflammatory effects of compounds 17.
The anti-neuroinflammatory effects of compounds 17 were initially evaluated by determining the levels of nitrite, a stable metabolite of NO. As shown in Figure 5, the LPS/IFN-γ-induced inflammatory response was greater in the control group than in the basal group (unstimulated). At 12.5 μM, compounds 14 and 7 significantly reduced nitrite levels compared to those in the control group. No significant effect was recorded for compounds 5 and 6. As expected, the positive control quercetin (20 μM) also significantly reduced nitrite levels in stimulated BV2 cells. Nitric oxide plays a crucial role in inflammation, including its involvement in neurodegenerative diseases [27]. Thus, our results suggest that compounds 1, 2, 3, 4, and 7 exert anti-neuroinflammatory effects.
Considering the promising results for compounds 1 and 2, a new set of experiments was performed to calculate the IC50 values at concentrations of 3.125, 6.250, 12.5, and 25 μM. Compounds 1 and 2 exhibited IC50 values of 3.12 and 15.53 μM, respectively (Table 4). The IC50 value for the positive control quercetin was 11.8 μM. These results support the potent anti-neuroinflammatory effect, especially for compound 1. Moreover, considering that TNF-α acts as an important inflammatory mediator [28], the inhibitory effects of compounds 1 and 2 on LPS- and IFN-γ-induced TNF-α release from BV2 cells were assessed.
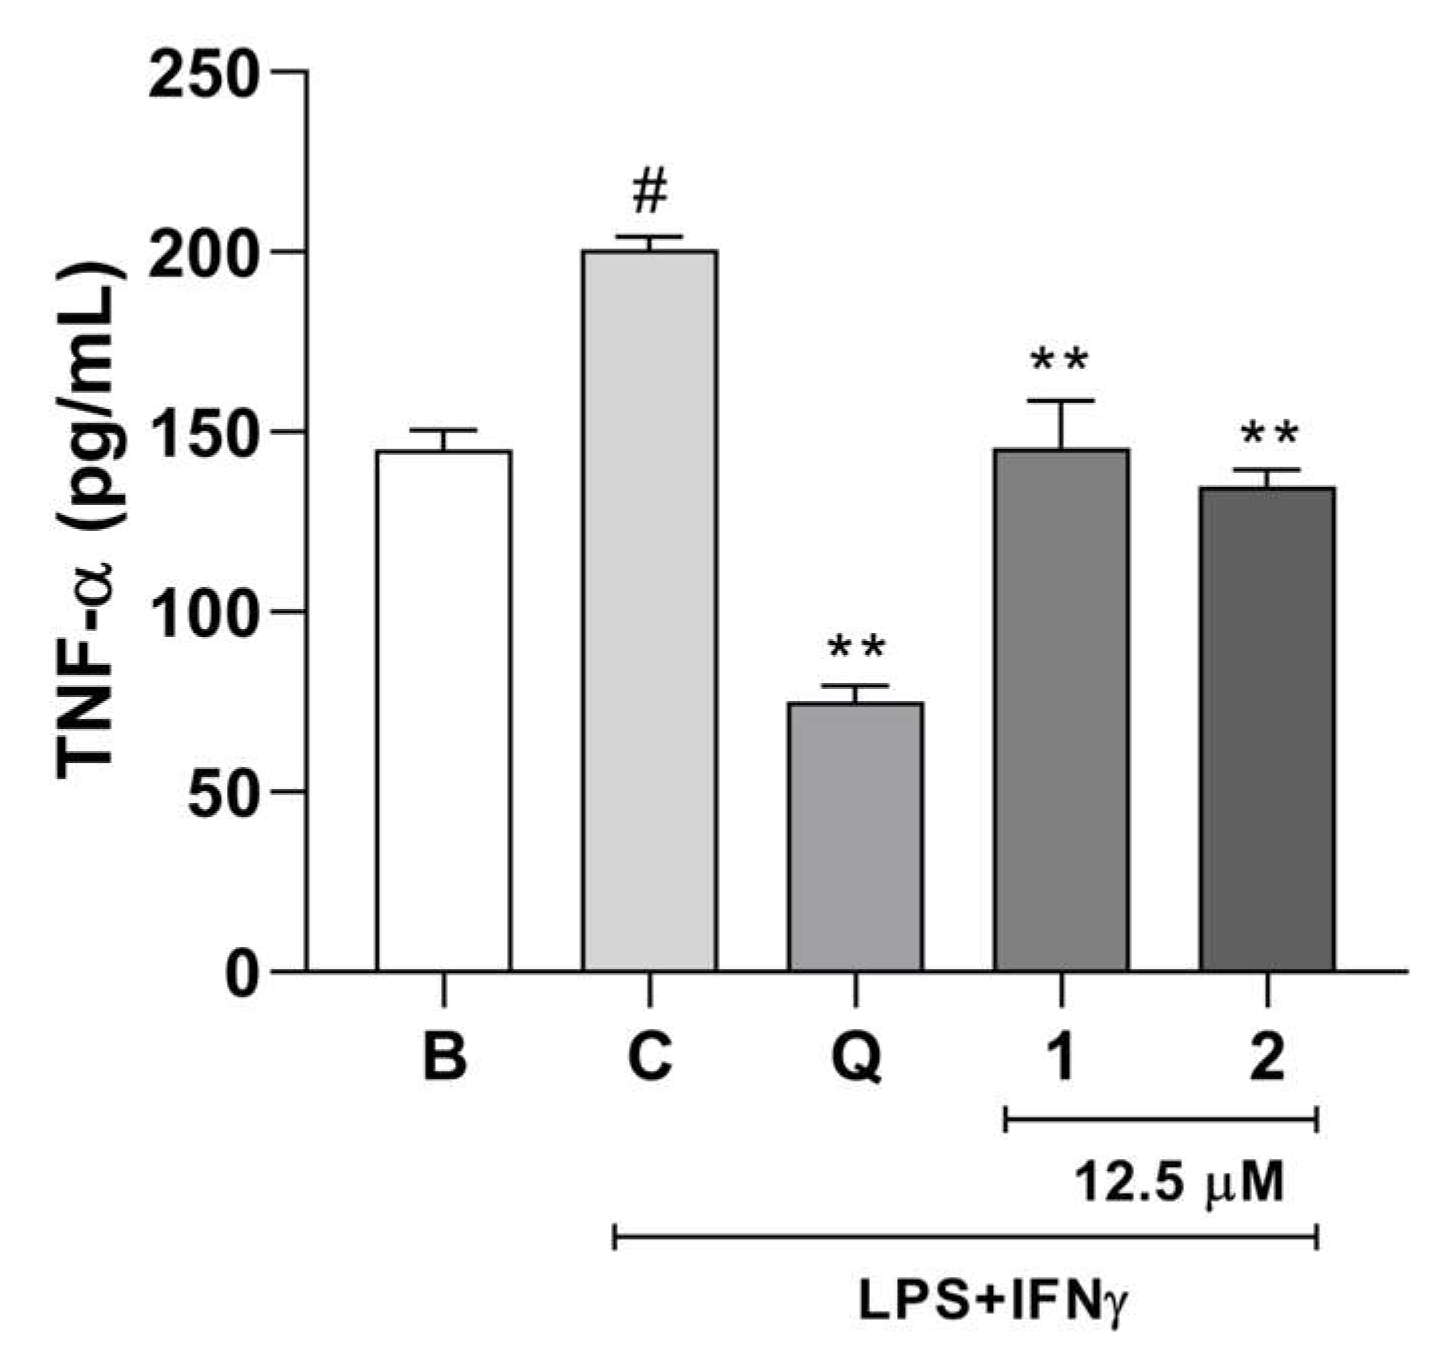
Compounds 1 and 2 significantly reduced TNF-α levels in stimulated BV2 cells compared to those in the control group (Figure 6). Data from the literature have shown that inflammation induced in BV2 cells increases the activation of signaling pathways such as the NF-κB and MAPK pathways, leading to the production of cytokines, including TNF-α [29]. TNF-α is a proinflammatory cytokine that modulates the immune system and plays a role in all types of inflammatory disorders, such as central nervous system disorders [30]. Therefore, the anti-neuroinflammatory effects of compounds 1 and 2 are linked to the inhibition of NO and TNF-α release from BV2 cells.

3. Experimental Section

3.1. General Experimental Procedures

Optical rotations were measured on a JASCO P-2000 polarimeter (JASCO, Tokyo Japan). Infrared (IR) spectra were recorded on a Shimadzu IRPrestige-21 spectrometer (Shimadzu, Kyoto, Japan) using the KBr disk method. NMR data were acquired on Bruker Ascend 400 MHz and Bruker AvanceNeo 500 MHz spectrometers (Bruker, Billerica, MA, USA) using the residual nondeuterated solvent peaks as an internal standard. The experimental ECD spectra were obtained on a JASCO J-1100 CD Spectrometer (JASCO, Tokyo Japan). The vacuum-liquid chromatography (VLC) system was constructed in a Büchner funnel, and an Erlenmeyer flask was connected to a vacuum system using silica gel (60–200 μm, 70–230 mesh, SiliaCycle, Quebec, QC, Canada) as the packing material. High-resolution electrospray ionization mass spectrometry (HRESIMS) analyses were carried out using a Bruker micrOTOF II spectrometer (Bruker, Billerica, MA, USA) operating in positive mode. Analytical high-performance liquid chromatography (HPLC) was performed on a Prominence Shimadzu instrument (Shimadzu, Kyoto, Japan) equipped with an SPD-M20A diode array detector and a YMC C-18 (250 mm × 4.6 mm × 5 µm) column. Semipreparative HPLC separations were conducted on a Shimadzu 10AVP instrument (Shimadzu, Kyoto, Japan) with an SPD-M10AVP detector on a Venusil XBP C-18 (259 mm × 10 mm × 10 μm) column. For preparative HPLC isolations, a Shimadzu apparatus with an SPD-M10A diode array detector and a YMC-Triart® C-18 (250 mm × 20 mm × 5 µm) column was used.

3.2. Plant Material

The aerial parts of Medusantha martiusii (Benth.) Harley and J. F. B. Pastore were collected in July 2019 at Maturéia, a Caatinga region of Paraíba, Brazil (07°16′01″ S, 37°21′05″ W). The sample was authenticated by Maria de Fátima Agra. A specimen is housed under the code JPB 37884 at the Herbarium Prof. Lauro Pires Xavier (JPB) at the Federal University of Paraíba (UFPB), Brazil. This species was registered under the code AB7F3C9 in the National System for the Management of Genetic Heritage and Associated Traditional Knowledge (SisGen-Brasil).

3.3. Extraction, Isolation, and Purification Process

The dried and pulverized aerial parts of M. martiusii (1.2 kg) were macerated in hexane four times (4 L) and then in 96% ethanol (4 L) five times, with each cycle lasting 72 h. The filtrates were concentrated under reduced pressure, producing 17.5 g and 43.3 g of hexanic and ethanolic extract, respectively. The hexanic extract (10.0 g) was fractionated by vacuum liquid chromatography using a solvent gradient of Hex–CHCl3–EtOAc (20:80:0 → 60:40:0 → 50:50:0 → 40:60:0 → 20:80:0 → 0:0:100, v/v/v) to obtain six fractions A–F. Fraction F (400 mg) was subjected to preparative HPLC using the following system: solvent A = Milli-Q water with 0.1% formic acid; solvent B = CH3CN; elution profile = 0.0–38.0 min (50–62% B); 38.0–60.0 min (62–70% B); YMC-Triart® C-18 column; volume injection 200 μL and flow rate of 8 mL/min to yield compounds 1 (5 mg, tR = 12.2 min), 2 (4 mg, tR = 12.7 min), 6 (2 mg, tR = 21.5 min), 3 (24.1 mg, tR = 29.6 min), 9 (2 mg, tR = 39.3 min), 8 (1.5 mg, tR = 43.3 min), and 7 (1.5 mg, tR = 46.1 min), as well as the F1 subfraction (62.2 mg, tR = 52.3 min), which contained a mixture of substances. The F1 fraction was further purified by semipreparative HPLC using the following method: solvent A = Milli-Q water; solvent B = CH3CN; elution profile = 0.0–80.0 min (50% B); Venusil XBP C-18 column; volume injection 100 μL and flow rate of 3 mL/min to obtain compounds 4 (2.6 mg, tR = 71.5 min) and 5 (10.7 mg, tR = 77.4 min).

3.4. Characterization Data

Medusanthol A (1): brown amorphous powder; α D 23 − 6.8 (c 0.1, MeOH); IR (KBr) νmax 3432, 1655, 1640 cm−1; 1H and 13C NMR data, see Table 1 and Table 2; HRESIMS m/z 331.1896 [M − H2O + H]+ (calcd for C20H27O4, 331.1904, Δ = 2.2 ppm).
Medusanthol B (2): white amorphous powder; α D 23 + 6.4 (c 0.1, MeOH); IR (KBr) νmax 3448, 1658, 1595, 1460 cm−1; 1H and 13C NMR data, see Table 1 and Table 2; HRESIMS m/z 687.3863 [2M + Na]+ (calcd for C40H56NaO8, 687.3867, Δ = 0.6 ppm).
Medusanthol C (3): needle crystal; α D 23 + 27.9 (c 0.1, MeOH); IR (KBr) νmax 3336, 1618, 1425 cm−1; 1H and 13C NMR data, see Table 1 and Table 2; HRESIMS m/z 659.4276 [2M + Na]+ (calcd for C40H60NaO6, 659.4282, Δ = 0.9 ppm).
Medusanthol D (5): white amorphous powder; α D 23 + 23.5 (c 0.1, MeOH); IR (KBr) νmax 3431, 1735, 1269, 1710, 1658, 1510, 1421 cm−1; 1H and 13C NMR data, see Table 1 and Table 2; HRESIMS m/z 397.1974 [M + Na]+ (calcd for C22H30NaO5, 397.1985, Δ = 2.8 ppm).
Medusanthol E (7): white amorphous powder; α D 23 − 7.9 (c 0.1, CHCl3); IR (KBr) νmax 3446, 1786 cm−1; 1H and 13C NMR data, see Table 1 and Table 2; HRESIMS m/z 799.3652 [2M + Na]+ (calcd for C44H56NaO12, 799.3664, Δ = 1.5 ppm).
Medusanthol F (8): white amorphous powder; α D 23 + 5.7 (c 0.1, CHCl3); IR (KBr) νmax 3446, 1786, 1720, 1695 cm−1; 1H and 13C NMR data, see Table 1 and Table 2; HRESIMS m/z 409.1612 [M + Na]+ (calcd for C22H26NaO6, 409.1622, Δ = 2.3 ppm).
Medusanthol G (9): yellow amorphous powder; α D 23 − 32.8 (c 0.1, CHCl3); IR (KBr) νmax 3427, 1791, 1745, 1724 cm−1; 1H and 13C NMR data, see Table 1 and Table 2; HRESIMS m/z 799.3637 [2M + Na]+ (calcd for C44H56NaO12, 799.3664, Δ = 3.4 ppm).

3.5. NMR and ECD Calculations

The three-dimensional molecular structures of the compounds were obtained using ChemSketch software version C25E41 [30]. Stochastic conformational searches were performed for all possible stereoisomers of each compound using the Monte Carlo method and the molecular mechanic force field (MMFF) in SPARTAN’10 software version 1.1.0 [31]. All conformers within a relative free energy window of 10 kcal mol−1 were reoptimized using the B3LYP/6-31G(d) level of theory. The conformations within the energy range of 2.5 kcal mol−1 above the minimum energy conformer, corresponding to more than 90% of the total Boltzmann population, were selected for the GIAO NMR calculations and the simulations of the ECD spectra. To simulate nuclear magnetic shielding, the GIAO-mPW1PW91/6-31+G(d,p) level of theory was used, employing a polarizable continuum model with integral equation formalism (IEF-PCM) to implicitly simulate chloroform as a solvent. The 1H and 13C NMR chemical shifts (δ) were obtained using δi = σ0 − σi after the calculation of the shielding constant of the tetramethylsilane (σ0) using the same levels of theory. For the application of the DP4+ method, as recommended by the author, the nuclear magnetic shields for all candidates of each compound were added to the DP4+ Excel spreadsheet [32]. For the ECD simulations, TD-DFT was performed in acetonitrile at the CAM-B3LYP/TZVP level. The IEF-PCM model for acetonitrile was used. The final ECD spectra were obtained based on the weighted average Boltzmann statistics of the selected conformers and plotted using Origin 8 software [33]. All quantum-mechanical calculations were performed using the Gaussian 09 software package [34].

3.6. Anti-Neuroinflammatory Assay

3.6.1. Cell Viability (MTT Assay)

The cytotoxicity of compounds 17 was evaluated using the MTT (3-(4,5-dimethylthiazol-2-yl)-2,5-diphenyltetrazolium bromide) assay [35]. The microglial BV2 cell line was obtained from the Rio de Janeiro Cell Bank (BCRJ), Brazil. The cells were cultured in Roswell Park Memorial Institute medium (RPMI; Sigma Aldrich, St. Louis, MO, USA) supplemented with 10% fetal bovine serum (FBS; Gibco, Grand Island, NY, USA) and 1% penicillin-streptomycin (Sigma Aldrich) at 37 °C with 5% CO2. Cells were seeded into 96-well plates at 1 × 10⁵ cells/mL and incubated overnight. After that, the cells were incubated with compounds 1 to 7 (12.5, 25, or 50 μM) in five replicates for 24 h. Then, 110 μL of the supernatant were removed, and 10 μL of MTT solution (5 mg/mL) (Sigma Aldrich, St. Louis, MO, USA) were added. The plates were further incubated for four hours, followed by the addition of sodium dodecyl sulfate (SDS) (100 µL/well) to dissolve the formazan. Optical densities were measured using a spectrophotometer (BioTek Instruments microplate reader, Sinergy HT, Winooski, VT, USA) at a wavelength of 570 nm.

3.6.2. Nitric Oxide (NO) and TNF-α Measurement

To determine the NO and TNF-α levels, BV2 cells were seeded in 96-well plates (1 × 10⁶ cells/mL) in RPMI medium supplemented with 10% FBS and 1% penicillin-streptomycin in a 5% CO2 incubator at 37 °C. After four hours, the cells were exposed to LPS (500 ng/mL, Sigma Aldrich) and IFN-γ (5 ng/mL, Thermo Fisher) in the absence or presence of compounds 1 to 7 at a final concentration of 12.5 µM (for NO and TNF-α measurement) or 3.125–25 µM (to calculate the IC50 values on NO production inhibition), in five replicates. Quercetin (20 µM) was used as a positive control. After 24 h, cell-free supernatants were collected for NO quantification using the Griess method [36] or stored at −80 °C for cytokine concentration determination. The TNF-α concentrations in the BV2 cell culture supernatants were assessed via enzyme-linked immunosorbent assay (ELISA) with an Invitrogen kit (Thermo Fisher, Viena, Austria).

3.6.3. Statistical Analysis

The results are expressed as the mean ± standard error of the mean (SEM), and group comparisons were conducted using one-way analysis of variance (ANOVA) followed by Tukey’s post hoc test (p < 0.05).

4. Conclusions

Seven new abietane diterpenoids, comprising medusanthol A–G (13, 5, 79) and two previously identified analogs (4 and 6), were isolated from the hexane extract of the aerial parts of Medusantha martiusii. Compounds 14 and 7 exhibited significant anti-neuroinflammatory activity in BV2 microglia. Notably, compound 1 exhibited a potent anti-neuroinflammatory effect with an IC50 value of 3.12 μM, while compound 2 displayed an IC50 of 15.53 μM, effectively decreasing NO levels. Additionally, these compounds also reduced TNF-α levels, suggesting their involvement in pathways that mitigate neuroinflammation. Overall, these results not only emphasize the diversity of diterpenes in Nepetoideae but also establish a foundation for its properties in accordance with its traditional usage, thereby reaffirming the potential of the Caatinga biome in uncovering new bioactive compounds.

Supplementary Materials

The following supporting information can be downloaded at https://www.mdpi.com/article/10.3390/molecules29122723/s1: Figures S1–S149: NMR, IR, HRESIMS of compounds 19. Tables S1–S12: Comparative analysis of theoretical and experimental 1H and 13C NMR data of compounds 19. Figures S150–S176: DP4+ data, lowest energy conformer data at the B3LYP/6-31G(d) level, and comparison of experimental and calculated ECD data of compounds 19.

Author Contributions

E.B.d.A., M.S.d.S., and J.F.T. conceived and designed the main ideas of this work. J.F.T. and M.S.d.S. led the supervision and administration of the project. M.d.F.A. collected and identified the plant material. J.P.R.e.S. designed the chromatographic separations and isolation. E.B.d.A. carried out the fractionation by vacuum liquid chromatography and the isolation of the compounds by preparative HPLC and wrote the original manuscript. E.B.d.A., M.S.d.S., and J.F.T. carried out structural elucidation using 1D and 2D NMR, IR, and HRESIMS data. M.S.d.S. and J.F.T. contributed to the initial draft and revised the manuscript. R.S.d.A. assisted with the recording of the optical rotation experiment and contributed to conducting the infrared experiment. L.S.A. conducted the HRESIMS experiment and analyzed the results. M.V.S. designed and coordinated the experiments related to the biological studies and analyzed the results concerning anti-neuroinflammatory activity. G.M.W.A. and P.B.A.L. assessed cell viability and conducted the nitric oxide and TNF-α measurement assays. F.M.d.S.J. designed and coordinated the experiments related to the computational studies. L.H.M. performed the theoretical calculations of the 1H and 13C NMR chemical shifts, ECD, and DP4+ analyses. M.T.S. analyzed the results related to the computational studies and participated in the manuscript revision. All authors have read and agreed to the published version of the manuscript.

Funding

This study was financed by the Rede Norte-Nordeste de Fitoterápicos (INCT/RENNOFITO/CNPq; Project Number: 46.5536/2014-0).

Institutional Review Board Statement

Not applicable.

Informed Consent Statement

Not applicable.

Data Availability Statement

The authors declare that all relevant data supporting the results of this study are available within the article and its Supplementary Materials.

Acknowledgments

The authors acknowledge Conselho Nacional de Desenvolvimento Científico e Tecnológico (CNPq) and Coordenação de Aperfeiçoamento de Pessoal de Nível Superior-Brasil (CAPES) (Finance Code 001) for support and fellowships. We thank M.F.R., Silva, H.D.S., Souza, and E.F., Silva for collecting the NMR and IR data.

Conflicts of Interest

The authors declare no conflicts of interest.

References

  1. Harley, R.M.; Pastore, J.F.B. A Generic Revision and New Combinations in the Hyptidinae (Lamiaceae), Based on Molecular and Morphological Evidence. Phytotaxa 2012, 58, 1. [Google Scholar] [CrossRef]
  2. Monteiro, F.K.D.S.; Melo, J.I.M.D. Flora da Paraíba, Brasil: Subfamília Nepetoideae (Lamiaceae). Rodriguésia 2020, 71, e01762018. [Google Scholar] [CrossRef]
  3. Bornowski, N.; Hamilton, J.P.; Liao, P.; Wood, J.C.; Dudareva, N.; Buell, C.R. Genome Sequencing of Four Culinary Herbs Reveals Terpenoid Genes Underlying Chemodiversity in the Nepetoideae. DNA Res. 2020, 27, dsaa016. [Google Scholar] [CrossRef] [PubMed]
  4. Ortiz-Mendoza, N.; Martínez-Gordillo, M.J.; Martínez-Ambriz, E.; Basurto-Peña, F.A.; González-Trujano, M.E.; Aguirre-Hernández, E. Ethnobotanical, Phytochemical, and Pharmacological Properties of the Subfamily Nepetoideae (Lamiaceae) in Inflammatory Diseases. Plants 2023, 12, 3752. [Google Scholar] [CrossRef] [PubMed]
  5. Sun, Y.; Yang, H.-Y.; Huang, P.-Z.; Zhang, L.-J.; Feng, W.-J.; Li, Y.; Gao, K. Abietane Diterpenoids with Anti-Inflammatory Activities from Callicarpa Bodinieri. Phytochemistry 2023, 214, 113825. [Google Scholar] [CrossRef] [PubMed]
  6. Kolsi, L.E.; Leal, A.S.; Yli-Kauhaluoma, J.; Liby, K.T.; Moreira, V.M. Dehydroabietic Oximes Halt Pancreatic Cancer Cell Growth in the G1 Phase through Induction of P27 and Downregulation of Cyclin D1. Sci. Rep. 2018, 8, 15923. [Google Scholar] [CrossRef] [PubMed]
  7. Abdissa, N.; Frese, M.; Sewald, N. Antimicrobial Abietane-Type Diterpenoids from Plectranthus punctatus. Molecules 2017, 22, 1919. [Google Scholar] [CrossRef] [PubMed]
  8. Tabefam, M.; Farimani, M.M.; Danton, O.; Ramseyer, J.; Kaiser, M.; Ebrahimi, S.N.; Salehi, P.; Batooli, H.; Potterat, O.; Hamburger, M. Antiprotozoal Diterpenes from Perovskia abrotanoides. Planta Med. 2018, 84, 913–919. [Google Scholar] [CrossRef] [PubMed]
  9. Agra, M.D.F.; Silva, K.N.; Basílio, I.J.L.D.; Freitas, P.F.D.; Barbosa-Filho, J.M. Survey of Medicinal Plants Used in the Region Northeast of Brazil. Rev. Bras. Farmacogn. 2008, 18, 472–508. [Google Scholar] [CrossRef]
  10. Ranzato Filardi, F.L.; Barros, F.D.; Baumgratz, J.F.A.; Bicudo, C.E.M.; Cavalcanti, T.B.; Nadruz Coelho, M.A.; Costa, A.; Costa, D.; Goldenburg, R.; Labiak, P.H.; et al. BFG Brazilian Flora 2020: Innovation and Collaboration to Meet Target 1 of the Global Strategy for Plant Conservation (GSPC). Rodriguésia 2018, 69, 1513–1527. [Google Scholar] [CrossRef]
  11. Araújo, E.C.C.; Lima, M.A.S.; Silveira, E.R. Spectral Assignments of New Diterpenes from Hyptis martiusii Benth. Magn. Reson. Chem. 2004, 42, 1049–1052. [Google Scholar] [CrossRef]
  12. Araújo, E.C.C.; Lima, M.A.S.; Montenegro, R.C.; Nogueira, M.A.S.; Costa-Lotufo, L.V.; Pessoa, C.; Moraes, M.O.; Silveira, E.R. Cytotoxic Abietane Diterpenes from Hyptis martiusii Benth. Z. Für Naturforschung C 2006, 61, 177–183. [Google Scholar] [CrossRef]
  13. Cavalcanti, B.C.; Moura, D.J.; Rosa, R.M.; Moraes, M.O.; Araújo, E.C.C.; Lima, M.A.S.; Silveira, E.R.; Saffi, J.; Henriques, J.A.P.; Pessoa, C.; et al. Genotoxic Effects of Tanshinones from Hyptis martiusii in V79 Cell Line. Food Chem. Toxicol. 2008, 46, 388–392. [Google Scholar] [CrossRef] [PubMed]
  14. Barbosa, A.G.R.; Tintino, C.D.M.O.; Pessoa, R.T.; de Lacerda Neto, L.J.; Martins, A.O.B.P.B.; de Oliveira, M.R.C.; Coutinho, H.D.M.; Cruz-Martins, N.; Quintans, L.J., Jr.; Wilairatana, P.; et al. Anti-Inflammatory and Antinociceptive Effect of Hyptis martiusii BENTH Leaves Essential Oil. Biotechnol. Rep. 2022, 35, e00756. [Google Scholar] [CrossRef] [PubMed]
  15. Levy, G.C.; Lichter, R.L.; Nelson, G.L. Carbon-13 Nuclear Magnetic Resonance Spectroscopy, 2nd ed.; Wiley & Sons: New York, NY, USA, 1980. [Google Scholar]
  16. Han, D.; Li, W.; Hou, Z.; Lin, C.; Xie, Y.; Zhou, X.; Gao, Y.; Huang, J.; Lai, J.; Wang, L.; et al. The Chromosome-Scale Assembly of the Salvia rosmarinus Genome Provides Insight into Carnosic Acid Biosynthesis. Plant J. 2023, 113, 819–832. [Google Scholar] [CrossRef]
  17. Lima, K.S.B.D.; Pimenta, A.T.A.; Guedes, M.L.S.; Lima, M.A.S.; Silveira, E.R. Abietane Diterpenes from Hyptis carvalhoi Harley. Biochem. Syst. Ecol. 2012, 44, 240–242. [Google Scholar] [CrossRef]
  18. Costa-Lotufo, L.V.; Araújo, E.C.C.; Lima, M.A.S.; Moraes, M.E.A.; Pessoa, C.; Silviera, E.R.; Morais, M.O. Antiproliferative Effects of Abietane Diterpenoids Isolated from Hyptis martiusii Benth (Labiatae). Pharmazie 2004, 59, 78–79. [Google Scholar] [PubMed]
  19. González, A.G.; Herrera, J.R.; Luis, J.G.; Ravelo, A.G.; Ferro, E.A. Terpenes and Flavones of Salvia cardiophylla. Phytochemistry 1988, 27, 1540–1541. [Google Scholar] [CrossRef]
  20. Zhao, H.; Li, H.; Huang, G.; Chen, Y. A New Abietane Mono-Norditerpenoid from Podocarpus nagi. Nat. Prod. Res. 2017, 31, 844–848. [Google Scholar] [CrossRef]
  21. Hirata, A.; Kim, S.-Y.; Kobayakawa, N.; Tanaka, N.; Kashiwada, Y. Miltiorins A–D, Diterpenes from Radix Salviae miltiorrhizae. Fitoterapia 2015, 102, 49–55. [Google Scholar] [CrossRef]
  22. Lin, S.; Zhang, Y.; Liu, M.; Yang, S.; Gan, M.; Zi, J.; Song, W.; Fan, X.; Wang, S.; Liu, Y.; et al. Abietane and C20-Norabietane Diterpenes from the Stem Bark of Fraxinus sieboldiana and Their Biological Activities. J. Nat. Prod. 2010, 73, 1914–1921. [Google Scholar] [CrossRef]
  23. Zheng, T.-L.; Liu, S.-Z.; Huo, C.-Y.; Li, J.; Wang, B.-W.; Jin, D.-P.; Cheng, F.; Chen, X.-M.; Zhang, X.-M.; Xu, X.-T.; et al. Au-Catalyzed 1,3-Acyloxy Migration/Cyclization Cascade: A Direct Strategy toward the Synthesis of Functionalized Abietane-Type Diterpenes. CCS Chem. 2021, 3, 2795–2802. [Google Scholar] [CrossRef]
  24. Zhang, W.; Xiao, D.; Mao, Q.; Xia, H. Role of Neuroinflammation in Neurodegeneration Development. Signal Transduct. Target. Ther. 2023, 8, 267. [Google Scholar] [CrossRef]
  25. Oliveira, M.R. The Dietary Components Carnosic Acid and Carnosol as Neuroprotective Agents: A Mechanistic View. Mol. Neurobiol. 2016, 53, 6155–6168. [Google Scholar] [CrossRef] [PubMed]
  26. Oliveira, M.R.; Souza, I.C.C.; Fürstenau, C.R. Carnosic Acid Induces Anti-Inflammatory Effects in Paraquat-Treated SH-SY5Y Cells Through a Mechanism Involving a Crosstalk Between the Nrf2/HO-1 Axis and NF-κB. Mol. Neurobiol. 2018, 55, 890–897. [Google Scholar] [CrossRef] [PubMed]
  27. Justo, A.F.O.; Suemoto, C.K. The Modulation of Neuroinflammation by Inducible Nitric Oxide Synthase. J. Cell Commun. Signal. 2022, 16, 155–158. [Google Scholar] [CrossRef] [PubMed]
  28. Konsman, J.P. Cytokines in the Brain and Neuroinflammation: We Didn’t Starve the Fire! Pharmaceuticals 2022, 15, 140. [Google Scholar] [CrossRef] [PubMed]
  29. Wang, H.; Wang, H.; Wang, J.; Wang, Q.; Ma, Q.; Chen, Y. Protocatechuic Acid Inhibits Inflammatory Responses in LPS-Stimulated BV2 Microglia via NF-κB and MAPKs Signaling Pathways. Neurochem. Res. 2015, 40, 1655–1660. [Google Scholar] [CrossRef]
  30. ChemSketch, Version 2022.1.2; Advanced Chemistry Development, Inc. (ACD/Labs): Toronto, ON, Canada, 2022. Available online: www.acdlabs.com(accessed on 19 October 2023).
  31. Spartan’ 10, Version 1.1.0; Wavefunction Inc.: Irvine, CA, USA, 2011.
  32. Grimblat, N.; Zanardi, M.M.; Sarotti, A.M. Beyond DP4: An Improved Probability for the Stereochemical Assignment of Isomeric Compounds Using Quantum Chemical Calculations of NMR Shifts. J. Org. Chem. 2015, 80, 12526–12534. [Google Scholar] [CrossRef]
  33. Origin(Pro), Version 2023; OriginLab Corporation: Northampton, MA, USA, 2023.
  34. Frisch, M.J.; Trucks, G.W.; Schlegel, H.B.; Scuseria, G.E.; Robb, M.A.; Cheeseman, J.R.; Scalmani, G.; Barone, V.; Petersson, G.A.; Nakatsuji, H.; et al. Gaussian 09; Gaussian, Inc.: Wallingford, CT, USA, 2016. [Google Scholar]
  35. Mosmann, T. Rapid Colorimetric Assay for Cellular Growth and Survival: Application to Proliferation and Cytotoxicity Assays. J. Immunol. Methods 1983, 65, 55–63. [Google Scholar] [CrossRef]
  36. Griess, P. Bemerkungen Zu Der Abhandlung Der HH. Weselsky Und Benedikt “Ueber Einige Azoverbindungen”. Berichte Dtsch. Chem. Ges. 1879, 12, 426–428. [Google Scholar] [CrossRef]
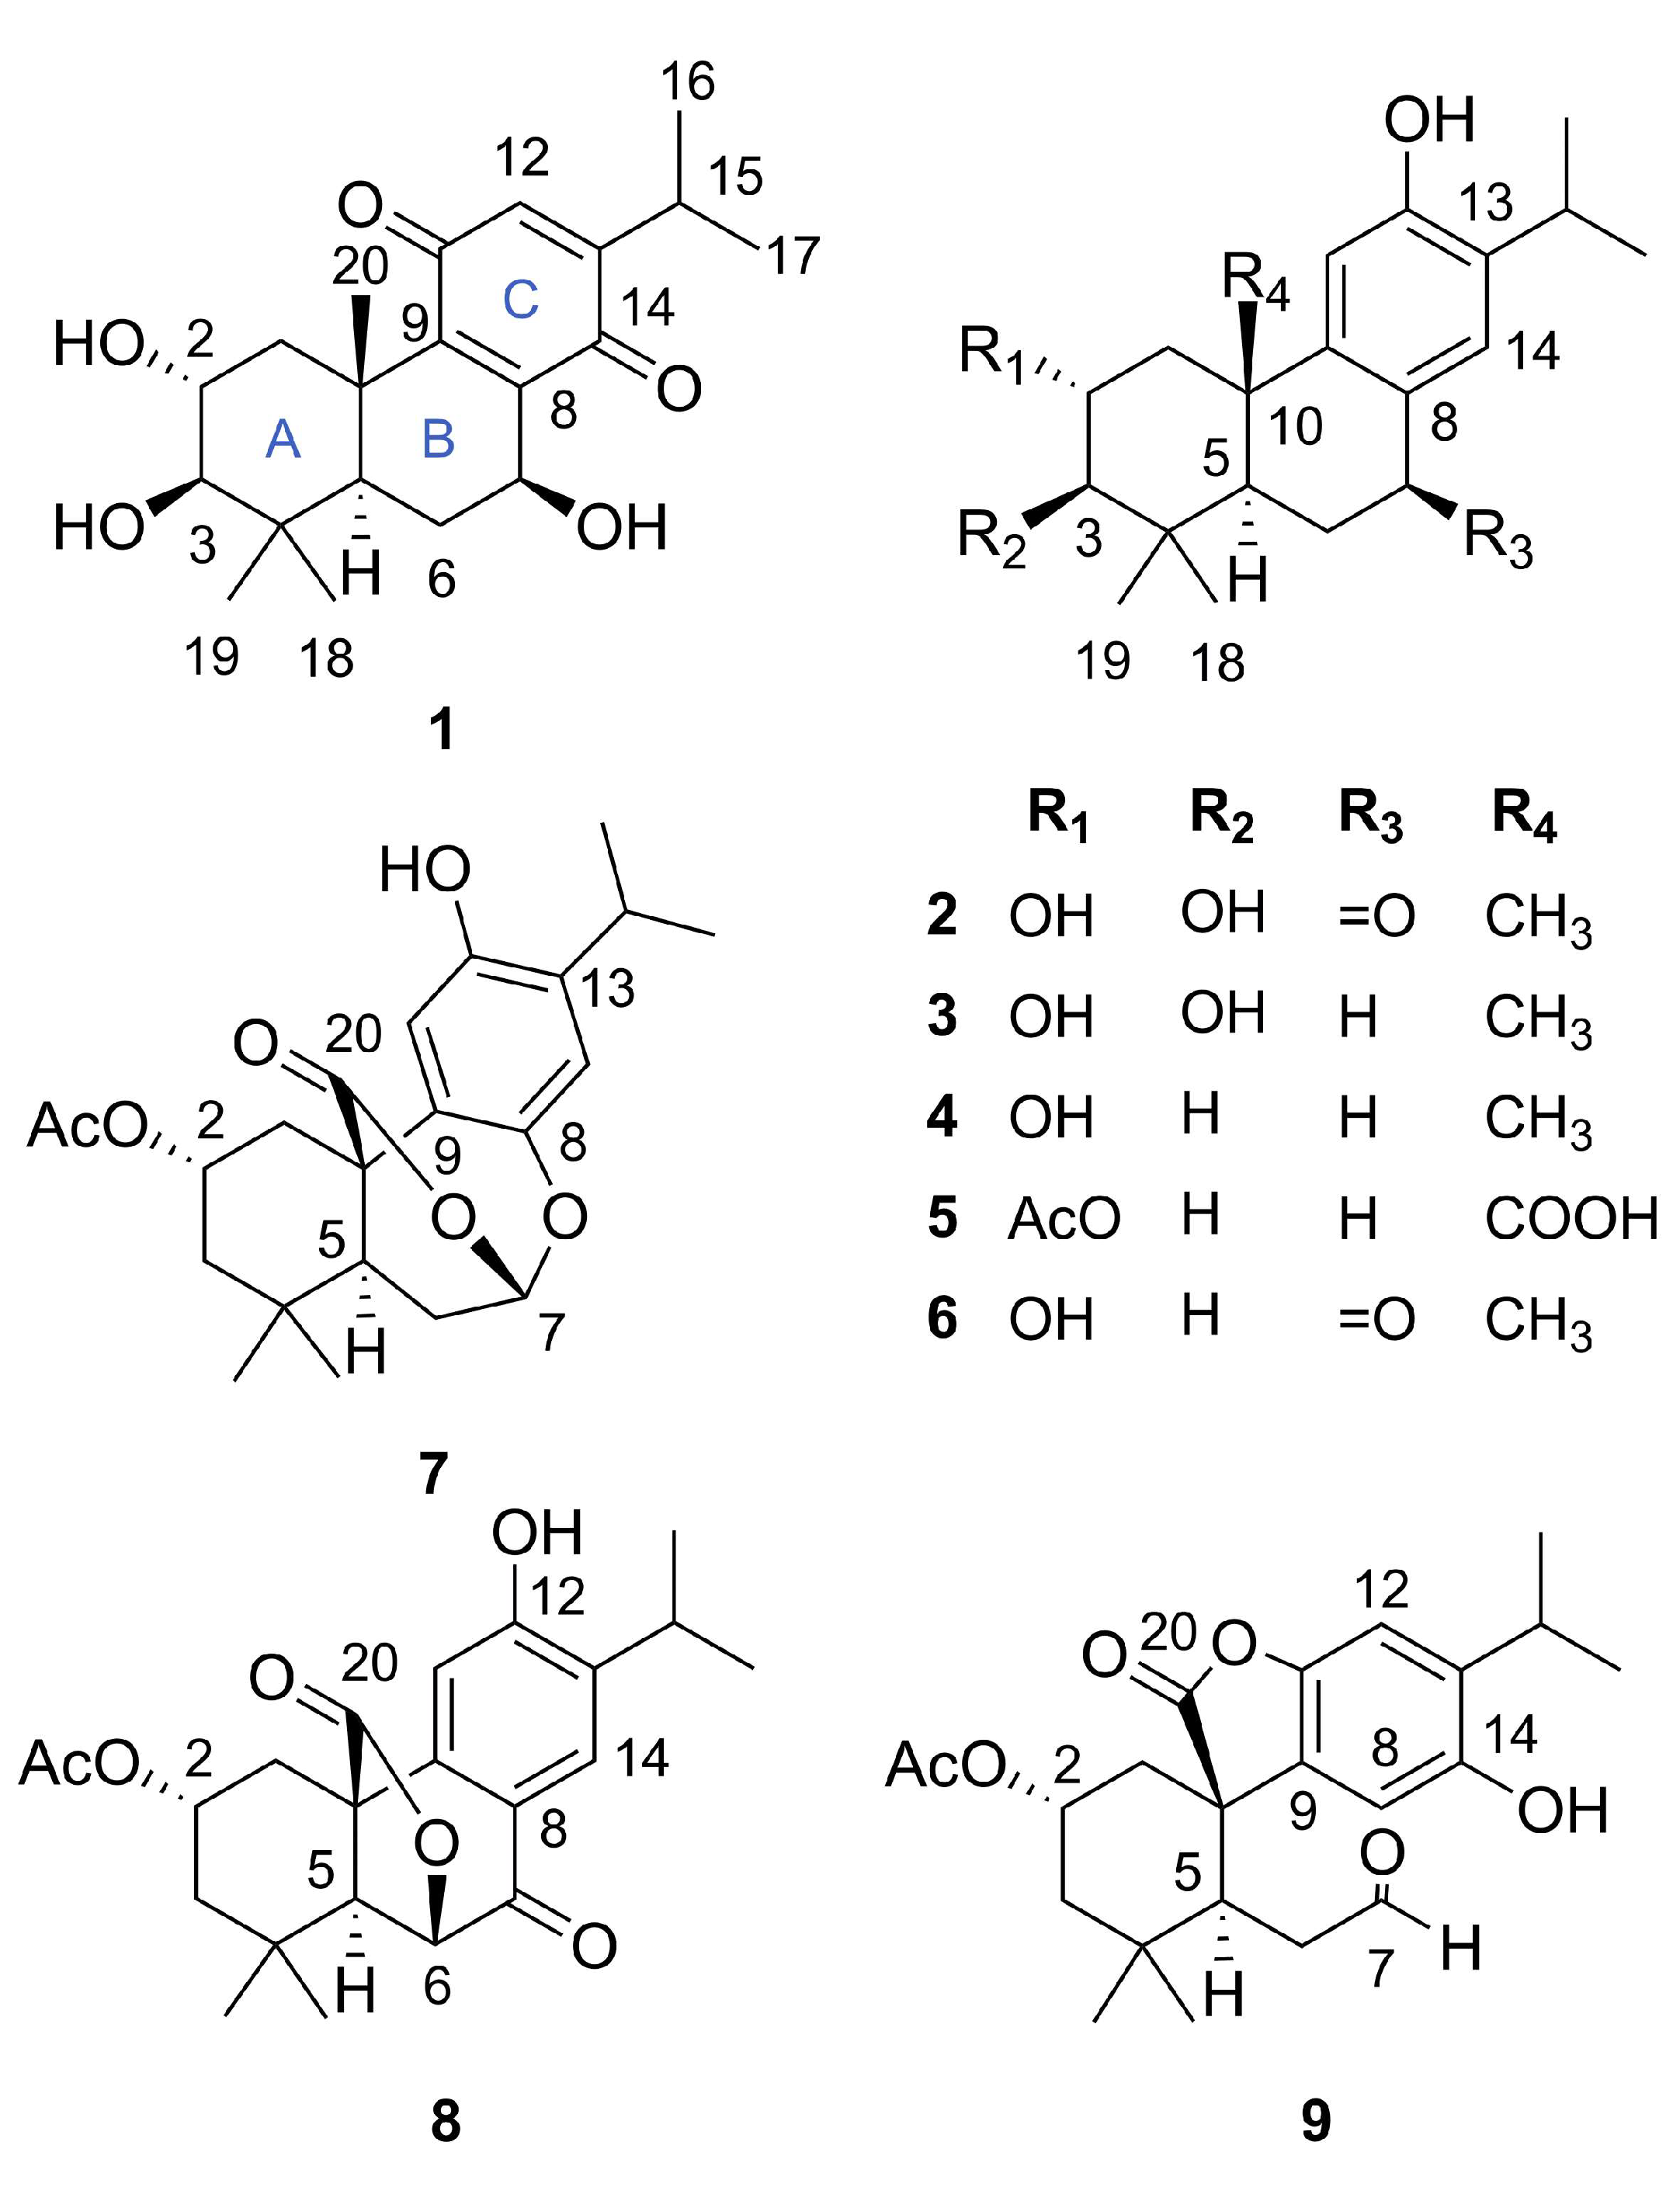
Figure 1. Chemical structures of the isolated abietanes 19.
Molecules 29 02723 g001
Figure 2. Key 1H–1H COSY (Molecules 29 02723 i001) and HMBC (Molecules 29 02723 i002) of compounds 13, 5, and 79.
Molecules 29 02723 g002
Figure 3. Key 1H–1H NOESY (Molecules 29 02723 i003) of compounds 1, 2, 5, and 7.
Molecules 29 02723 g003
Figure 4. Comparison of experimental and calculated ECD curves of compounds 13, 5, and 79.
Molecules 29 02723 g004
Figure 5. Effects of compounds 17 (12.5 μM) on the nitric oxide measurement in LPS and IFN-γ-stimulated BV2 cells. Results are expressed as the mean ± SEM (n = 5) of two independent experiments. B: basal. C: control. Q: quercetin (positive control, 20 µM). # p < 0.05 versus basal group; * p < 0.05 versus control group.
Molecules 29 02723 g005
Figure 6. Effects of compounds 1 and 2 (12.5 μM) on TNF-α measurement in LPS and IFN-γ-stimulated BV2 cells. Results are expressed as the mean ± SEM (n = 5). B: basal. C: control. Q: quercetin (positive control, 20 μM). # p < 0.01 versus basal group; ** p < 0.01 versus control group.
Molecules 29 02723 g006
Table 1. 13C NMR data of compounds 13, 5, and 79.
No.1 a2 b3 b5 b7 a8 a9 a
142.345.646.643.036.832.040.0
268.869.470.070.867.967.366.4
382.883.584.347.745.343.646.1
438.940.540.535.836.334.036.3
548.350.351.553.250.659.545.7
626.136.620.419.626.781.441.8
767.9200.631.130.595.4189.1199.5
8141.9123.7126.5128.7145.8121.8110.2
9150.6157.2148.0139.1121.7143.8128.3
1040.039.939.549.547.349.253.1
11188.0110.6111.6112.4112.3111.0146.6
12132.4162.6153.4153.5148.1159.1108.6
13153.6135.2133.8135.3136.7136.1137.1
14190.1127.3127.4128.2117.3128.2150.2
1526.427.927.727.926.827.027.4
1621.522.823.323.122.322.322.5
1721.422.923.223.222.222.422.8
1828.828.629.432.630.831.433.3
1917.016.917.421.520.822.722.0
2021.124.626.3179.0170.9176.0177.9
2-OCOCH3---21.421.321.421.4
2-OCOCH3---172.6169.9170.0170.3
a Recorded in CDCl3, 125 MHz; b recorded in methanol-d4, 100 MHz.
Table 2. 1H NMR data of compounds 13, 5, and 79 (J in Hz).
No.1 a2 b3 b5 b7 c8 c9 c
11.15, m
3.06, dd (12.7, 4.4)
1.56, t (11.9)
2.55, dd (12.5, 4.3)
1.40, t (12.0)
2.49, dd (12.4, 4.4)
1.27, overlap
3.09, ddd (12.1, 4.5, 2.8)
1.85, t (11.7)
2.77 ddd (11.8, 3.7, 2.4)
1.76, t (12.0)
3.01, dd (12.6, 4.3)
1.71, dd (13.2, 11.7)
2.23, ddd (13.3, 4.0, 2.5)
23.82, ddd (11.5, 9.6, 4.4)3.83, ddd (11.7, 9.6, 4.3)3.78, ddd (11.6, 9.6, 4.4)5.42, tt (11.7, 4.5)5.22, tt (11.5, 3.9)5.04, tt (11.6, 4.1)5.50, tt (11.7, 3.9)
33.01, d (9.6)3.02, d (9.6)2.99, d (9.6)1.86, overlap
1.27, overlap
1.14–1.23, m
1.97, ddd (12.4, 4.1, 2.4)
1.88, m
1.24, overlap
2.03, ddd (12.7, 4.0, 2.5)
1.49, t (12.3)
51.15, m1.89, dd (13.4, 4.2)1.32, dd (12.4, 2.4)1.50, dd (12.8, 2.4)2.15, dd (10.5, 2.0)2.41, s2.34, dd (6.1, 4.6)
62.20, m
1.64, m
2.64, m
2.64, m
1.84, m
1.71, m
2.54, m
1.86, overlap
2.24 ddd (15.9, 6.5, 2.0)
2.35 dd (15.9, 10.5)
4.77, s2.46, ddd (17.8, 4.6, 1.5)
1.94, ddd (17.8, 6.1, 1.5)
74.79, dd (10.2, 7.5)-2.71, m
2.82, m
2.87, m
2.76, m
5.94 d (6.5)-9.19, t (1.5)
8------6.57, s
11-6.76, s6.65, s6.68, s6.69, s6.71, s-
126.36, d (1.2)-----6.86, s
14-7.80, s6.75, s6.85, s6.70, s7.91, s-
152.97, m3.22, sept (6.8)3.16, sept (6.8)3.18, sept (6.8)3.08, sept (6.8)3.16, sept (6.8)3.16, sept (6.9)
161.10, s1.19, d (6.8)1.16, d (6.8)1.17, d (6.8)1.18, d (6.8)1.23, s1.20, d (6.9)
171.08, s1.21, d (6.8)1.15, d (6.8)1.17, d (6.8)1.19, d (6.8)1.24, s1.18, d (6.9)
181.07, s1.06, s1.07, s1.02, s0.86, s1.07, s0.94, s
190.91, s0.98, s0.89, s0.93, s0.96, s1.05, s1.23, s
201.40, s1.27, s1.19, s----
2-OCOCH3---2.02, s2.05, s2.06, s1.99, s
a Recorded in CDCl3, 400 MHz; b recorded in methanol-d4, 400 MHz; c recorded in CDCl3, 500 MHz.
Table 3. Cell viability (%) of BV2 cells treated with compounds 17.
CompoundCell Viability (%)
12.5 µM25 µM50 µM
187.95 ± 2.5785.09 ± 1.5476.28 ± 2.16
281.93 ± 0.6585.84 ± 0.8574.95 ± 3.11
387.39 ± 2.3582.19 ± 0.9676.37 ± 3.14
492.29 ± 0.6085.41 ± 0.8273.61 ± 2.73
586.18 ± 4.5386.80 ± 2.5282.90 ± 3.63
685.71 ± 1.1181.71 ± 1.3766.81 ± 3.61
782.74 ± 0.6284.91 ± 1.4081.83 ± 1.24
Results are expressed as the mean ± SEM (n = 5) of two independent experiments.
Table 4. The IC50 values of compounds 1 and 2 on nitric oxide production inhibition in LPS and IFN-γ-stimulated BV2 cells.
CompoundIC50 (µM) 2
13.12 ± 0.75
215.53 ± 7.56
Quercetin 111.8 ± 1.5
1 IC50 means half maximal (50%) inhibitory concentration. Results are presented as the mean ± SEM (95% confidence interval). 2 Quercetin was used as positive control.
Disclaimer/Publisher’s Note: The statements, opinions and data contained in all publications are solely those of the individual author(s) and contributor(s) and not of MDPI and/or the editor(s). MDPI and/or the editor(s) disclaim responsibility for any injury to people or property resulting from any ideas, methods, instructions or products referred to in the content.