Article

Gadolinium Effects on Liposome Fluidity and Size Depend on the Headgroup and Side Chain Structure of Key Mammalian Brain Lipids

1
Department of Biological Sciences, University of Calgary, Calgary, AB T2N 1N4, Canada
2
Fuel Innovation, Calgary, AB T2G 3K6, Canada
*
Author to whom correspondence should be addressed.
These authors contributed equally to this work.
Molecules 2024, 29(1), 135; https://doi.org/10.3390/molecules29010135
Submission received: 28 November 2023 / Revised: 21 December 2023 / Accepted: 21 December 2023 / Published: 25 December 2023

Abstract

:
The lanthanide metal gadolinium has been used in the healthcare industry as a paramagnetic contrast agent for years. Gadolinium deposition in brain tissue and kidneys has been reported following gadolinium-based contrast agent administration to patients undergoing MRI. This study demonstrates the detrimental effects of gadolinium exposure at the level of the cell membrane. Biophysical analysis using fluorescence spectroscopy and dynamic light scattering illustrates differential interactions of gadolinium ions with key classes of brain membrane lipids, including phosphatidylcholines and sphingomyelins, as well as brain polar extracts and biomimetic brain model membranes. Electrostatic attraction to negatively charged lipids like phosphatidylserine facilitates metal complexation but zwitterionic phosphatidylcholine and sphingomyelin interaction was also significant, leading to membrane rigidification and increases in liposome size. Effects were stronger for fully saturated over monounsaturated acyl chains. The metal targets key lipid classes of brain membranes and these biophysical changes could be very detrimental in biological membranes, suggesting that the potential negative impact of gadolinium contrast agents will require more scientific attention.

Graphical Abstract

1. Introduction

Gadolinium (Gd) is a silver–white metal with the atomic number 64; it belongs to the lanthanide series. Lanthanides, including Gd, are found in coordination with phosphates or a variety of carbonite-based minerals that are largely mined in China, as well as other smaller reservoirs across the globe [1,2]. Gd is used in many industries to improve the corrosion resistance and tensile properties of metal alloys [3]. Other applications include electronic and optical components resulting in the annual production of hundreds of tons [4]. Improper disposal of electronic waste in landfills may result in increased redistribution into the environment [5].
Gd has seven unpaired electrons in the 4f molecular orbital, resulting in a large magnetic moment that is utilized to greatly increase the contrast in magnetic resonance imaging (MRI) [6,7]. The most common form in aqueous solutions is the trivalent oxidation state (Gd3+). Gd3+ is hydrated by eight–nine water molecules and the electron donation reduces the positive charge of the ion. At physiological pH and salt conditions, the metal speciates into Gd3+ at 86.8%, GdOH2+, GdCl2+, and GdNO32+ at 8.6%, 3.5%, and 1.1%, respectively, as calculated by using the Visual MINTEQ software package (version 4.0) based on thermodynamic data [8].
Gd3+ has an ionic radius of 0.99 Å, which is almost identical to Ca2+, leading to disruptions of calcium signaling, such as calcium-dependent protein channels [9]. Moreover, the trivalent ion can outcompete Ca2+, leading to a higher binding capacity for the Ca2+-binding enzyme [10]. Gd is a hard Lewis acid that readily interacts with hard bases like phosphates and carboxyl groups [10]. Therefore, proteins, lipids, and nucleic acids are all potential binding targets, which may result in a wide range of possible negative effects on the body.
Gd-based contrast agents (GBCAs) are important tools for MRI brain imaging, whereby linear or macrocyclic chelators form thermodynamically favorable Gd-ligand complexes [11]. While these contrast agents have demonstrated significant contrast for MRI applications, there is evidence that patients with pre-existing renal impairment developed nephrogenic systemic fibrosis upon GBCA administration [12]. The extent and localization of Gd deposition following dissociation depend on the ligand structure. The most common deposition occurs in the bone and liver. However, post-mortem analysis for subjects without renal conditions also showed Gd3+ accumulation in the brain, depending on the GBCA structure administered [13]. Free Gd3+ resulted in the release of chemokines and cytokines in human macrophages and monocytes, respectively, both ultimately leading to the development of fibrosis [14,15]. Moreover, increases in reactive oxygen species (ROS) and apoptosis were also observed in rat cortical neurons [16]. Moreover, 3 µM Gd3+ blocked the hydrolysis of ATP and ADP in the aorta of Wistar rats [17].
Finally, the use of GBCAs leads to increased contamination of drinking water, as GBCAs are susceptible to degradation in the sewer and water treatment plants [5], as shown by drastically increased free Gd3+ concentrations in water systems surrounding Berlin, following the approval of a GBCA (Gd-DTPA) years prior [5,18]. This could increase potential exposure to both patients and the public in locations where MRI and GBCAs are used routinely.
When considering the effects of Gd3+ at the cellular level, biomembranes must be considered as potential targets for both the liver and the brain. While it has been shown that Gd3+ and Gd- complexes can negatively affect the functions of various channels and enzymes [19], interactions between free Gd3+ and the lipid components are much less investigated. Early work showed that the addition of Gd3+ to multilamellar vesicles of fully saturated dipalmitoyl phosphatidylcholine (DPPC) at a Gd3+/lipid molar ratio of 0.5 stabilized the packing in the gel phase and increased the phase transition temperature from 41 °C to 46 °C [20]. This suggests a significant reduction in membrane fluidity of a model membrane that is already very rigid.
Fluidity is an important property of biological membranes; it influences essential functions, such as membrane permeability, lateral motion of lipids and proteins in the bilayer, as well as protein conformation and activity [21]. This important parameter is measured by using the amphipathic fluorescent dye Laurdan, which readily incorporates into large unilamellar vesicles. Its emission spectrum is sensitive to the polarity of the surrounding environment; less polar environments promote an emission maximum at a shorter wavelength (440 nm), whereas more polar environments result in a shift to 490 nm. The ratio of these intensities allows the calculation of the generalized polarization (GP), which is a measure of membrane fluidity (see Section 4 for details) [22].
We previously compared the impact of Gd on membrane fluidity with the effects of other toxic metals (Pb2+, Cd2+, Ni2+) or essential/non-toxic metals (Ca2+, Mn2+, Co2+), and Gd3+ induced the strongest decrease in fluidity [6]. Like other cations [23], Gd3+ targeted negatively charged lipids and preferred saturated over unsaturated membranes [6]. In contrast to the others, except for Pb2+ [6], Gd3+ was able to induce rigidity in sphingomyelin (SM)-containing membranes as well as complex brain lipid extracts [6].
This ability to affect brain membranes and the deposition of Gd into the brain [13] provide the rationale to investigate the dose-dependent effect of Gd on key lipid classes in brain membranes; namely phosphatidylcholine (PC) and SM. Moreover, this includes a biomimetic model membrane based on the myelin sheath [24] and brain polar lipid extracts.
Positively charged ions have been shown to promote liposome aggregation [25] as well as membrane fusion [23]. Previous data indicated a stronger potential of Gd3+ to increase the size of liposomes composed of polar brain lipid extract to a greater extent than liposomes composed of partly unsaturated and negatively charged phosphatidylserine (PS) [6], at the same metal concentration. These changes are determined by dynamic light scattering [6].
The selected biophysical tools will determine the binding affinity of Gd3+ to biomimetic brain membranes and extracts and its concentration-dependent effects on membrane fluidity and liposome size. This allows assessing the potential detrimental effects of Gd on brain membranes, and ultimately the aim of this study is to characterize the extent of Gd interactions with key lipid classes of these systems.

2. Results

The impact of Gd3+ on membrane fluidity was assessed first on the key lipid classes of brain membranes, namely phosphatidylcholine (PC) and sphingomyelin (SM) (Figure 1). Both are zwitterionic lipids and carry a phosphocholine headgroup, with a localized positive charge on the nitrogen and a negative charge on the phosphate group. These experiments also tested the impact of the acyl chain architecture, with partly unsaturated palmitoyl-oleoyl-PC (POPC) (Figure 1A) compared to fully saturated dimyristoyl-PC (DMPC) (Figure 1B). Moreover, differences in the SM side chain were assessed by comparing Egg SM (ESM) (Figure 1C), composed of mainly saturated and shorter side chains, to Brain SM (BSM), with longer chains and an appreciable amount of unsaturation (21%).

2.1. Impact of Gd3+ on the Fluidity of PC Membranes

Membranes composed of partly unsaturated POPC are fluid and exhibit a phase transition temperature (Tm) from the more rigid gel phase to the more fluid liquid crystalline phase near −2 °C [26], which is outside the range of fluorescence experiments in aqueous solutions. The starting GP value of 0.13 also reflects a fluid membrane (Figure 2). PCs contain the largest head group of the glycerophospholipid classes, which—combined with their zwitterionic nature—limit the interactions of divalent ions (e.g., Cd [25], Mn [27] Co, Ni [28]). The addition of metals to the liposomes limits their interactions with the outer leaflet during the time course of these experiments. Moreover, 16.7 μM and 50.0 μM Gd3+ were added to POPC (Figure 2), which corresponds to a lipid/metal ratio of 3/1 and 1/1, respectively. The metals resulted in minimal effects on rigidity at 10 °C (0.007 and 0.012 increases in GP for 16.7 and 50 µM, respectively) and moderate increases at 40 °C (0.018 and 0.019 increases in GP for 16.7 and 50 µM, respectively).
Next, the fully saturated (DMPC) was investigated (Figure 3), which exhibits tighter packing, leading to a significantly higher Tm of 24 °C [29]. GP allows the determination of Tm above 5 °C, which avoids condensation and crystal formation. The inflection point of the inverse sigmoidal curve represents the Tm. The starting value of 0.4 reflects a rigid membrane as expected for the gel phase of DMPC.
The addition of 16.7 μM Gd3+ increased rigidity both in the gel and liquid crystalline phases, and this effect progressively increased with 50.0 μM Gd3+ (Figure 3). These effects represent an increase in membrane rigidity across the entire temperature range. Moreover, Tm is also increased in a metal concentration-dependent manner (26 °C at 16 µM and 27 °C at 50 µM) and this change indicates a stabilization of the rigid gel phase.

2.2. Impacts of Gd3+ on the Fluidity of SM Membranes

SM lipids contain the same phosphocholine head group as PC lipids. However, these lipids contain a sphingosine backbone linked to a fatty acid chain via an amide bond at position 2. Furthermore, they contain a hydroxyl on position 3, which provides another means of hydrogen bonding for these lipids, making SM membranes usually more rigid than PC systems.
The lipid and fatty acid composition of naturally sourced SMs (brain, egg) and the lipid composition of sphingomyelin-containing extracts and biomimetic model systems are shown in Table 1.
Brain sphingolipid (BSM) extracted from porcine brain, with its side chain composition as provided by the supplier, is presented in Table 1. The vast majority are saturated chains with 18 carbons or more, but the extract contains 21% of long-chain monounsaturated fatty acids (24:1). This mixture will exhibit packing defects, which will facilitate the access of metals to the phosphate groups. BSM displays a broad transition at around 39 °C [30], presumably due to the prevalence of long saturated chains; this is also reflected in a high GP starting value of 0.34 (Figure 4).
Table 1. Average fatty acid distributions (%) of porcine brain and chicken egg sphingomyelin; acquired from Avanti Polar Lipids, followed by lipid compositions (%) of porcine brain polar extracts and the myelin sheath mimic, obtained from Avanti Polar Lipids [24,31].
SystemFatty Acid/Lipid DistributionPercentage (%)
Brain sphingomyelinPalmitic (16:0)2
Stearic (18:0)50
Arachidic (20:0)5
Behenic (22:0)7
Lignoceric (24:0)5
Nervonic (24:1)21
Unknown10
Egg sphingomyelinPalmitic (16:0)86
Stearic (18:0)6
Behenic (22:0)3
Nervonic (24:1)3
Unknown2
Brain polar extractPC12.6
PE33.1
PI4.1
PS18.5
PA0.8
Unknown30.9
Myelin sheath mimicPalmitoyl oleoyl phosphatidylcholine (POPC)10
Ethanolamine plasmalogen12
Palmitoyl oleoyl phosphatidylserine (POPS)5
Glucosylceramide15
Cholesterol40
Brain SM18
Additions of 16.7 μM and 50.0 μM Gd3+ (Figure 4) to BSM membranes increased their rigidity to a similar extent, suggesting the potential saturation of binding. Slightly lower effects at the onset indicate that the rigid membrane well below the Tm can resist further rigidification, whereas the slightly weaker increase above 50 °C is due to a more fluid membrane at a higher temperature that partly compensates for the metal effect.
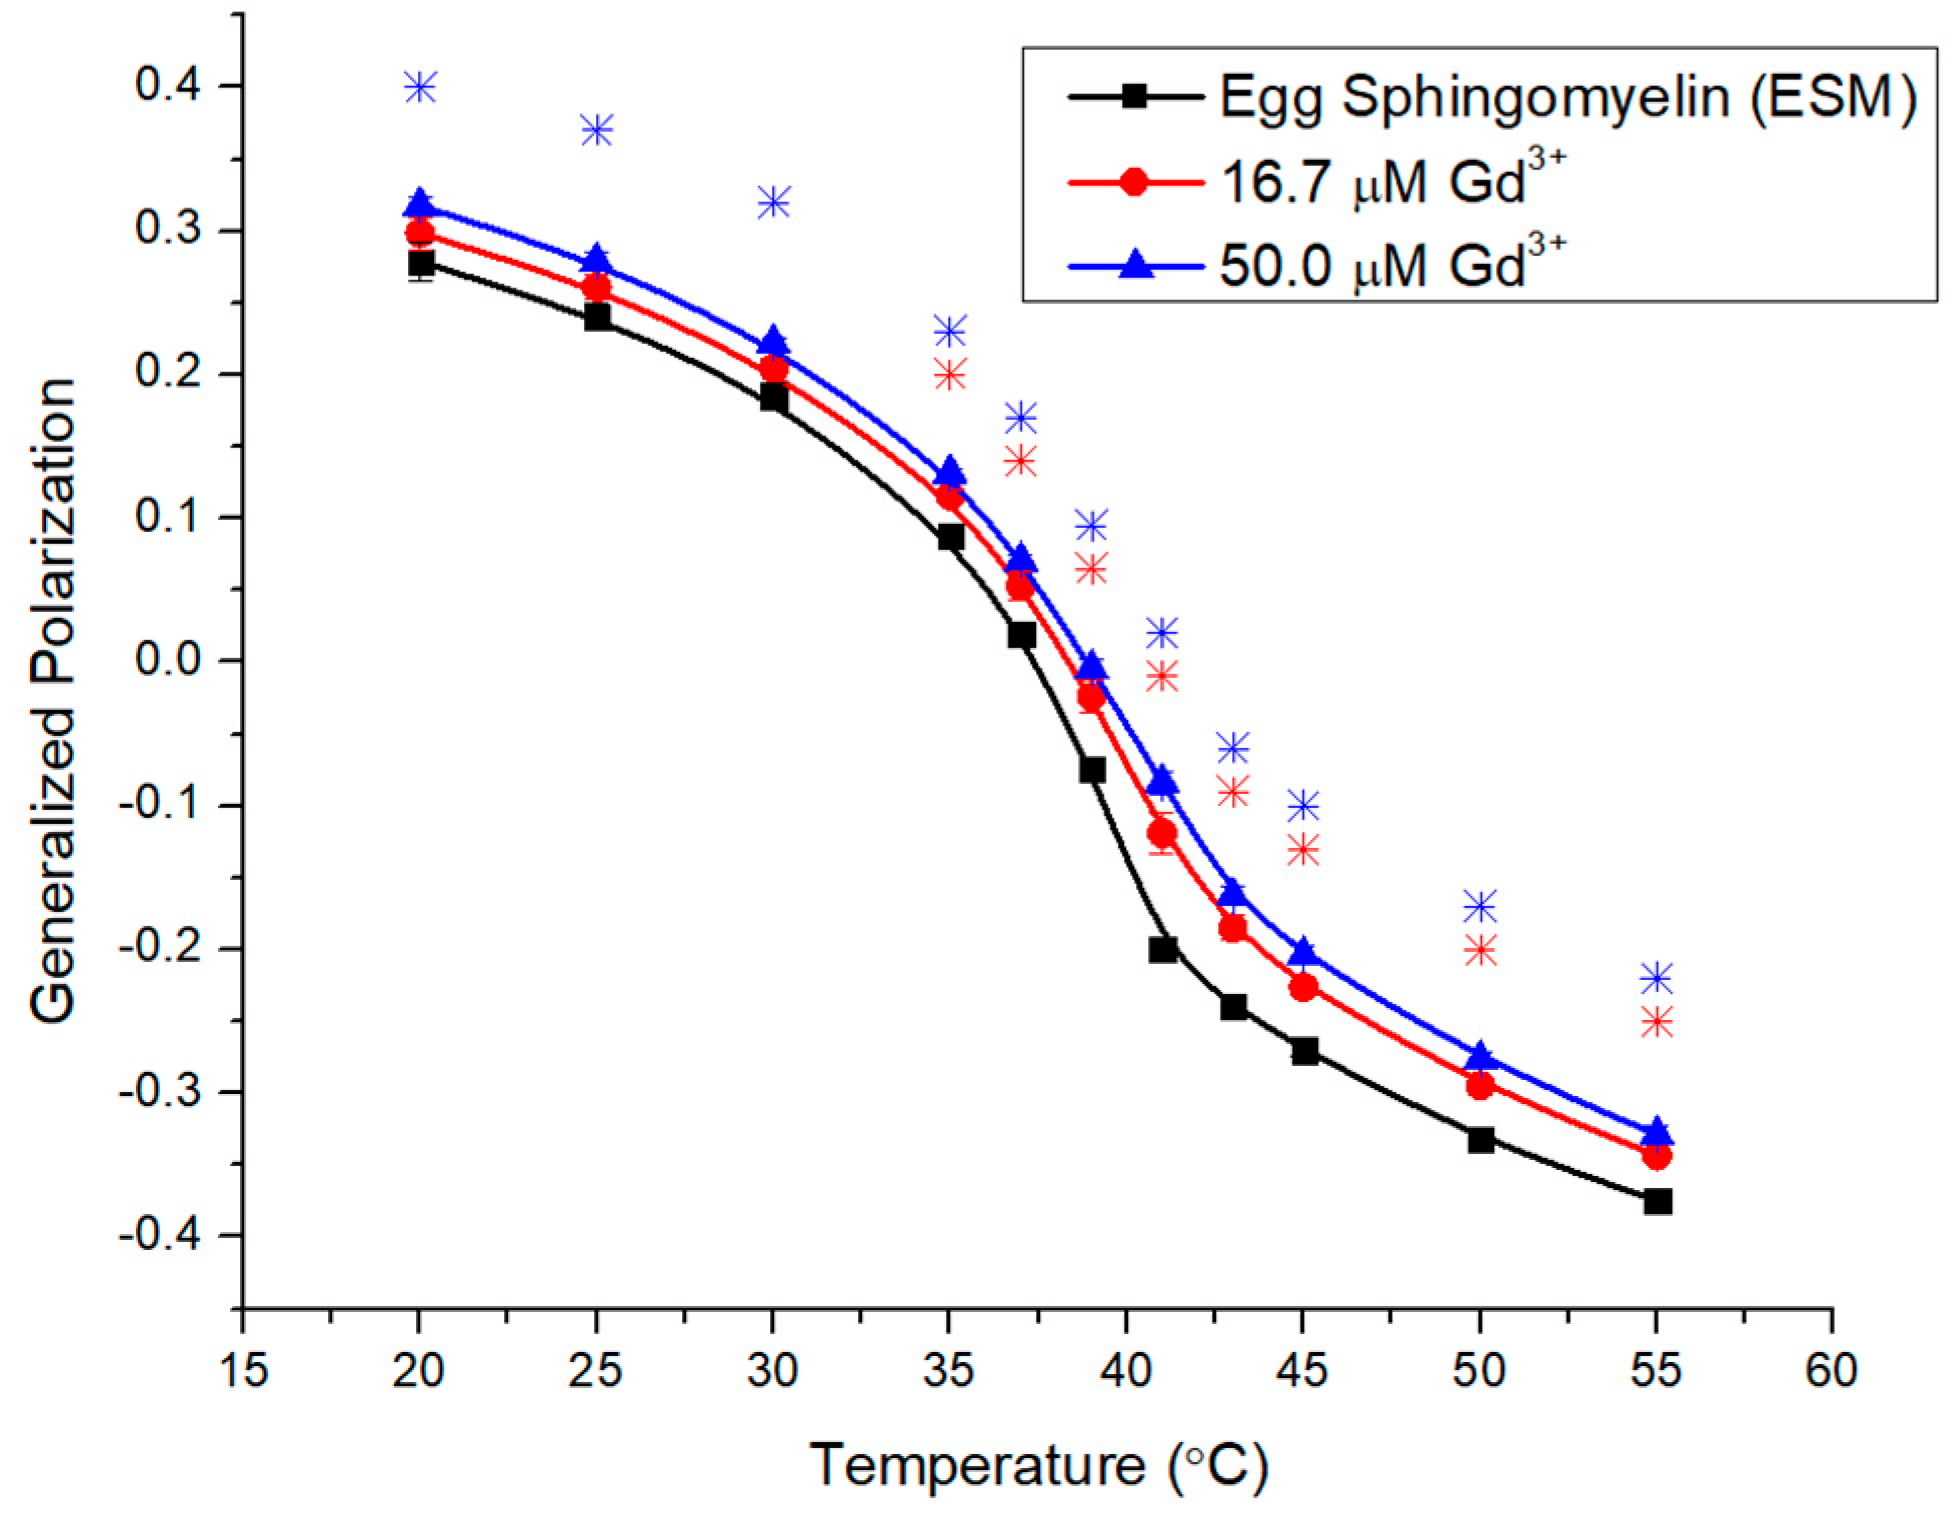
The composition of Egg SM (ESM) is shown in Table 1 and the system contains mostly saturated lipids, whereby 86% are 16:0 chains (Figure 1C), shorter than in the brain matrix. The Tm has been reported as ~38.5 °C and the broader transition of 4 °C [32] is due to the heterogeneous composition. A starting GP value of 0.29 still reflects a rigid membrane, comparable to the brain system (Figure 5).
Figure 5 illustrates a rigidifying effect for ESM upon additions of 16.7 μM and 50.0 μM Gd3+. The increases are consistent across the entire temperature range and the effects are stronger than in BSM but less than those seen for DMPC (Figure 3). The higher concentration induced less additional rigidification, suggesting that the system may be approaching saturation.

2.3. Impacts of Gd3+ on the Fluidity of Complex Membranes

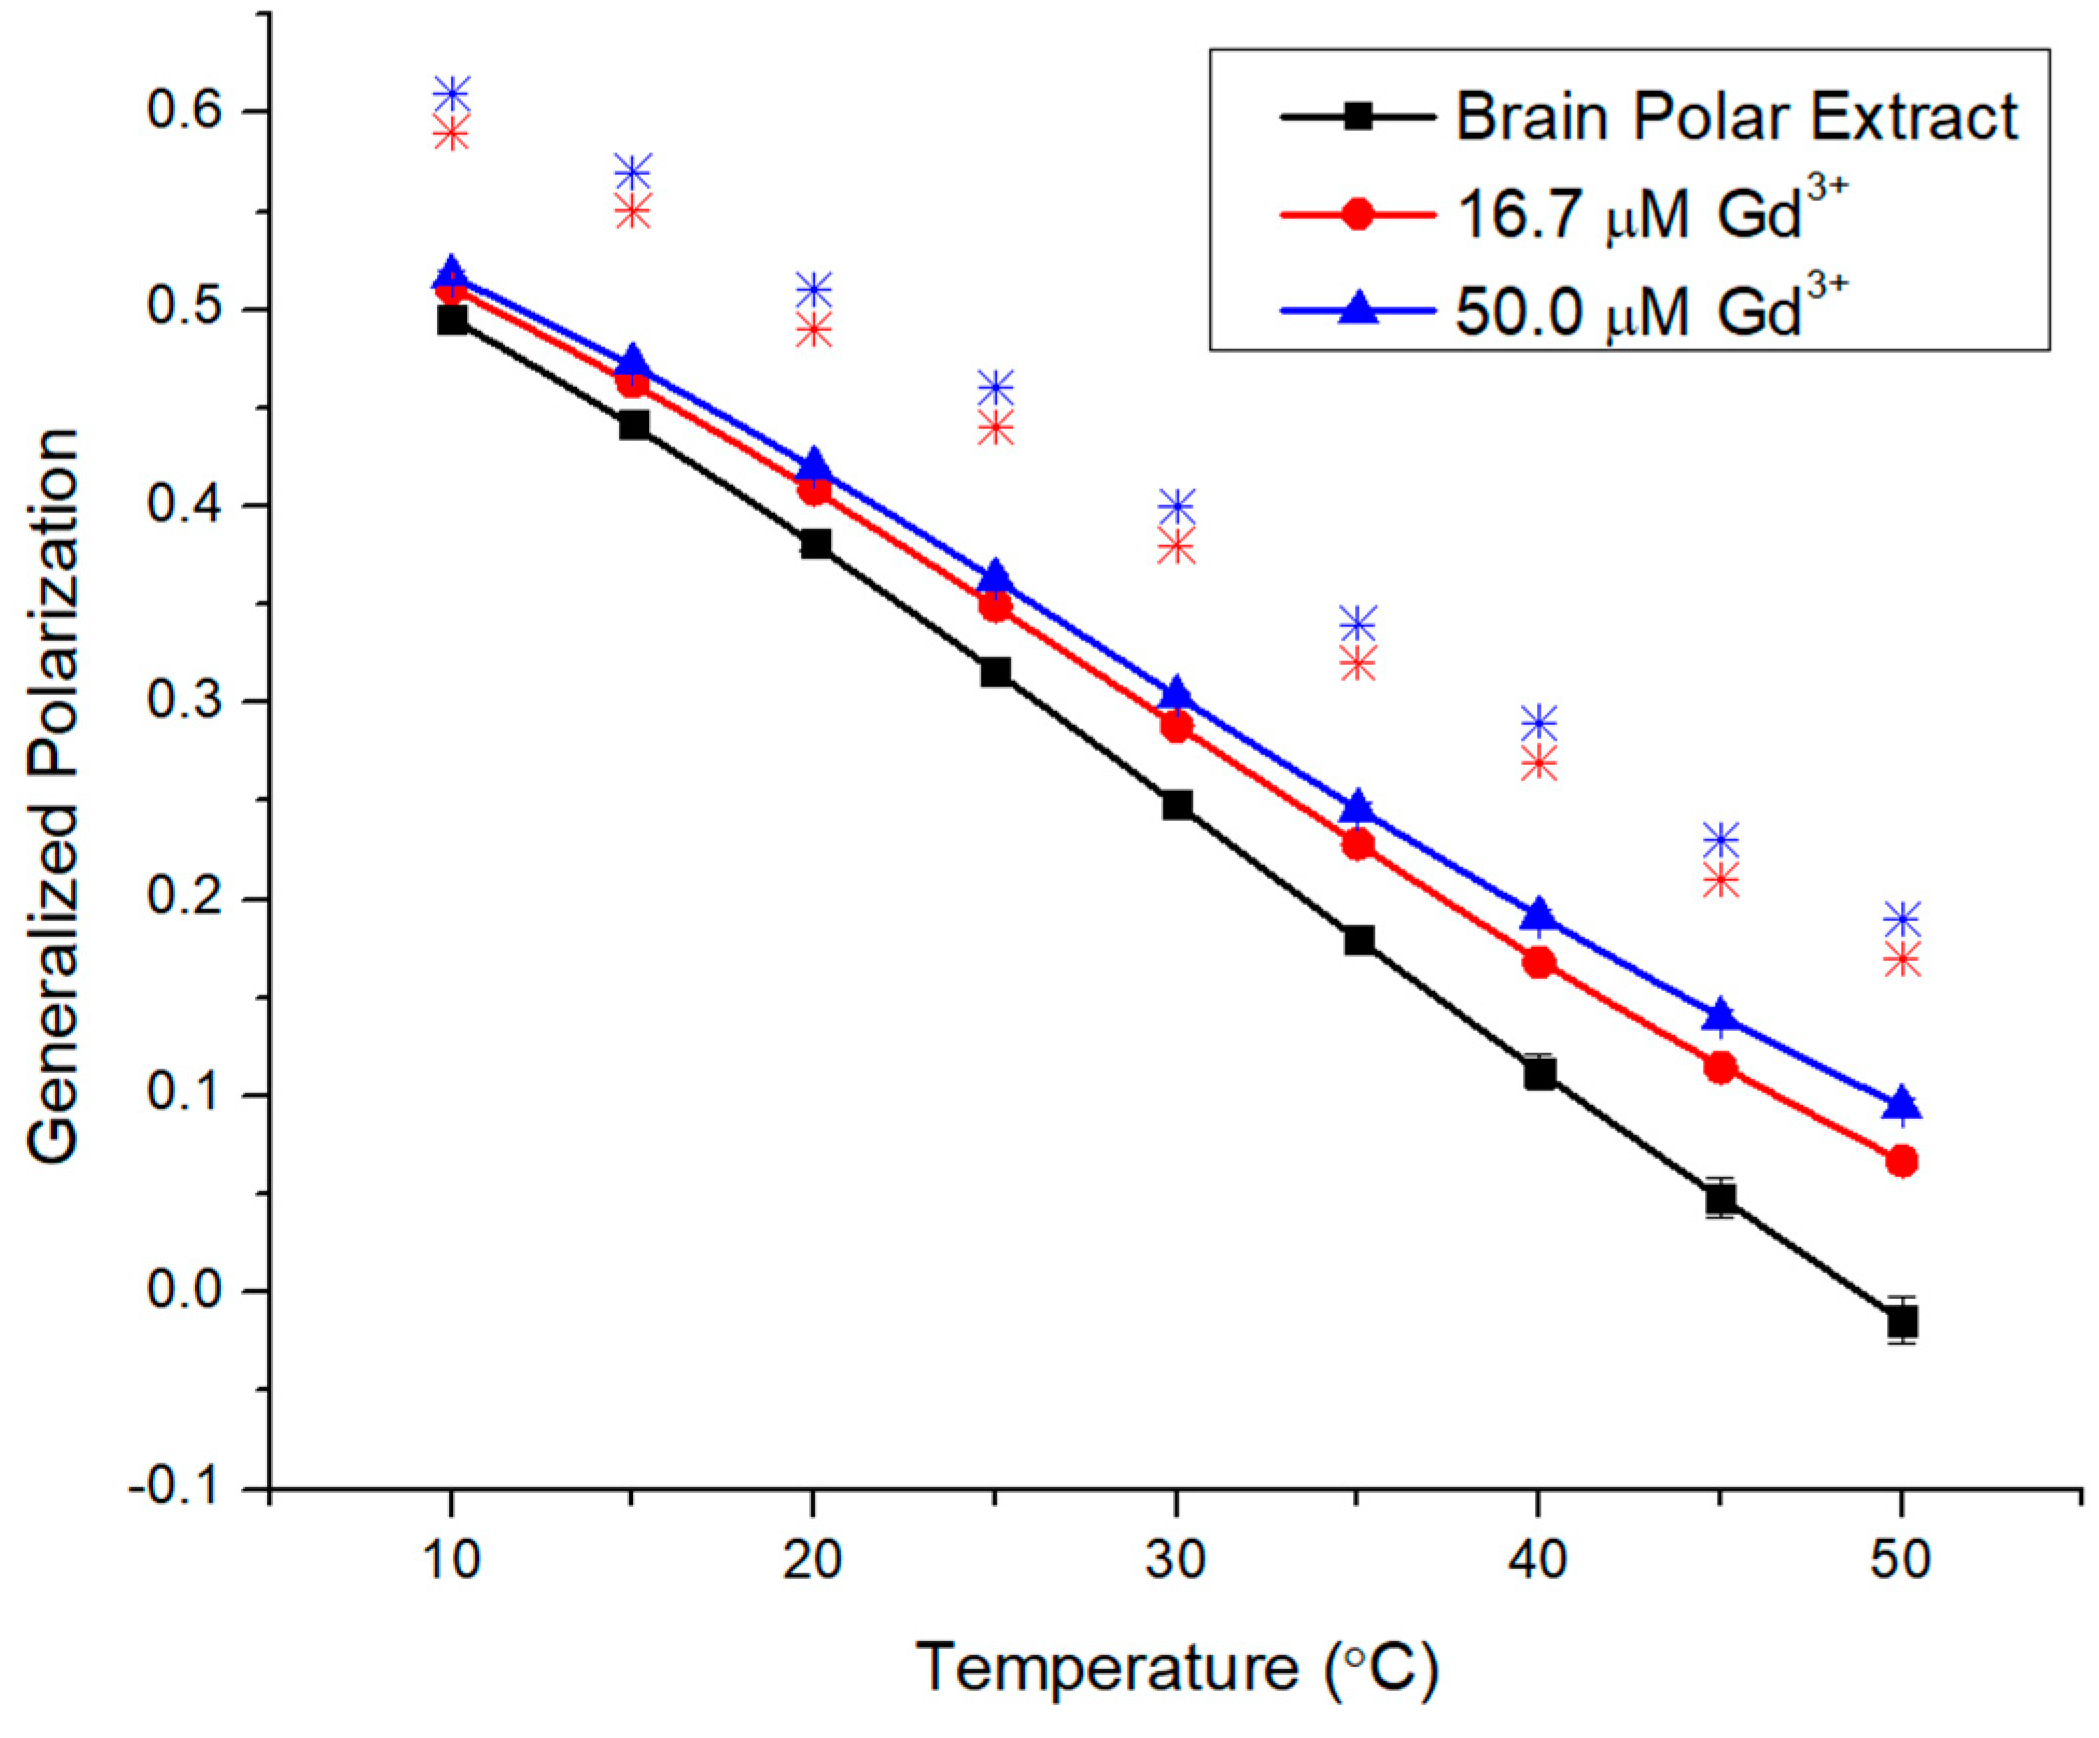
Brain polar lipid extracts and a biomimetic brain model were used to investigate the influence of Gd on membrane fluidity and liposome size, in relation to lipid composition (Table 1). The first complex membrane was brain polar extract (BPE); it contains the zwitterionic lipids PC and PE, but also ~24% of anionic lipids (PS, PI, PA). There is an unknown component that may contain several other negatively charged lipids. Figure 6 shows that the additions of 16.7 μM and 50.0 μM Gd3+ progressively increased the GP values with temperature. The starting GP of 0.5 is higher than previous systems, reflecting a very rigid membrane. The continuous decreasing slope with temperature suggests that there is no phase transition in the experimental range. The GP changes at 10 °C are comparable to BSM and smaller than seen for ESM and DMPC, but the GP changes at the high-temperature end (50 °C) exceed previous readings for fluid membranes. Moreover, GP changes at 40 °C are substantial (0.056 and 0.079 increases in GP for 16.7 and 50 µM Gd3+, respectively).
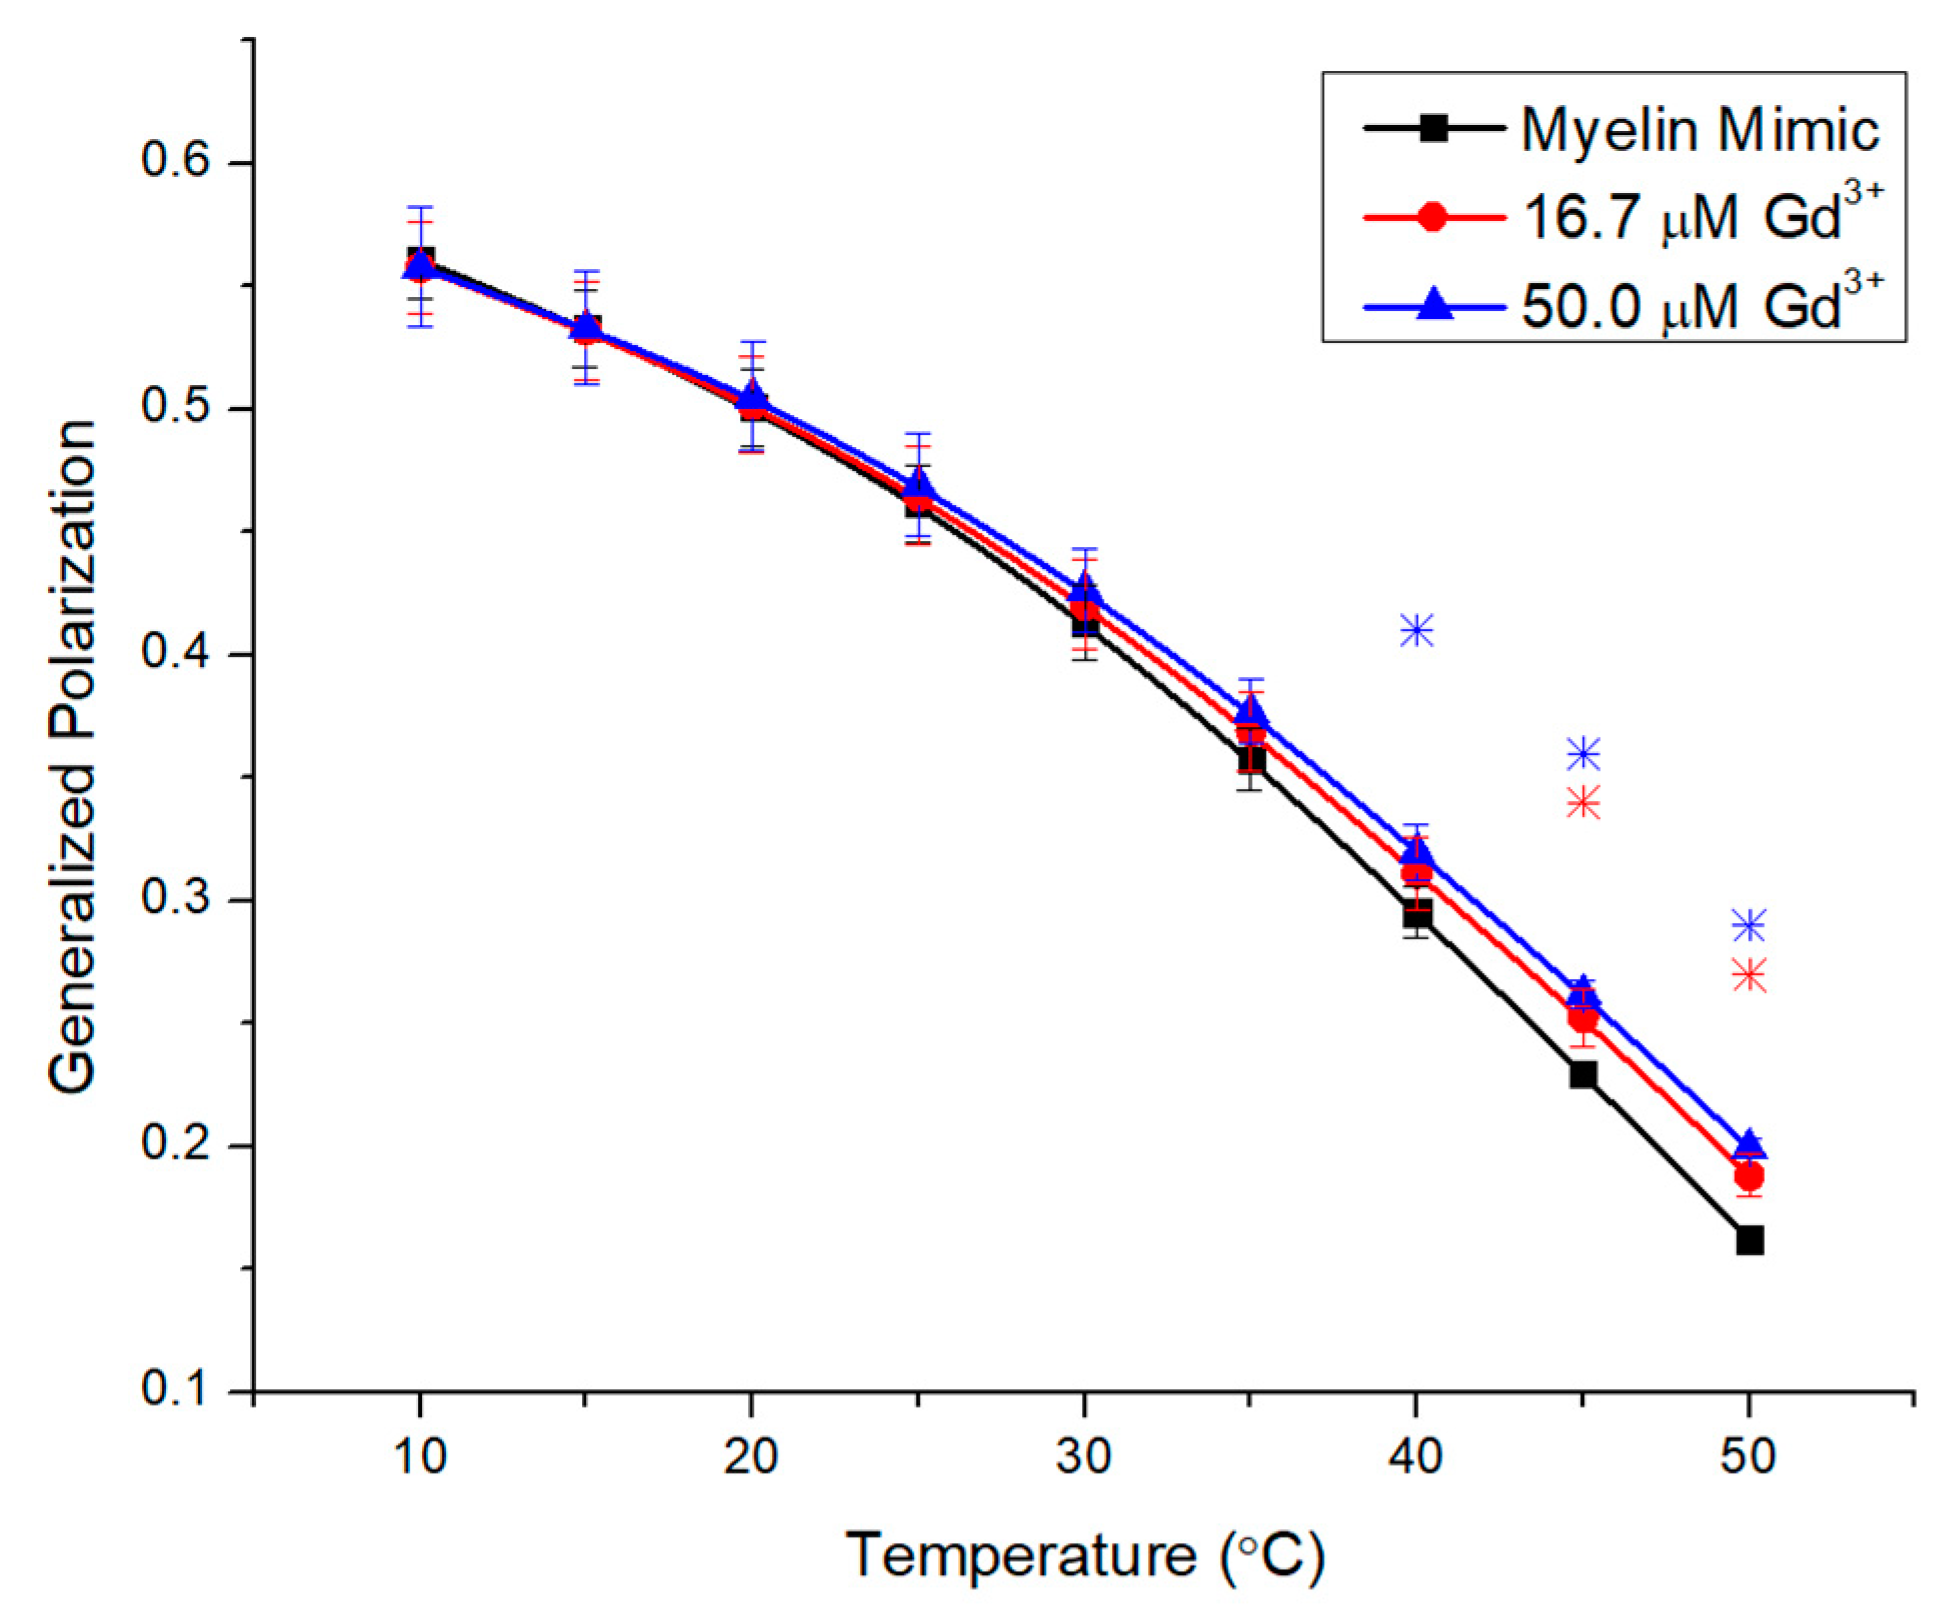
Lastly, we investigated a well-defined myelin mimic (MM) based on published lipid analyses [24] with zwitterionic POPC, PE plasmalogen, and BSM, along with neutral cholesterol and glucosylceramide, and the negatively charged POPS. The highest starting GP of 0.55 (Figure 7) reflects a very rigid membrane, which is accepted since BSM, Chol, and GlyCer promote rigidity in membranes. The Tm of GlyCer was reported at 87 °C [33]. Thus, it is not surprising that the additions of 16.7 μM and 50.0 μM Gd3+ did not change the GP values in the low-temperature ranges. However, more substantial increases to membrane rigidity are observed in higher temperatures.

2.4. Impacts of Gd3+ on Liposome Size

Following the investigation of membrane fluidity, dynamic light scattering (DLS) was used to determine changes in the liposome size upon the addition of Gd (Table 2). The moderate size increases for POPC between 10 and 20 nm are not significantly different for both metal concentrations. The same range is seen for DMPC at 16.7 µM Gd3+, but a more pronounced increase by ~50 nm for DMPC confirms trends seen by GP. SM-containing systems exhibited stronger increases in liposome size with an ~80 nm range for both metal concentrations and BSM. In contrast, ESM samples showed much larger increases and the solution became cloudy in the presence of the metal, suggesting liposome aggregation and potential sedimentation. Thus, the values in the table are only intended to illustrate this fact and not as defined size changes. This difference exceeds trends seen with GP, and more work will be needed to dissect the reason for this pronounced aggregation. The highest binding affinity, as reflected by GP trends, is matched by size increases for the BPE by ~ 39 and 120 nm for 16.7 and 50 µM Gd3+, respectively. The less pronounced affinity for the myelin mimic is reflected in size increases of ~14 and 69 nm, respectively.

3. Discussion

Heavy metal-induced toxicity has been a concern due to widespread metal use in various industries, leading to airborne emissions and human uptake by water and food [34]. In the context of this work, patients can be exposed to Gd as a key component of MRI contrast agents [10]. Although Gd is used in a chelated form, the presence of free Gd effluent from healthcare centers has been documented in wastewater [5,18].
Gd accumulation has been reported in the kidneys, leading to nephrogenic systemic fibrosis [12], and in the brain following GBCA administration [17]. The latter observation prompted the investigation of the impact of Gd3+ on key brain lipid classes, its impact in terms of membrane fluidity, as monitored by Laurdan GP, and its effects on liposome size, as measured by DLS.
The selected lipids, phosphatidylcholine and sphingomyelin, are enriched in brain membranes [35]. Both carry a phosphocholine headgroup (see Figure 1) and are compared in terms of side chain architecture. The terminal methyl groups increase the headgroup size, thereby reducing lipid packing. Moreover, the headgroup exhibits a relatively small angle from the bilayer plane. This brings the localized positive charge on the nitrogen into proximity with the localized negative charge on the phosphate group of a neighboring lipid.
POPC represents the most common choline species ([36] and refs. within). This lipid adopts fluid membranes and only exhibits very limited interactions with Gd3+. In contrast, the fully saturated DMPC (14:0-PC) results in tighter lipid packing, and Gd3+ induces significant increases in membrane rigidity across the entire temperature range and shifts the Tm to higher values as well. A similar observation was reported for differential scanning calorimetry (DSC) results, where lanthanides, including Gd, increased the phase transition temperature of saturated DPPC (16:0-PC) and were able to replace bound Ca2+ [20]. In contrast, divalent cations, such as Mn2+ [27] and Cd2+ [25], or Co2+ and Ni2+ [28], did not exhibit notable interactions with both PCs. Only Pb2+ showed a moderate increase in rigidity, albeit at much higher metal concentrations (2.1 mM) [6].
One potential explanation could be the hydration properties of the N(CH3)3-methyl ends of PC, as computer simulations showed strong N-Ow contacts providing a stronger association between the lipid and surrounding water molecules. The hydrogens of these water molecules are not involved and can form hydrogen bonds with other solvent molecules [37]. The hydrogen atoms could interact with the hydration shell of Gd3+ ions. The large hydration enthalpy (−3545 kJ/mol) promotes hydration and stronger hydrogen bonding has been reported within the shell compared to bulk water molecules [38]. But this hydrogen bonding is reduced upon chelation to polar groups. This may facilitate hydrogen bonding to the hydrogens from water molecules, which are bound to the N(CH3)3 group.
PCs are key mammalian building blocks as they can be present in quantities > 50% of the total membrane lipid composition [39]. The observed increase in membrane fluidity may significantly affect biological functions. Their overall shape can be described as cylindrical, promoting the spontaneous formation of planar bilayers, whereas the addition of conical lipids (such as PEs) induces curvature [39]. Sphingomyelins, another major building block of the outer leaflet of mammalian cells, form more rigid membranes and can form hydrogen bonds in the interface [40]. SM is known to co-localize with cholesterol to provide SM–cholesterol-rich domains [41], which have been termed lipid rafts. Rafts have been implicated with many biologically relevant functions, such as providing a platform for signaling molecules leading to their accumulation, altering conformational states of membrane proteins, and mediating host–pathogen interactions [42].
Moreover, SM plays an important role in the regulation of membrane cholesterol distribution [43], as the presence of SM in human skin fibroblasts allows for the uptake of exogenous cholesterol, whereas deliberate depletion of SM results in the sequestration of free membrane cholesterol to intracellular pools [43]. Furthermore, SM monolayers keep cholesterol desorption rates consistently slow compared to chain-matched PC monolayers [44]. Therefore, it is argued that cholesterol has the ability to form hydrogen bonds with SM, resulting in their increased attraction [44]. Their localization in the outer leaflet of the plasma membrane—and the fact that they carry the same headgroup as PCs—prompted the investigation of Gd3+ SM interactions with different side chain architectures.
Brain SM was studied first, which primarily contains long-chain (>18 carbons) saturated side chains, explaining the higher Tm of 39 °C and a GP starting value of 0.36 (Figure 4). The systems also contain 21% of the long-chain monounsaturated 24:1 (Table 1) with the double bond in position 9 [45]. The resulting larger area prevents intermolecular hydrogen bonding and demixing in ternary PC/SM/Chol mixtures [45]. Gd3+ shows a similar and limited impact across the entire temperature range. The ability of metals to induce rigidity is limited in already rigid membranes.
ESM is primarily composed of 16:0 side chains and very limited unsaturation (Table 1), with a broader phase transition range at around 38.5 °C and a starting GP of 0.3, slightly lower than brain SM but still indicative of a rigid membrane. Gd3+ induced rigidity across the entire temperature range, with increasing effects above the Tm and with the metal concentration (Figure 5). Mixtures of ESM and POPC exhibited SM-enriched domains in a composition-dependent manner [46]. Moreover, ternary mixtures of palmitoyl (16:0) SM, DOPC (dioleoyl phosphatidylcholine), and cholesterol displayed larger domains in liposomes compared to mixtures of BSM, DOPC, and cholesterol [47]. Enhanced demixing and tighter packed domains may facilitate metal complexation [46]. This agrees with the PC results above but also with previous reports showing much stronger effects of Mn2+, Cd2+, Ni2+, and Co2+ on saturated over monounsaturated negatively charged lipids [23,25,28].
Liposomes composed of brain polar lipid extracts to provide more complex membranes were investigated. They include the zwitterionic phosphatidylethanolamine (PE) as the main lipid, whereby in the human brain, ~50% are found as plasmalogens (enol ether) [36]. Moreover, negatively charged phosphatidylserine (18.5%) and phosphatidylinositol (4.1%) are both comparable to values reported for the human brain (16.6% and 2.6%) [36]. The large unknown fraction may include rigid lipids, such as cerebrosides. PE membranes can form hydrogen bonds between the headgroups, increasing the Tm of these lipids significantly (from DMPC 24.1 °C to DMPE (dimyristoyl phosphatidylethanolamine) 48.8 °C [48]). These components contribute to the high GP starting value of 0.5, reflecting a very rigid membrane. The zwitterionic and tightly packed PEs were not targeted by Cd [25] but the data presented for PC suggest possible interactions with Gd3+, at least at higher temperatures when the hydrogen bonding is reduced. The negatively charged PS provides a strong target due to electrostatic attractions with Gd3+. We reported a 3.5× and 3× higher increase in GP for POPS over BSM and brain polar extract [6] at 16.7 µM metal concentration. Anionic lipids were consistently stronger targets for divalent cations over zwitterionic lipids [25,27,49]. Electrostatic measurements indicate dipole interactions of Gd3+ with PS lipids, with binding affinity constants of Gd3+ to PS and PC of 5 × 10⁴ and 5 × 10³, emphasizing this difference [50]. Thus, Gd3+ ions are electrostatically attracted to negative charges on lipid headgroups, and subsequently bound via complexation [51].
Gd3+ induces rigidity in brain polar extract across the entire temperature range but progressively more at higher temperatures. This is consistent with more fluid membranes that are more amenable to metal effects. The total GP increases at 50 °C (0.109) are the highest observed here, likely due to the negatively charged PS as the main species but the less prevalent PIs have been shown to be attractive targets for toxic metals like Cd2+ and Pb2+ [52] as well.
The last system was a biomimetic brain model that contained several key lipid classes not included in previous matrices. This included PE plasmalogens, which contain a vinyl ether linkage in the sn1 position and an ester bond in the sn2 position, representing the common linkage of lipid acyl chains. Plasmalogens comprise the largest fraction of PE lipids in the human brain [36]. Vinyl ether results in a more perpendicular orientation and tighter packing of the side chains, resulting in lower transition temperatures to nonlamellar hexagonal phases [53]. The melting from gel to liquid crystalline phases is lower than for diacyl derivatives [54]. Moreover, the model contains 40% cholesterol, which is an important modulator of membrane behavior, known for inducing rigidity in liquid crystalline membranes and broadening phase transitions [55,56].
The sterol is enriched in the brain and, indeed, a quarter of the total cholesterol content is found in brain membranes [57]. Lastly, cerebrosides make up ~15.8% of human brain lipids [36]. The N-palmitoyl Gly-cerebroside has a Tm of 87 °C [33]. The BSM, GlyCer, and Chol content explain the highest starting GP value of 0.56. Indeed, the shape of the curve indicates that a melting transition is likely to occur above the selected temperature range. POPC, BSM, and especially POPS are the likely targets for Gd. Their overall lower concentration explains the moderate effects that are only more pronounced above 40 °C.
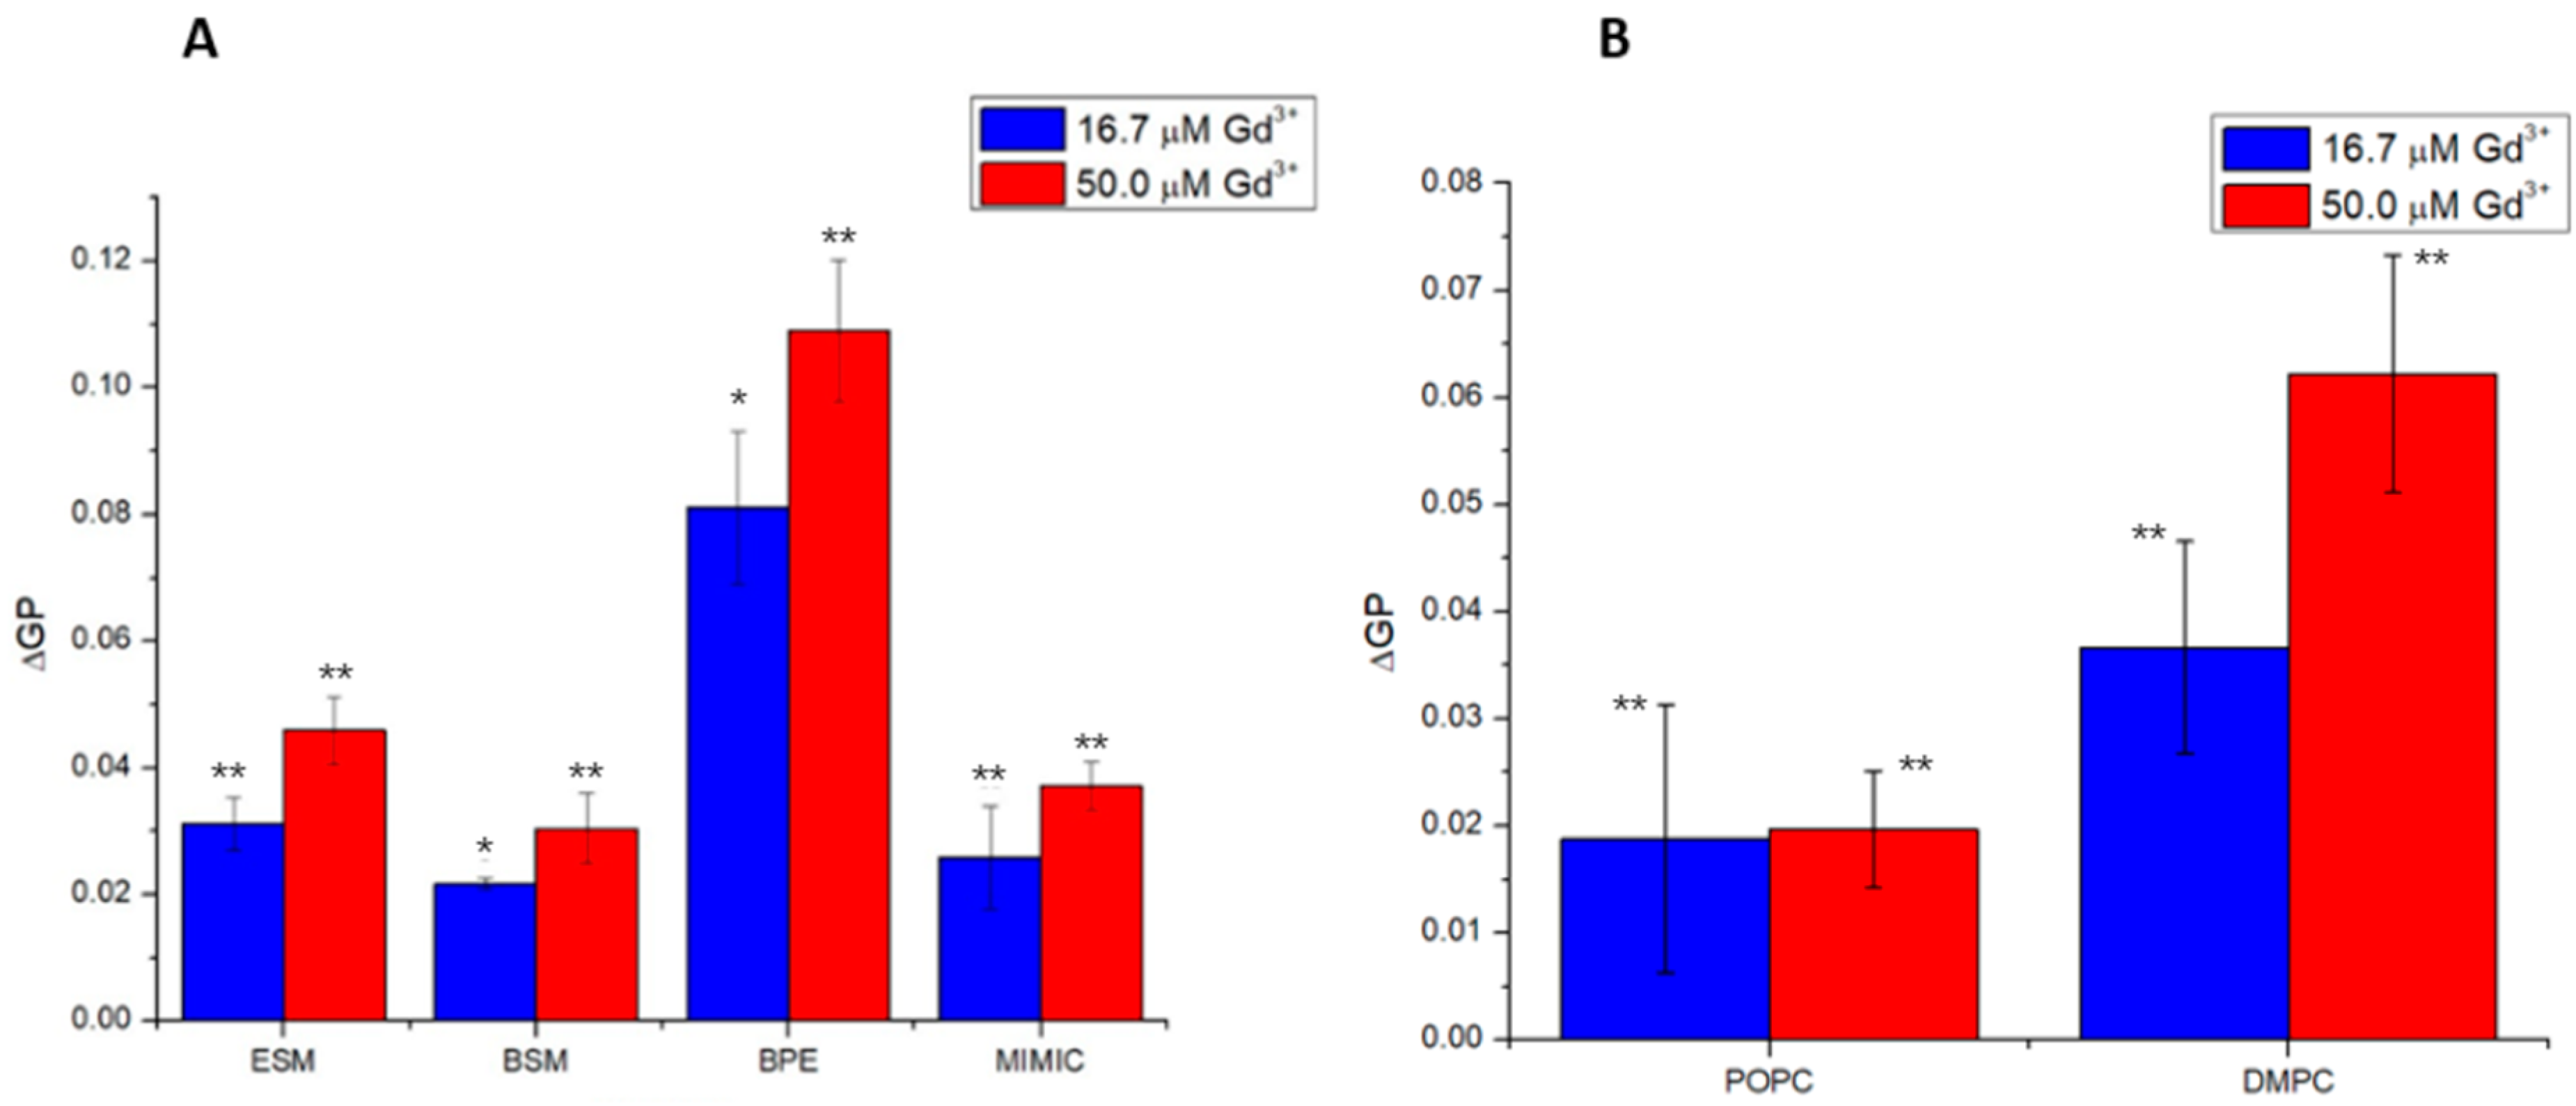
As summarized below in Figure 8 for changes in GP at 35 °C for PC systems and 50 °C for the other matrices, Gd3+ induces rigidity in membranes composed of key lipid classes; the zwitterionic PC and SMs, as well as negatively charged PS and PI in brain polar extract and POPS in the biomimetic model. The absolute differences reflect the percentages of these lipids in the respective membranes.
Lastly, the ability of Gd3+ to increase the size of liposomes was determined by DLS and trends reflect the GP results with larger increases for DMPC over POPC and BPE over BSM and the biomimetic brain model. The ESM result cannot be explained, and more work will be needed to understand the significant aggregation in the more saturated system. We have seen size increases and aggregation for saturated phosphatidic acid and phosphatidylserine over their monounsaturated analogs [25]. The size increases for SM-containing systems, especially BPE, indicate the potential for membrane fusion.
We previously estimated size changes that would be expected upon liposome fusion [52]. This is based on a published percentage of lipids in the outer leaflet [58], the molecular area of the lipids, and the size based on DLS. This allows for the estimation of the number of lipids in the outer leaflet of each system. Doubling the number (through the fusion of two liposomes) and accounting for the molecular areas provides an estimate of the surface area of the larger liposome. The size changes estimated for the fusion of POPC liposomes were between 30 and 50 nm [52].
BSM and BPE fall within this range for both metal concentrations, whereas the mimic membrane would need 50 µM Gd to induce a size change in the fusion range. Vesicle-based transport is a critical aspect of brain function, and membrane fluidity is essential to allow the lateral movement of proteins involved in membrane remodeling; this includes changes in more or less ordered phases or microdomain formation (for a review see [59]). Modulation of cholesterol content has proven to disrupt the lateral domain organization of other lipids, which induces unfavorable alterations to the spatial–temporal organization of fusion architecture, as shown in sea urchin eggs [60]. While temperature is described as a key factor, metal-induced rigidity or changes in lateral membrane organization [52] would be able to significantly affect the intricate interplay of lipids and proteins during this process.

4. Materials and Methods

4.1. Reagents

The following lipids were purchased as lyophilized powders from Avanti Polar Lipids (Alabaster, AL, USA): 1-palmitoyl-2-oleoyl-sn-glycero-3-phosphocholine (POPC), 1,2-dimyristoyl-sn-glycero-3-phosphocholine (DMPC), 1-(1Z-octadecenyl)-2-oleoyl-sn-glycero-3-phosphoethanolamine (C18(Plasm)-18:1 PE), 1-palmitoyl-2-oleoyl-sn-glycero-3-phospho-L-serine (POPS), glucosylceramide, cholesterol, brain sphingomyelin, egg sphingomyelin, and brain polar extract (see Table 1 for compositions). Powders were utilized without any further purification. The fluorescent dye 6-Dodecanoyl-2-Dimethylaminonaphthalene (Laurdan) was purchased from molecular probes (Eugene, OR, USA), and a stock solution was prepared by dissolving in ACS grade chloroform (Sigma Aldrich, Oakville, ON, USA). The reagents (MgNO3∙6H2O, ascorbic acid, (NH4)6Mo7O24∙4H2O) were used for phosphate analysis and they were purchased from Sigma-Aldrich (Oakville, ON, USA). Sodium chloride (NaCl) was purchased from Fisher Scientific (Ottawa, ON, USA). Gadolinium nitrate (Gd(NO3)3) was purchased from Alfa Aesar (Sigma-Aldrich, Oakville, ON, USA). Metal stock solutions were prepared by dissolving in 100 mM NaCl (pH 7.4).

4.2. Liposome Preparation

Lipid films were generated by weighing lipid powder using a Sartorius Microbalance MC5 (Göttingen, Germany) into a clean borosilicate vial (VWR, Mississauga, ON, Canada) to obtain a concentration of 1 mg/mL. Lipid powders and the dye were dissolved in a 7:3 chloroform:methanol solution. The more polar alcohol facilitates the dissolution of more polar lipids. The molar ratio of lipid to dye was 500:1 [61].
The myelin sheath mimic was prepared by solubilizing each lipid individually in the organic solvent mixture. Appropriate aliquots of each lipid were combined in a clean vial to obtain the respective molar ratios seen in Table 1.
The solvent was evaporated under a gentle stream of argon and the samples were dried in a vacuum overnight. Films were rehydrated with 100 mM NaCl (pH 7.4) followed by rigorous sonication and freeze–thawing to generate multilamellar vesicles (MLVs). Large unilamellar vesicles (LUVs) were generated by passing the MLVs 20 times by extrusion through a Nucleopore polycarbonate filter (100 nm pore diameter) using a mini extruder (Avanti Polar Lipids, Alabaster, AL, USA). For each preparation, the extrusion temperature was set above the phase transition temperature (Tm) of the specific system. Subsequently, lipid concentration was determined using a phosphate assay described by Ames [62].

4.3. Laurdan Generalized Polarization (Laurdan GP)

Laurdan is an amphipathic molecule composed of a fluorescent naphthalene moiety and a 12-carbon lauryl tail. This hydrophobic tail readily incorporates into the hydrophobic core of lipid bilayers, whereas the polar naphthalene moiety localizes toward the interface region of the bilayer at the glycerol backbone of the lipids. This fluorophore is sensitive to the polarity of its environment, which can be used to detect changes in the membrane phase properties [61]. Fluorescence excitation of the naphthalene moiety at 340 nm creates an intramolecular dipole resulting in a reorientation of surrounding water dipoles, which reduces the energy of the excited state. Lower energy translates into a red shift of the emission peak [63]. Rigid gel phases exhibit emission peaks at 440 nm, while fluid liquid crystalline phases increase the exposure of Laurdan to water molecules leading to the shift of the emission peak to 490 nm. These shifts in emission maxima can be quantified through generalized polarization (GP) with the formula seen below in Equation (1) [20]:
G P = I 440 I 490 I 440 + I 490
Higher GP values indicate greater rigidity, while lower GP values indicate more fluid membranes.
Laurdan fluorescence measurements were performed using a Cary Eclipse fluorimeter (Agilent Technologies, Santa Clara, CA, USA) The measurements were taken at an excitation wavelength of 340 nm, with emissions at both 440 and 490 nm, averaged over 3 independent measurements, and both excitation and emission had a bandpass of 5 nm. Samples of 0.1 mM LUVs in small-volume quartz cuvettes (Starna Scientific, Ltd., Atascadero, CA, USA) were tested in the absence and presence of Gd(NO3)3. The concentrations of 16.7 and 50 µM Gd(NO3)3 are based on previous work [6], in which Gd above 16 µM precipitated liposomes composed of anionic lipids [6]. The zwitterionic membranes in this work allowed for increasing the metal concentration to 50 µM. Metals were added to the LUVs and measurements were taken after a 5-min incubation at room temperature. The cuvette volume for each addition was kept constant to avoid dilution effects. The ions added to the solution are limited in terms of membrane permeability and will only affect lipids in the outer leaflet [58,64]. Lipid systems were scanned across a temperature range that included the lipid phase transition temperature (where applicable). Temperature was controlled to ±0.1 °C using a circulating water bath (Agilent Technologies, Santa Clara, CA, USA).

4.4. Dynamic Light Scattering

The liposome size and size distribution were determined via dynamic light scattering (DLS) using a Zetasizer Nano ZS (Malvern Instruments, Worcestershire, UK). Liposomes composed of POPC, DMPC, and brain polar extract were tested at 37 °C, which is the physiological temperature, and a point where these systems are in their fluid liquid crystalline phase. Both brain and egg sphingomyelin have higher melting temperatures. Thus, these systems and the myelin sheath biomimetic model were analyzed at 45 °C to ensure that these membranes were in the liquid crystalline phase as well.

5. Conclusions

Gd deposition in the brain has been reported [65]. Even at low µM concentrations, Gd3+ significantly increases membrane rigidity in zwitterionic PC and all SM-containing systems investigated. This observation contrasts with the behavior of other toxic metals, such as Pb2+ or Cd2+, which show very weak or no interactions with these membranes at higher metal concentrations [6]. Changes were stronger for saturated (more rigid) over partly unsaturated (more fluid) membranes; 16.7 µM Gd3+ showed larger effects than 30 or 50 µM Pb2+ and Cd2+ on POPS, which was also identified as a likely target in this work. Membrane rigidification changes membrane dynamics in terms of membrane fluidity but could also affect lateral SM-enriched domains that have been implicated in many biological functions.
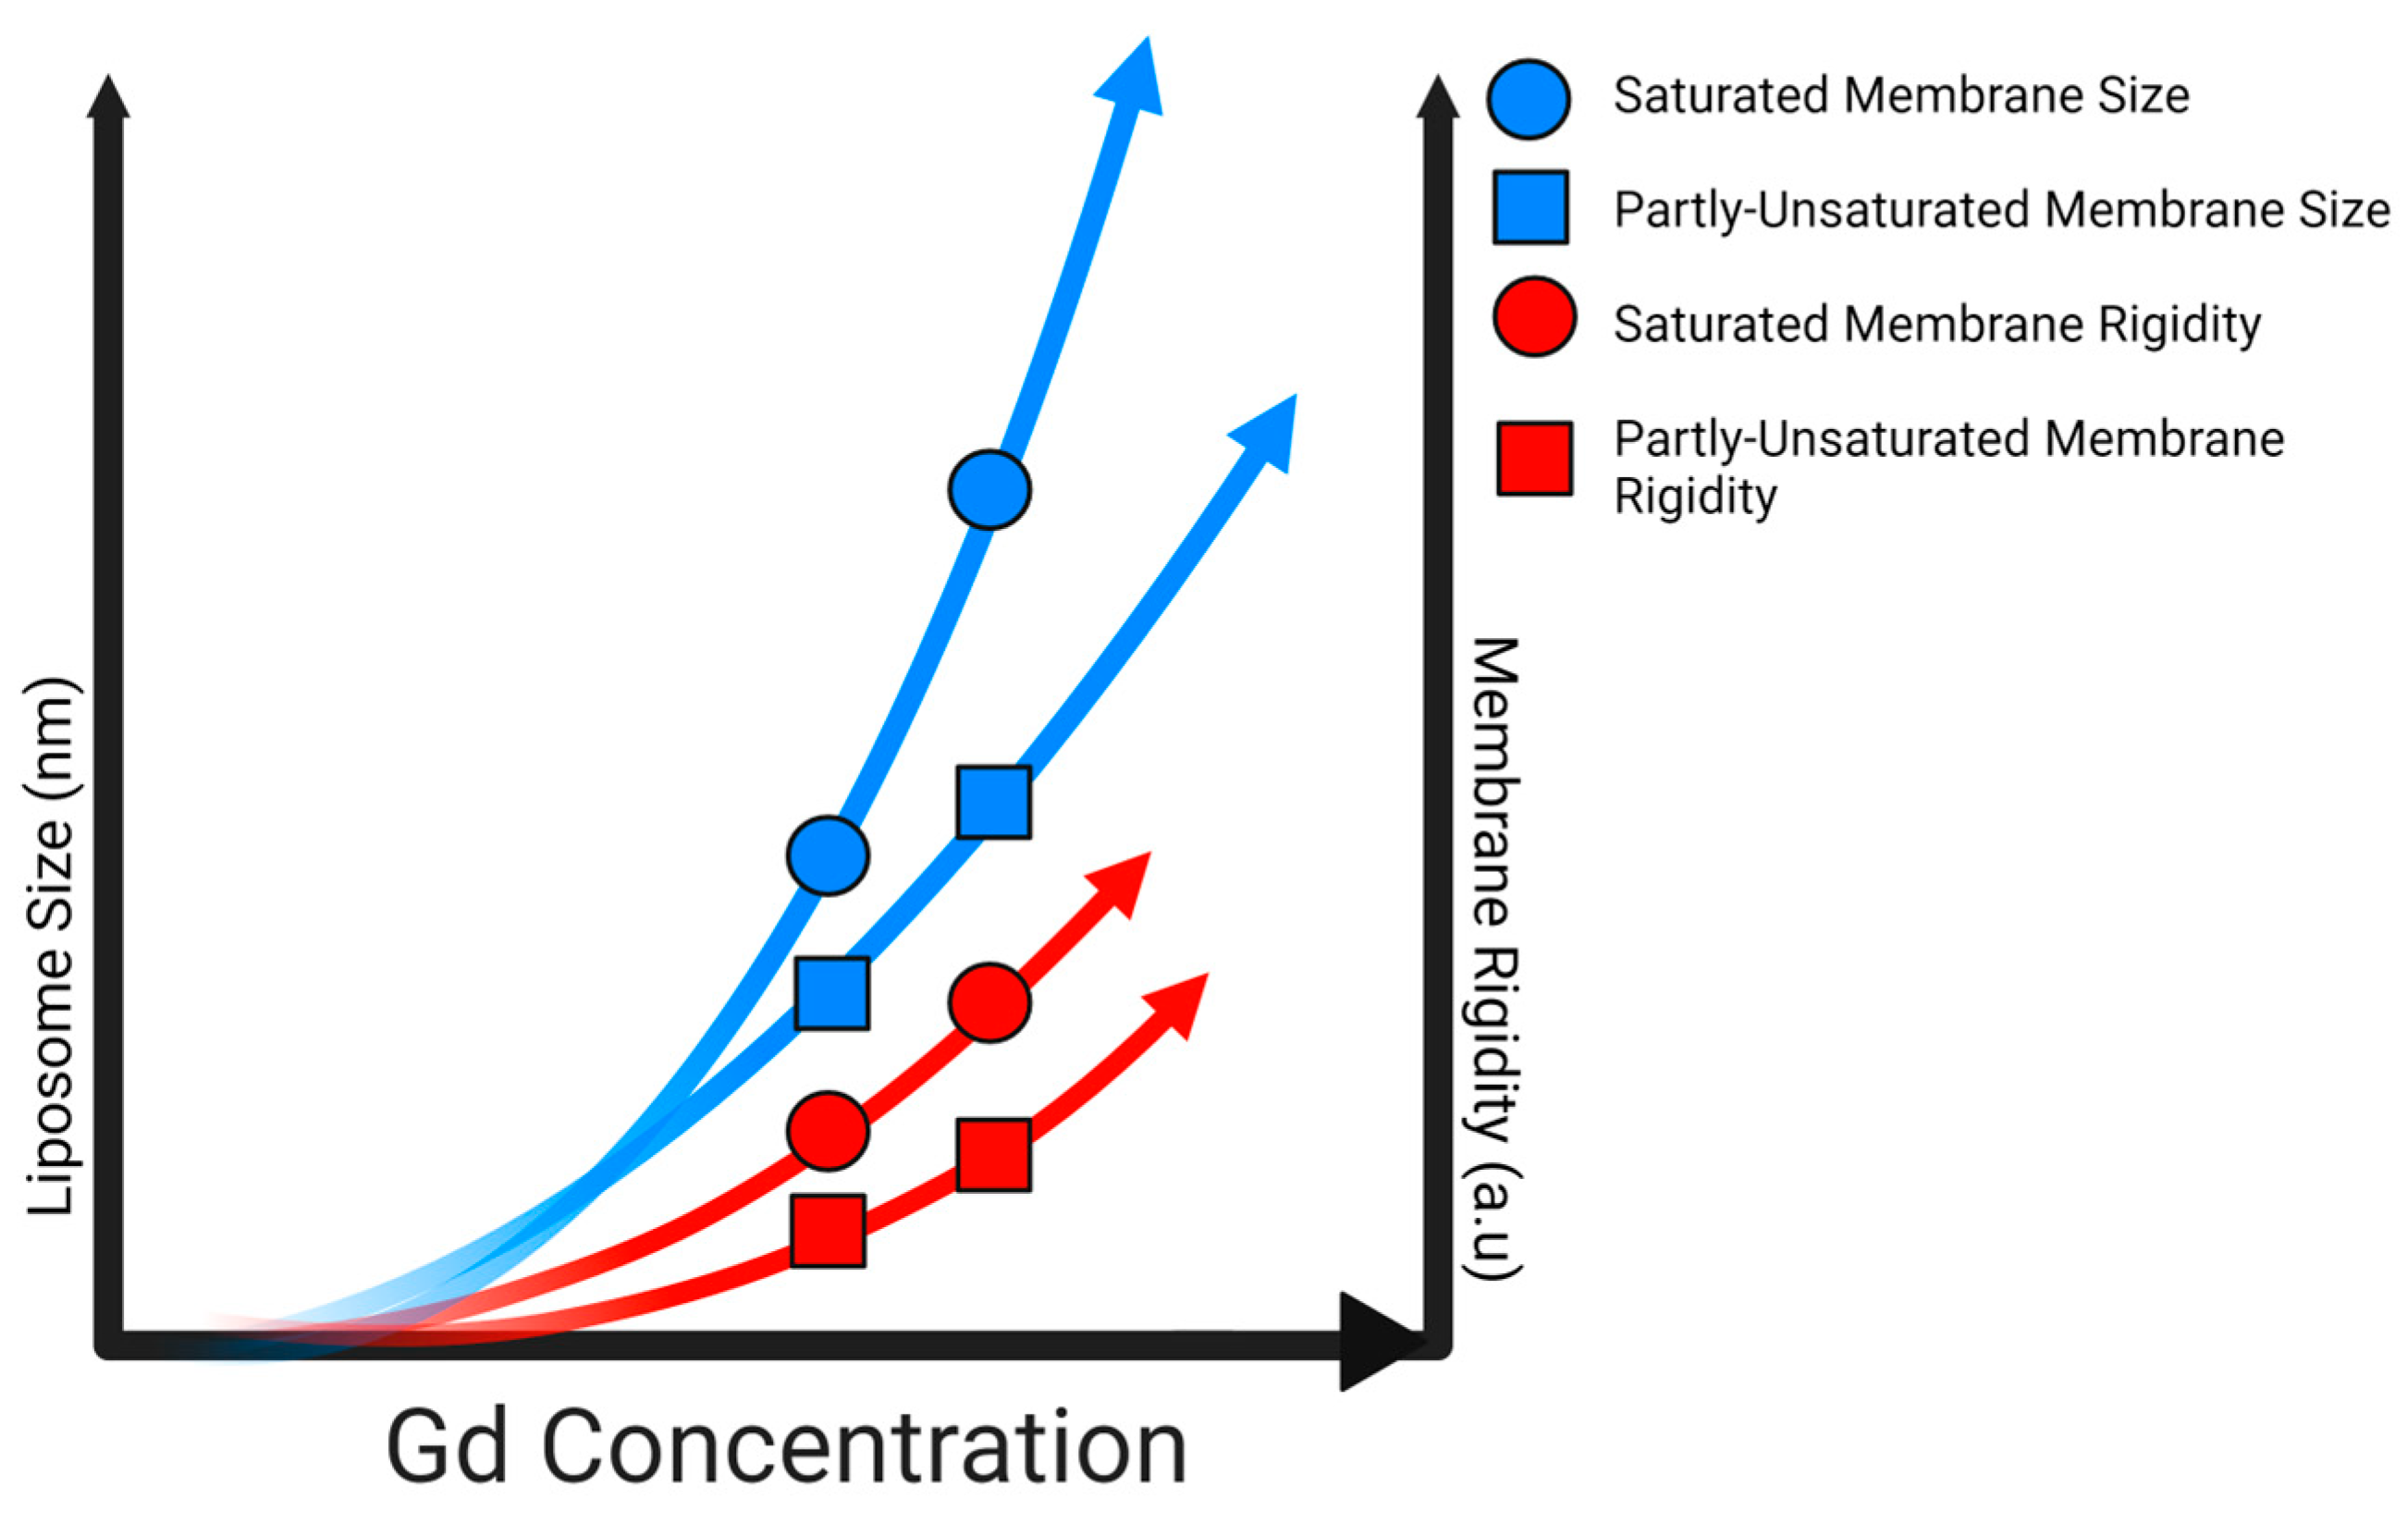
Specifically, low micromolar concentrations of Gd are able to induce rigidity in PC lipid systems, exaggerated in fully saturated systems. While anionic lipids may be a preferential target for Gd binding, zwitterionic systems comprised of one or more lipids still experience alteration in the presence of Gd ions. Clearly, both the lipid headgroup identity and acyl chain architecture mediate the extent of Gd-induced rigidity in membranes. Moreover, these relatively low metal concentrations used here still induce liposome fusion, whereas ~2 mM Pb2+ and Cd2+ would be needed for comparable size changes in BPE [6]. Figure 9, below, highlights the overall influence of Gd on saturated and unsaturated membrane size and rigidity.
The data clearly demonstrate the strong potential of Gd3+ to affect key brain lipid classes and induce significant detrimental effects on membrane fluidity and liposome size, which could affect important processes like fusion and endocytosis of synaptic vesicles [59]. Lipids directly control relevant proteins [66], and negatively charged lipids, like phosphoinositides, play a key role in recruiting proteins [67]. The latter lipids have been identified as potential targets in this work and these data suggest that there should be more emphasis on the potential serious and detrimental implications of Gd use in MRI imaging.

Author Contributions

Conceptualization and methodology, E.J.P.; formal analysis, investigation, and data curation, T.I., K.F. and C.U.; original draft preparation, E.J.P., T.I., K.F. and C.U.; review and editing, E.J.P., T.I., K.F. and C.U.; visualization, T.I., K.F. and C.U.; supervision and project administration, E.J.P.; funding acquisition, E.J.P.; Resources, E.J.P. All authors have read and agreed to the published version of the manuscript.

Funding

This research was funded by the Natural Sciences and Engineering Research Council of Canada through a Discovery Grant to E.J.P. (RGPIN/03911-2018).

Institutional Review Board Statement

Not applicable.

Informed Consent Statement

Not applicable.

Data Availability Statement

Data available upon request.

Conflicts of Interest

Author Colin Unruh was employed by the company Fuel Innovation. The remaining authors declare that the research was conducted in the absence of any commercial or financial relationships that could be construed as a potential conflict of interest.

Abbreviations

GBCA (Gadolinium-Based Contrast Agent), MRI (Magnetic Resonance Imaging), ROS (Reactive Oxygen Species), ATP (Adenosine Triphosphate), ADP (Adenosine Diphosphate), Gd-DTPA (Gadolinium-Diethylenetriaminepentaacetic Acid), DPPC (dipalmitoyl phosphatidylcholine), GP (Generalized Polarization), PC (phosphocholine), SM (sphingomyelin), PS (phosphoserine), POPC (palmitoyl-oleoyl phosphatidylcholine), DMPC (dimyristoyl phosphatidylcholine), POPS (palmitoyl-oleoyl phosphatidylserine), PE (phosphoethanolamine), PE-Plas (Plasmalogen phosphoethanolamine), GlyCer (Glucosyl Ceramide), BSM (Brain Sphingomyelin), ESM (Egg Sphingomyelin), BPE (Brain Polar Extract), MM (Myelin Mimic), DLS (Dynamic Light Scattering), DSC (Differential Scanning Calorimetry), DOPC (dioleoyl phosphatidylcholine), DMPE (dimyristoyl phosphatidylethanolamine), MLV (multi-lamellar vesicle), LUV (large unilamellar vesicle).

References

  1. Rogowska, J.; Olkowska, E.; Ratajczyk, W.; Wolska, L. Gadolinium as a New Emerging Contaminant of Aquatic Environments. Environ. Toxicol. Chem. 2018, 37, 1523–1534. [Google Scholar] [CrossRef] [PubMed]
  2. U.S. Geological Survey. Mineral Commodity Summaries 2019; U.S. Geological Survey: Reston, VA, USA, 2019. [CrossRef]
  3. Yang, M.; Liu, X.; Zhang, Z.; Song, Y.; Bai, L. Effect of Adding Rare Earth Elements Er and Gd on the Corrosion Residual Strength of Magnesium Alloy. Open Phys. 2019, 17, 373–380. [Google Scholar] [CrossRef]
  4. Binnemans, K.; Jones, P.T.; Müller, T.; Yurramendi, L. Rare Earths and the Balance Problem: How to Deal with Changing Markets? J. Sustain. Metall. 2018, 4, 126–146. [Google Scholar] [CrossRef]
  5. Brünjes, R.; Hofmann, T. Anthropogenic Gadolinium in Freshwater and Drinking Water Systems. Water Res. 2020, 182, 115966. [Google Scholar] [CrossRef] [PubMed]
  6. Unruh, C.; Van Bavel, N.; Anikovskiy, M.; Prenner, E.J. Benefits and Detriments of Gadolinium from Medical Advances to Health and Ecological Risks. Molecules 2020, 25, 5762. [Google Scholar] [CrossRef] [PubMed]
  7. Laing, M. Gadolinium: Central Metal of the Lanthanoids. J. Chem. Educ. 2009, 86, 188–189. [Google Scholar] [CrossRef]
  8. Visual MINTEQ—Visual MINTEQ—A Free Equilibrium Speciation Model. Available online: https://vminteq.lwr.kth.se/ (accessed on 7 August 2023).
  9. Darnall, D.W.; Birnbaum, E.R. Lanthanide Ions Activate α-Amylase. Biochemistry 1973, 12, 3489–3491. [Google Scholar] [CrossRef]
  10. Sherry, A.D.; Caravan, P.; Lenkinski, R.E. Primer on Gadolinium Chemistry. J. Magn. Reson. Imaging 2009, 30, 1240–1248. [Google Scholar] [CrossRef]
  11. Ebrahimi, P.; Barbieri, M. Gadolinium as an Emerging Microcontaminant in Water Resources: Threats and Opportunities. Geosciences 2019, 9, 93. [Google Scholar] [CrossRef]
  12. Rogosnitzky, M.; Branch, S. Gadolinium-Based Contrast Agent Toxicity: A Review of Known and Proposed Mechanisms. BioMetals 2016, 29, 365–376. [Google Scholar] [CrossRef]
  13. Kanda, T.; Fukusato, T.; Matsuda, M.; Toyoda, K.; Oba, H.; Kotoku, J.; Haruyama, T.; Kitajima, K.; Furui, S. Gadolinium-Based Contrast Agent Accumulates in the Brain Even in Subjects without Severe Renal Dysfunction: Evaluation of Autopsy Brain Specimens with Inductively Coupled Plasma Mass Spectroscopy. Radiology 2015, 276, 228–232. [Google Scholar] [CrossRef] [PubMed]
  14. Idée, J.M.; Fretellier, N.; Robic, C.; Corot, C. The Role of Gadolinium Chelates in the Mechanism of Nephrogenic Systemic Fibrosis: A Critical Update. Crit. Rev. Toxicol. 2014, 44, 895–913. [Google Scholar] [CrossRef] [PubMed]
  15. Newton, B.B.; Jimenez, S.A. Mechanism of NSF: New Evidence Challenging the Prevailing Theory. J. Magn. Reson. Imaging 2009, 30, 1277–1283. [Google Scholar] [CrossRef] [PubMed]
  16. Xia, Q.; Feng, X.; Huang, H.; Du, L.; Yang, X.; Wang, K. Gadolinium-Induced Oxidative Stress Triggers Endoplasmic Reticulum Stress in Rat Cortical Neurons. J. Neurochem. 2011, 117, 38–47. [Google Scholar] [CrossRef] [PubMed]
  17. Angeli, J.K.; Ramos, D.B.; Casali, E.A.; Souza, D.O.G.; Sarkis, J.J.F.; Stefanon, I.; Vassallo, D.V.; Fürstenau, C.R. Gadolinium Increases the Vascular Reactivity of Rat Aortic Rings. Braz. J. Med. Biol. Res. 2011, 44, 445–452. [Google Scholar] [CrossRef] [PubMed]
  18. Bau, M.; Dulski, P. Anthropogenic Origin of Positive Gadolinium Anomalies in River Waters. Earth Planet Sci. Lett. 1996, 143, 245–255. [Google Scholar] [CrossRef]
  19. Idée, J.M.; Port, M.; Raynal, I.; Schaefer, M.; Le Greneur, S.; Corot, C. Clinical and Biological Consequences of Transmetallation Induced by Contrast Agents for Magnetic Resonance Imaging: A Review. Fundam. Clin. Pharmacol. 2006, 20, 563–576. [Google Scholar] [CrossRef]
  20. Li, X.M.; Zhang, Y.F.; Ni, J.Z.; Chen, J.W.; Hwang, F. Effect of Lanthanide Ions on the Phase Behavior of Dipalmitoylphosphatidylcholine Multilamellar Liposomes. J. Inorg. Biochem. 1994, 53, 139–149. [Google Scholar] [CrossRef]
  21. Los, D.A.; Murata, N. Membrane Fluidity and Its Roles in the Perception of Environmental Signals. Biochim. Biophys. Acta (BBA)—Biomembr. 2004, 1666, 142–157. [Google Scholar] [CrossRef]
  22. Yu, W.; So, P.T.C.; French, T.; Gratton, E. Fluorescence Generalized Polarization of Cell Membranes: A Two-Photon Scanning Microscopy Approach. Biophys. J. 1996, 70, 626. [Google Scholar] [CrossRef]
  23. Sule, K.; Anikovskiy, M.; Prenner, E.J. Lipid Structure Determines the Differential Impact of Single Metal Additions and Binary Mixtures of Manganese, Calcium and Magnesium on Membrane Fluidity and Liposome Size. Int. J. Mol. Sci. 2023, 24, 1066. [Google Scholar] [CrossRef] [PubMed]
  24. O’Brien, J.S.; Sampson, E.L. Lipid Composition of the Normal Human Brain: Gray Matter, White Matter, and Myelin. J. Lipid Res. 1965, 6, 537–544. [Google Scholar] [CrossRef] [PubMed]
  25. Kerek, E.M.; Prenner, E.J. Inorganic Cadmium Affects the Fluidity and Size of Phospholipid Based Liposomes. Biochim. Biophys. Acta (BBA)—Biomembr. 2016, 1858, 3169–3181. [Google Scholar] [CrossRef] [PubMed]
  26. Leekumjorn, S.; Sum, A.K. Molecular Characterization of Gel and Liquid-Crystalline Structures of Fully Hydrated POPC and POPE Bilayers. J. Phys. Chem. B 2007, 111, 6026–6033. [Google Scholar] [CrossRef] [PubMed]
  27. Sule, K.; Prenner, E.J. Lipid Headgroup and Side Chain Architecture Determine Manganese-Induced Dose Dependent Membrane Rigidification and Liposome Size Increase. Eur. Biophys. J. 2022, 51, 205–223. [Google Scholar] [CrossRef] [PubMed]
  28. Umbsaar, J.; Kerek, E.; Prenner, E.J. Cobalt and Nickel Affect the Fluidity of Negatively-Charged Biomimetic Membranes. Chem. Phys. Lipids 2018, 210, 28–37. [Google Scholar] [CrossRef]
  29. Lewis, R.N.A.H.; Zhang, Y.P.; McElhaney, R.N. Calorimetric and Spectroscopic Studies of the Phase Behavior and Organization of Lipid Bilayer Model Membranes Composed of Binary Mixtures of Dimyristoylphosphatidylcholine and Dimyristoylphosphatidylglycerol. Biochim. Biophys. Acta (BBA)—Biomembr. 2005, 1668, 203–214. [Google Scholar] [CrossRef] [PubMed]
  30. Pokorny, A.; Yandek, L.E.; Elegbede, A.I.; Hinderliter, A.; Almeida, P.F.F. Temperature and Composition Dependence of the Interaction of Delta-Lysin with Ternary Mixtures of Sphingomyelin/Cholesterol/POPC. Biophys. J. 2006, 91, 2184–2197. [Google Scholar] [CrossRef]
  31. O’Brien, J.S. Stability of the myelin membrane. Science 1965, 147, 1099–1107. [Google Scholar] [CrossRef]
  32. Arsov, Z.; González-Ramírez, E.J.; Goñi, F.M.; Tristram-Nagle, S.; Nagle, J.F. Phase Behavior of Palmitoyl and Egg Sphingomyelin. Chem. Phys. Lipids 2018, 213, 102–110. [Google Scholar] [CrossRef]
  33. González-Ramírez, E.J.; Goñi, F.M.; Alonso, A. Mixing Brain Cerebrosides with Brain Ceramides, Cholesterol and Phospholipids. Sci. Rep. 2019, 9, 13326. [Google Scholar] [CrossRef] [PubMed]
  34. Al Osman, M.; Yang, F.; Massey, I.Y. Exposure Routes and Health Effects of Heavy Metals on Children. BioMetals 2019, 32, 563–573. [Google Scholar] [CrossRef] [PubMed]
  35. Yoon, J.H.; Seo, Y.; Jo, Y.S.; Lee, S.; Cho, E.; Cazenave-Gassiot, A.; Shin, Y.S.; Moon, M.H.; An, H.J.; Wenk, M.R.; et al. Brain Lipidomics: From Functional Landscape to Clinical Significance. Sci. Adv. 2022, 8, eadc9317. [Google Scholar] [CrossRef] [PubMed]
  36. Naudí, A.; Cabré, R.; Jové, M.; Ayala, V.; Gonzalo, H.; Portero-Otín, M.; Ferrer, I.; Pamplona, R. Lipidomics of Human Brain Aging and Alzheimer’s Disease Pathology. Int. Rev. Neurobiol. 2015, 122, 133–189. [Google Scholar] [CrossRef]
  37. Foglia, F.; Lawrence, M.J.; Lorenz, C.D.; McLain, S.E. On the Hydration of the Phosphocholine Headgroup in Aqueous Solution. J. Chem. Phys. 2010, 133, 145103. [Google Scholar] [CrossRef]
  38. Guo, F.; Friedman, J.M. Charge Density-Dependent Modifications of Hydration Shell Waters by Hofmeister Ions. J. Am. Chem. Soc. 2009, 131, 11010–11018. [Google Scholar] [CrossRef]
  39. Van Meer, G.; Voelker, D.R.; Feigenson, G.W. Membrane Lipids: Where They Are and How They Behave. Nat. Rev. Mol. Cell Biol. 2008, 9, 112–124. [Google Scholar] [CrossRef]
  40. Lange, Y.; Swaisgood, M.H.; Ramos, B.V.; Steck, T.L. Plasma Membranes Contain Half the Phospholipid and 90% of the Cholesterol and Sphingomyelin in Cultured Human Fibroblasts. J. Biol. Chem. 1989, 264, 3786–3793. [Google Scholar] [CrossRef]
  41. Slotte, J.P.; Ramstedt, B. The Functional Role of Sphingomyelin in Cell Membranes. Eur. J. Lipid Sci. Technol. 2007, 109, 977–981. [Google Scholar] [CrossRef]
  42. Sezgin, E.; Levental, I.; Mayor, S.; Eggeling, C. The Mystery of Membrane Organization: Composition, Regulation and Roles of Lipid Rafts. Nat. Rev. Mol. Cell Biol. 2017, 18, 361–374. [Google Scholar] [CrossRef]
  43. Slotte, J.P.; Bierman, E.L. Depletion of Plasma-Membrane Sphingomyelin Rapidly Alters the Distribution of Cholesterol between Plasma Membranes and Intracellular Cholesterol Pools in Cultured Fibroblasts. Biochem. J. 1988, 250, 653–658. [Google Scholar] [CrossRef] [PubMed]
  44. Ramstedt, B.; Slotte, J.P. Interaction of Cholesterol with Sphingomyelins and Acyl-Chain-Matched Phosphatidylcholines: A Comparative Study of the Effect of the Chain Length. Biophys. J. 1999, 76, 908. [Google Scholar] [CrossRef] [PubMed]
  45. Vázquez, R.F.; Daza Millone, M.A.; Pavinatto, F.J.; Fanani, M.L.; Oliveira, O.N.; Vela, M.E.; Maté, S.M. Impact of Sphingomyelin Acyl Chain (16:0 vs 24:1) on the Interfacial Properties of Langmuir Monolayers: A PM-IRRAS Study. Colloids Surf. B Biointerfaces 2019, 173, 549–556. [Google Scholar] [CrossRef] [PubMed]
  46. Prenner, E.; Honsek, G.; Hönig, D.; Möbius, D.; Lohner, K. Imaging of the Domain Organization in Sphingomyelin and Phosphatidylcholine Monolayers. Chem. Phys. Lipids 2007, 145, 106–118. [Google Scholar] [CrossRef] [PubMed]
  47. Petruzielo, R.S.; Heberle, F.A.; Drazba, P.; Katsaras, J.; Feigenson, G.W. Phase Behavior and Domain Size in Sphingomyelin-Containing Lipid Bilayers. Biochim. Biophys. Acta (BBA)—Biomembr. 2013, 1828, 1302–1313. [Google Scholar] [CrossRef] [PubMed]
  48. Mulukutla, S.; Shipley, G.G. Structure and thermotropic properties of phosphatidylethanolamine and its N-methyl derivatives. Biochemistry 1984, 23, 2514–2519. [Google Scholar] [CrossRef] [PubMed]
  49. Sule, K.; Umbsaar, J.; Prenner, E.J. Mechanisms of Co, Ni, and Mn Toxicity: From Exposure and Homeostasis to Their Interactions with and Impact on Lipids and Biomembranes. Biochim. Biophys. Acta Biomembr. 2020, 1862, 183250. [Google Scholar] [CrossRef] [PubMed]
  50. Ermakov, Y.A.; Averbakh, A.Z.; Yusipovich, A.I.; Sukharev, S. Dipole Potentials Indicate Restructuring of the Membrane Interface Induced by Gadolinium and Beryllium Ions. Biophys. J. 2001, 80, 1851. [Google Scholar] [CrossRef]
  51. Le, C.T.M.; Houri, A.; Balage, N.; Smith, B.J.; Mechler, A. Interaction of Small Ionic Species with Phospholipid Membranes: The Role of Metal Coordination. Front. Mater. 2019, 5, 401354. [Google Scholar] [CrossRef]
  52. Daear, W.; Mundle, R.; Sule, K.; Prenner, E.J. The Degree and Position of Phosphorylation Determine the Impact of Toxic and Trace Metals on Phosphoinositide Containing Model Membranes. BBA Adv. 2021, 1, 100021. [Google Scholar] [CrossRef]
  53. Jiménez-Rojo, N.; Riezman, H. On the Road to Unraveling the Molecular Functions of Ether Lipids. FEBS Lett. 2019, 593, 2378–2389. [Google Scholar] [CrossRef] [PubMed]
  54. Lohner, K.; Hermetter, A.; Paltauf, F. Phase Behavior of Ethanolamine Plasmalogen. Chem. Phys. Lipids 1984, 34, 163–170. [Google Scholar] [CrossRef]
  55. Waheed, Q.; Tjörnhammar, R.; Edholm, O. Phase Transitions in Coarse-Grained Lipid Bilayers Containing Cholesterol by Molecular Dynamics Simulations. Biophys. J. 2012, 103, 2125. [Google Scholar] [CrossRef] [PubMed]
  56. Almeida, P.F. A Simple Thermodynamic Model of the Liquid-Ordered State and the Interactions between Phospholipids and Cholesterol. Biophys. J. 2011, 100, 420. [Google Scholar] [CrossRef]
  57. Dietschy, J.M.; Turley, S.D. Cholesterol Metabolism in the Brain. Curr. Opin. Lipidol. 2001, 12, 105–112. [Google Scholar] [CrossRef]
  58. Marquardt, D.; Geier, B.; Pabst, G. Asymmetric Lipid Membranes: Towards More Realistic Model Systems. Membranes 2015, 5, 180–196. [Google Scholar] [CrossRef]
  59. Chanaday, N.L.; Kavalali, E.T. Time Course and Temperature Dependence of Synaptic Vesicle Endocytosis. FEBS Lett. 2018, 592, 3606–3614. [Google Scholar] [CrossRef]
  60. Mahadeo, M.; Furber, K.L.; Lam, S.; Coorssen, J.R.; Prenner, E.J. Secretory Vesicle Cholesterol: Correlating Lipid Domain Organization and Ca2+ Triggered Fusion. Biochim. Biophys. Acta (BBA)—Biomembr. 2015, 1848, 1165–1174. [Google Scholar] [CrossRef]
  61. Parasassi, T.; Krasnowska, E.K.; Bagatolli, L.; Gratton, E. Laurdan and Prodan as Polarity-Sensitive Fluorescent Membrane Probes. J. Fluoresc. 1998, 8, 365–373. [Google Scholar] [CrossRef]
  62. Ames, B.N. [10] Assay of Inorganic Phosphate, Total Phosphate and Phosphatases. Methods Enzym. 1966, 8, 115–118. [Google Scholar] [CrossRef]
  63. Sanchez, S.A.; Tricerri, M.A.; Gunther, G.; Gratton, E. Laurdan Generalized Polarization: From Cuvette to Microscope. Mod. Res. Educ. Top. Microsc. 2007, 2, 1007–1014. [Google Scholar]
  64. Hassanin, M.; Kerek, E.; Chiu, M.; Anikovskiy, M.; Prenner, E.J. Binding Affinity of Inorganic Mercury and Cadmium to Biomimetic Erythrocyte Membranes. J. Phys. Chem. B 2016, 120, 12872–12882. [Google Scholar] [CrossRef]
  65. Kanda, T.; Nakai, Y.; Oba, H.; Toyoda, K.; Kitajima, K.; Furui, S. Gadolinium Deposition in the Brain. Magn. Reson. Imaging 2016, 34, 1346–1350. [Google Scholar] [CrossRef]
  66. Puchkov, D.; Haucke, V. Greasing the Synaptic Vesicle Cycle by Membrane Lipids. Trends Cell Biol. 2013, 23, 493–503. [Google Scholar] [CrossRef]
  67. Postila, P.A.; Róg, T. A Perspective: Active Role of Lipids in Neurotransmitter Dynamics. Mol. Neurobiol. 2019, 57, 910–925. [Google Scholar] [CrossRef]
Figure 1. Lipid structures: (A): di-myristoyl-phosphatidylcholine (DMPC); (B): palmitoyl-oleoyl-phosphatidylcholine (POPC); (C): N-palmitoyl-sphingomyelin (SM); (D): palmitoyl-oleoyl-phosphatidylserine (POPS); (E): ethanolamine plasmalogen (PE-Plas); (F): glucosylceramide (GlyCer); (G): cholesterol.
Molecules 29 00135 g001
Figure 2. Generalized polarization of Laurdan in POPC LUVs (0.1 mM) incubated with 16.7 μM and 50.0 μM Gd3+ as a function of temperature. The results represent an average of three replicates. Error bars represent ± standard deviation. Asterisks represent statistical significance and are color-coded for each data set (blue for 50 µM Gd condition, and red for 16.7 µM Gd). Significance was determined using a Student’s unpaired t-test with unequal variance (* = p < 0.05).
Molecules 29 00135 g002
Figure 3. Generalized polarization of Laurdan in DMPC LUVs (0.1 mM) incubated with 16.7 μM and 50.0 μM Gd3+ as a function of temperature. The results represent an average of three replicates. Error bars represent ± standard deviation. Asterisks represent statistical significance and are color-coded for each data set (blue for 50 µM Gd condition, and red for 16.7 µM Gd). Significance was determined using a Student’s unpaired t-test with unequal variance (* = p < 0.05).
Molecules 29 00135 g003
Figure 4. Generalized polarization of Laurdan in BSM LUVs (0.1 mM) incubated with 16.7 μM and 50.0 μM Gd3+ as a function of temperature. The results represent an average of three replicates. Error bars represent ± standard deviation. Asterisks represent statistical significance and are color-coded for each data set (blue for 50 µM Gd condition, and red for 16.7 µM Gd). Significance was determined using a Student’s unpaired t-test with unequal variance (* = p < 0.05).
Molecules 29 00135 g004
Figure 5. Generalized polarization of Laurdan in ESM LUVs (0.1 mM) incubated with 16.7 μM and 50.0 μM Gd3+ as a function of temperature. The results represent an average of three replicates. Error bars represent ± standard deviation. Asterisks represent statistical significance and are color-coded for each data set (Blue for 50 µM Gd condition, and Red for 16.7 µM Gd). Significance was determined using a Student’s unpaired t-test with unequal variance (* = p < 0.05).
Molecules 29 00135 g005
Figure 6. Generalized polarization of Laurdan in brain polar extract LUVs (0.1 mM) incubated with 16.7 μM and 50.0 μM Gd3+ as a function of temperature. The results represent an average of three replicates. Error bars represent ± standard deviation. Asterisks represent statistical significance and are color-coded for each data set (blue for 50 µM Gd condition, and red for 16.7 µM Gd). Significance was determined using a Student’s unpaired t-test with unequal variance (* = p < 0.05).
Molecules 29 00135 g006
Figure 7. Generalized polarization of Laurdan in myelin mimic LUVs (0.1 mM) incubated with 16.7 μM and 50.0 μM Gd3+ as a function of temperature. The results represent an average of three replicates. Error bars represent ± standard deviation. Asterisks represent statistical significance and are color-coded for each data set (blue for 50 µM Gd condition, and red for 16.7 µM Gd). Significance was determined using a Student’s unpaired t-test with unequal variance (* = p < 0.05).
Molecules 29 00135 g007
Figure 8. Comparison of ΔGP for (A) SM-containing systems at 50 °C, and (B) POPC and DMPC at 35 °C, respectively. Statistical significance was determined using a Student’s unpaired t-test with unequal variance. Asterisks represent statistically significant changes (* = p < 0.05, ** = p < 0.01).
Molecules 29 00135 g008
Figure 9. Schematic showcasing relative changes to membrane rigidity and liposome size with increasing Gd concentration. Made with BioRender.com.
Molecules 29 00135 g009
Table 2. Change in hydrodynamic diameter of liposomes following incubation with 16.67 µM and 50 µM Gd3+. DLS was completed at 37 °C for all systems, except ESM, BSM, and the MM, which were completed at 45 °C to avoid phase transitions and to measure in comparable liquid crystalline phases.
SystemΔ Size (nm) (16.7 µM Gd)Δ Size (nm) (50.0 µM Gd)
POPC14.2 ± 1.317.5 ± 2.8
DMPC17.3 ± 2.156.3 ± 12.4
BPE39.6 ± 15.9119.7 ± 18.1
ESM−2.9 ± 3.71113.1 ± 108.4
BSM87.9 ± 11.480.5 ± 7.6
MM25.9 ± 14.4± 18.8
Disclaimer/Publisher’s Note: The statements, opinions and data contained in all publications are solely those of the individual author(s) and contributor(s) and not of MDPI and/or the editor(s). MDPI and/or the editor(s) disclaim responsibility for any injury to people or property resulting from any ideas, methods, instructions or products referred to in the content.