Article

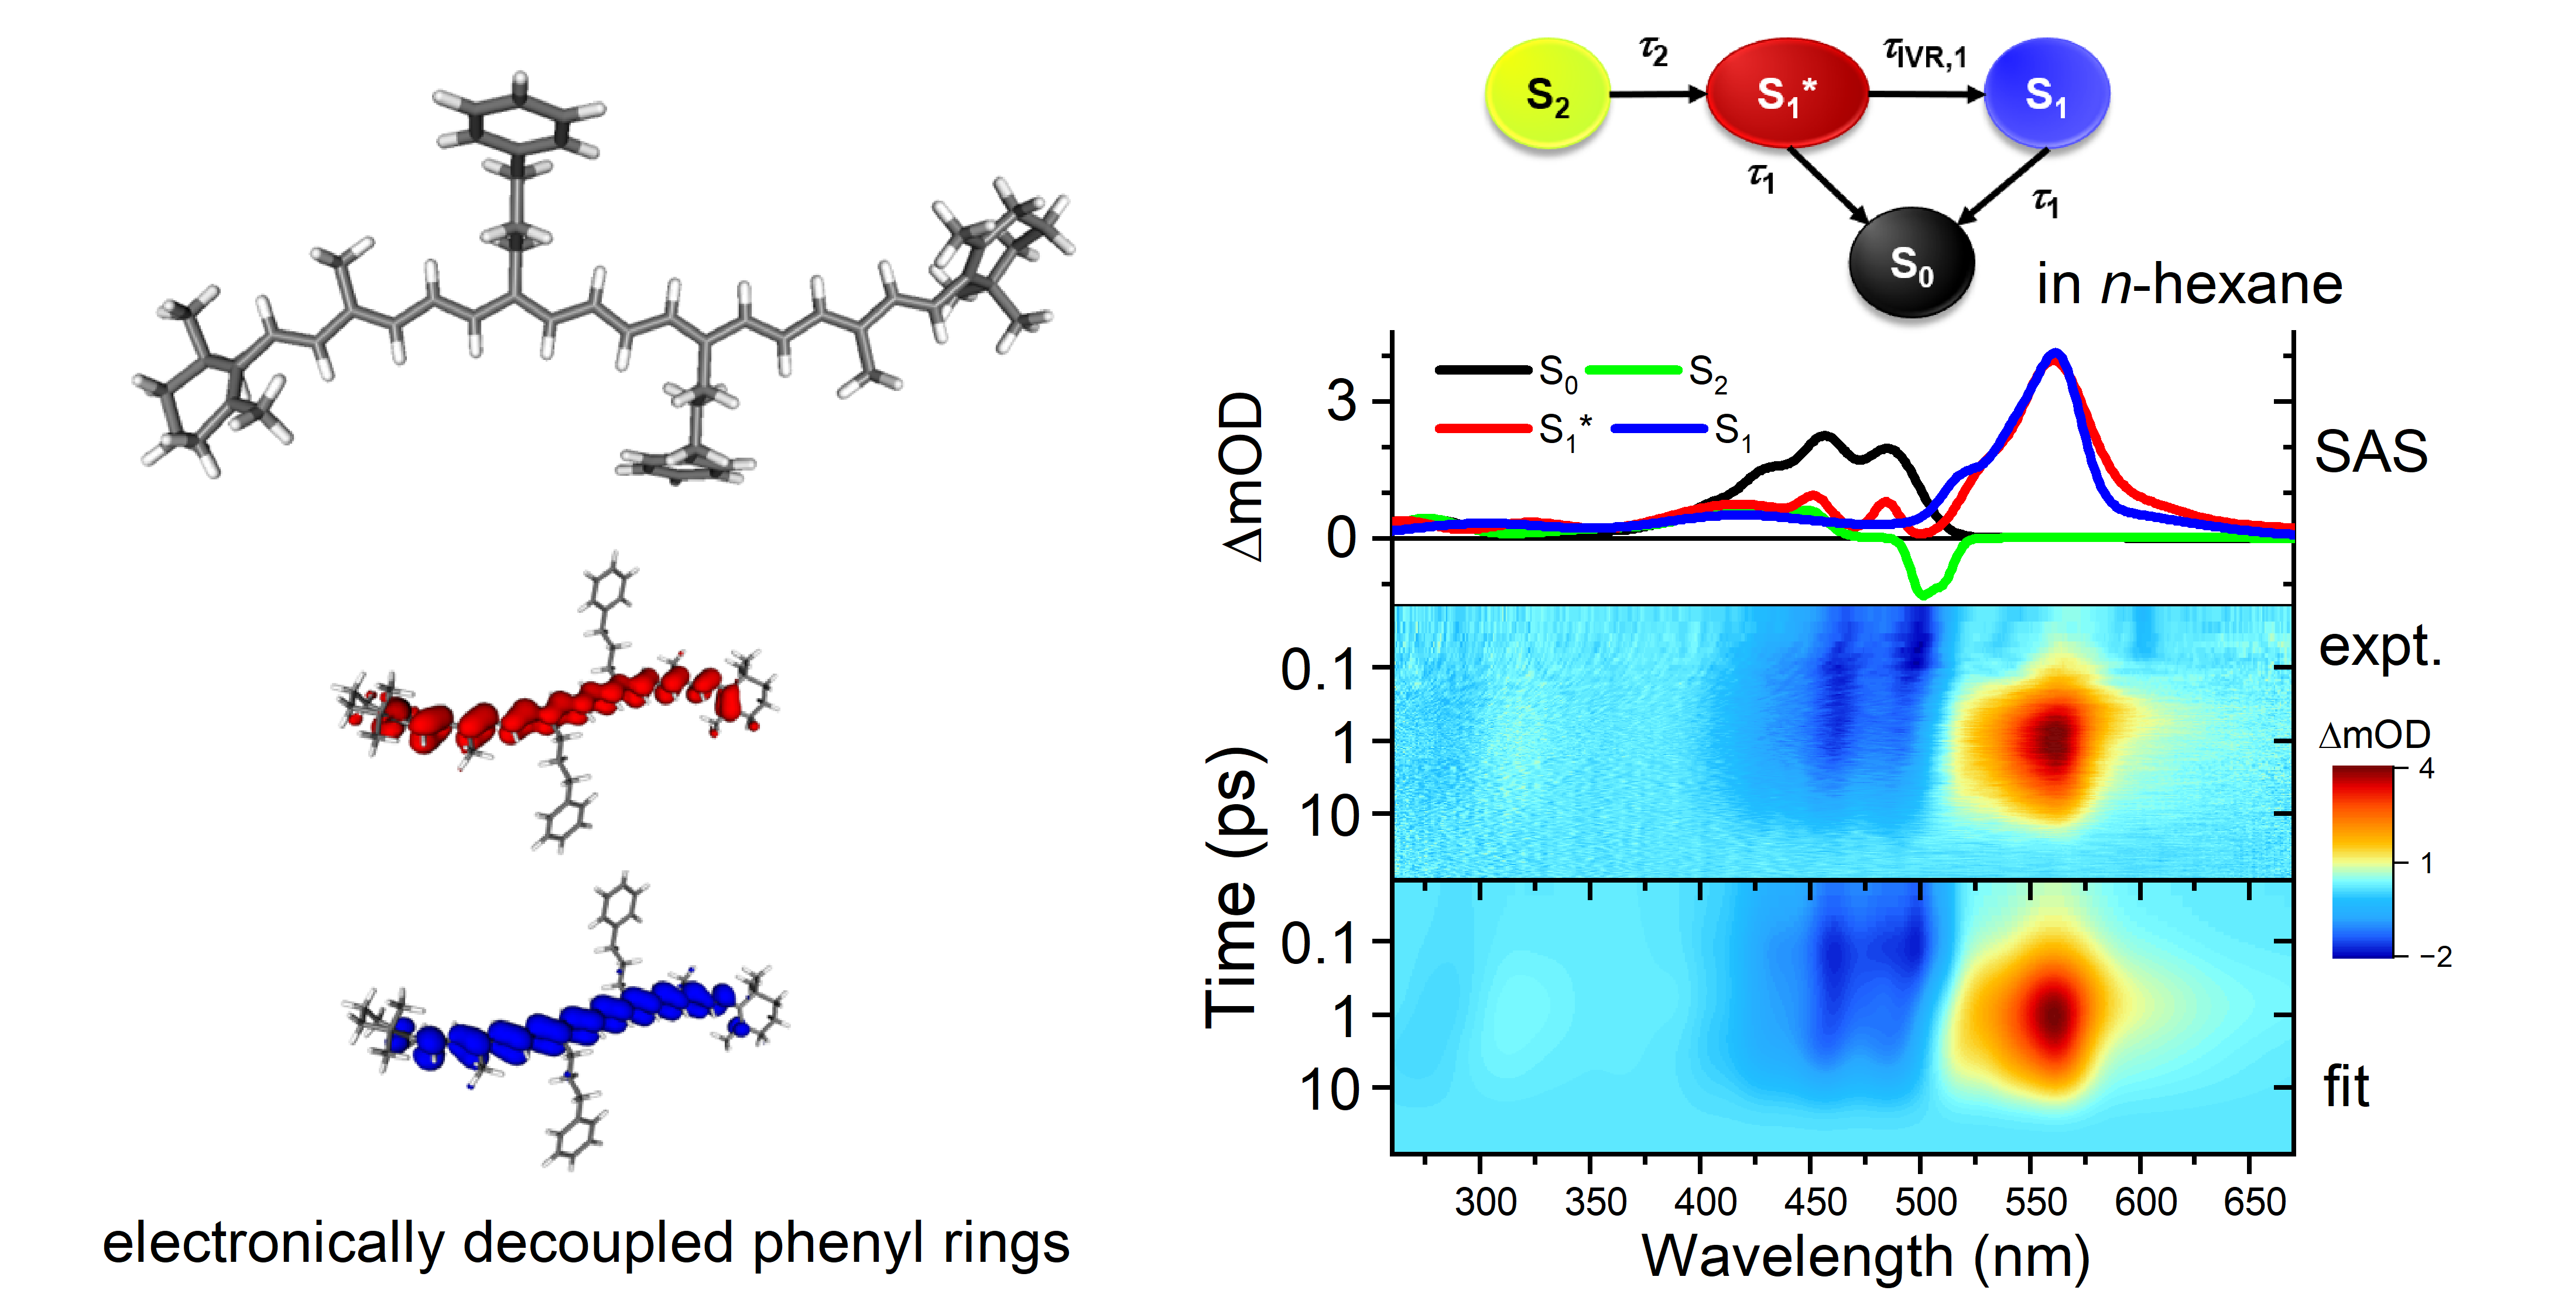
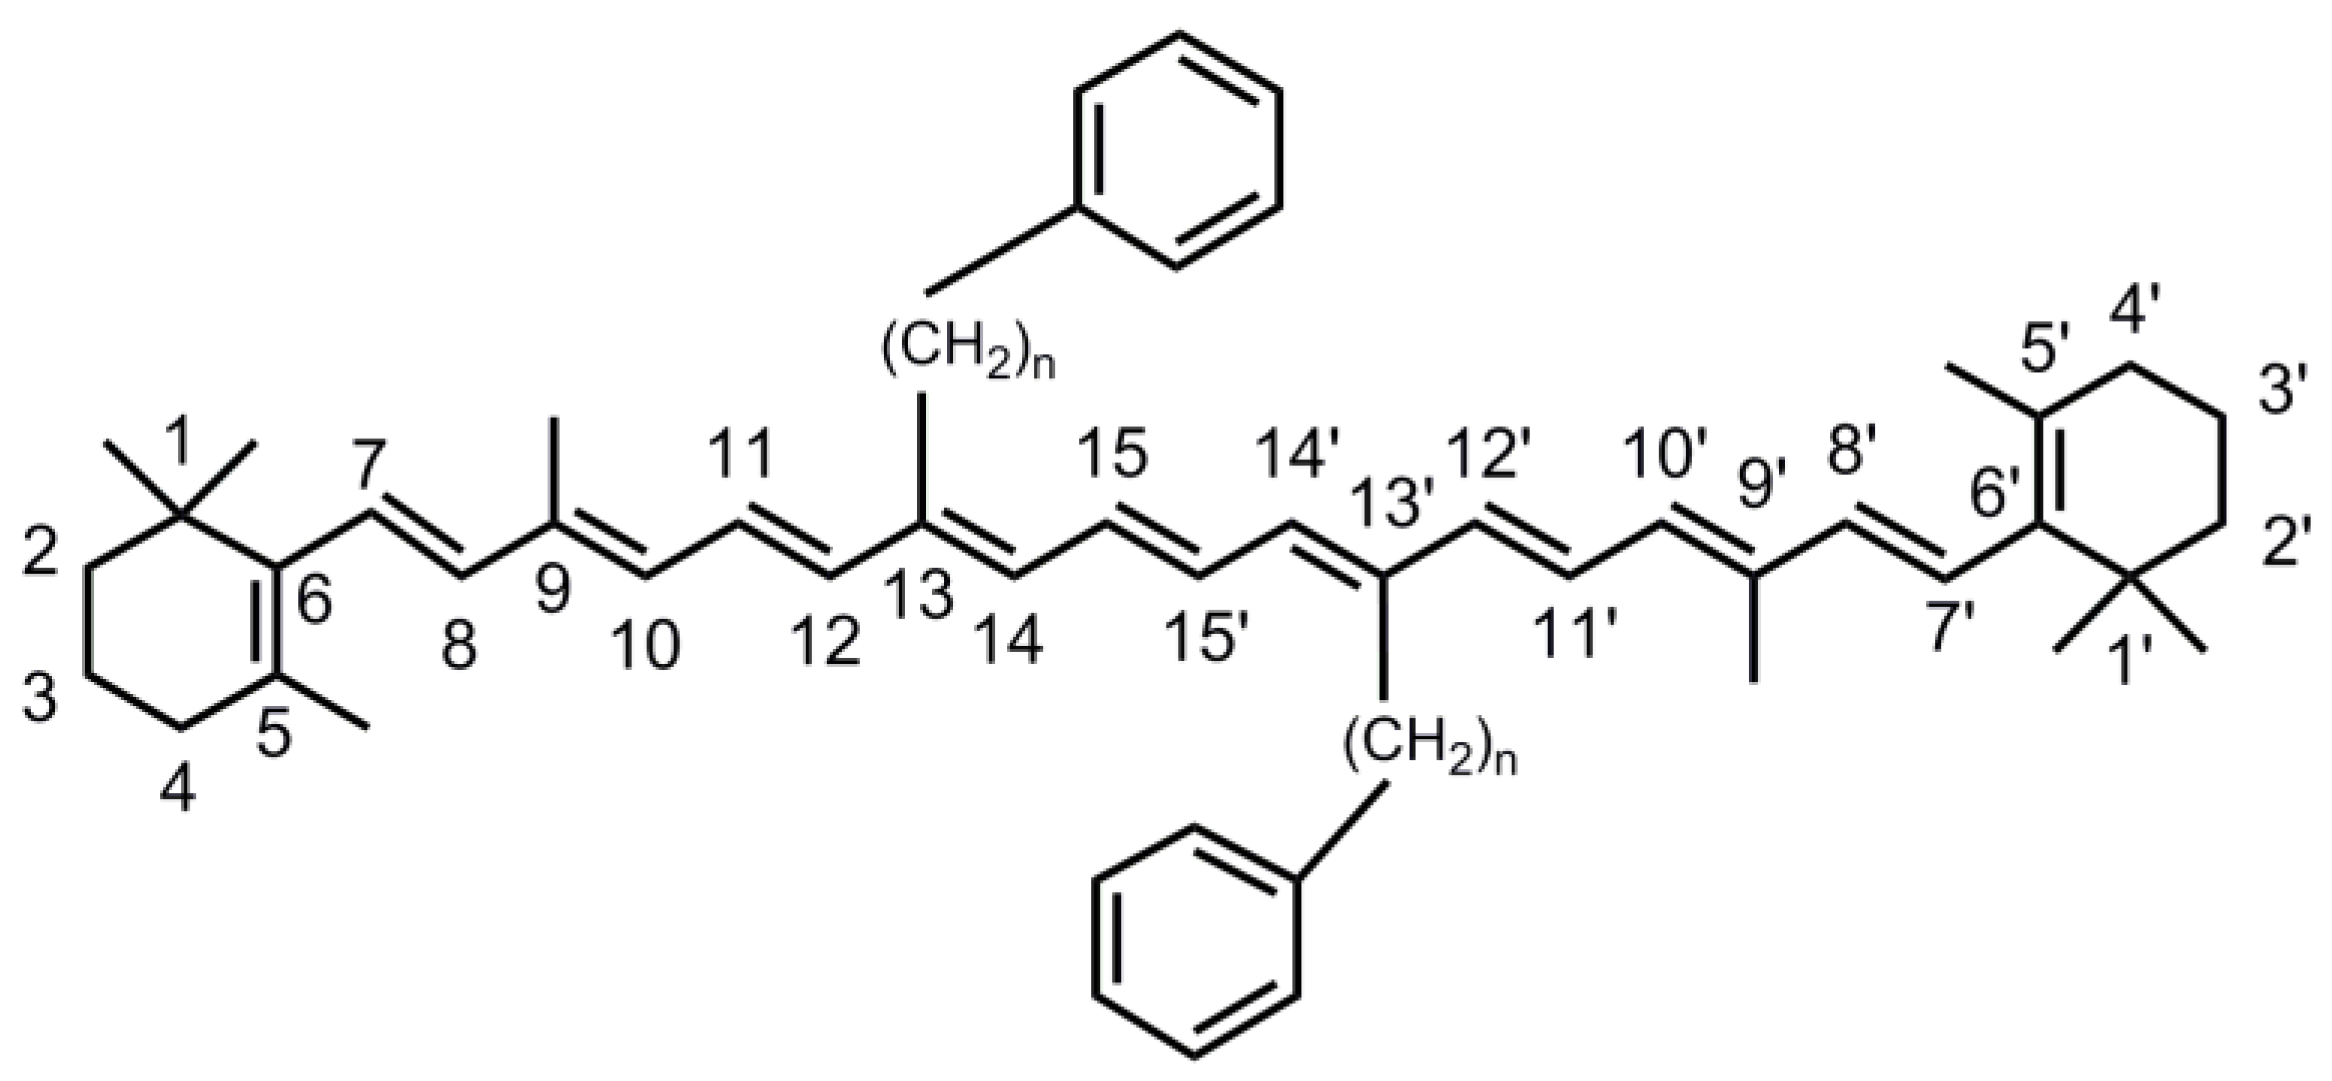
Photoinduced Dynamics of 13,13′-Diphenylpropyl-β-carotene

1
Department of Chemistry, Myongji University, Myongji-Ro 116, Cheoin-Gu, Yongin 17058, Gyeonggi-Do, Republic of Korea
2
Physical Chemistry 2, Department Chemistry and Biology, Faculty IV: School of Science and Technology, University of Siegen, Adolf-Reichwein-Str. 2, 57076 Siegen, Germany
*
Author to whom correspondence should be addressed.
Molecules 2023, 28(8), 3505; https://doi.org/10.3390/molecules28083505
Submission received: 9 March 2023 / Revised: 1 April 2023 / Accepted: 2 April 2023 / Published: 16 April 2023

Abstract

:
Carotenoids are ubiquitous pigment systems in nature which are relevant to a range of processes, such as photosynthesis, but the detailed influence of substitutions at the polyene backbone on their photophysics is still underexplored. Here, we present a detailed experimental and theoretical investigation of the carotenoid 13,13′-diphenylpropyl-β-carotene using ultrafast transient absorption spectroscopy and steady-state absorption experiments in n-hexane and n-hexadecane, complemented by DFT/TDDFT calculations. In spite of their bulkiness and their potential capability to “fold back” onto the polyene system, which could result in π-stacking effects, the phenylpropyl residues have only a minor impact on the photophysical properties compared with the parent compound β-carotene. Ultrafast spectroscopy finds lifetimes of 200–300 fs for the S2 state and 8.3–9.5 ps for the S1 state. Intramolecular vibrational redistribution with time constants in the range 0.6–1.4 ps is observed in terms of a spectral narrowing of the S1 spectrum over time. We also find clear indications of the presence of vibrationally hot molecules in the ground electronic state (S0*). The DFT/TDDFT calculations confirm that the propyl spacer electronically decouples the phenyl and polyene π-systems and that the substituents in the 13 and 13′ positions point away from the polyene system.

Graphical Abstract

1. Introduction

Carotenoids are an important class of biological molecules with crucial importance in photosynthesis, where they, e.g., function as light-harvesting pigments in the blue-green spectral region [1,2]. Substitution at the polyene backbone of carotenoids is a central motif in nature to tune their function accordingly. For instance, the xanthophyll cycle involves enzymatic epoxidation/de-epoxidation steps at the double bond of the terminal β-ionone ring of C40 carotenoids to tune the energetic location of the S1 and S2 states, important for the so-called “molecular gear-shift model” of photoregulation [3]. Extending the conjugation by keto carbonyl groups in the terminal β-ionone rings or at the end of the polyene system, such as in astaxanthin or capsanthin, results in a spectral red shift of their bright S0→S2 absorption transition by the extension of the conjugated π-system, leading to the intense red color of these pigments [4,5]. The introduction of a lactone ring attached to the conjugated polyene backbone, as in peridinin [6] or fucoxanthin [7], tunes the energetic position of the S1 and S2 states and their intramolecular charge transfer (ICT) character and thus determines the absorption spectrum and energy transfer channels in the photosynthetic complexes of marine algae, such as peridinin-chlorophyll a-protein (PCP) [8] and fucoxanthin-chlorophyll a-protein (FCP) [9].
Consequently, deliberate synthetic modifications at the polyene backbone are of considerable interest to tune the vibrational, electronic and photophysical properties of carotenoids [10,11]. For instance, substituting methyl with aryl or arylalkyl substituents at the 13/13′ and 9/9′ positions of the polyene backbone leads to carotenoids with potential applications such as conducting molecular wires [12,13,14,15] or π-stacking systems for artificial photosynthetic systems [16].
In the current study we investigate a compound from this class, 13,13′-diphenylalkyl-β-carotenes, with two phenylpropyl substituents in the 13 and 13′ positions (compound 1, n = 3 in Figure 1). Aromatic substituents attached via an alkyl bridge at the polyene system might induce distortion of the conjugated chain or could provide additional flexibility to “fold back” the phenyl ring onto the polyene π-system, which could result in π-stacking effects, manifesting themselves in spectral shifts in the optical spectra or changes in the dynamics of the excited electronic states prepared via photoexcitation. Here, we will investigate the impact of this substitution using steady-state and time-resolved transient absorption spectroscopy as well as DFT/TDDFT calculations. The results will be compared with those from our previous studies on 13,13′-diphenyl-β-carotene (compound 2, n = 0 in Figure 1) [11] and the parent compound β-carotene (3) [17] with methyl groups in the positions 13 and 13′ instead of the two phenylpropyl substituents of compound 1.

2. Results and Discussion

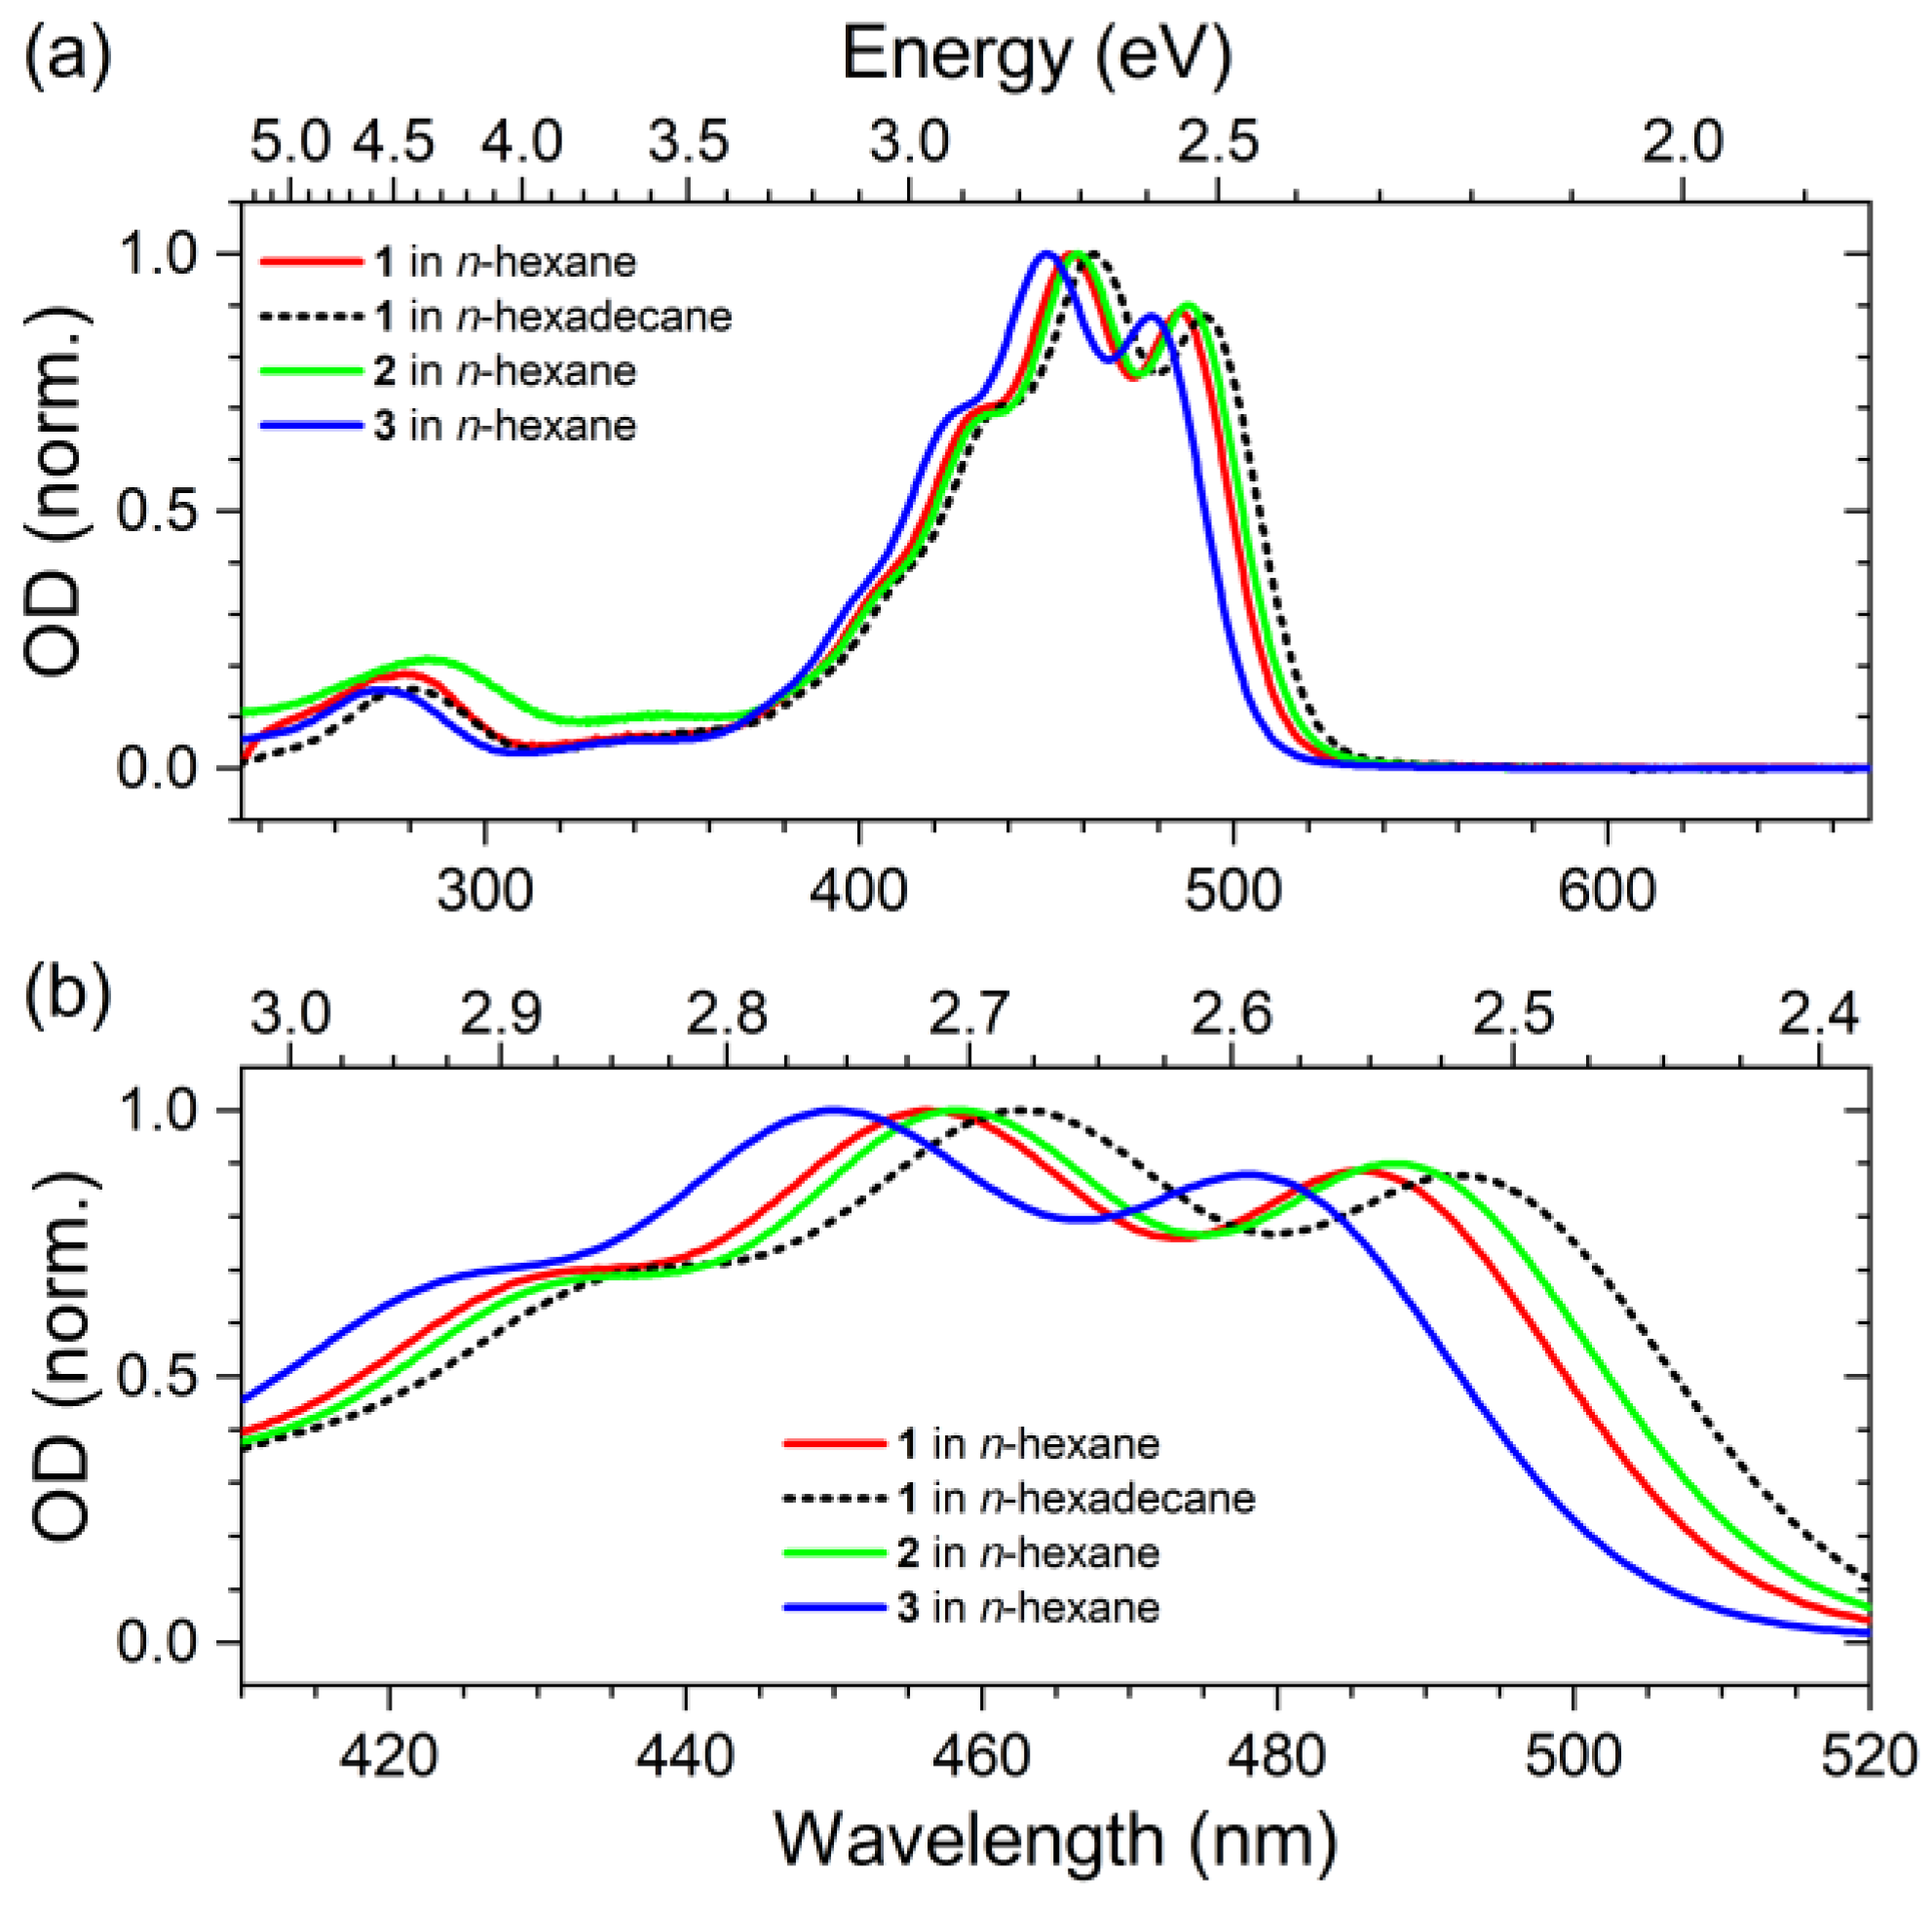
2.1. Steady-State Absorption Spectra

Figure 2 shows the steady-state absorption spectra of compounds 1, 2 and 3 in the organic solvents n-hexane and n-hexadecane. The bright S0→S2 transition is located in the spectral region 380–540 nm and shows a clear vibronic structure. For compound 1, the 0–0 transition is found at 486 nm (2.55 eV) in n-hexane and at 492 nm (2.52 eV) in n-hexadecane. This clear spectral red shift is due to the larger polarizability R(n) of n-hexadecane, and such a correlation for nonpolar carotenoids in nonpolar solvents is well-known [11,18,19]. Turning to the solvent n-hexane, we observe that the 0–0 transition in the S0→S2 band of compounds 2 and 3 is located at 488 nm (2.54 eV) and 478 nm (2.59 eV), respectively. In this case, a simple polarizability argument (here for the solute) does not work anymore, because then one would expect the largest spectral red shift to occur for compound 1, which is, however, not the case. Instead, compound 2 exhibits the largest red shift in n-hexane. It is well known that the spectral red shift of the S0→S2 transition is strongly influenced by the effective conjugation length of the polyene system [20,21,22]. We therefore take our experimental result as a first indication that the phenyl substituents of compound 2 in the 13 and 13′ positions have a weak electronic overlap with the π-system of the polyene backbone, which effectively extends the conjugated system. In contrast, the alkyl spacers of compound 1 electronically decouple the phenyl rings from the polyene system. There are also no clear spectral indications for π-stacking between the phenyl rings and the polyene system in these dilute solutions, which would manifest themselves in spectral shifts or the appearance of additional spectral bands.

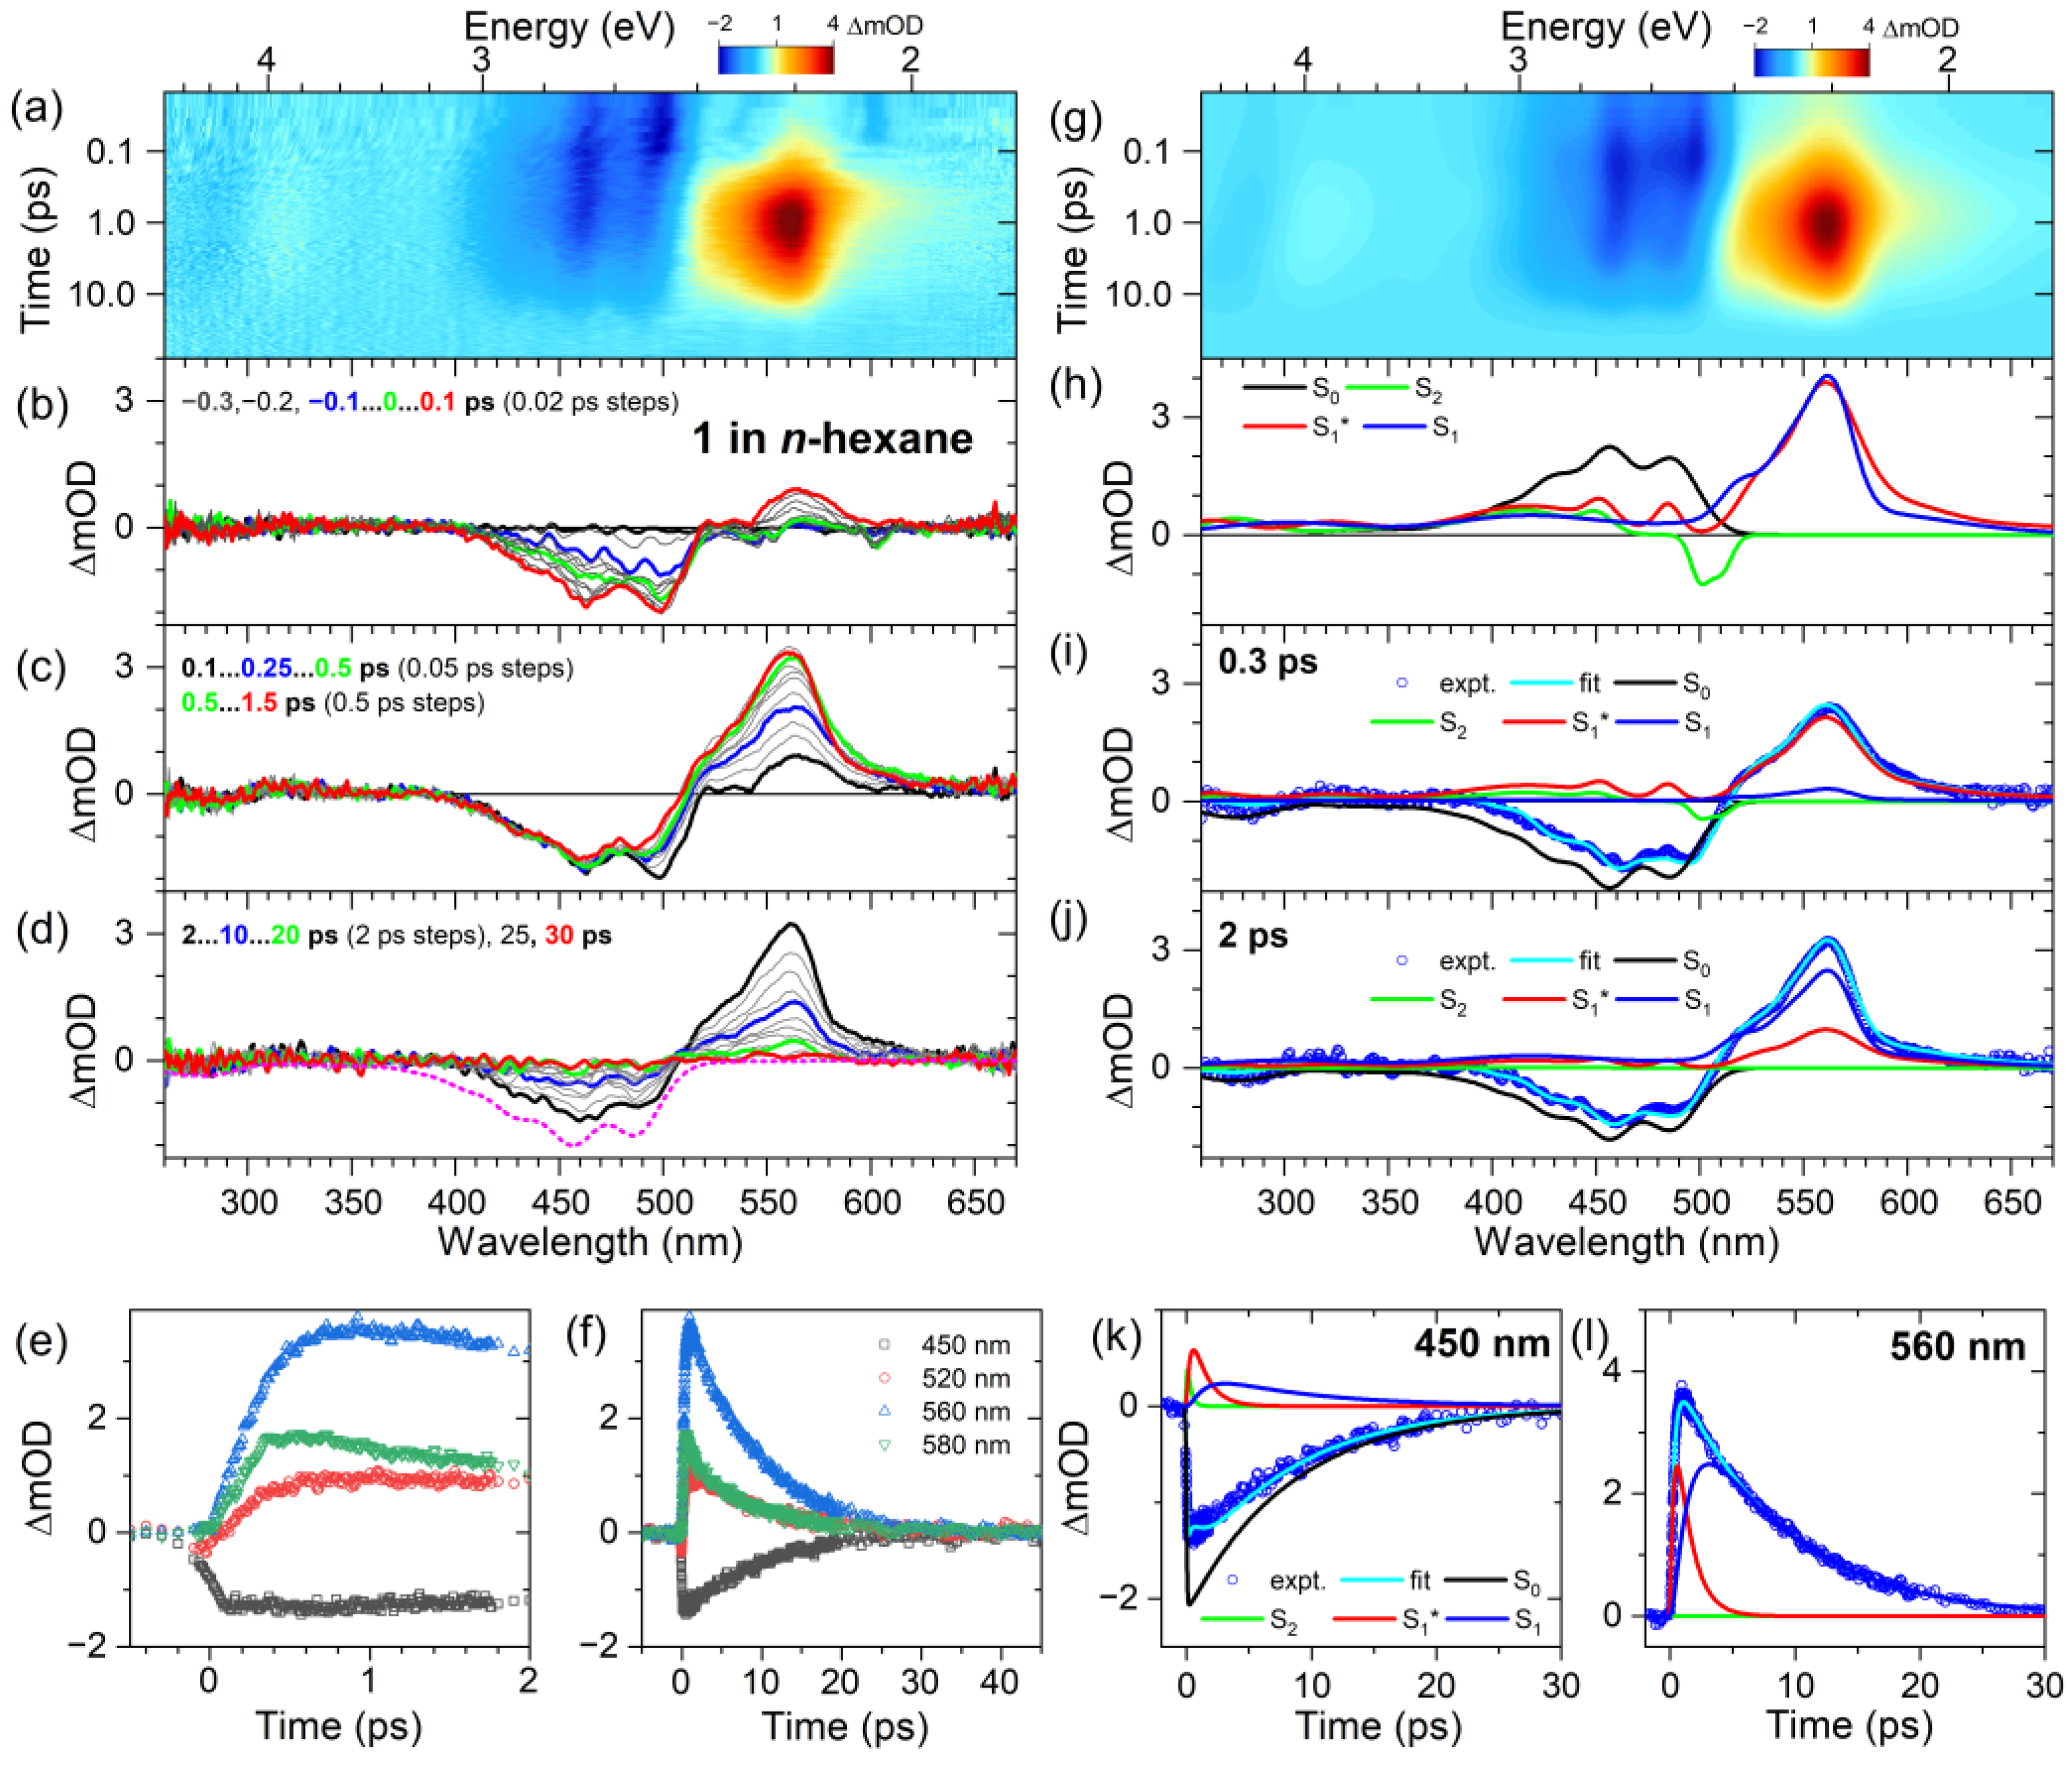
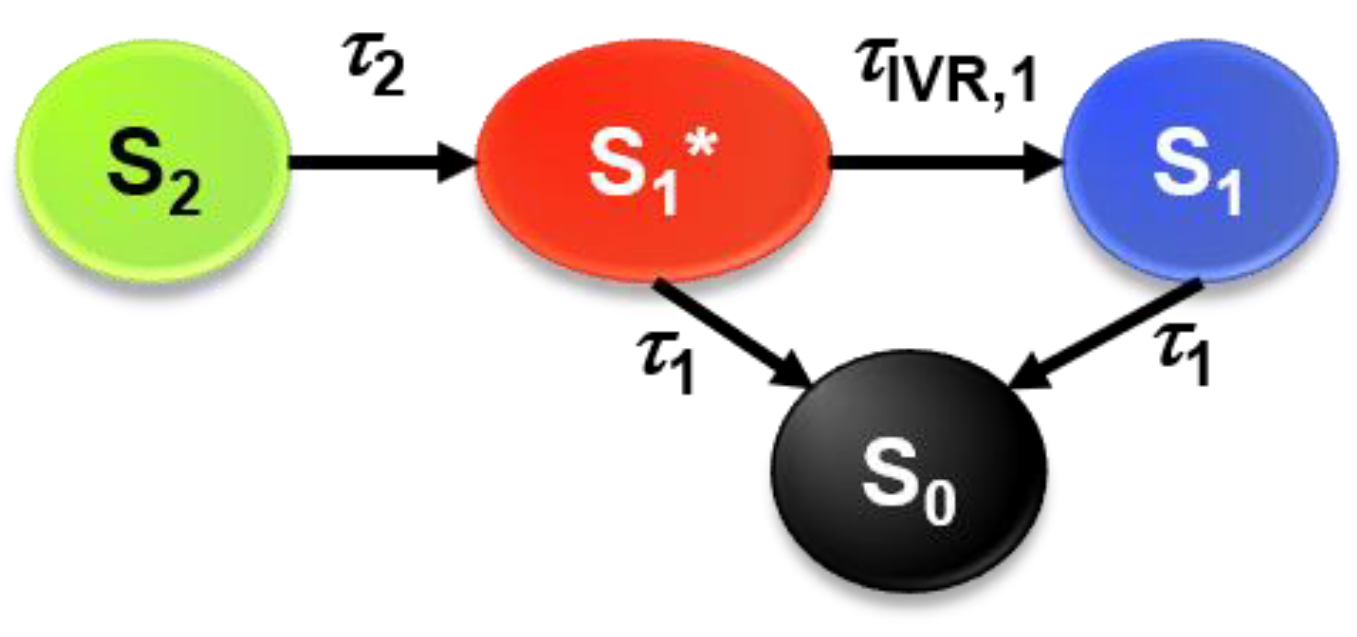
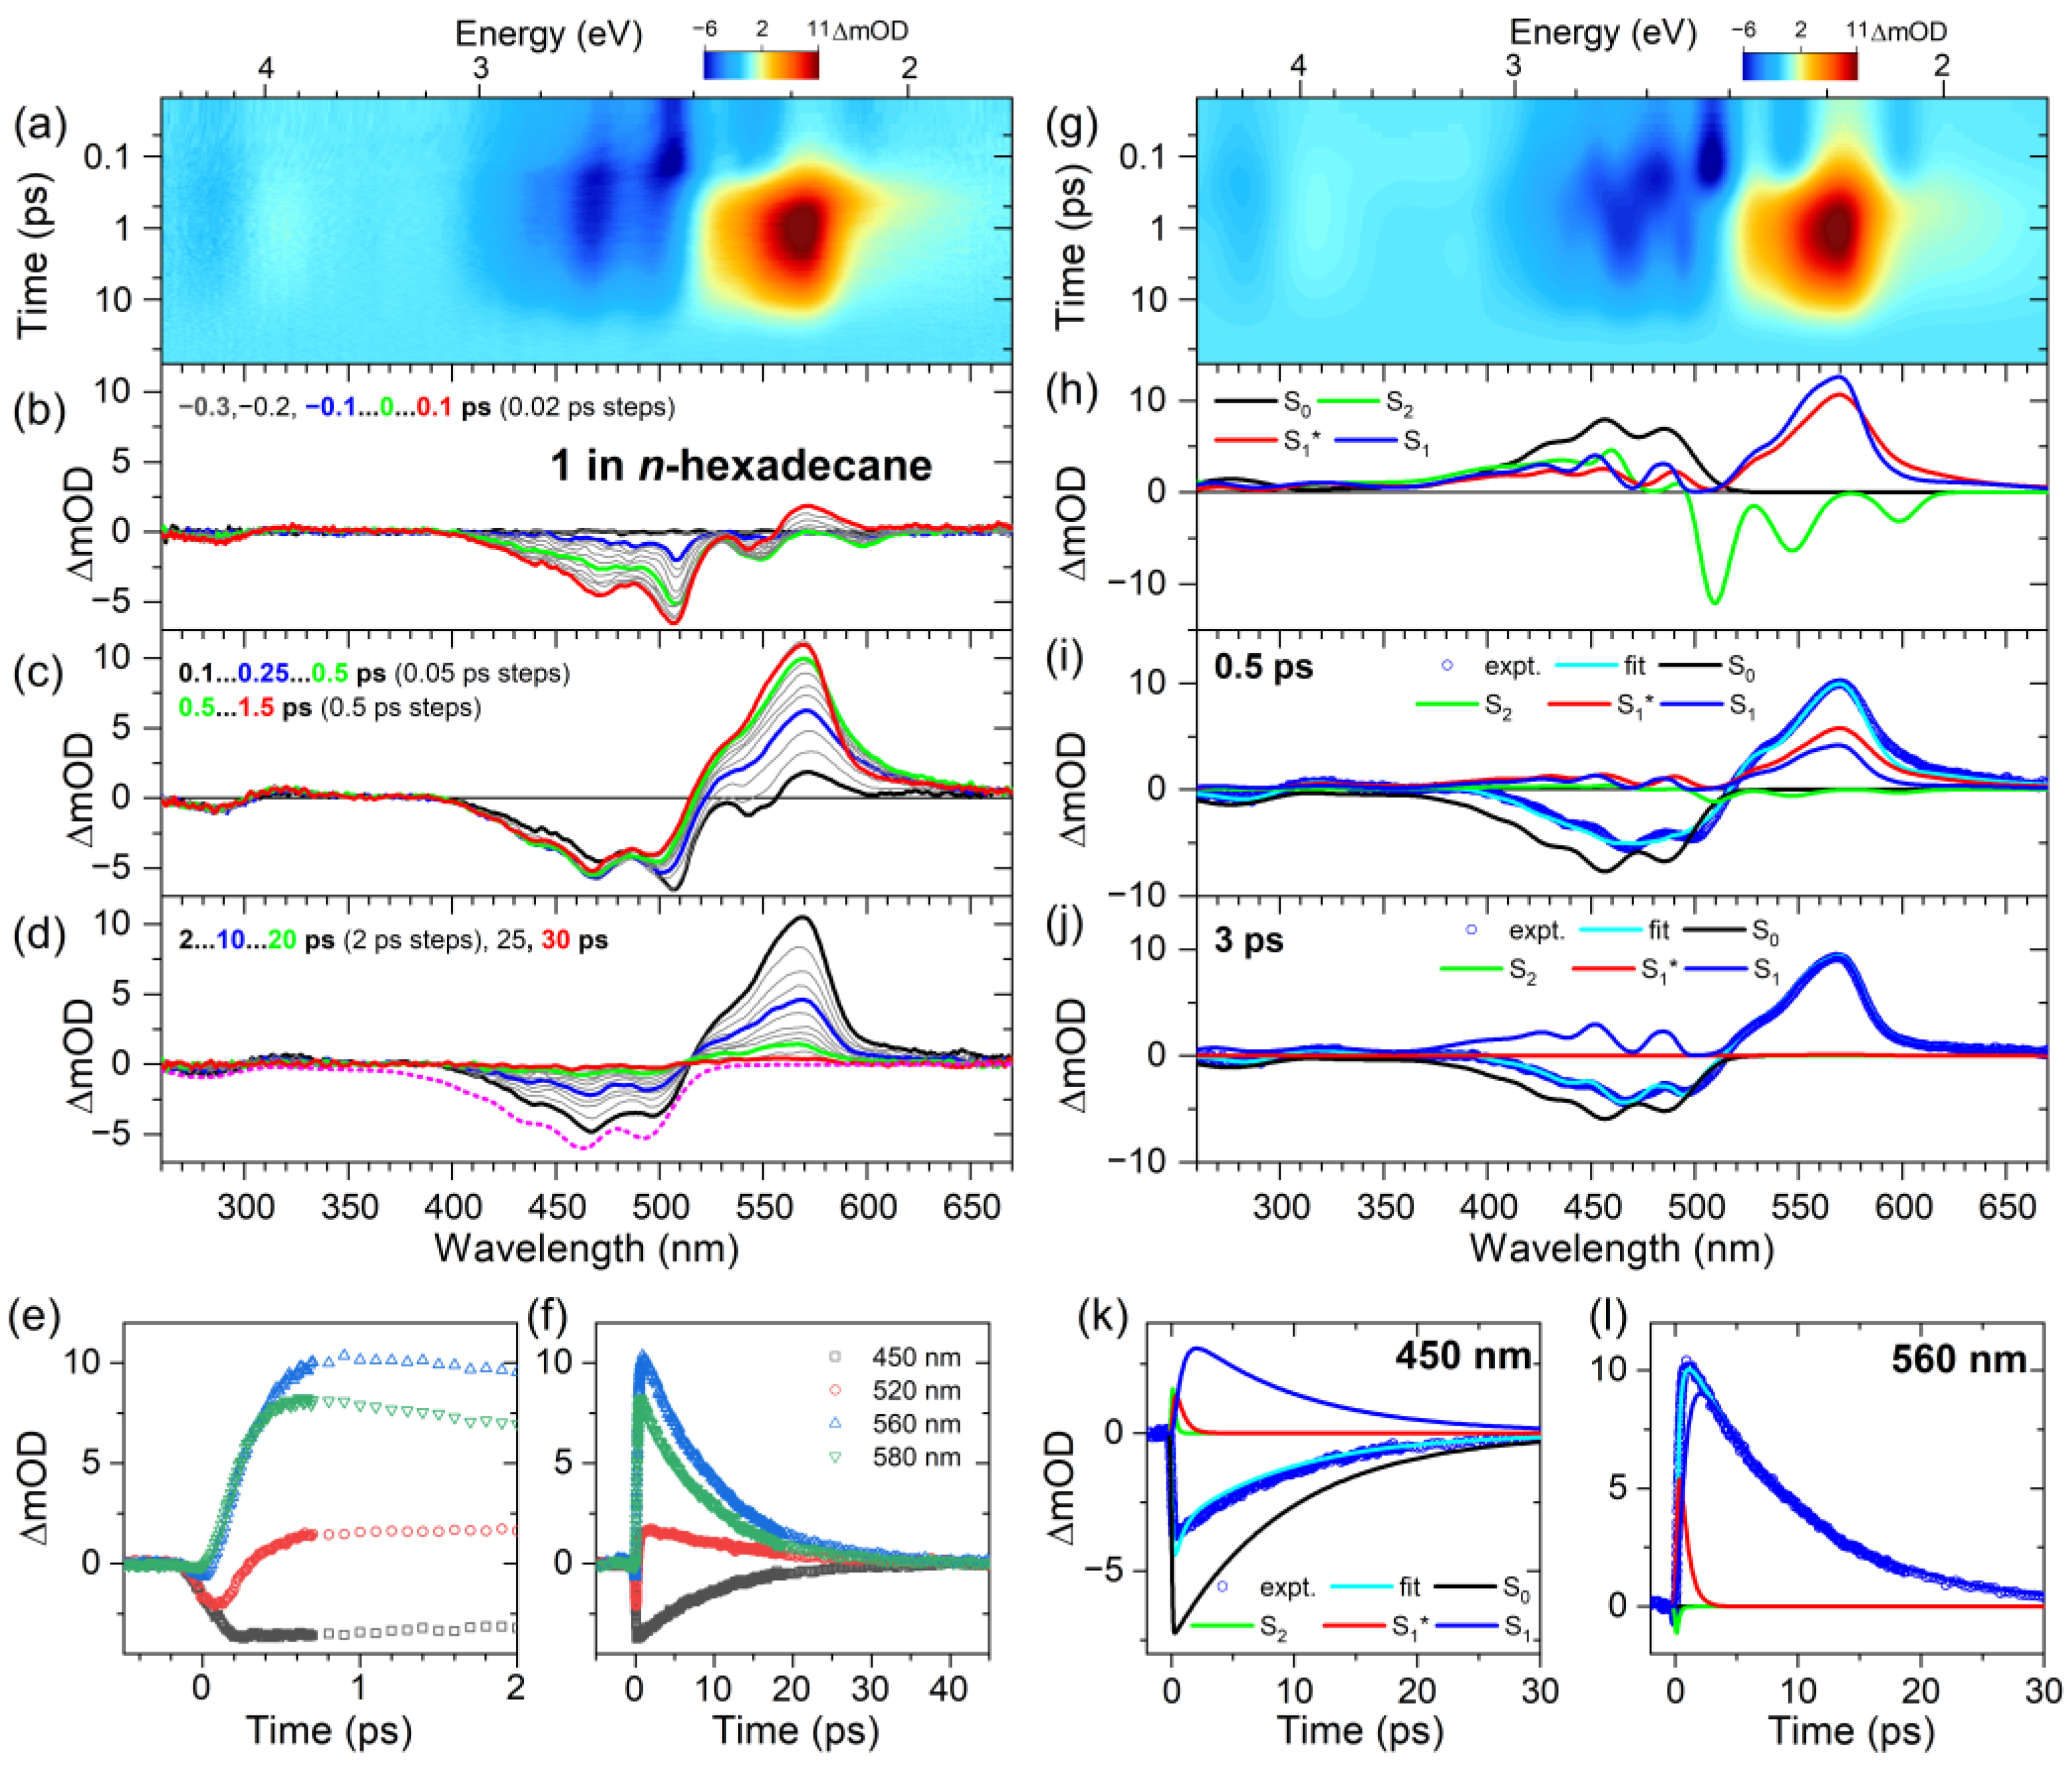
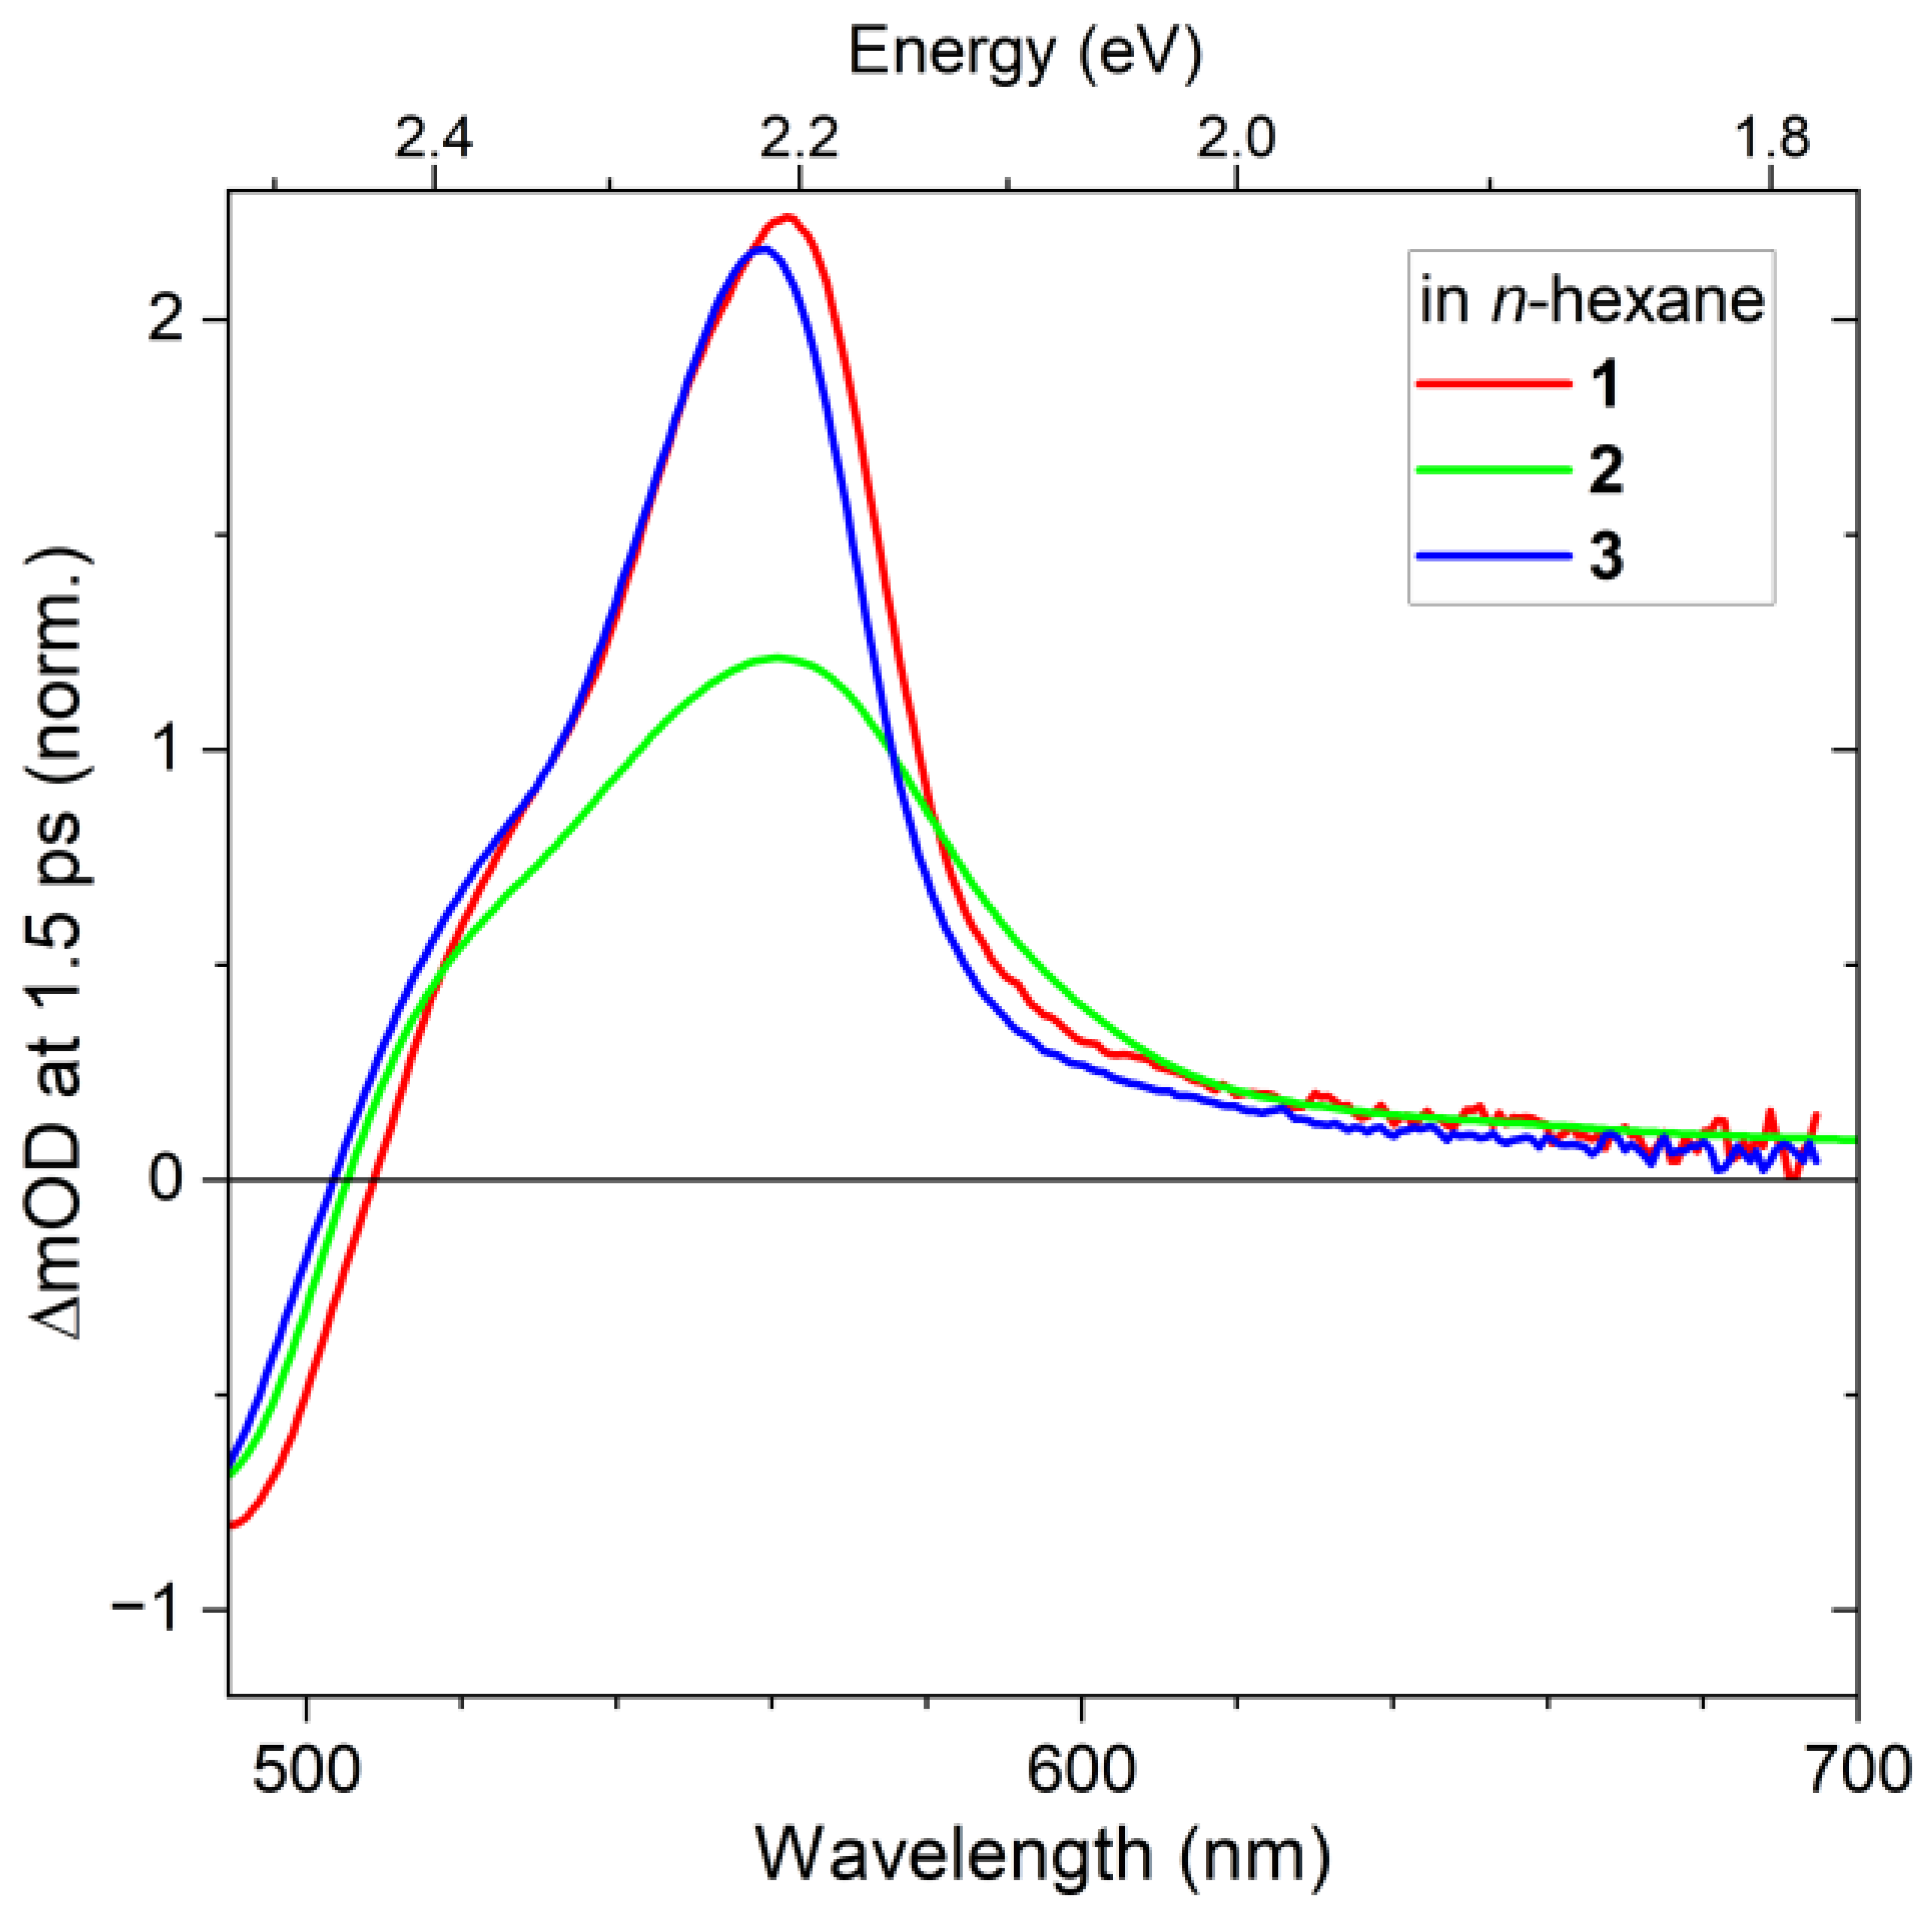
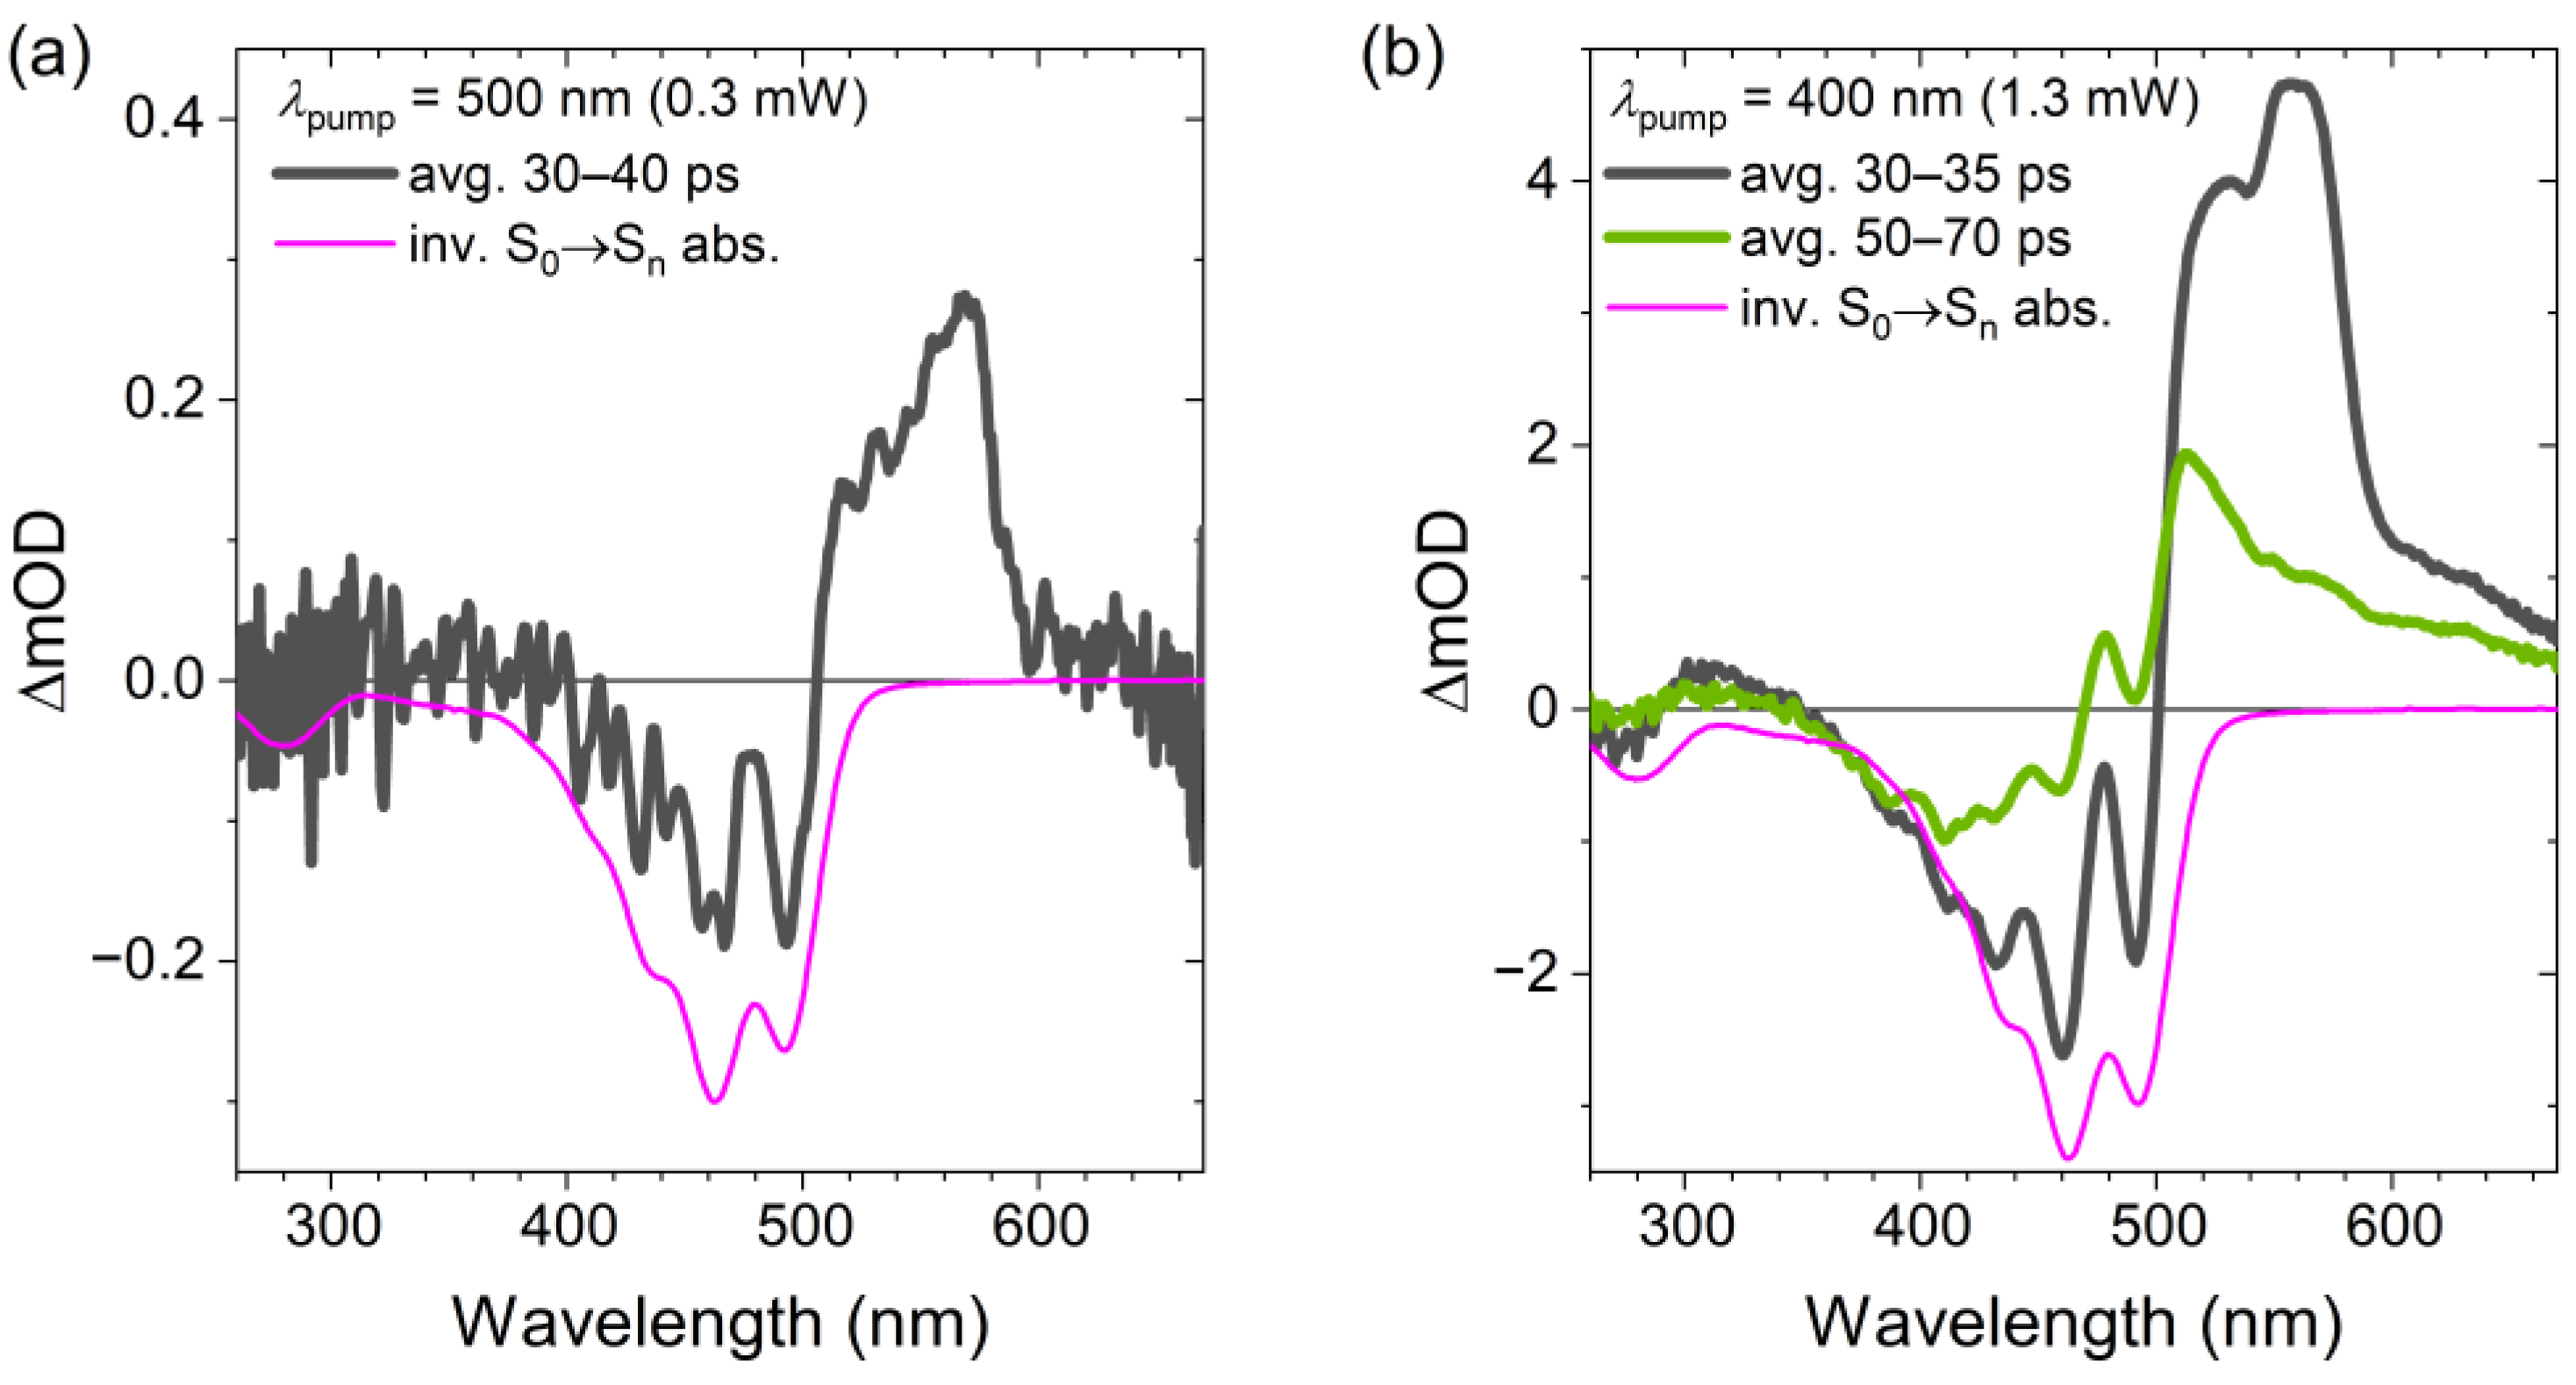
2.2. Transient Absorption Spectra and Their Global Kinetic Analysis

In the following, we turn to the spectral dynamics of compound 1 in n-hexane upon photoexcitation in the S0→S2 band. Panel a of Figure 3 shows the results of ultrafast broadband transient absorption experiments for time delays up to 100 ps as a contour plot (pump wavelength of 500 nm). Panels b–d highlight transient spectra at selected time delays.
Early on in the process (panel b), we observe a clear ground state bleach (GSB) in the spectral range 400–510 nm (S0→S2 transition), with an additional weak negative peak around 540 nm, which we assign to the stimulated emission (SE) of the S2 state. At 0.1 ps, one already notices the appearance of an excited state absorption (ESA) band around 560 nm, which arises from the S1 state, which is optically dark in the steady-state absorption spectrum (Figure 2). The formation of S1 by internal conversion (IC) is ultrafast (sub 300 fs), as seen by the rise of the S1→Sn ESA band at 560 nm in panel c, with no change in the GSB band below 450 nm, identifying this process as a relaxation between different excited electronic states. In addition, there is a spectral narrowing on the red edge of the ESA band around 580 nm, most easily seen when comparing the green and red transient spectra at 0.5 ps and 1.5 ps, respectively. We assign this process to intramolecular vibrational redistribution (IVR) in the S1 state [23] and some superimposed vibrational cooling via collisional energy transfer (CET) from compound 1 to the solvent n-hexane. Over longer time scales up to 30 ps (panel d), the GSB and ESA bands decay uniformly, indicating an IC process from the S1 to the S0 state. There are also weak spectral features of vibrationally hot molecules in the ground electronic state (S0*) for long delay times (>30 ps), as will be discussed further below.
The kinetic traces at four selected wavelengths are presented in panels e and f for pump–probe time delays up to 2 ps and 45 ps, respectively. In panel e, the kinetics in the GSB region at 450 nm (black) show a prompt jump at zero delay time and afterwards decay only very slightly up to 2 ps. In contrast, the kinetic transients on the blue edge and at the peak of the S1→Sn ESA band (520 nm (red) and 560 nm (blue), respectively) show a slower curved rise, which indicates the IC process from S2 to S1. The transient on the red edge of the S1→Sn ESA band at 580 nm (green), exhibits an additional, faster decay component, which is related to the IVR and CET processes. Over longer time scales (panel f), all the transients decay uniformly, which indicates the IC process S1→S0.
The spectral dynamics were modeled based on a global kinetic analysis procedure, using the kinetic scheme shown in Figure 4: the initially prepared S2 state first decays to an unrelaxed S1* state with the time constant τ2, which then forms the relaxed S1 state via IVR (and some contribution of fast CET processes), as described by the time constant τIVR,1. Both S1 species decay by IC to S0 with the time constant τ1.
The results of this kinetic analysis are presented in panels g–l of Figure 3. Panel g shows the contour plot resulting from the simulation, which shows very good agreement with the experimental contour plot in panel a. Panel h displays the species-associated spectra (SAS). The S2 state (green) shows S2→S0-stimulated emission around 500 nm and a weak ESA band in the spectral range 330–470 nm. The red edge of the S1* species is broader and the maximum is lower than for the S1 state. This spectral change is consistent with an IVR process, which is possibly superimposed by some contribution of collisional energy transfer (CET) to the solvent. Panels i and j show two examples of how these different species contribute to the modeled transient spectra (cyan line) at different stages of the relaxation. At 0.5 ps, there are residual contributions of S2 (green), and dominant contributions come from the GSB of S0 (black) and ESA of S1* (red), with an additional weak contribution of S1 (blue). By 2 ps, S1 has become the dominant excited species, with much less S1* left. Panels k and l contain the modeling results for selected kinetic traces at 450 and 560 nm, showing the ultrafast decay of the initially prepared S2 state (green), the ultrafast generation and fast decay of S1*, as well as the slower formation of S1 and its slow decay on the several picosecond time scale. The resulting time constants are summarized in Table 1. An S2 lifetime of about 300 fs was found, which is slightly slower than the 160–170 fs reported previously for the compounds 2 and 3 in n-hexane [11]. The IVR time constant τIVR,1 of 1.42 ps also appears to be slower than the 390 and 630 fs previously found for compounds 2 and 3, respectively [11]. The IC time constant of 8.3 ps obtained for the S1→S0 decay is in good agreement with the 9.2 and 8.7 ps determined previously for compounds 2 and 3.
Ultrafast transient absorption spectra of compound 1 were also recorded in the solvent n-hexadecane. The results are shown in Figure 5. The spectral evolution is similar to that of compound 1 in n-hexane, i.e., the fast formation of S1* from S2, the relaxation of S1* by IVR to S1, and IC from S1 (and also S1*) to S0 (panels a–d). The corresponding kinetics at four selected wavelengths are included in panels e and f for probe wavelengths in the GSB and ESA range. The kinetic modeling (panels g–l) provide SAS (panel h), which are similar to those for 1 in n-hexane, especially in that the narrowing of the band upon conversion from S1* into S1 is well reproduced. Note that the additional peaks around 590 and 545 nm in the SAS of the short-lived S2 state are due to Raman Stokes transitions of n-hexadecane visible during the overlap time of the 500 nm pump and supercontinuum probe pulses [24,25]. The transient spectra (panels i and j) are again well modeled by the simulation. In this case, the decays of S2 and S1* are faster (compare, e.g., the amplitudes of the SAS of S1* and S1 at 0.5 ps with those in Figure 3). Furthermore, the kinetic traces at 450 and 560 nm, provided in panels k and l, respectively, are well described by the modeling and confirm the faster decay of S2 and S1*. The time constants are summarized in Table 1. We obtain values of 190 fs, 0.66 ps and 9.5 ps for τ2, τIVR,1 and τ1, respectively, quite similar to those reported previously for compounds 2 and 3 [11].
Figure 6 compares the spectral shape of the S1→Sn ESA band of compounds 13 in n-hexane for the spectral range 490–700 nm. We note that the band shape of compounds 1 and 3 is quite similar, except for the larger red shift observed for compound 1. This is consistent with the observation for the S0→S2 ground-state absorption in Figure 2 and can be traced back to the larger polarizability of compound 1. In contrast, the ESA band of compound 2 is much broader and its oscillator strength is considerably smaller. We speculate that this might be a result of the larger electronic overlap between the π-system of the phenyl rings and the conjugated π-system of the polyene in the Sn state involved in the ESA transition. It was observed previously that higher-energy Sn states of compound 2 show the delocalization of electron density onto the phenyl rings in the 13 and 13′ positions [11].
At the end of this subsection, we would like to comment on the presence of absorption features of compound 1 connected with the vibrationally hot ground electronic state S0* [4,11,17,22,23]. Figure 7a shows a comparison of the transient absorption spectrum in the spectral range 280–650 nm (pump wavelength: 500 nm, averaged over the time interval 30–40 ps (black)) with the inverted steady-state S0→S2 absorption spectrum (magenta). Despite the fact that the signal-to-noise ratio is quite small, one clearly sees that the negative peaks in the GSB region of the transient spectrum are much sharper than corresponding ones in the steady-state absorption spectrum (magenta). Moreover, one observes additional absorption around 540 nm. Both features are hallmarks of the absorption of vibrationally hot S0* species, as explained in more detail previously [17]. The peak at 560 nm stems from residual ESA of the S1 state.
In order to enhance the amplitude of the S0* spectral features, additional experiments were performed at the pump wavelength 400 nm and at a higher pump power of 1.3 mW (Figure 7b). Because of the shorter pump wavelength, after the two consecutive IC steps from S2 via S1 to S0*, the vibrationally excited molecules in the electronic ground state will have a much higher internal excess energy than for excitation at 500 nm (nominal energy difference of 0.62 eV). In addition, the higher power of the pump pulse will increase the concentration of S0*. Therefore, the amplitude of the transient absorption signal averaged over the wavelength range 30–40 ps in Figure 7b is about 10 times larger than for the corresponding trace in panel a for low-power excitation at 500 nm. This enables us to follow the fate of the S0* molecules to even longer pump–probe delay times, cf. the transient spectrum averaged over the time interval 50–70 ps (green). Here, we clearly see that the peak at 560 nm must be due to residual S1→Sn ESA, as it decays much faster than the S0* “hot band” absorption, which is compared located closer to the GSB feature of the S0→S2 absorption band. We therefore conclude that we have also clearly detected S0* for the carotenoid compound 1. This is in line with previous results for a range of structurally different carotenoid systems, including, among others, macrocarotenes [23], compounds 2 and 3 [11,17], C40 xanthophyll carotenoids [4] and apocarotenals [22].

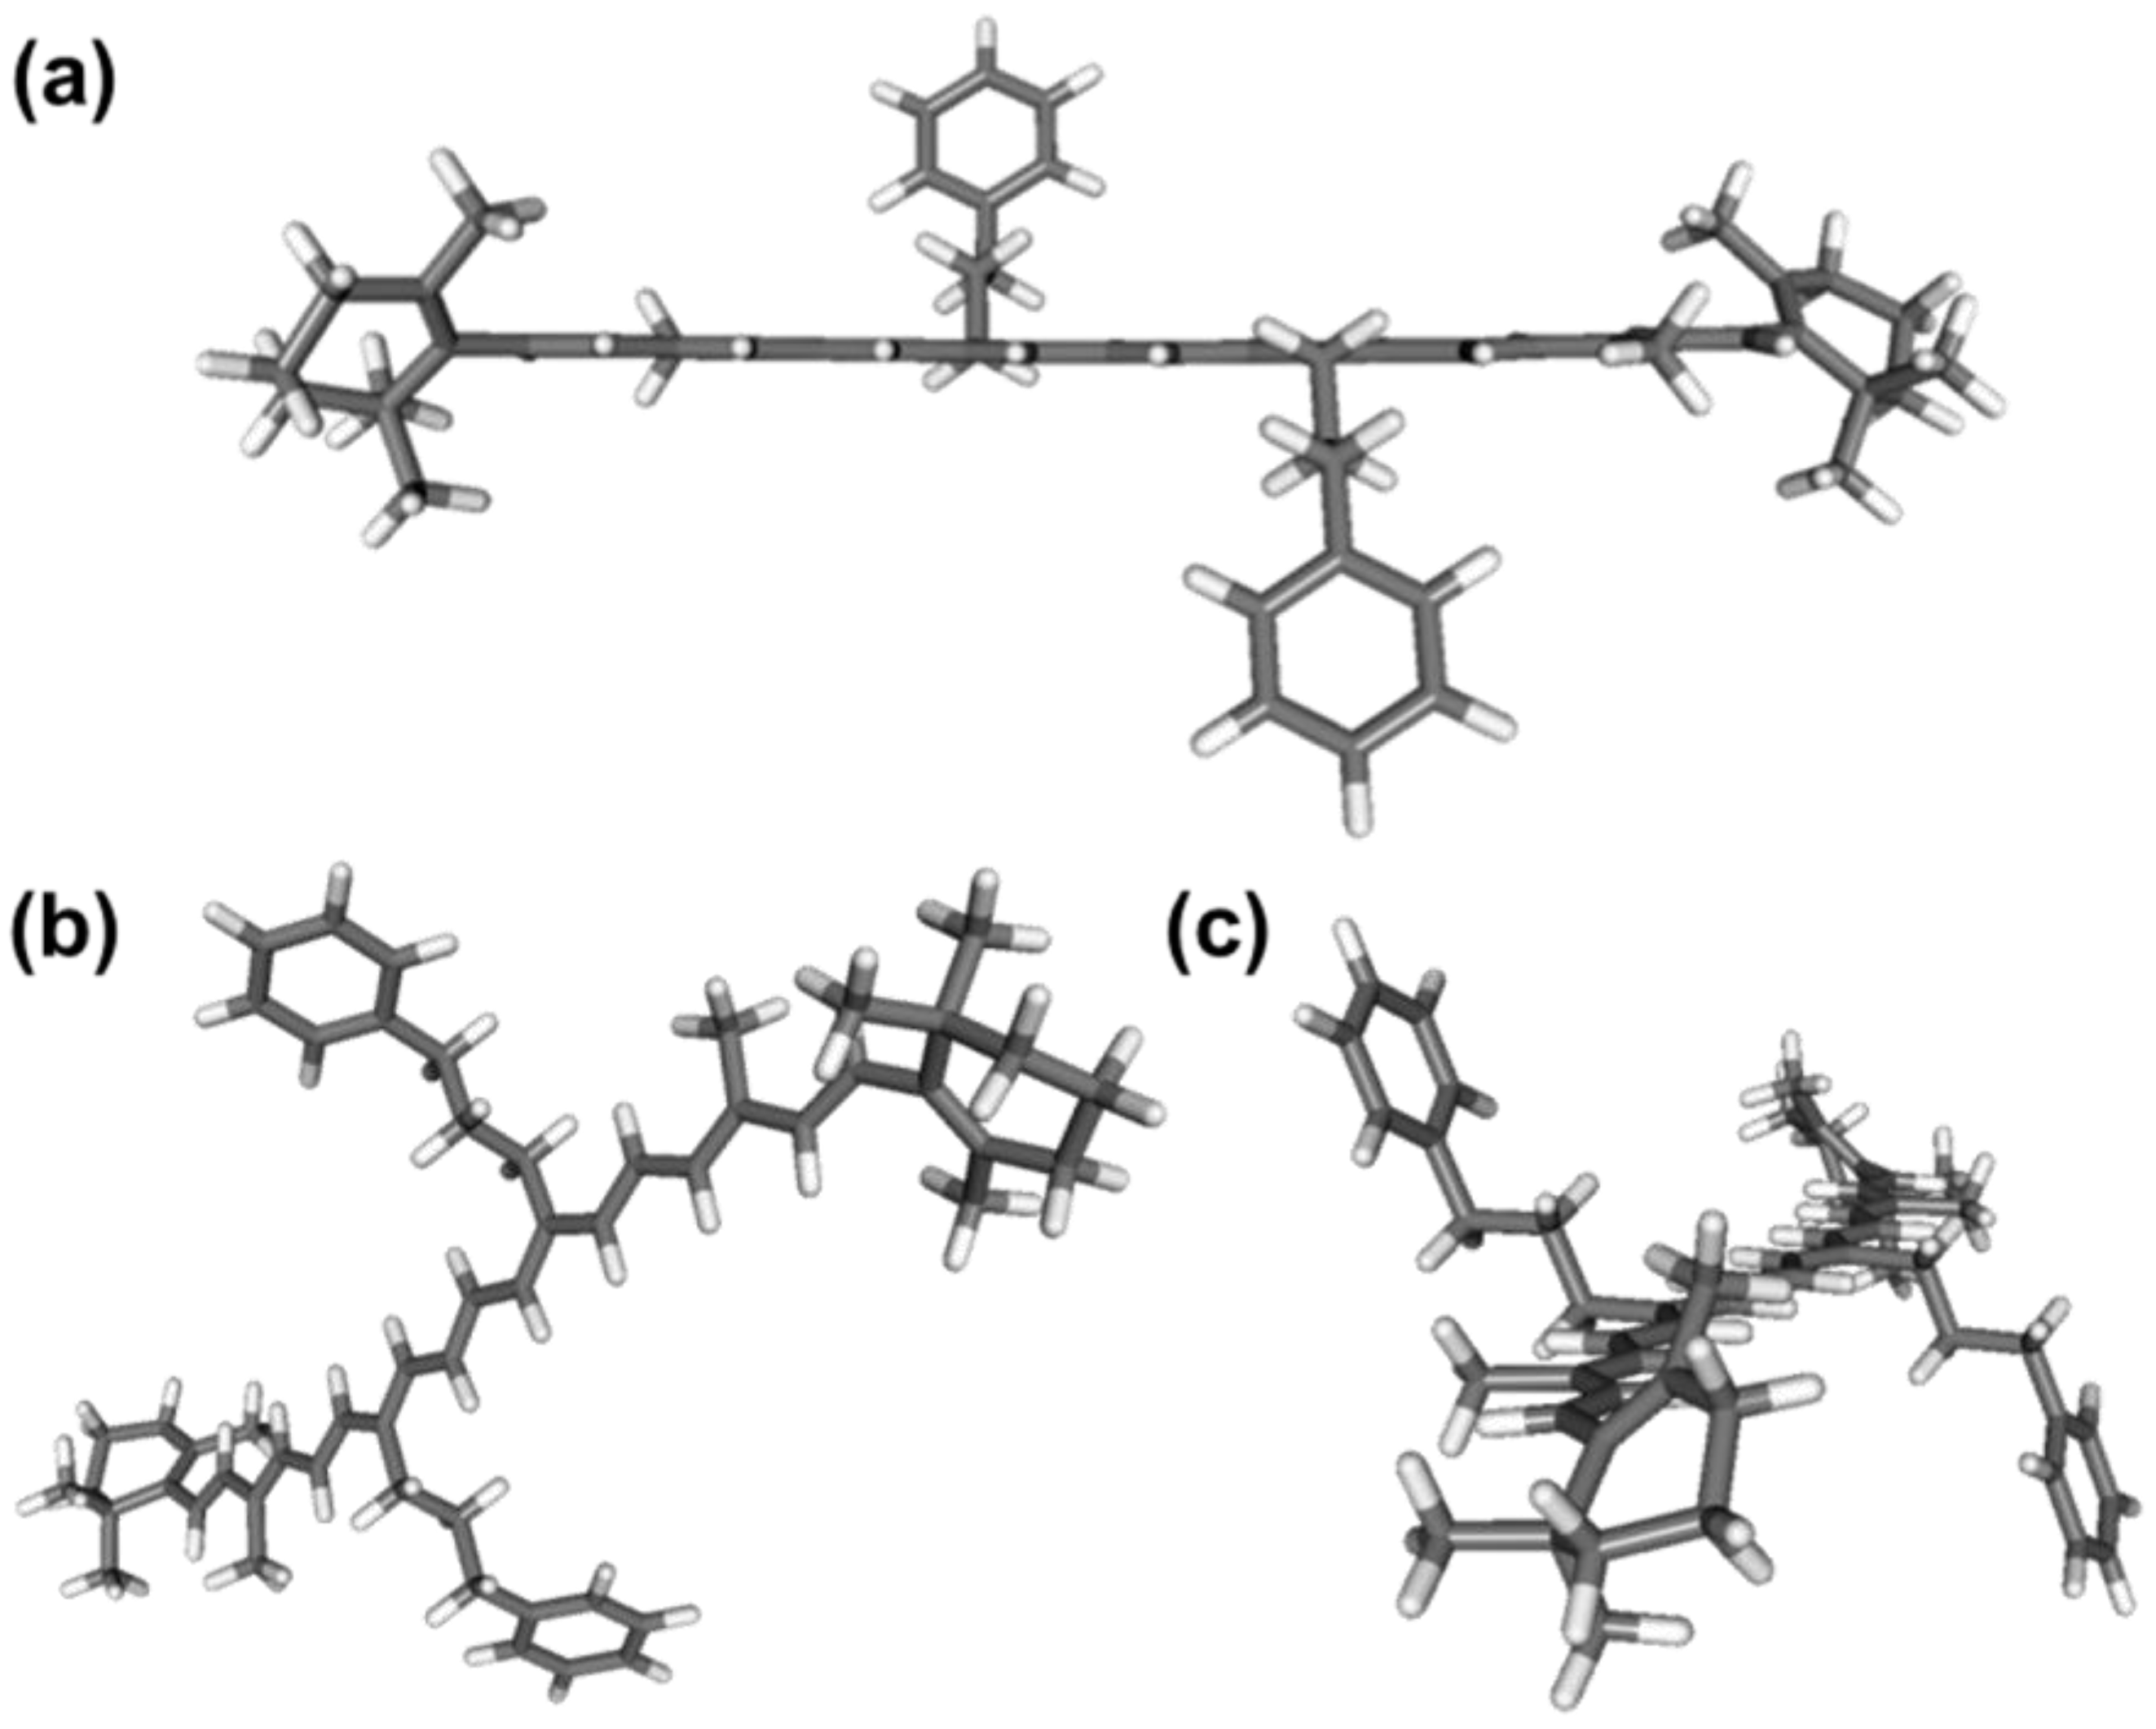
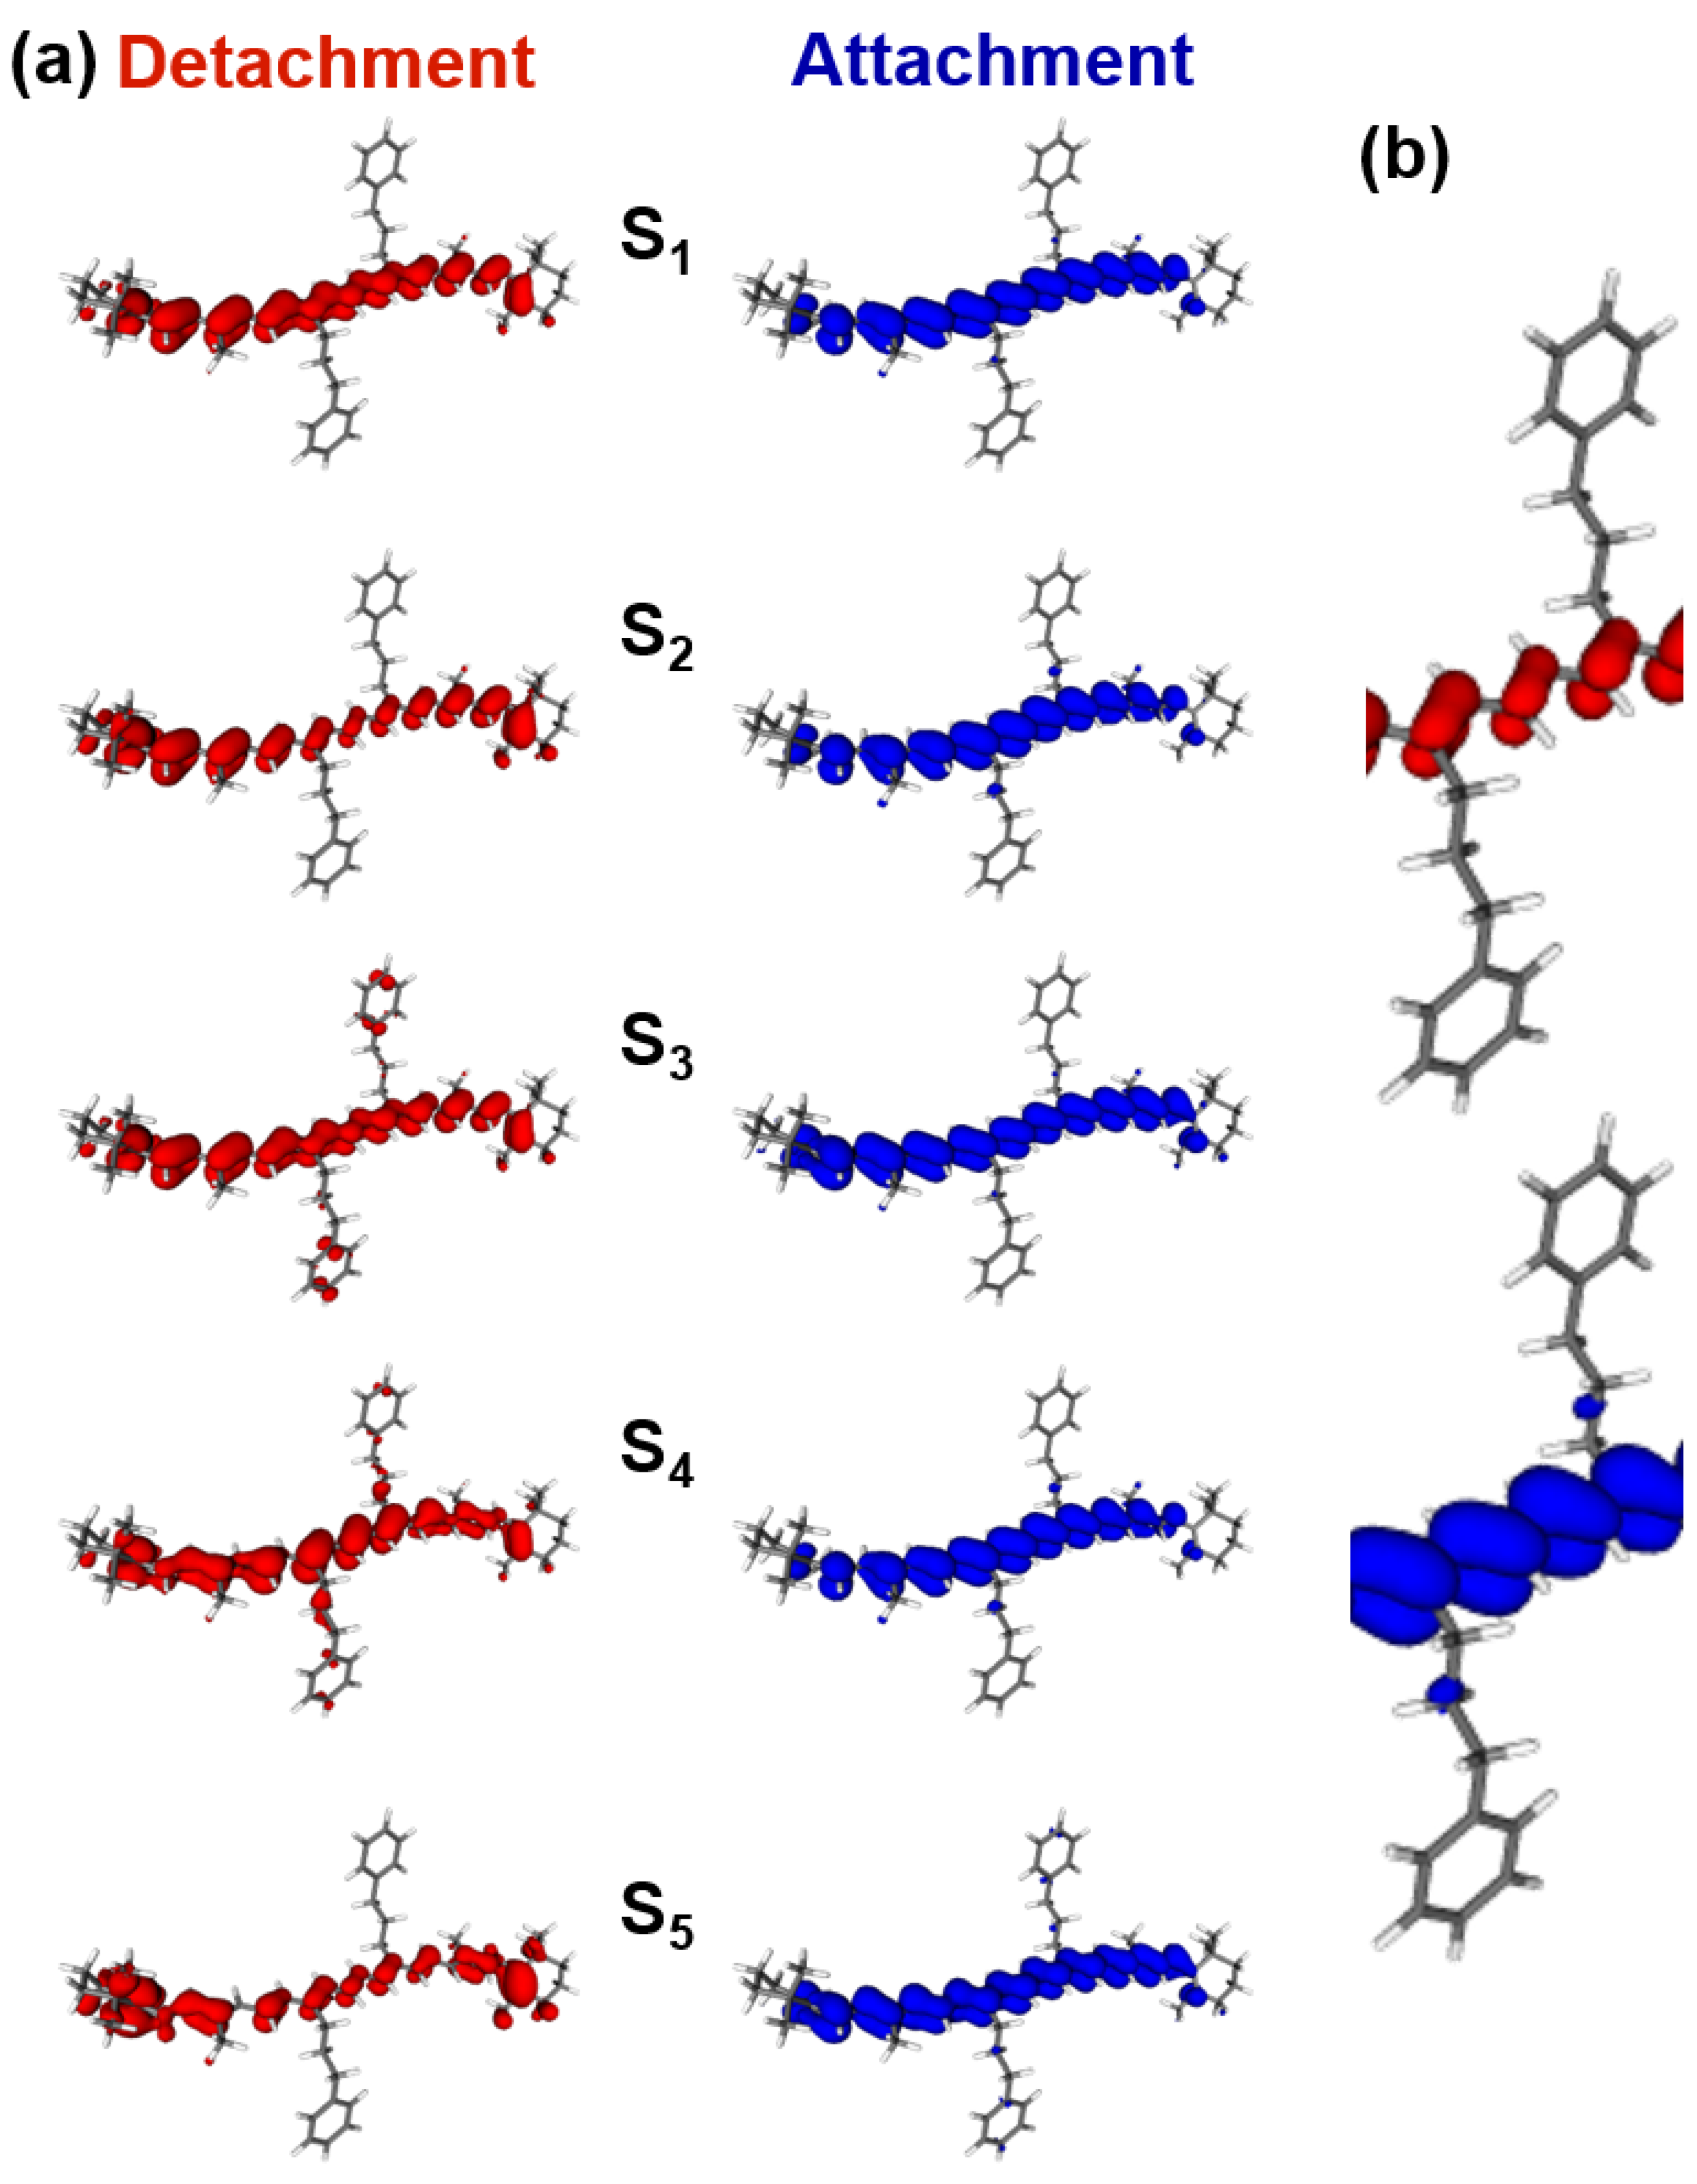
2.3. DFT/TDDFT Calculations

In the following, we present the results of DFT/TDDFT calculations for compound 1, which serve to further interpret our experimental results from steady-state and transient absorption spectroscopy and will be compared with the results of previous studies of compounds 2 and 3 [11,17].
We start with the calculated S0 ground-state minimum energy structure of 1, which is shown in Figure 8 from three different perspectives. The propyl chain of the substituents in the 13 and 13′ positions is arranged in a staggered configuration, and the plane containing the carbon atoms of the propyl chain is perpendicular to the plane of the polyene chain. In this way, steric repulsion between the phenylpropyl substituents and the atoms in the polyene system is minimized. This arrangement of the phenylpropyl units does not noticeably affect the planarization of the polyene chain, cf. panel a. The two β-ionone rings of compound 1 at the two ends of the polyene system are arranged in an s-cis orientation with a dihedral angle (5-6-7-8, cf. Figure 1) of 45.0°. This value is similar to the values found for compounds 2 and 3, where angles of 45.9° and 46.6°, respectively, were reported [11,17]. The structures shown are for a temperature of 0 K and vacuum conditions. At a temperature of 296 K in our solution experiments, internal rotations within the phenylpropyl substituents could result in π-stacking interactions of the phenyl groups and the conjugated polyene systems, as indicated by a very recent study by Koo and co-workers [16]. However, the steady-state and transient absorption spectra of Figure 2, Figure 3 and Figure 5 resemble those of compound 3 [17] more closely than those of compound 2 [11], indicating only weak electronic interactions between the phenyl rings and the polyene π-system. This suggests that the dominant conformers in the solution are structurally not too far away from that shown in Figure 8.
Additional information regarding the electronic interactions between the phenyl rings and the polyene π-system for the most stable structure can be obtained from TDDFT calculations for the excited states of compound 1. Panel a of Figure 9 shows an analysis of the detachment densities (red) and attachment densities (blue) of the first five singlet electronic transitions for the BLYP functional and the 6-31+G(d) basis set. A listing of the transition energies and oscillator strengths calculated using the B3LYP, BLYP and SVWN functionals can be found in Table 2. The detachment–attachment electron density plots [26] suggest that for all of the excited states, electron density is mainly rearranged within the polyene π-system, influencing the bond-alternation pattern as previously observed for xanthophyll carotenoids [27]. In addition, the phenyl rings are electronically decoupled from the polyene system with the propyl chain acting as a spacer. Both aspects are highlighted for the S0→S2 transition in panel b of Figure 9. This “spectator role” of the phenyl rings is in contrast to our previous study of compound 2, where it was found that a small amount of electron density is transferred to the two phenyl rings for the transitions to S1 up to S4, with a more pronounced involvement of the two phenyls starting from S5. In that case, the phenyl rings are oriented at an angle of 111° with respect to the plane of the polyene chain and still have some residual electronic overlap, resulting, for example, in broader and less structured peaks in the ESA spectrum of S1 (cf. Figure 6). It is therefore understandable why phenyl substitution via the propyl linker has a much smaller influence on the steady-state and transient absorption spectra, and also on the S2→S1 and S1→S0* IC dynamics.
The more “β-carotene-type” behavior of compound 1 is also clearly seen in Table 2, when one compares the energetic location of the different electronically excited states with those of 13,13′-diphenyl-β-carotene and β-carotene (last two columns). For instance, when averaging the energetic differences of the five electronically excited states considered, one obtains −0.07, −0.04 and −0.04 eV for ΔE(2-1) in the case of the B3LYP, BLYP and SVWN functionals, respectively, whereas the corresponding values for ΔE(3-1) are equal or close to zero (0.00, 0.00 and 0.01 eV, using the same set of functionals). Therefore, regardless of the functional applied, the singlet excited state energies of 13,13′-diphenylpropyl-β-carotene are closer to those of β-carotene, indicating a similar effective conjugation length. Regarding the energetic order of the excited states, we observe the typical switching in the ordering of the S1 and S2 excited singlet states from the B3LYP to the BLYP and SVWN functionals [11], where the latter two correctly describe the experimentally determined energetic order (S1 (dark) and S2 (bright)), as indicated by the calculated oscillator strengths f in Table 2. The experimentally observed 0–0 transition energy of 1 in n-hexane (2.55 eV, corresponding to a wavelength of 486 nm, for the 0–0 peak of the S0→S2 transition in Figure 2) can be extrapolated to vacuum conditions by adding a value of 0.27 eV, based on the results of Golibrzuch et al. for compounds 2 and 3 in n-hexane [11]. This procedure provides a value for the same transition in a vacuum of 2.82 eV (corresponding to a wavelength of 440 nm). This transition energy is consistently higher than the results from the TDDFT calculations in Table 2, and this might be a result of the general shortcoming of the TDDFT method, which only accounts for singly excited configurations, whereas polyene systems are known to possess substantial double excitation character [28]. As indicated in Table 2, there are also substantial shifts of the state energies depending on the functional employed.

3. Materials and Methods

3.1. Synthesis of the Carotenoid and Sample Treatment

Compound 1 was prepared as described earlier [16], following a double elimination strategy, which was previously already employed for the synthesis of compound 2 [11]. The solvents n-hexane (Uvasol, ≥99%, Merck, Darmstadt, Germany) and n-hexadecane (anhydrous, Merck, Darmstadt, Germany) had a purity of ≥99%. Solutions of the carotenoids in Suprasil cuvettes of different path lengths were saturated with dry nitrogen for 15 min prior to the spectroscopic measurements.

3.2. Ultrafast Transient Absorption Spectroscopy

Ultrafast UV-Vis transient absorption spectra were recorded at a repetition frequency of 920 Hz using a setup for pump–supercontinuum probe (PSCP) spectroscopy reported previously, which is based on a regeneratively amplified titanium:sapphire laser system running at 800 nm (Libra USP-HE, Coherent, Santa Clara, CA, USA) [29]. Pump pulses at 500 nm were produced by a home-built non-collinearly phase-matched optical parametric amplifier (NOPA). Alternatively, pump pulses at 400 nm were obtained by frequency-doubling the fundamental beam of the titanium:sapphire laser. Multifilament supercontinuum probe pulses were generated by focusing the second harmonic (400 nm) into a 2 mm thick CaF2 plate, which was translated in a plane perpendicular to the seed beam. The magic angle of 54.7° between the linearly polarized pump and probe beams was employed to avoid any contributions of orientational relaxation of the carotenoids [30]. The pump and probe beams were delayed by means of a motorized translation stage located in the pump arm and spatially overlapped at an angle of about 10° at the sample cell. Transient spectra in the wavelength range 260–700 nm were detected by a home-built spectrograph using a concave holographic grating and a silicon photodiode array with 512 pixels. An identical spectrograph was employed to record a spectrum of the supercontinuum for single-shot spectral referencing [31]. The typical fluences of the laser pump pulse were in the range of 100–150 μJ cm−2. A volume of 10–15 mL of a carotenoid solution was circulated through a cell with Suprasil windows (path length 400 μm, window thickness 200 μm). The concentration of the carotenoids was about 10−5 M. The time resolution of the setup was about 120 fs. Steady-state absorption spectra of the solutions were recorded using a spectrophotometer (Cary 5000, Varian, Palo Alto, USA).

3.3. Global Kinetic Analysis of the Transient Spectra

Each set of transient absorption spectra was subjected to a global kinetic analysis based on the kinetic scheme shown in Figure 4 using a self-written program package, as described previously [11,17]. The species-associated spectra of the different electronic species S2, S1*, S1 and S0 were each described by a sum of Gaussian functions. During the optimization procedure, which also included convolution with the experimental time resolution, the parameters of the Gaussian functions of the excited state species and their time constants were optimized.

3.4. DFT/TDDFT Calculations

The equilibrium structure of compound 1 in the ground electronic state was optimized using density functional theory (DFT) based on the B3LYP functional [32] and a 6-311G(d,p) basis set. This geometry was then employed in time-dependent density functional theory (TDDFT) calculations [33,34] using the Tamm–Dancoff approximation (TDA) [35] to determine the electronic transition energies and oscillator strengths of the first five excited singlet electronic states of compound 1 at vertical excitation for the functionals BLYP [36], B3LYP and SVWN [37,38] and a 6-31+G(d) basis set. The program Q-Chem 3.0 [39] was used in these calculations.

4. Conclusions

In the current contribution, we obtained a comprehensive picture of the photophysics, ultrafast spectroscopy and electronic structure of 13,13′-diphenylpropyl-β-carotene in n-alkane solutions. The carotenoid displays an ultrafast internal conversion of the initially photoexcited S2 state to the S1 state in the few hundred femtosecond range and a much slower S1→S0 internal conversion of about 8–9 ps. In addition, intramolecular vibrational redistribution in the S1 state on the few hundred femtoseconds to picosecond time scale and cooling of vibrationally hot molecules S0* in the regime of ten picoseconds was revealed. The behavior is quite similar to β-carotene [11], and our DFT/TDDFT calculations for vacuum conditions confirm that there is no significant interaction of the phenyl and polyene π-systems. In contrast, a previous study employing 1H-NMR spectroscopy for a series of 13,13′-diphenylalkyl-β-carotenes in CDCl3 found that the three methylene units in this compound represent the optimum tether length for π–π interactions [16]. This was deduced from the substantial up-field shifts for the protons H−11 and H−15 (cf. Figure 1). It could therefore also be that π-stacking interactions, although present, have only a minor effect on the spectroscopic properties of this carotenoid system. In the future, it would be interesting to explore other carotenoid derivatives with, for instance, conjugated carbonyl substituents attached to different positions at the polyene backbone, to study if they induce ICT character, as observed for carotenoids with terminal carbonyl substitution [22,40].

Author Contributions

Conceptualization, K.O., T.L. and S.K.; methodology, K.O., T.L. and S.K.; software, M.S.; investigation, Y.H.K., O.F., M.S., S.K., K.O. and T.L.; writing—original draft preparation, K.O., T.L. and S.K.; writing—review and editing, K.O., T.L. and S.K.; supervision, K.O., T.L. and S.K. All authors have read and agreed to the published version of the manuscript.

Funding

This research was funded by the National Research Foundation of Korea (NRF) through a grant funded by the Korean government, Ministry of Science and ICT, grant number NRF-2020R1A2C1010724.

Institutional Review Board Statement

Not applicable.

Informed Consent Statement

Not applicable.

Data Availability Statement

Data is contained within the article.

Acknowledgments

Spectra for compounds 2 and 3 in Figure 2 were reproduced from Refs. [11,17] with permission from the PCCP Owner Societies.

Conflicts of Interest

The authors declare no conflict of interest.

Sample Availability

Samples of compound 1 are available from the authors.

References

  1. Frank, H.A.; Young, A.J.; Britton, G.; Cogdell, R.J. The Photochemistry of Carotenoids; Kluwer: Dordrecht, The Netherlands, 1999; Volume 8, p. 399. [Google Scholar]
  2. Polívka, T.; Sundström, V. Ultrafast Dynamics of Carotenoid Excited States—From Solution to Natural and Artificial Systems. Chem. Rev. 2004, 104, 2021–2071. [Google Scholar] [CrossRef] [PubMed]
  3. Frank, H.A.; Cua, A.; Chynwat, V.; Young, A.; Gosztola, D.; Wasielewski, M.R. Photophysics of the carotenoids associated with the xanthophyll cycle in photosynthesis. Photosynth. Res. 1994, 41, 389–395. [Google Scholar] [CrossRef] [PubMed]
  4. Ehlers, F.; Scholz, M.; Lenzer, T.; Oum, K. Excited State Dynamics of Selected All-trans C40 Xanthophyll Carotenoids. Z. Phys. Chem. 2015, 229, 1815–1830. [Google Scholar] [CrossRef]
  5. Scholz, M.; Flender, O.; Lenzer, T.; Oum, K. Ultrafast Excited-State Dynamics of all-trans-Capsanthin in Organic Solvents. J. Phys. Chem. A 2017, 121, 8380–8388. [Google Scholar] [CrossRef]
  6. Niedzwiedzki, D.M.; Chatterjee, N.; Enriquez, M.M.; Kajikawa, T.; Hasegawa, S.; Katsumura, S.; Frank, H.A. Spectroscopic Investigation of Peridinin Analogues Having Different π-Electron Conjugated Chain Lengths: Exploring the Nature of the Intramolecular Charge Transfer State. J. Phys. Chem. B 2009, 113, 13604–13612. [Google Scholar] [CrossRef]
  7. Kosumi, D.; Kajikawa, T.; Okumura, S.; Sugisaki, M.; Sakaguchi, K.; Katsumura, S.; Hashimoto, H. Elucidation and Control of an Intramolecular Charge Transfer Property of Fucoxanthin by a Modification of Its Polyene Chain Length. J. Phys. Chem. Lett. 2014, 5, 792–797. [Google Scholar] [CrossRef]
  8. Ilagan, R.P.; Koscielecki, J.F.; Hiller, R.G.; Sharples, F.P.; Gibson, G.N.; Birge, R.R.; Frank, H.A. Femtosecond Time-Resolved Absorption Spectroscopy of Main-Form and High-Salt Peridinin-Chlorophyll a-Proteins at Low Temperatures. Biochemistry 2006, 45, 14052–14063. [Google Scholar] [CrossRef]
  9. Gelzinis, A.; Butkus, V.; Songaila, E.; Auguli, R.; Gal, A.; Büchel, C.; Robert, B.; Abramavicius, D.; Zigmantas, D.; Valkunas, L. Mapping energy transfer channels in fucoxanthin-chlorophyll protein complex. Biochim. Biophys. Acta 2015, 1847, 241–247. [Google Scholar] [CrossRef]
  10. Macernis, M.; Galzerano, D.; Sulskus, J.; Kish, E.; Kim, Y.-H.; Koo, S.; Valkunas, L.; Robert, B. Resonance Raman Spectra of Carotenoid Molecules: Influence of Methyl Substitutions. J. Phys. Chem. A 2015, 119, 56–66. [Google Scholar] [CrossRef]
  11. Golibrzuch, K.; Ehlers, F.; Scholz, M.; Oswald, R.; Lenzer, T.; Oum, K.; Kim, H.; Koo, S. Ultrafast excited state dynamics and spectroscopy of 13,13’-diphenyl-β-carotene. Phys. Chem. Chem. Phys. 2011, 13, 6340–6351. [Google Scholar] [CrossRef]
  12. Maeng, J.; Kim, S.B.; Lee, N.J.; Choi, E.; Jung, S.-Y.; Hong, I.; Bae, S.-H.; Oh, J.T.; Lim, B.; Kim, J.W.; et al. Conductance Control in Stabilized Carotenoid Wires. Chem. Eur. J. 2010, 16, 7395–7399. [Google Scholar] [CrossRef]
  13. Zhao, Y.; Lindsay, S.; Jeon, S.; Kim, H.-J.; Su, L.; Lim, B.; Koo, S. Combined Effect of Polar Substituents on the Electronic Flows in the Carotenoid Molecular Wires. Chem. Eur. J. 2013, 19, 10832–10835. [Google Scholar] [CrossRef] [PubMed]
  14. Aragonès, A.C.; Darwish, N.; Im, J.; Lim, B.; Choi, J.; Koo, S.; Díez-Pérez, I. Fine-Tuning of Single-Molecule Conductance by Tweaking Both Electronic Structure and Conformation of Side Substituents. Chem. Eur. J. 2015, 21, 7716–7720. [Google Scholar] [CrossRef] [PubMed]
  15. Lim, B.; Oh, E.-T.; Im, J.; Lee, K.S.; Jung, H.; Kim, M.; Kim, D.; Oh, J.T.; Bae, S.-H.; Chung, W.-J.; et al. Systematic Synthesis of Diphenyl-Substituted Carotenoids as Molecular Wires. Eur. J. Org. Chem. 2017, 6390–6400. [Google Scholar] [CrossRef]
  16. Lim, B.; Kim, Y.-H.; Kim, H.; Park, M.; Yeo, H.; Koo, S. 13,13’-Diphenalkyl β-carotenes as pi-stacking models of chlorophylls and carotenoids in photosynthesis. Bull. Korean Chem. Soc. 2022, 43, 1037–1039. [Google Scholar] [CrossRef]
  17. Lenzer, T.; Ehlers, F.; Scholz, M.; Oswald, R.; Oum, K. Assignment of carotene S* state features to the vibrationally hot ground electronic state. Phys. Chem. Chem. Phys. 2010, 12, 8832–8839. [Google Scholar] [CrossRef]
  18. Andersson, P.O.; Gillbro, T.; Ferguson, L.; Cogdell, R.J. Absorption spectral shifts of carotenoids related to medium polarizability. Photochem. Photobiol. 1991, 54, 353–360. [Google Scholar] [CrossRef]
  19. Chen, Z.; Lee, C.; Lenzer, T.; Oum, K. Solvent Effects on the S0(11Ag) → S2(11Bu+) Transition of β-Carotene, Echinenone, Canthaxanthin, and Astaxanthin in Supercritical CO2 and CF3H. J. Phys. Chem. A 2006, 110, 11291–11297. [Google Scholar] [CrossRef] [PubMed]
  20. Christensen, R.L.; Goyette, M.; Gallagher, L.; Duncan, J.; DeCoster, B.; Lugtenburg, J.; Jansen, F.J.; van der Hoef, I. S1 and S2 States of Apo- and Diapocarotenes. J. Phys. Chem. A 1999, 103, 2399–2407. [Google Scholar] [CrossRef]
  21. Kopczynski, M.; Lenzer, T.; Oum, K.; Seehusen, J.; Seidel, M.T.; Ushakov, V.G. Ultrafast transient lens spectroscopy of various C40 carotenoids: Lycopene, β-carotene, (3R,3’R)-zeaxanthin, (3R,3’R,6’R)-lutein, echinenone, canthaxanthin, and astaxanthin. Phys. Chem. Chem. Phys. 2005, 7, 2793–2803. [Google Scholar] [CrossRef]
  22. Ehlers, F.; Scholz, M.; Schimpfhauser, J.; Bienert, J.; Oum, K.; Lenzer, T. Collisional relaxation of apocarotenals: Identifying the S* state with vibrationally excited molecules in the ground electronic state S0*. Phys. Chem. Chem. Phys. 2015, 17, 10478–10488. [Google Scholar] [CrossRef] [PubMed]
  23. Andersson, P.O.; Gillbro, T. Photophysics and dynamics of the lowest excited singlet state in long substituted polyenes with implications to the very long-chain limit. J. Chem. Phys. 1995, 103, 2509–2519. [Google Scholar] [CrossRef]
  24. Corsetti, S.; Rabl, T.; McGloin, D.; Kiefer, J. Intermediate phases during solid to liquid transitions in long-chain n-alkanes. Phys. Chem. Chem. Phys. 2017, 19, 13941–13950. [Google Scholar] [CrossRef]
  25. Kovalenko, S.A.; Dobryakov, A.L.; Ruthmann, J.; Ernsting, N.P. Femtosecond spectroscopy of condensed phases with chirped supercontinuum probing. Phys. Rev. A 1999, 59, 2369–2384. [Google Scholar] [CrossRef]
  26. Head-Gordon, M.; Grana, A.M.; Maurice, D.; White, C.A. Analysis of Electronic Transitions as the Difference of Electron Attachment and Detachment Densities. J. Phys. Chem. 1995, 99, 14261–14270. [Google Scholar] [CrossRef]
  27. Dreuw, A. Influence of Geometry Relaxation on the Energies of the S1 and S2 States of Violaxanthin, Zeaxanthin, and Lutein. J. Phys. Chem. A 2006, 110, 4592–4599. [Google Scholar] [CrossRef]
  28. Starcke, J.H.; Wormit, M.; Schirmer, J.; Dreuw, A. How much double excitation character do the lowest excited states of linear polyenes have? Chem. Phys. 2006, 329, 39–49. [Google Scholar] [CrossRef]
  29. Oum, K.; Lenzer, T.; Scholz, M.; Jung, D.Y.; Sul, O.; Cho, B.J.; Lange, J.; Müller, A. Observation of Ultrafast Carrier Dynamics and Phonon Relaxation of Graphene from the Deep-Ultraviolet to the Visible Region. J. Phys. Chem. C 2014, 118, 6454–6461. [Google Scholar] [CrossRef]
  30. Ehlers, F.; Lenzer, T.; Oum, K. Excited-State Dynamics of 12’-Apo-β-caroten-12’-al and 8’-Apo-β-caroten-8’-al in Supercritical CO2, N2O, and CF3H. J. Phys. Chem. B 2008, 112, 16690–16700. [Google Scholar] [CrossRef]
  31. Dobryakov, A.L.; Kovalenko, S.A.; Weigel, A.; Pérez Lustres, J.L.; Lange, J.; Müller, A.; Ernsting, N.P. Femtosecond pump/supercontinuum-probe spectroscopy: Optimized setup and signal analysis for single-shot spectral referencing. Rev. Sci. Instrum. 2010, 81, 113106. [Google Scholar] [CrossRef]
  32. Becke, A.D. Density-functional thermochemistry. III. The role of exact exchange. J. Chem. Phys. 1993, 98, 5648–5652. [Google Scholar] [CrossRef]
  33. Runge, E.; Gross, E.K.U. Density-Functional Theory for Time-Dependent Systems. Phys. Rev. Lett. 1984, 52, 997. [Google Scholar] [CrossRef]
  34. Dreuw, A.; Head-Gordon, M. Single-Reference ab Initio Methods for the Calculation of Excited States of Large Molecules. Chem. Rev. 2005, 105, 4009–4037. [Google Scholar] [CrossRef]
  35. Hirata, S.; Head-Gordon, M. Time-dependent density functional theory within the Tamm–Dancoff approximation. Chem. Phys. Lett. 1999, 314, 291–299. [Google Scholar] [CrossRef]
  36. Becke, A.D. Density-functional exchange-energy approximation with correct asymptotic behavior. Phys. Rev. A 1988, 38, 3098. [Google Scholar] [CrossRef] [PubMed]
  37. Slater, J.C. Quantum Theory of Molecules and Solids, Vol. 4: The Self-Consistent Field for Molecules and Solids, 1st ed.; McGraw-Hill: New York, NY, USA, 1974. [Google Scholar]
  38. Vosko, S.H.; Wilk, L.; Nusair, M. Accurate spin-dependent electron liquid correlation energies for local spin density calculations: A critical analysis. Can. J. Phys. 1980, 58, 1200–1211. [Google Scholar] [CrossRef]
  39. Shao, Y.; Gan, Z.; Epifanovsky, E.; Gilbert, A.T.B.; Wormit, M.; Kussmann, J.; Lange, A.W.; Behn, A.; Deng, J.; Feng, X. Advances in molecular quantum chemistry contained in the Q-Chem 4 program package. Mol. Phys. 2015, 113, 184–215. [Google Scholar] [CrossRef]
  40. Wild, D.A.; Winkler, K.; Stalke, S.; Oum, K.; Lenzer, T. Extremely strong solvent dependence of the S1 → S0 internal conversion lifetime of 12’-apo-β-caroten-12’-al. Phys. Chem. Chem. Phys. 2006, 8, 2499–2505. [Google Scholar] [CrossRef] [PubMed]
Figure 1. Structural formulae of 13,13′-diphenylalkyl-β-carotenes. Compound 1: 13,13′-diphenylpropyl-β-carotene (n = 3). Compound 2: 13,13′-diphenyl-β-carotene (n = 0). Compound 3: β-carotene (methyl groups in the positions 13 and 13′ instead of the two phenylalkyl substituents).
Molecules 28 03505 g001
Figure 2. Steady-state absorption spectra of compound 1 in n-hexane (red solid line) and n-hexadecane (black dashed line) and of compounds 2 and 3 in n-hexane (green and blue solid lines, respectively). (a) Complete spectra for the spectral range 235–670 nm. (b) Magnification for the wavelength range 410–520 nm. The spectra of compounds 2 and 3 were reproduced from Refs. [11,17] with permission from the PCCP Owner Societies.
Molecules 28 03505 g002
Figure 3. Ultrafast transient absorption experiments of compound 1 in n-hexane. (a) Contour plot of the experimental transient absorption spectra (note the logarithmic time axis). (bd) Selected transient spectra at the pump–probe time delays indicated, covering times up to 0.1 ps, 1.5 ps and 30 ps, respectively. The inverted steady-state absorption spectrum is shown as a magenta dotted line. (e,f) Selected kinetics covering time scales up to 2 ps and 45 ps, respectively, for the four probe wavelengths indicated. (g) Contour plot of the results from the global kinetic analysis using the kinetic scheme of Figure 4. (h) Species-associated spectra for the electronic species involved (S2: green, S1*: red, S1: blue, and S0: black). (i,j) Simulation of the transient absorption spectra (open circles) at 0.3 and 2 ps, respectively, including the total fit (cyan line) and the individual contributions of the different electronic species (same color coding as in panel h). (k,l) Two representative fits (cyan lines) of the experimental kinetics (open circles) at 450 and 560 nm, respectively, and the individual contributions of the different electronic species (same color coding as in panel h).
Molecules 28 03505 g003
Figure 4. Kinetic scheme used for modeling the decay of compound 1 after photoexcitation.
Molecules 28 03505 g004
Figure 5. Same as in Figure 3, but for the solvent n-hexadecane.
Molecules 28 03505 g005
Figure 6. Zoom-in of the S1→Sn ESA band of compounds 1 (red), 2 (green) and 3 (blue) at a pump–probe delay time of 1.5 ps. Each transient spectrum was normalized at the same amplitude of the S0→S2 GSB (not shown).
Molecules 28 03505 g006
Figure 7. (a) Transient absorption spectrum of compound 1 in n-hexadecane averaged over the time range 30–40 ps (black) compared with the inverted S0→Sn steady-state absorption spectrum (magenta). Pump wavelength: 500 nm, pump beam power: 0.3 mW. (b) Same as in panel a, but excited at a pump wavelength of 400 nm (pump beam power: 1.3 mW). Here, transient spectra are averaged over the time ranges 30–40 ps (black) and 50–70 ps (green).
Molecules 28 03505 g007
Figure 8. Three different views (ac) of the molecular structure of compound 1 from DFT calculations at the B3LYP/6-311G(d,p) level of theory.
Molecules 28 03505 g008
Figure 9. (a) Detachment electronic density (red) and attachment electron density (blue) for the five lowest excited singlet states of compound 1 from TDDFT/TDA calculations employing the BLYP functional and the 6-31+G(d) basis set. (b) Zoom-in of the detachment and attachment electron densities of the S2 state highlighting the changes in the bond alternation and the “spectator role” of the phenyl rings during the electronic transition.
Molecules 28 03505 g009
Table 1. Time constants obtained from the global kinetic analysis of the ultrafast transient absorption experiments for compound 1 in the solvents n-hexane and n-hexadecane.
Solventτ2 (fs)τIVR,1 (ps)τ1 (ps)
n-Hexane3001.428.3
n-Hexadecane1900.669.5
Table 2. Gas-phase transition energies E, transition wavelengths λ and oscillator strengths f from TDDFT/TDA calculations for the first five excited singlet states of compound 1 using three different functionals and the same 6-31+G(d) basis set. The values ΔE(2-1) and ΔE(3-1) are the differences in energy between the corresponding electronic states of compounds 2 and 3, respectively, and those of compound 1.
StateE (eV)λ (nm)fΔE(2-1) (eV)ΔE(3-1) (eV)
B3LYP/G-31+G(d)
S12.375235.2−0.03+0.02
S22.634720.0−0.040.00
S33.273790.3−0.060.00
S43.443600.0−0.05+0.01
S53.713350.2−0.19−0.02
BLYP/G-31+G(d)
S12.016170.0−0.03−0.01
S22.115874.3−0.020.00
S32.624731.5−0.05+0.01
S42.754500.0+0.01+0.02
S52.904270.5−0.090.00
SVWN/G-31+G(d)
S11.996230.0−0.030.00
S22.095944.1−0.020.00
S32.604781.8−0.04+0.01
S42.694600.00.00+0.03
S52.904290.5−0.10−0.01
Disclaimer/Publisher’s Note: The statements, opinions and data contained in all publications are solely those of the individual author(s) and contributor(s) and not of MDPI and/or the editor(s). MDPI and/or the editor(s) disclaim responsibility for any injury to people or property resulting from any ideas, methods, instructions or products referred to in the content.

