Article

Vanadium-Containing Anionic Chelate for Spectrophotometric Determination of Hydroxyzine Hydrochloride in Pharmaceuticals

by
Gergana Kirilova Kirova
1,
Zdravka Yancheva Velkova
1,
Vassil Borisov Delchev
2 and
Kiril Blazhev Gavazov
1,*
1
Department of Chemical Sciences, Faculty of Pharmacy, Medical University of Plovdiv, 120 Buxton Bros Str., 4004 Plovdiv, Bulgaria
2
Faculty of Chemistry, University of Plovdiv ‘Paisii Hilendarskii’, 24 Tsar Assen St., 4000 Plovdiv, Bulgaria
*
Author to whom correspondence should be addressed.
Molecules 2023, 28(6), 2484; https://doi.org/10.3390/molecules28062484
Submission received: 2 February 2023 / Revised: 3 March 2023 / Accepted: 7 March 2023 / Published: 8 March 2023
(This article belongs to the Special Issue New Insights into the Chemistry of Vanadium)

Abstract

:
Four azo dyes known to form anionic complexes with V(V) were investigated as potential liquid–liquid extraction–spectrophotometric reagents for the antihistamine medication hydroxyzine hydrochloride (HZH). A stable ion-association complex suitable for analytical purposes was obtained with 6-hexyl-4-(2-thiazolylazo)resorcinol (HTAR). The molar absorption coefficient, limit of detection, linear working range, and relative standard deviation in the analysis of real pharmaceutical samples (tablets and syrup) were 3.50 × 10⁴ L mol−1 cm−1, 0.13 μg mL−1, 0.43–12.2 μg mL−1, and ≤2.7%, respectively. After elucidating the molar ratio in the extracted ion-association complex (HZH:V = 1:1), the ground-state equilibrium geometries of the two constituent ions—HZH+ and [VO2(HTAR)]—were optimized at the B3LYP level of theory using 6-311++G** basis functions. The cation and anion were then paired in four different ways to find the most likely structure of the extracted species. In the lowest-energy structure, the VO2 group interacts predominantly with the heterochain of the cation. A hydrogen bond is present (V–O···H–O; 1.714 Å) involving the terminal oxygen of this chain.

Graphical Abstract

1. Introduction

Hydroxyzine hydrochloride (HZH; IUPAC name: 2-[2-[4-[(4-chlorophenyl)-phenylmethyl]piperazin-1-yl]ethoxy]ethanol dihydrochloride; Figure 1a) is a first-generation antihistamine medication (histamine H1 blocker) that interferes with the binding of histamine in capillaries, as well as in bronchial and gastrointestinal smooth muscles. It has antiallergic, antispasmodic, antiemetic, sedative, and anxiolytic properties [1,2,3] and has been widely used in recent years [4], especially in the treatment of tension, anxiety, bronchial asthma, and allergic skin reactions.
Like any drug, HZH should be used judiciously. Drowsiness, dizziness, headache, dry mouth, constipation, and skin rash are common side effects associated with its use. Combinations with alcohol, lithium, and other sedatives, or accidental overdose, can cause hallucinations [5,6]. Because of HZH’s potential to cause more severe specific adverse effects, it is on the NCQA’s list of high-risk medications for the elderly [7].
Analytical methods of varying complexity and cost have been applied to determine HZH. Common examples include thin-layer chromatography [8], high-performance liquid chromatography [9], gas chromatography [10], capillary zone electrophoresis [11], acid–base titration [12], conductometric titration [13], differential pulse anodic voltammetry [14], and spectrophotometry [15,16,17,18,19,20,21].
The principal advantages of UV–vis spectrophotometry are its simplicity, flexibility, universality, and availability in terms of equipment, personnel, and consumables. Table 1 lists recent spectrophotometric procedures for the determination of HZH. The most sensitive one is based on a Cr(III) complex dissolved in acetone [16]. However, it is quite tedious and time-consuming, requiring drying in a vacuum dryer for 6 h.
Here, we report the development of a simple, fast, sensitive, and robust liquid–liquid extraction–spectrophotometric procedure for the determination of HZH in pharmaceuticals. It is based on an anionic complex of 6-hexyl-4-(2-thiazolylazo)resorcinol (HTAR; Figure 1b) with V(V). HTAR is a novel reagent for V(V), Cu(II), and Co(II) [22,23,24]. Like other azo derivatives of resorcinol, it can form an anionic chelate with V(V) in slightly acidic media, [VO2(HTAR2−)], which tends to form chloroform-extractable ion-association complexes with appropriate cations [25].
HZH is a colorless, water-soluble salt that can form mono- or dications, depending on the acidity. Information is available in the literature on both the crystal structure [4] and ionization constants (pKa1 = 1.93 and pKa2 = 7.52) [26]. It is a “spherical-type ion association reagent” according to Tôei’s classification [27], which exists as a monocation (HZH+) in slightly acidic media.
A novelty of the present work is the use of a vanadium complex for the determination of an active cationic component in real pharmaceutical samples. The selected chromophore ligand (HTAR) has a specific action that distinguishes it from other similar ligands in terms of the possibility of forming a stable and extractable ternary ion-association complex with the target cation. The application of quantum chemistry methods to elucidate the structure of the extracted species is another important aspect of this study.

2. Results and Discussion

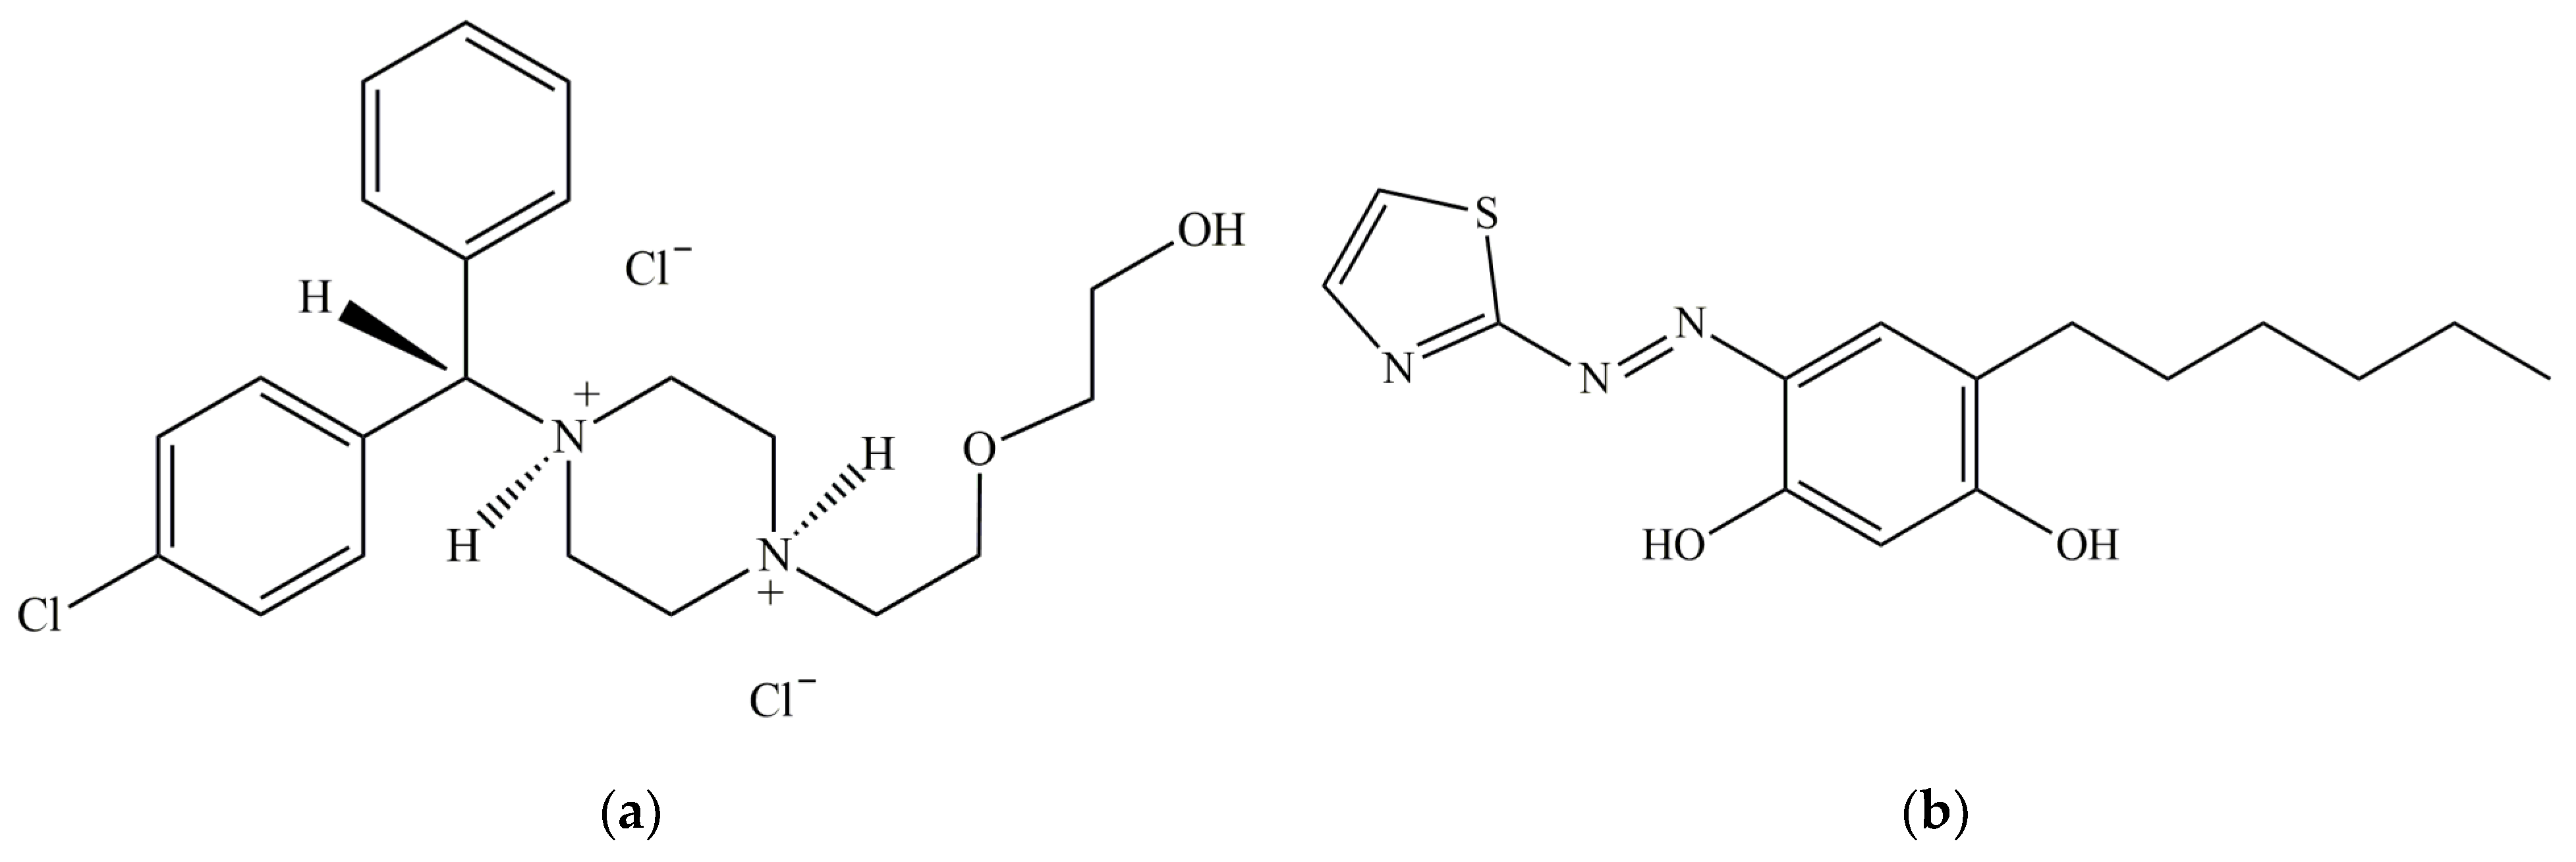
2.1. Choice of Azo Dye

Four azo derivatives of resorcinol (ADR) were studied as part of a liquid–liquid extraction system containing V(V), HZH, and chloroform: 4-(2-pyridylazo)resorcinol (PAR), 4-(2-thiazolylazo)resorcinol (TAR), 4-(2-thiazolylazo)orcinol (TAO), and HTAR. These ARDs are known to form anionic chelates with V(V) in slightly acidic media [25,28,29,30,31,32,33]. It was found in our preliminary experiments that only HTAR was able to form extractable species with V(V) and HZH. The most likely reason for this is the presence of a hydrophobic tail with an appropriate orientation in its molecule (Figure 1b). Therefore, all further studies were conducted with this ADR.
The good extractability of the V(V)–HTAR–HZH ternary complex could be attributed to the effective hydrophobic envelope around the central V(V) ion and other hydrophilic regions. The bulkiness and spatial shape of both the ligand (HTAR) and the cation (HZH+) are essential for this [27,34,35]. Apparently, only the V(V)–HTAR anionic complex possesses the needed structural features favoring its appropriate positioning relative to the cation.

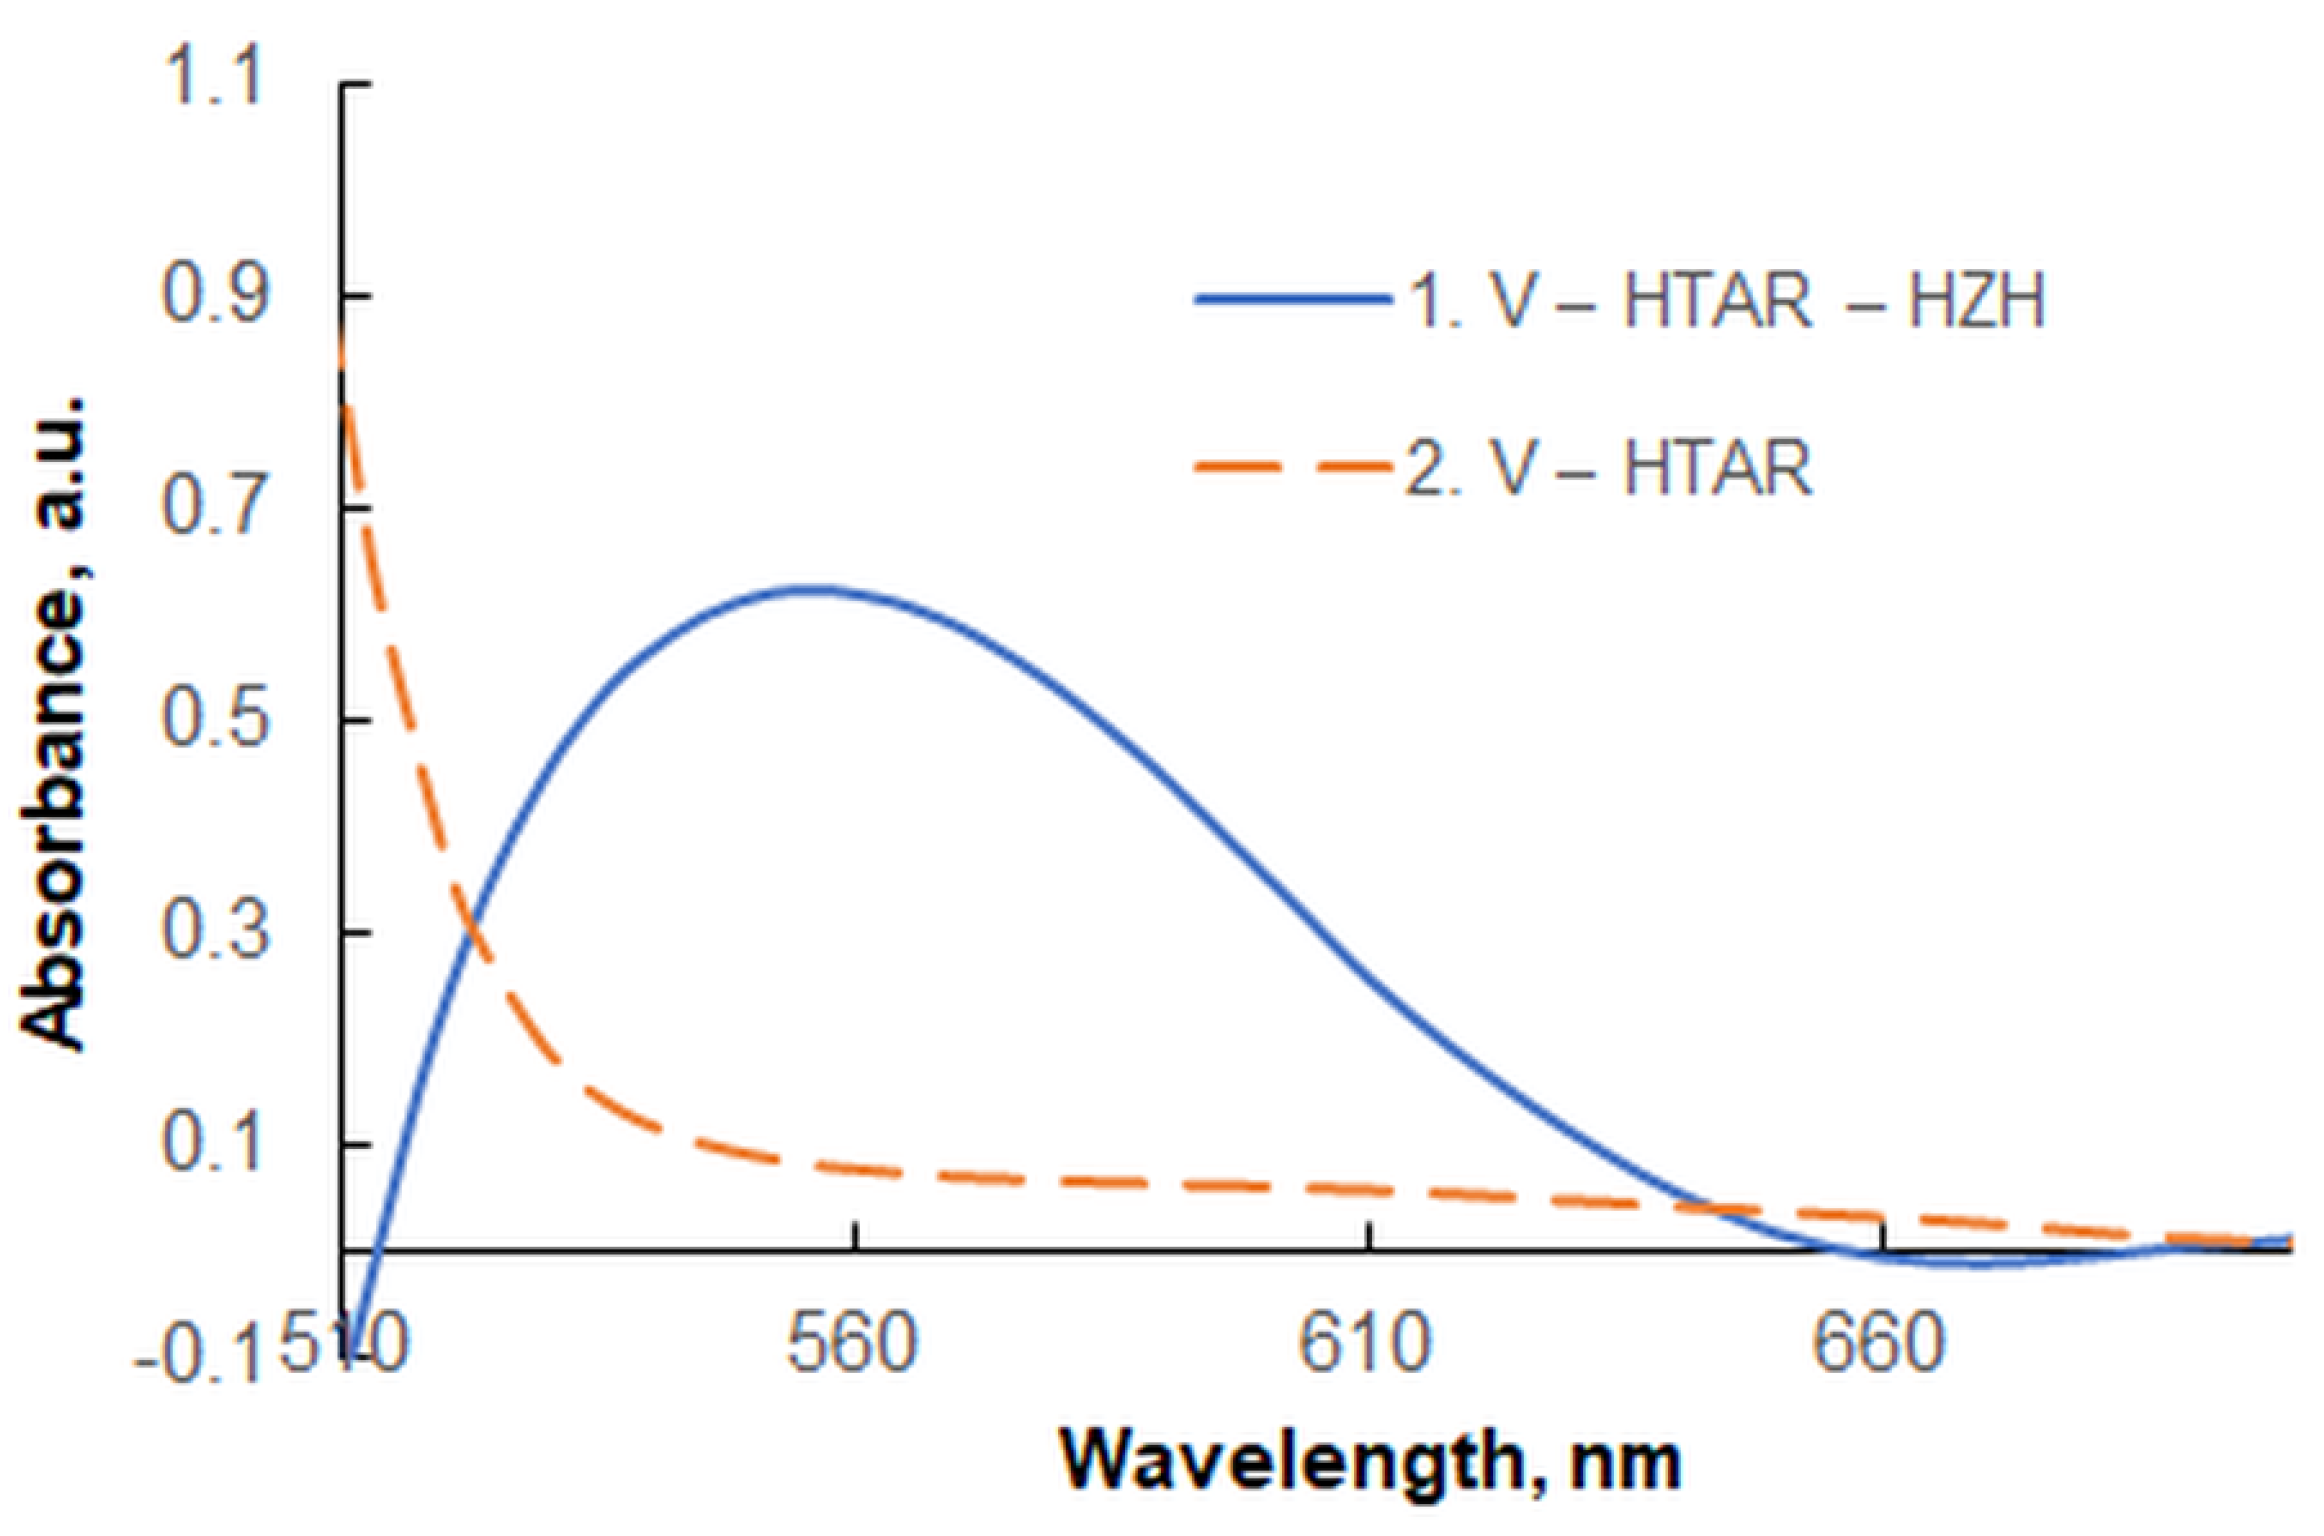
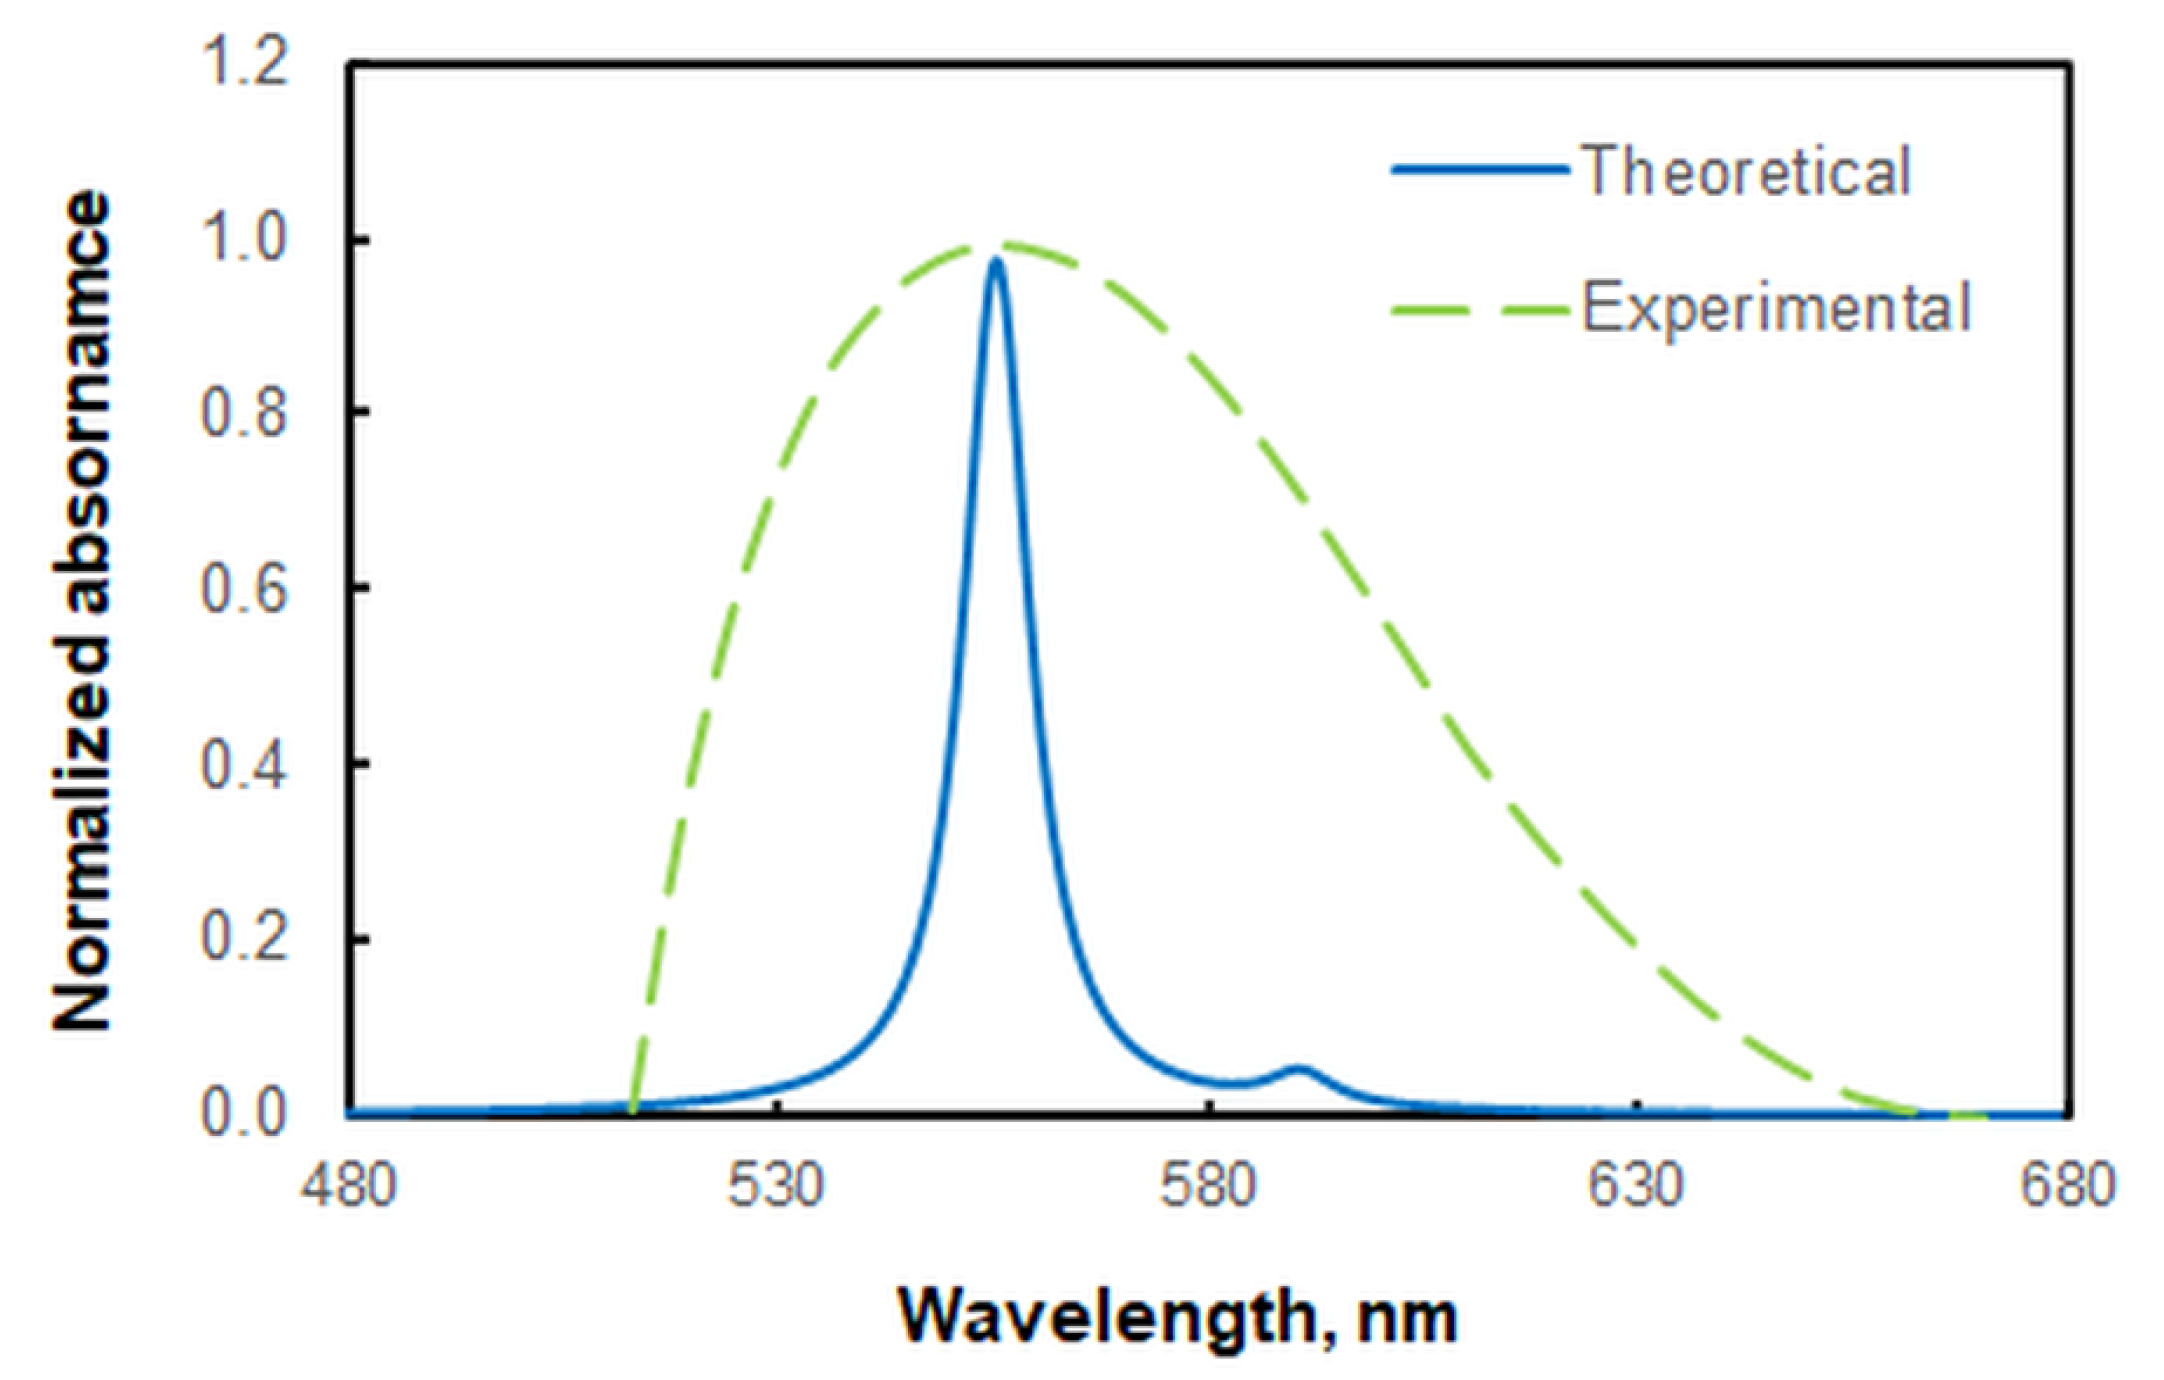
2.2. Absorption Spectrum
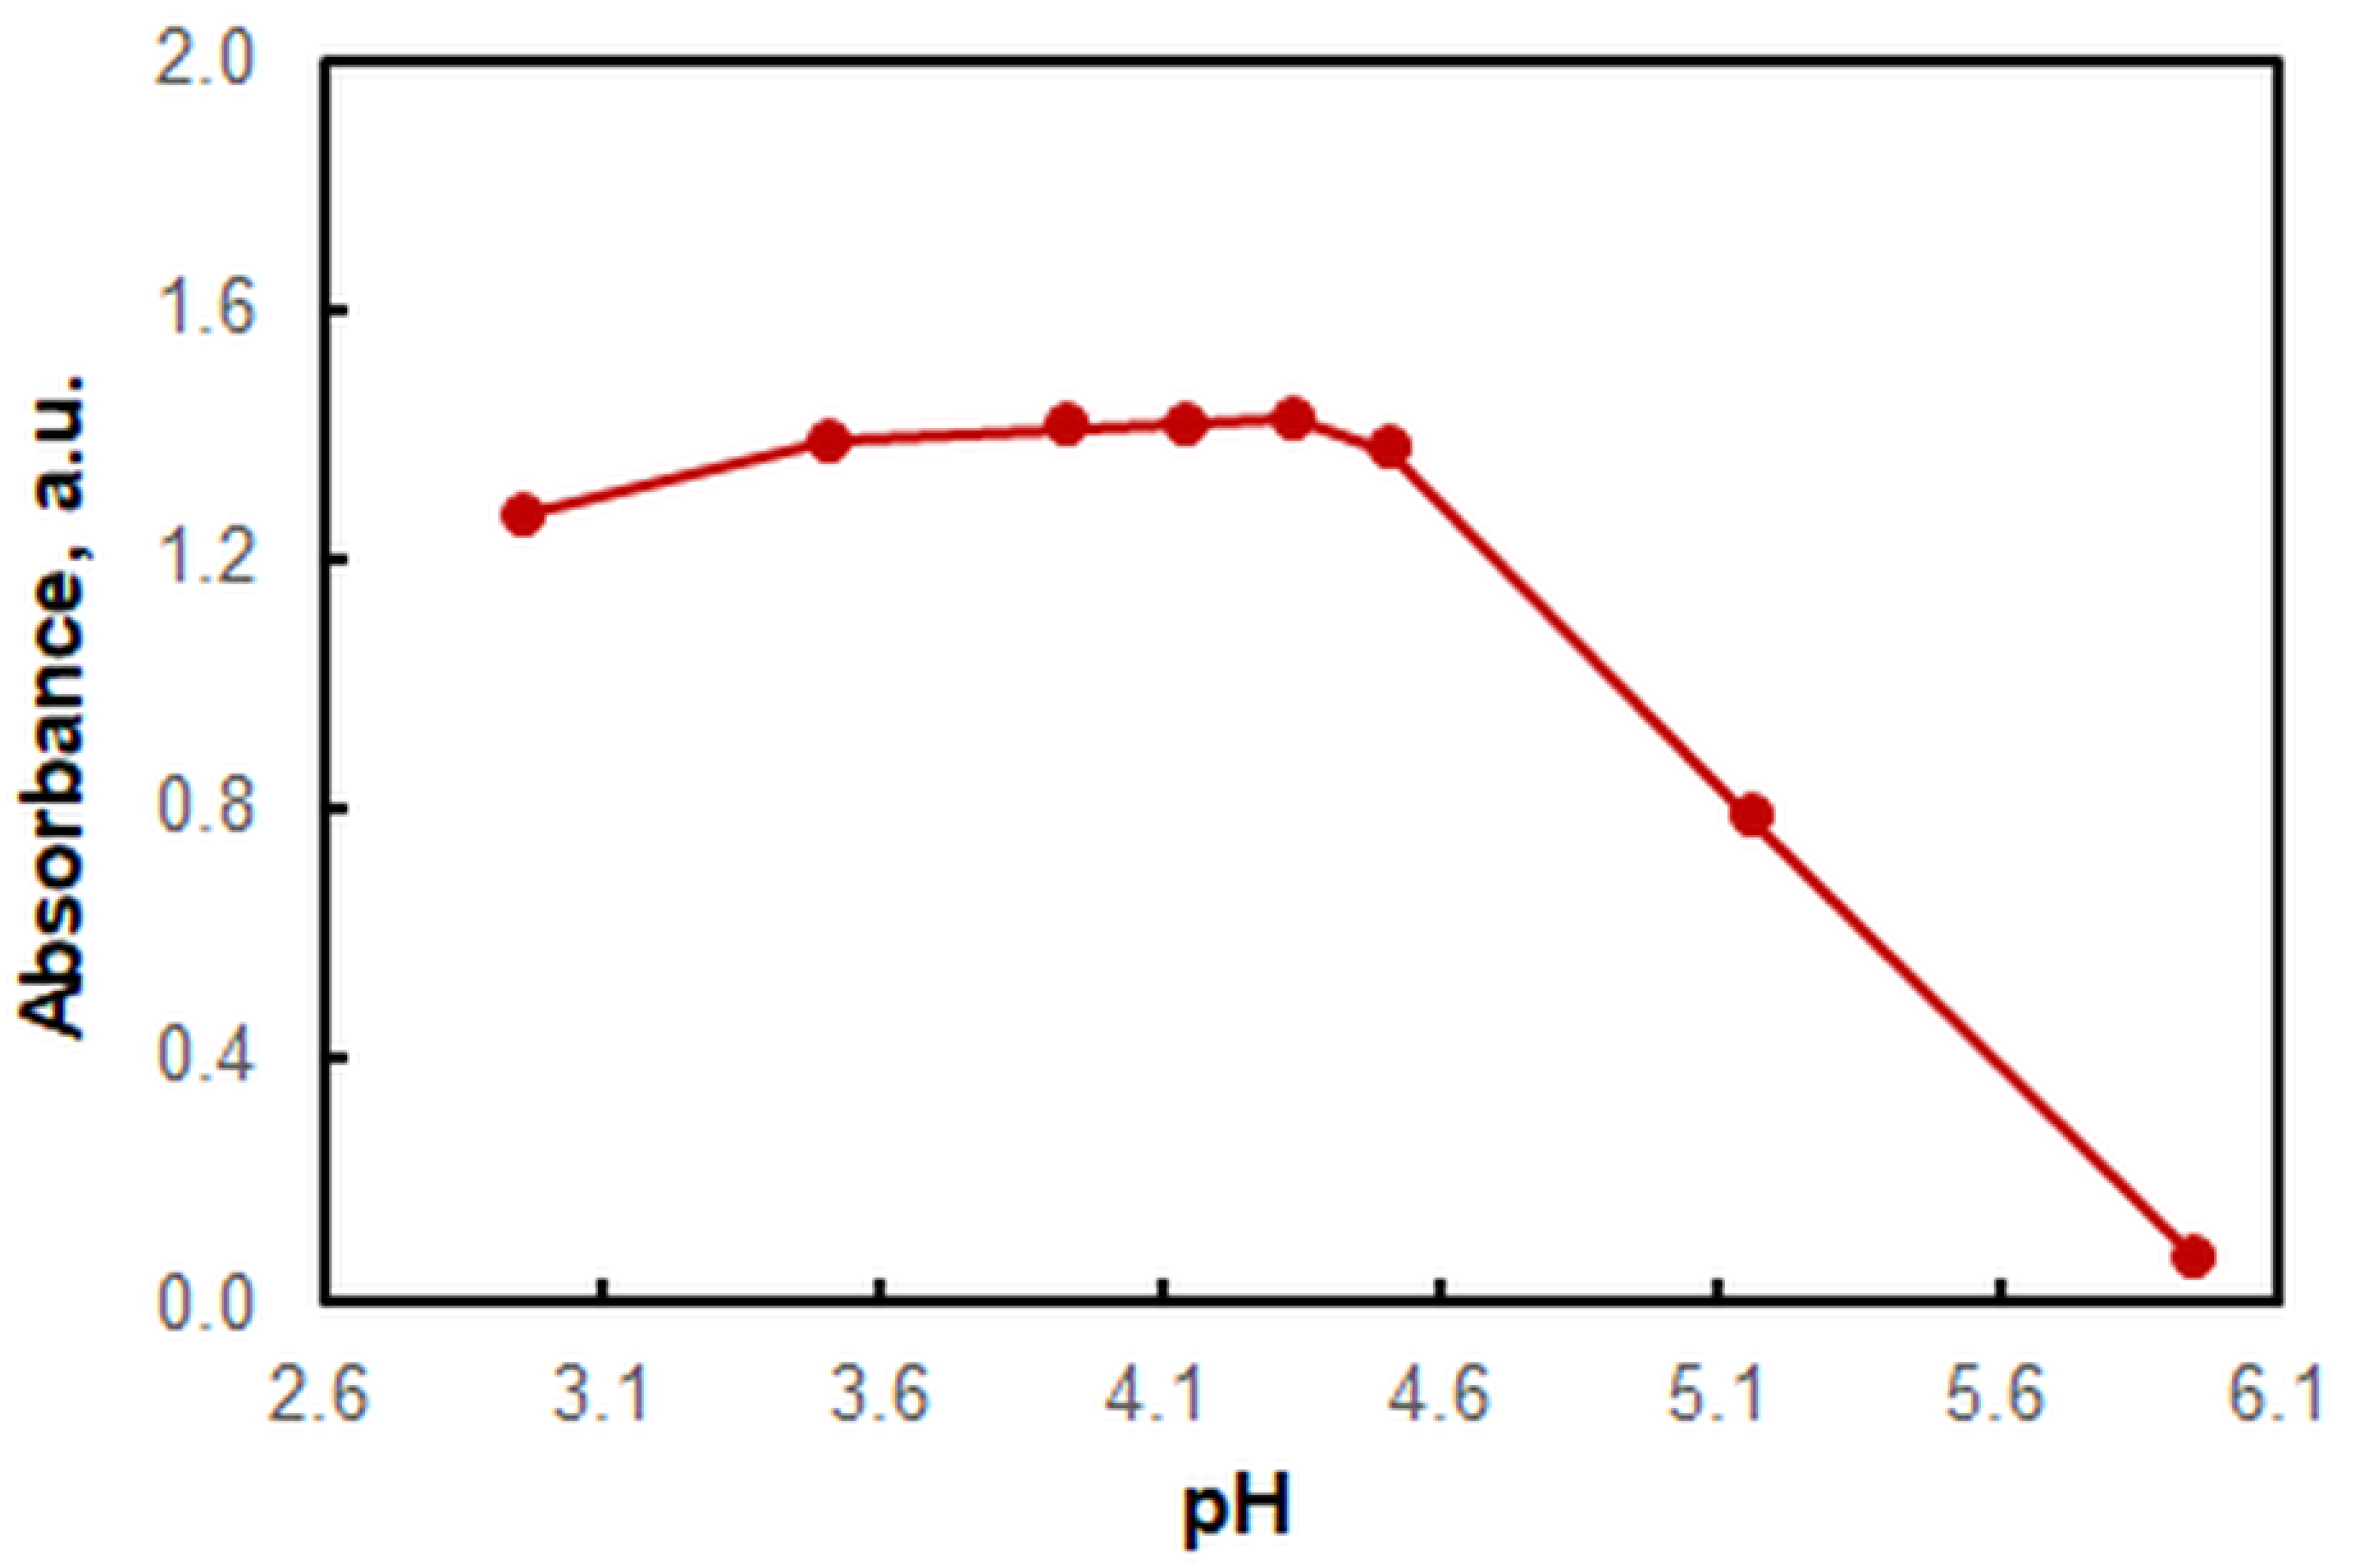
Figure 2 shows the absorption spectrum of the V(V)–HTAR–HZH complex in chloroform, measured against a blank. The absorption maximum is located at 554 nm. Its position coincides with that of a previously studied ion-association complex of [VO2(HTAR)] with a colorless cation derived from xylometazoline hydrochloride (XMZ) [25]. The spectral similarity indicates that the two complexes, V(V)–HTAR–HZH and V(V)–HTAR–XMZ, have the same ion-associative nature and contain the same chromophore anion: [VO2(HTAR)].
It is known that the color properties of the typical ion-association complexes represent a combination of the color properties of the constituent ions [35,36]. This can be used to simulate the visible spectra of extracted ion-association complexes containing colorless cations using theoretical data for the parent anions. Comparison of theoretical and experimental spectra of new complexes of this type is a convenient tool for clarifying their composition, structure, conformation, oxidation state of the central atom, etc. [37,38].

2.3. Effect of pH

The effect of pH on the ion-association formation is shown in Figure 3. The experiments were carried out in the presence of ammonium acetate buffer. The analytical signal was maximal and constant in a relatively wide pH-interval: 3.5–4.5. The optimum pH value was around 4.3. This value falls within the range of maximum buffering capacity (pH 4.75 ± 1) [39] but is far enough from the breakpoint at a pH of 4.5.

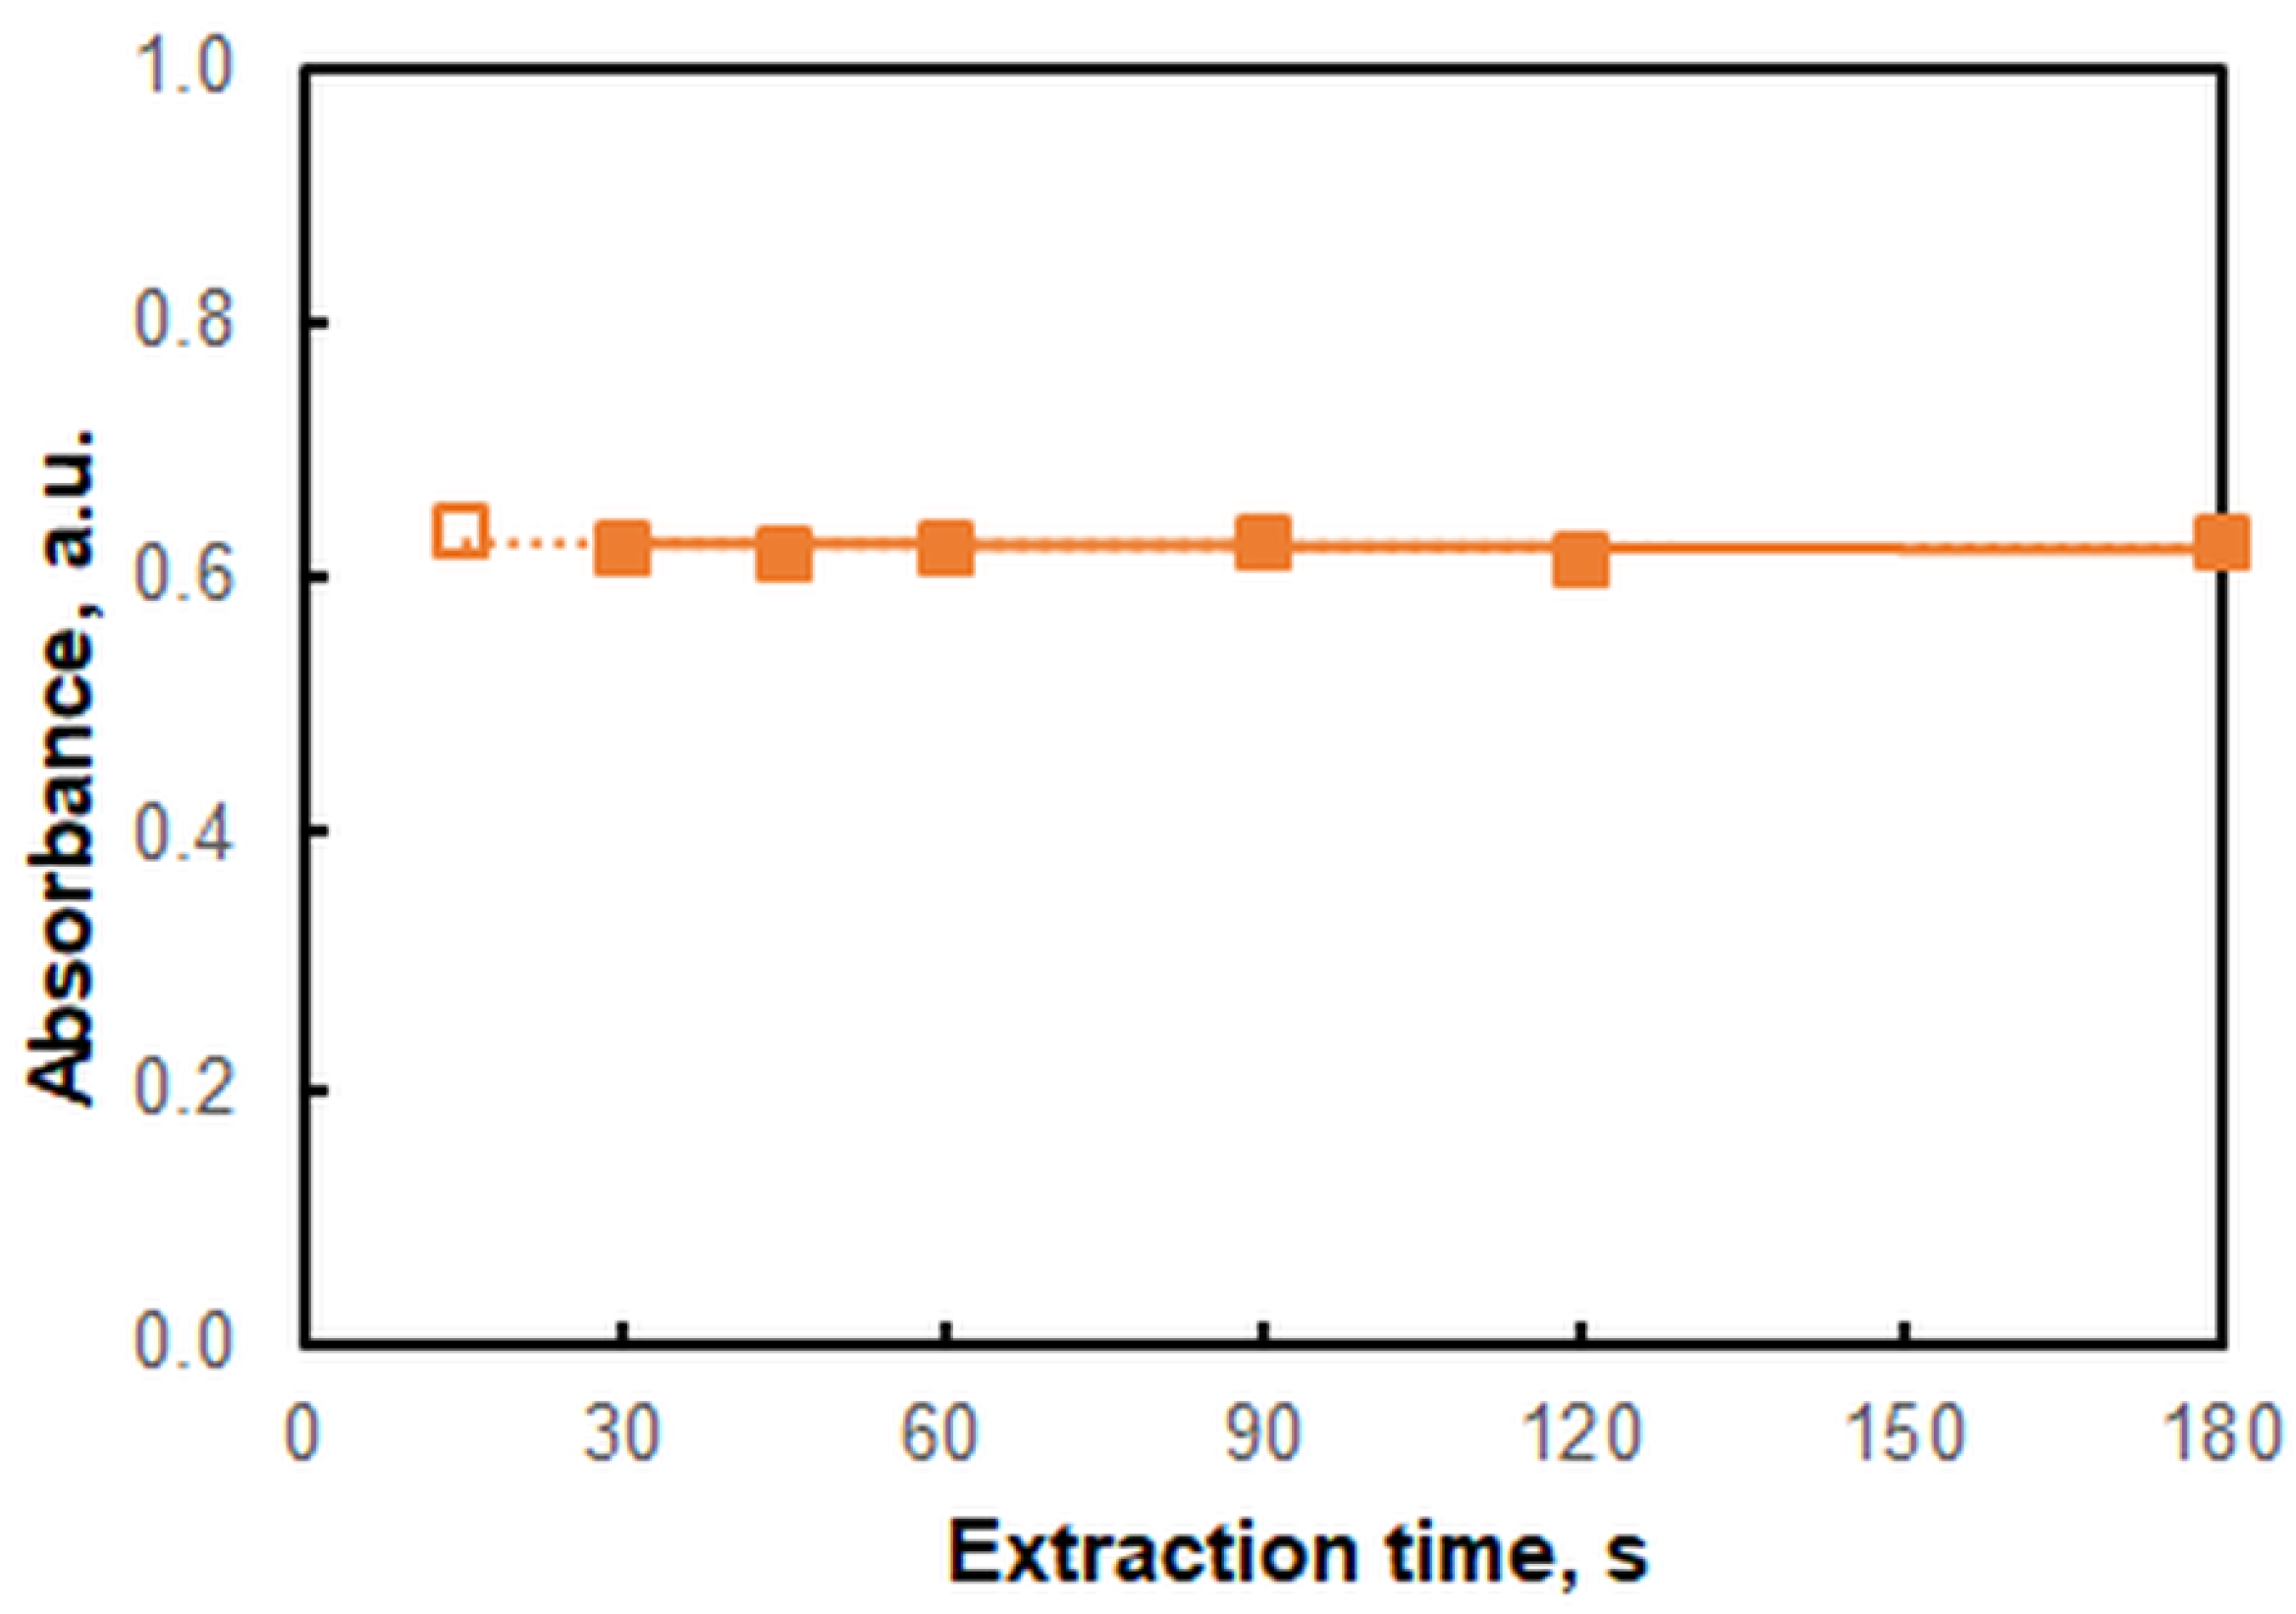
2.4. Effects of Extraction Time

The effect of extraction time was studied in the range of 15 to 180 s (Figure 4). When the extraction time was short (e.g., 15 s) the phases separated slowly. A time of 30 s was sufficient to provide stable absorbance values. For greater reliability and ease of phase separation, we extended the extraction time to 45 s. This period is shorter than that required to extract the ternary V(V)–HTAR–XMZ complex (8 min) [25] and the methyl orange–HZH ion pair (3 min) [15].

2.5. Choice of V(V) and HTAR Concentrations

The concentration of V(V) in the aqueous phase was set to 3 × 10⁻⁵ mol L−1. At a 10-fold molar excess of HTAR, this concentration provided absorbances (at λmax = 554 nm) of no more than 1.6 absorbance units. Three series of experiments were performed at three different HTAR concentrations: 2 × 10⁻⁴ mol L−1, 2.4 × 10⁻⁴ mol L−1, and 3 × 10⁻⁴ mol L−1. The selected optimal value was 2.4 × 10⁻⁴ mol L−1 (eightfold excess). This provided stable results and a wide linear range of the calibration plot (see Section 2.8).
Figure 5 shows two of the obtained saturation curves. The slopes of the linear parts and the obtained correlation coefficients are practically the same. However, the linear range for the eightfold excess of HTAR over V(V) is wider.

2.6. HZH-to-V(V) Molar Ratio, and Formula of the Extracted Complex

The HZH-to-V(V) molar ratio was determined at two HTAR concentrations: 2 × 10⁻⁴ mol L−1 and 3 × 10⁻⁴ mol L−1. The following four methods were used (Figure 6): the molar ratio method [40], the Bent–French method [41], the Asmus method [42], and the mobile equilibrium method [43]. The results strongly indicate that n(V):n(HZH) = 1:1. This ratio matches our prior expectations based on the view that at the optimal pH value V(V) should exist as [VO2(HTAR)] and HZH should exist as HZH+.
Figure 6d shows that the extracted ion-association complex does not dimerize—as do, for example, complexes obtained in systems containing V(V)–TAO [32,33]. Therefore, it can be represented by the formula (HZH+)[VO2(HTAR)].

2.7. Ground-State Equilibrium Geometries of the Ions, Calculated Energies, and Spectral Comparison

The ground-state equilibrium geometries of the two associating ions were found at the B3LYP/6-311++G** level of theory (Figure 7). The vertical excitation energies were then calculated for the anion [VO2(HTAR)] to simulate a theoretical UV–vis absorption spectrum. A good agreement of this spectrum with the experimental spectrum of the extracted ion-association complex was obtained, with a scaling coefficient of 1.17 (Figure 8). The theoretical absorption maxima in the visible region are shown in Table 2. The experimental band is mainly a result of π → π* electron transitions with different oscillator strengths f (0.5214 and 0.0200). The spectroscopically dark 1nπ* excited state has a rather low f value, suggesting its negligible influence. Another reason for the observed asymmetry of the experimental band is the stronger influence of the blank at shorter wavelengths (see Figure 2).

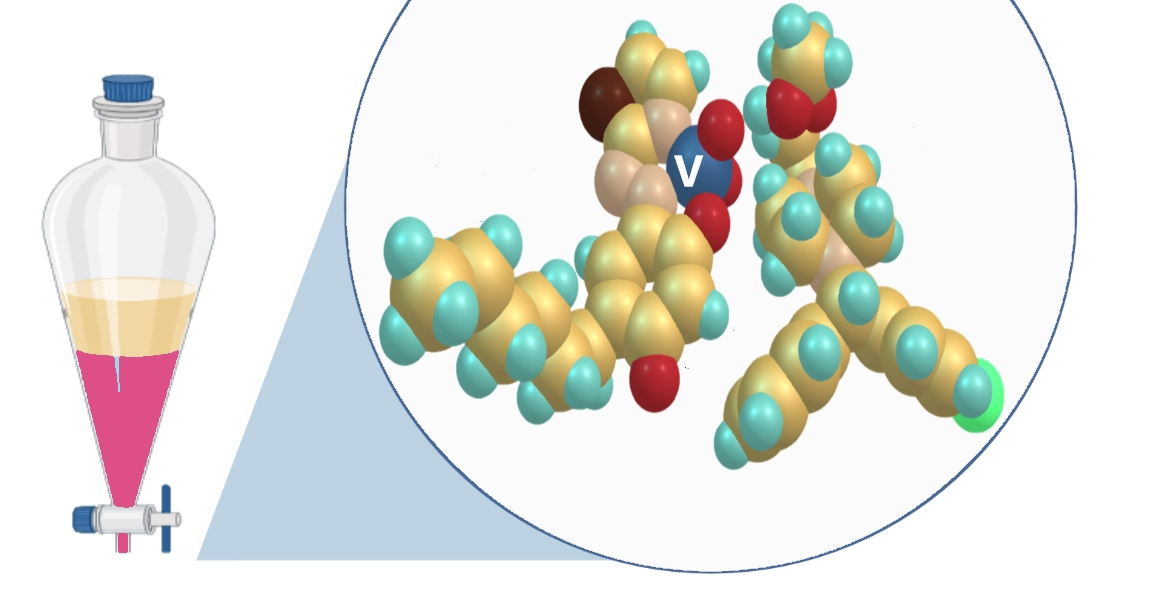
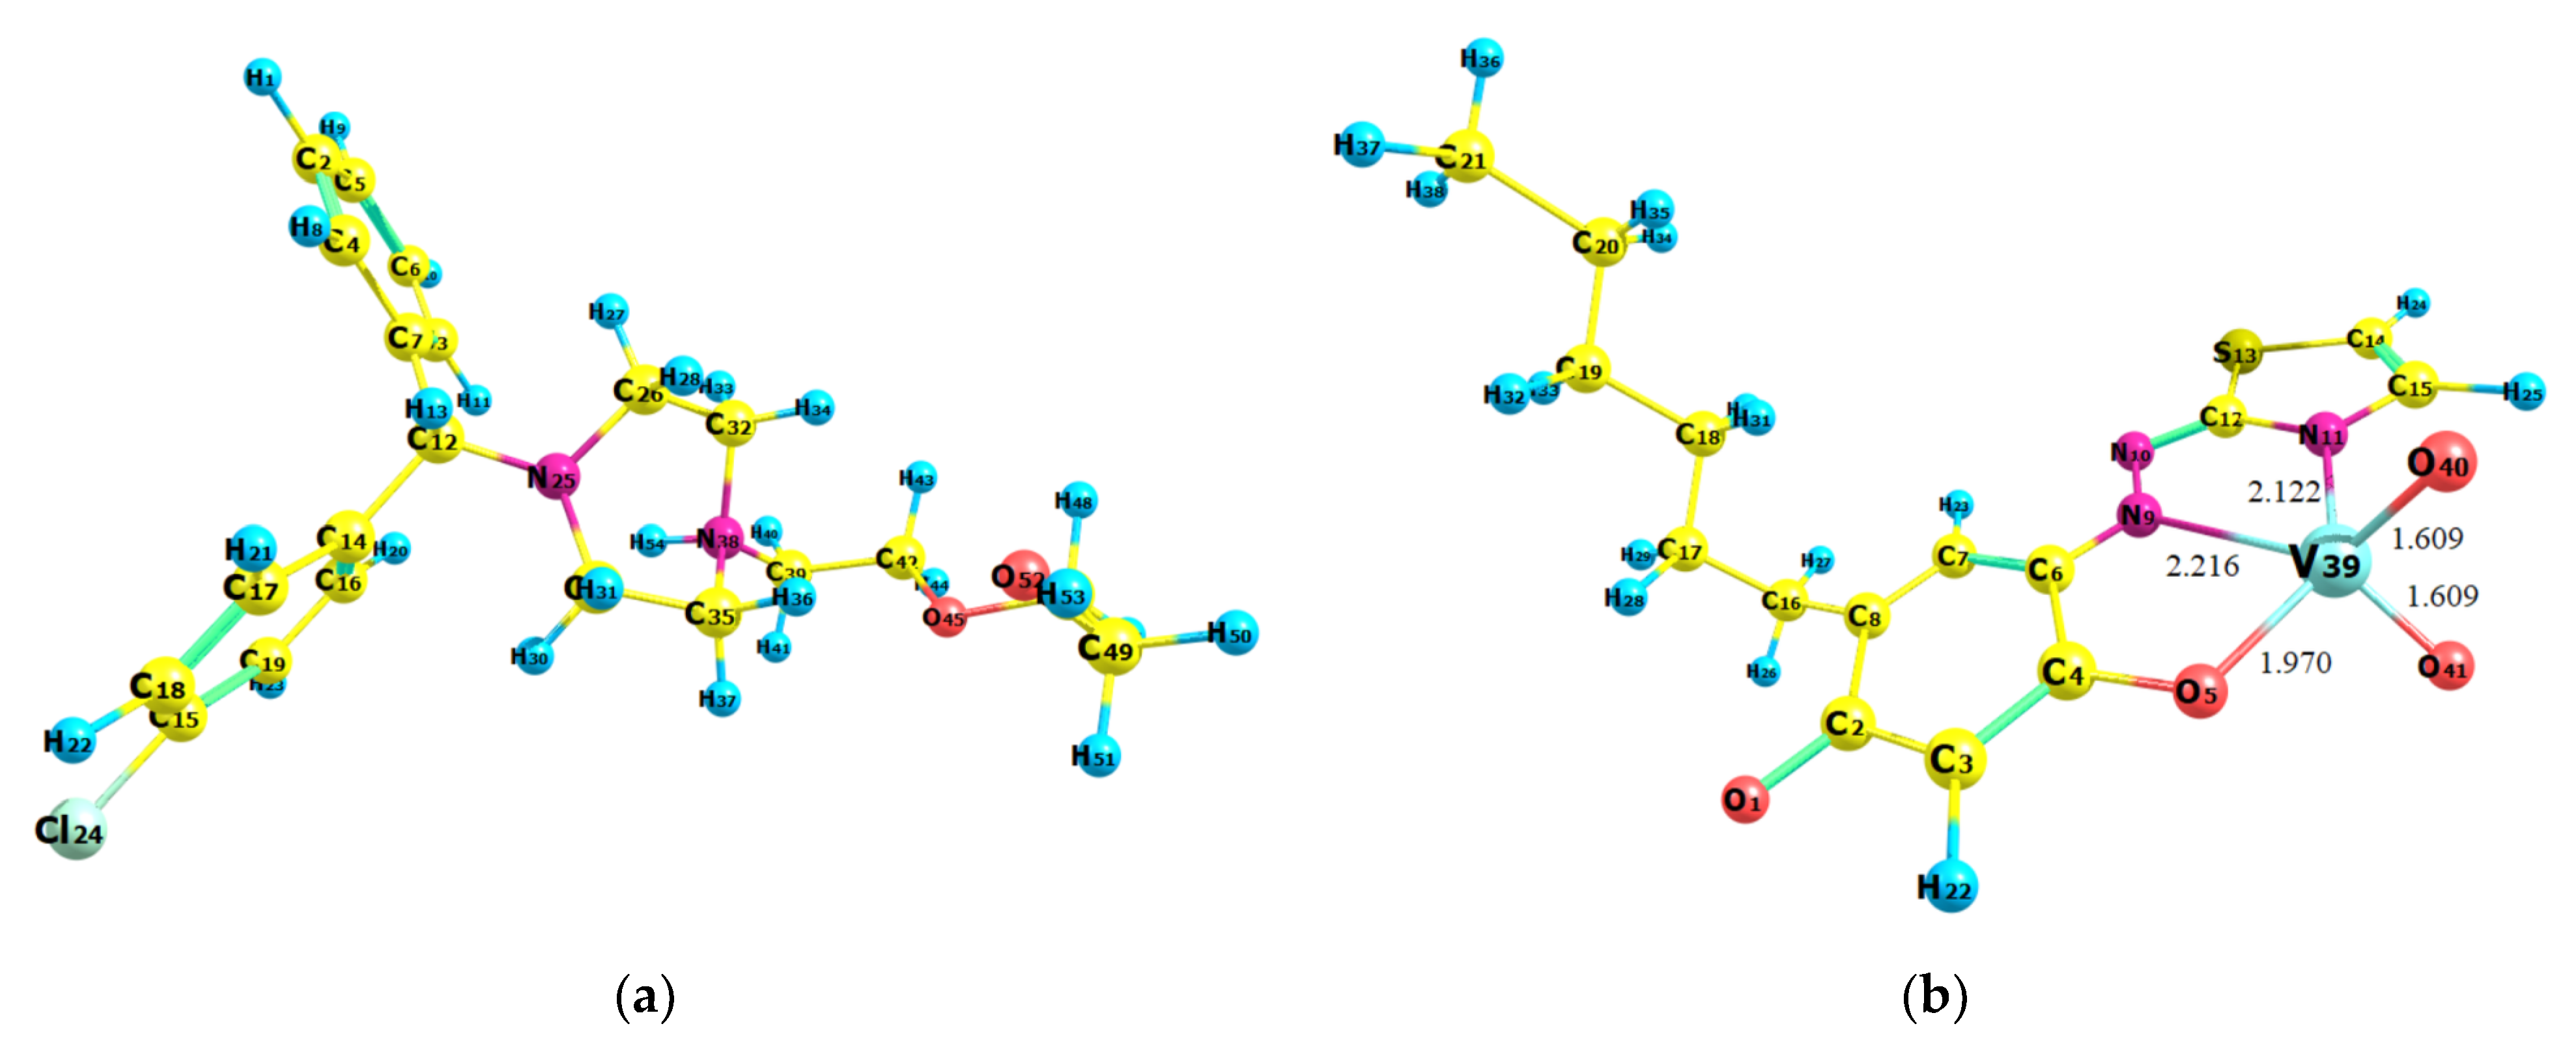
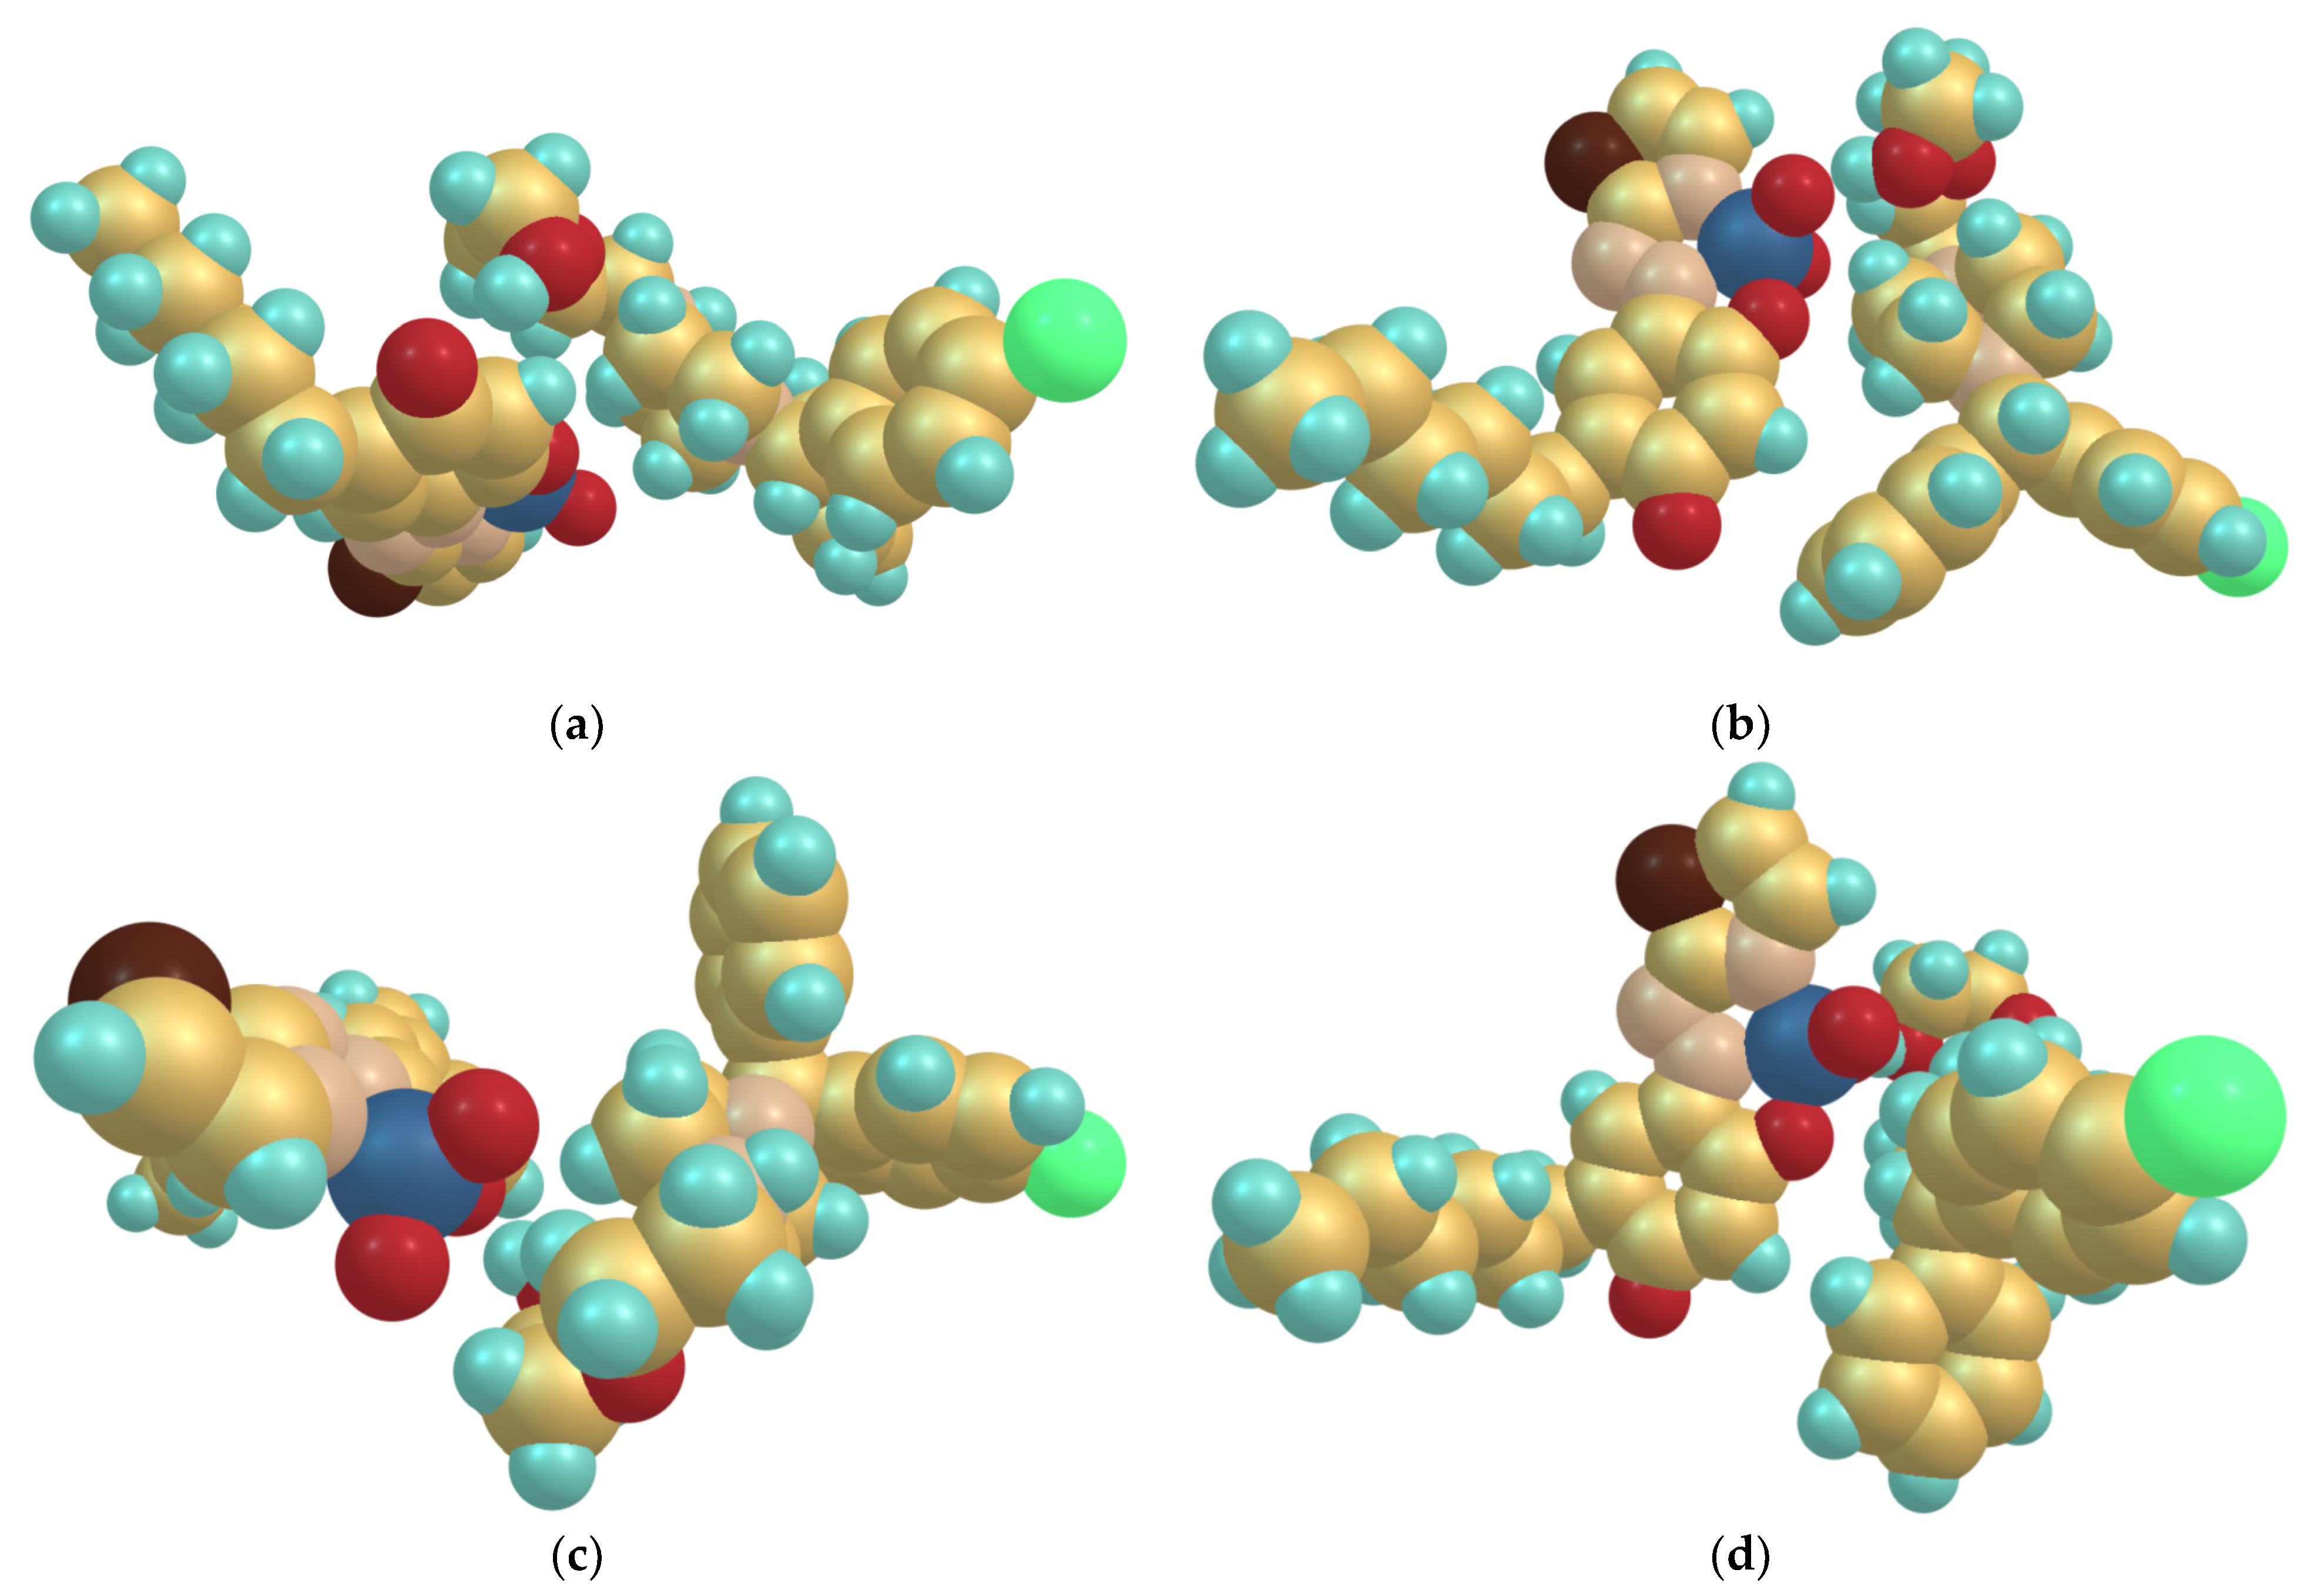
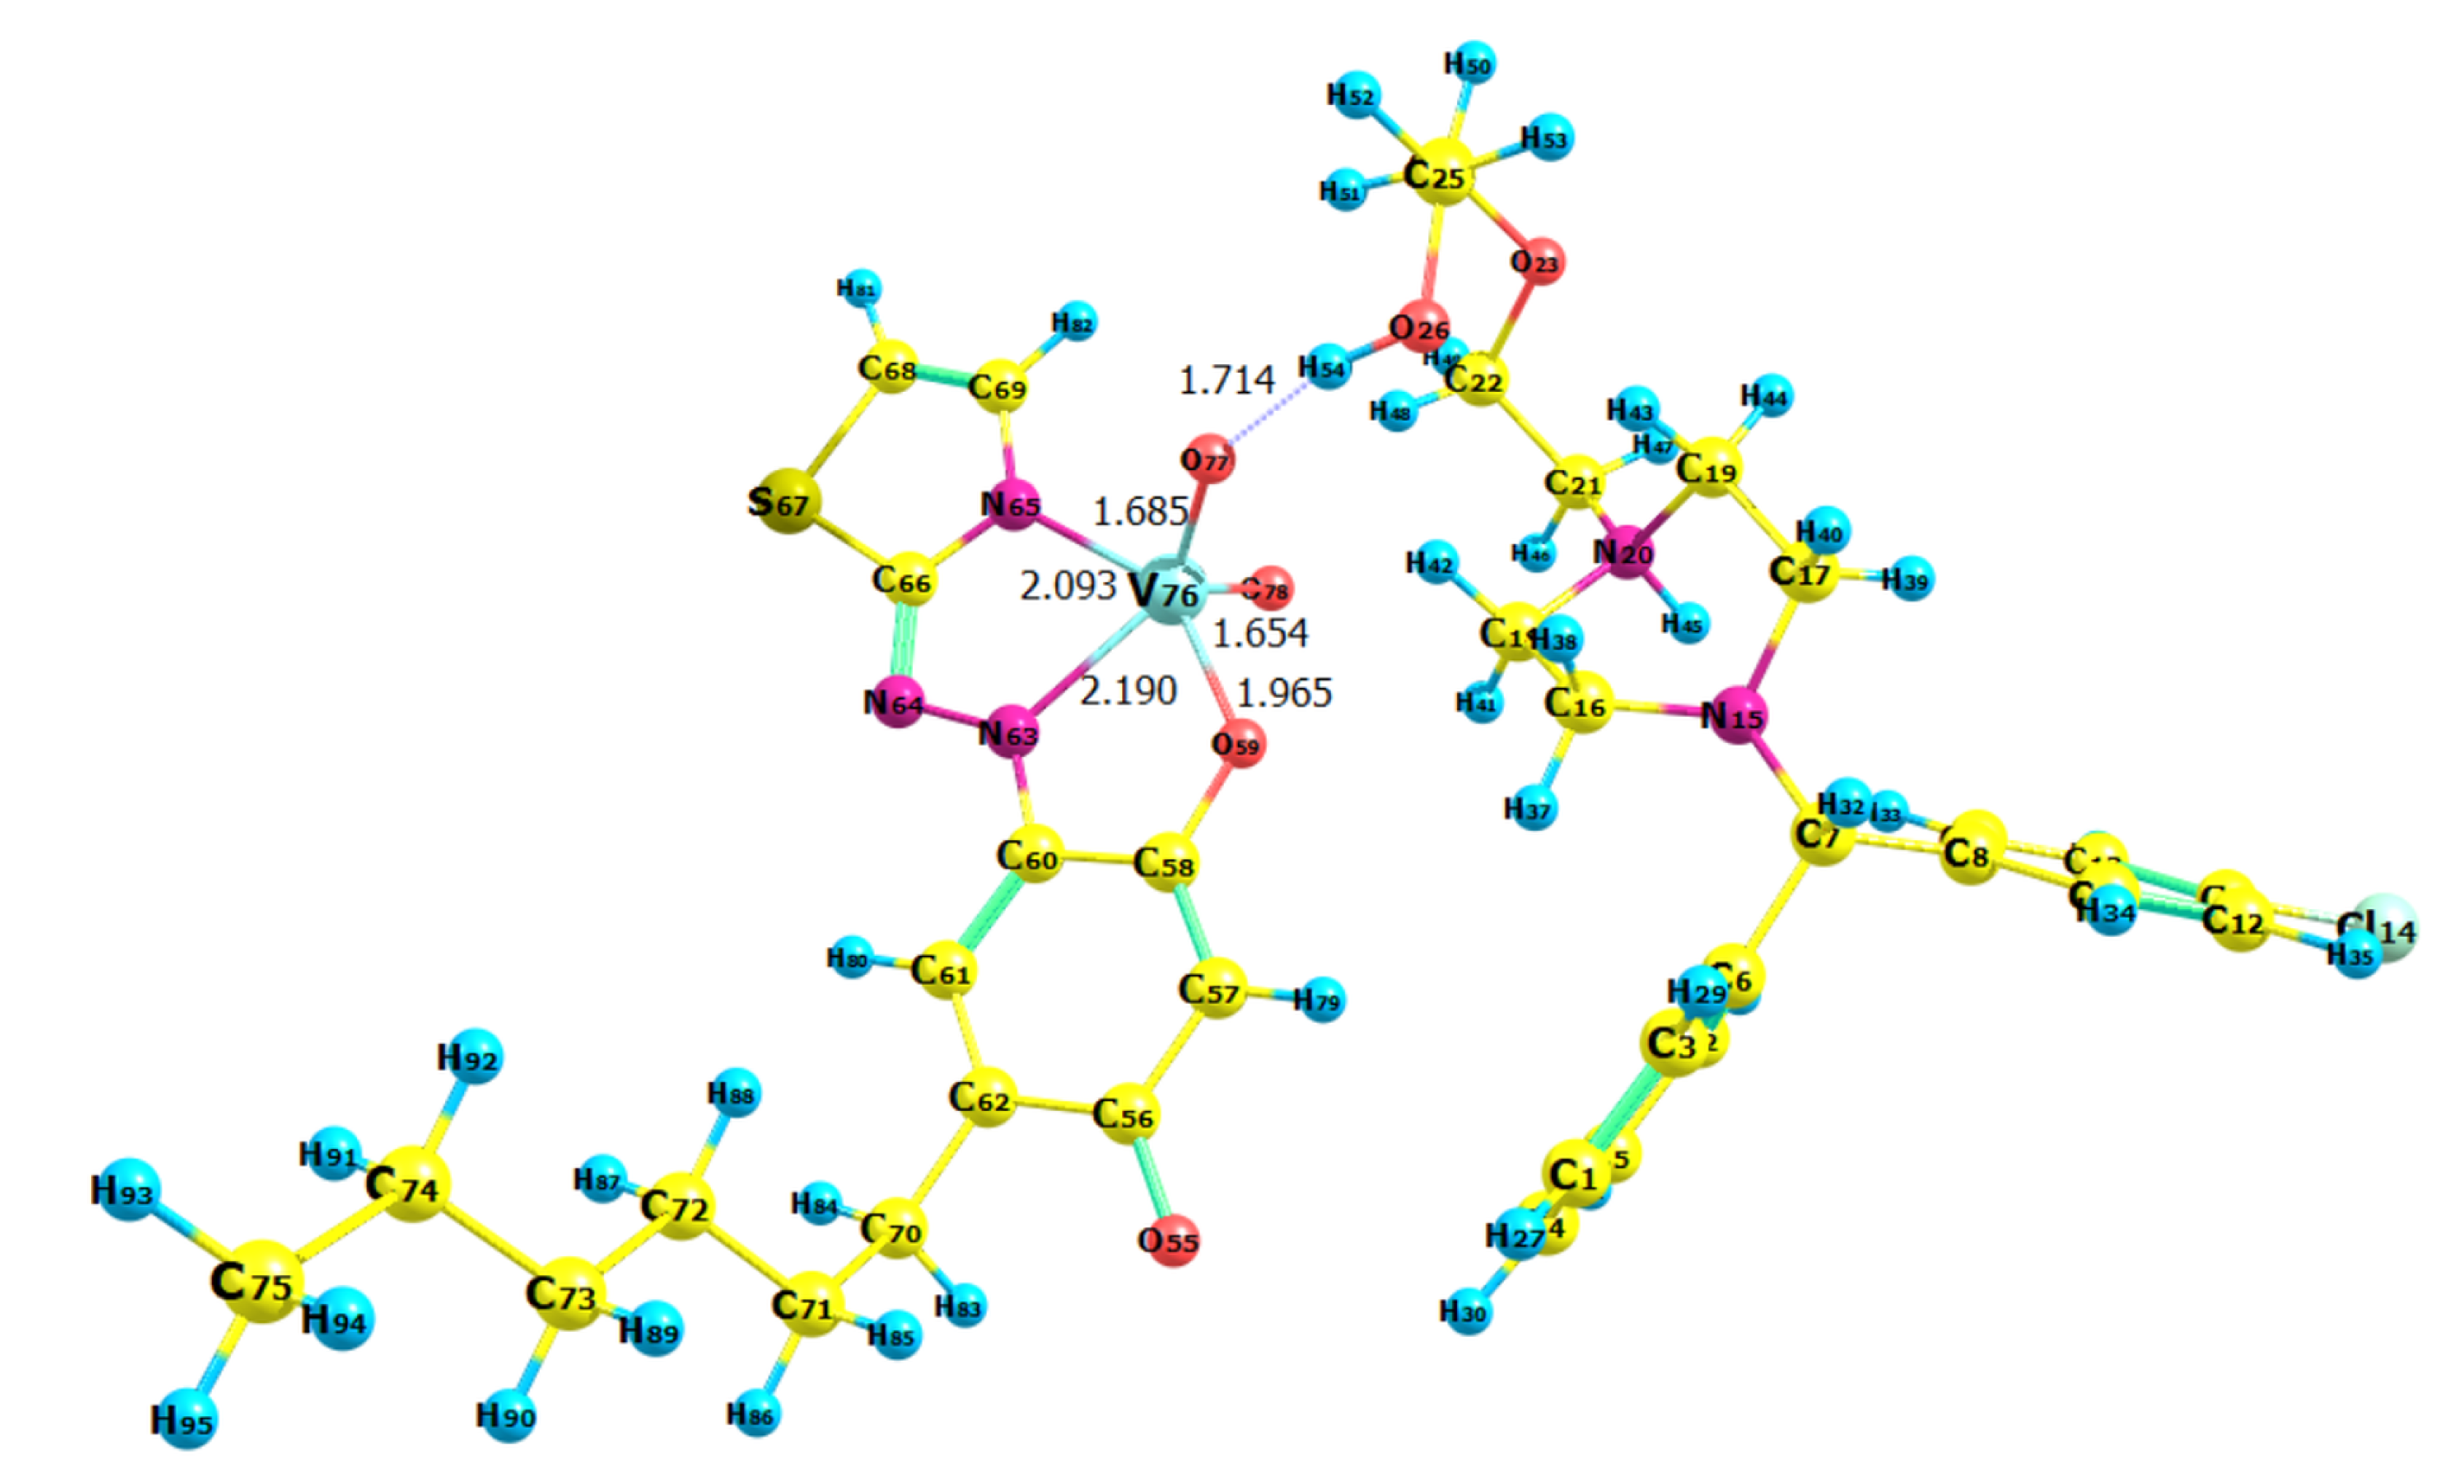
2.8. Optimized Ground-State Structures of the Ion-Association Complex

The next step was to pair the cation and anion properly. For this purpose, four different structures were constructed and fully optimized at the HF/6-31G level of theory (Figure 9). The calculated energies of these structures increased in the following sequence: E2 < E3 < E4 < E1. Therefore, the most likely structure of the ion-association complex is Str. 2 (Figure 9b). It is stabilized by a hydrogen bond between an oxygen of the VO2 group and the OH group of the cationic part.
Str. 2 was further reoptimized at a higher level of theory (BLYP/6-31G), and its structure is presented in Figure 10. The comparison between Str. 2 and that of the isolated chromophore anion (Figure 7b) shows that the ion association induces only minor changes in the bond lengths in the coordination entity. The calculated length of the hydrogen bond between the two associated ions (V76–O77···H54–O26) was 1.714 Å.

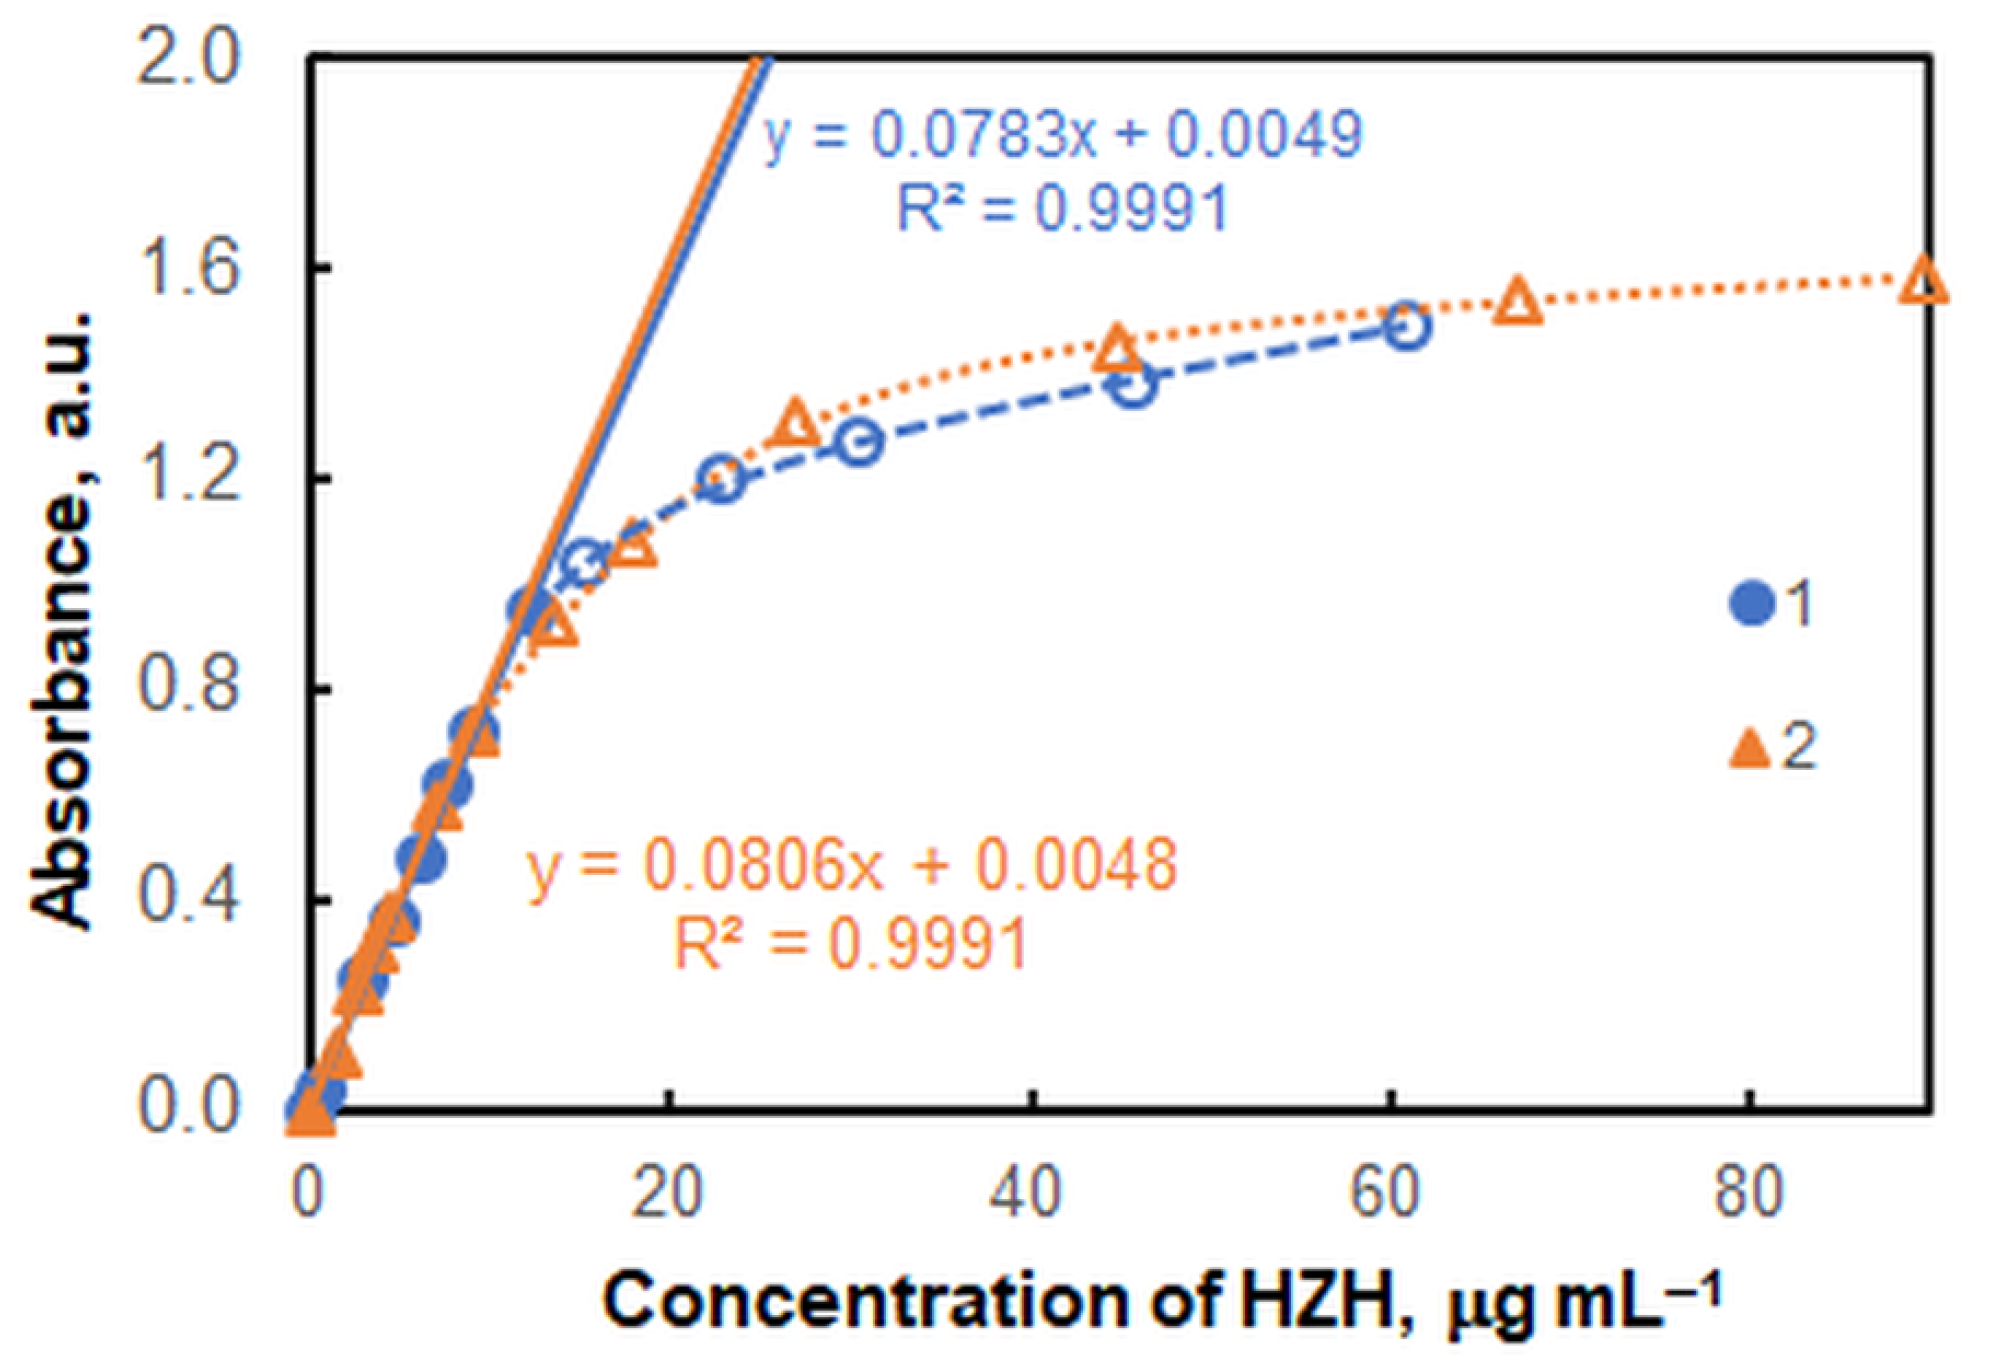
2.9. Chemical–Analytical Characteristics and Application

The correlation between the absorbance (A) and the HZH concentration was studied under the optimal conditions shown in Table 3. A very good linearity was observed for concentrations ranging from 0.43 to 12.2 μg mL−1 (R2 = 0.9991, n = 7; Figure 5). The linear regression equation was A = 0.0783γ + 0.005, where γ is the mass concentration in μg mL−1. The standard deviations of the slope and intercept were 0.0009 and 0.006, respectively. As can be seen, the intercept is statistically indistinguishable from zero. The limit of detection (LOD) and limit of quantitation (LOQ), calculated as 3 and 10 times the standard deviation of the blank (n = 10) divided by the slope, were 0.13 μg mL−1 and 0.43 μg mL−1, respectively. The values of the molar absorption coefficient and Sandell’s sensitivity were 3.50 × 10⁴ L mol−1 cm−1 and 12.8 ng cm−2, respectively. The logarithm of the extraction constant calculated by the mobile equilibrium method [38] (Figure 6d, curve 1) was log Kex = 5.35 ± 0.17. Statistically indistinguishable results for log Kex were obtained by two other methods: the Holme–Langmyhr method [44] (5.38 ± 0.10), and the Harvey–Manning method [45] (5.37 ± 0.18).
The method was tested for the determination of HZH in Neurolax® tablets (Helax Healthcare Pvt. Ltd., Roorkee, India) with a claimed HZH content of 25 mg per tablet. The result was statistically indistinguishable from the above mentioned value: 25.3 ± 0.6 (mean ± SD; four replicate analyses). It was also identical to the result obtained by another method [15]: 25.2 ± 0.9 (mean ± SD, n = 4). To assess the interday reproducibility, eight replicate analyses of the same solution were additionally performed on the following two consecutive days (four analyses per day). The pooled results for the three days indicated that the reproducibility was satisfactory: 24.9 ± 0.8, RSD = 3.2%.
Furthermore, the scope of the studies was extended by the analysis of Neurolax® tablets from another batch and of a syrup obtained by mixing the standard and other ingredients according to a known recipe [46,47]. The results obtained by these studies with unspiked and spiked samples are shown in Table 4.
The robustness of the method was evaluated by comparing the results obtained at different HTAR concentrations (see Figure 5). The equation of the calibration curve remained practically unchanged under these conditions. However, the dynamic interval was shorter when the HTAP concentration was 3 × 10⁻⁴ mol L−1; the limit of linearity (LOL) was 9.0 µg mL−1.
Another experiment related to the robustness assessment was a comparison of results at different extraction times: 45 s and 120 s. The results obtained were statistically identical.

3. Materials and Methods

3.1. Reagents and Chemicals

Reagents were purchased from Merck (Schnelldorf, Germany) and used without further purification as aqueous solutions. Standard solutions of HZH (Mr 447.83) were prepared at concentrations of 3 × 10⁻⁴ mol L−1 and 1 × 10⁻⁴ mol L−1. The ADRs (HTAR, PAR, TAR, and TAO) were dissolved in the presence of KOH [24,25]; cADR = 2 × 10⁻³ mol L−1. The V(V) solution (3 × 10⁻⁴ mol L−1) was prepared from NH4VO3 (puriss. p.a.). The pH of the aqueous phase was kept constant using a buffer solution prepared by mixing appropriate proportions of 2 mol L−1 solutions of ammonia and acetic acid. Distilled water and redistilled chloroform were used during the work.

3.2. Instrumentation

Ultrospec 3300 pro and Spectronic Camspec M550 UV–Vis scanning spectrophotometers (Garforth, United Kingdom), equipped with 1 cm cells, were used for the spectrophotometric measurements. The pH was checked using a WTW InoLab 7110 pH meter (Weilheim, Germany) with a glass electrode.

3.3. Samples

Neurolax® tablets of two batches (A and B; both containing 25 mg of HZH per tablet as the active ingredient) were purchased from local pharmacies. Twenty tablets per batch were weighed and powdered with a mortar and pestle. Two test solutions (A and B) with an expected HZH concentration of 1 × 10⁻⁴ mol L−1 were prepared by adding water to a weighed portion of the powder and shaking for several minutes.
The syrup (50 mL, 2 mg mL−1 HZH) was prepared in our laboratory by mixing HZH, ethanol, sucrose, sodium benzoate, levomenthol, hazelnut flavor, and water [46,47]. An aliquot of this solution was further diluted with water to obtain the desired HZH concentration (1 × 10⁻⁴ mol L−1).
All solutions were stored in dark bottles at 4 °C and used within no more than 5 days.

3.4. Optimization Procedure

Solutions of V(V), ammonium acetate buffer, HTAR, and HZH were mixed in a 125-mL separatory funnel. The sample was diluted with water to a total volume of 10 mL. Then, a 4 mL portion of chloroform was added using a burette. The funnel was stoppered and shaken for a fixed time interval to transfer the complex to the chloroform phase. After the phase separation, a portion of the organic layer was poured into the cell. Absorbance was measured against chloroform or a simultaneously prepared blank containing no HZH.

3.5. Procedure for the Determination of HZH

Solutions of V(V) (1 mL, 3 × 10⁻⁴ mol L−1), buffer (1 mL, pH 4.3), and HTAR (1.2 mL, 2 × 10⁻³ mol L−1) were mixed in a 125 mL separatory funnel. An aliquot of the analyzed solution (containing 0.43–12.2 μg mL−1 of HZH) was added, and the sample was diluted with water until the total volume of the aqueous phase was 10 mL. Then, 4 mL of chloroform was added, and the funnel was shaken for 45 s. After phase separation, a portion of the organic layer was poured into the cell, and the absorbance was measured at 554 nm against a blank. The unknown HZH concentration was determined from a calibration plot prepared by the same procedure using standard solutions.

3.6. Theoretical

The ground-state equilibrium geometries of the ionic structures HZH+ and [VO2(HTAR)] were optimized at the B3LYP/6-311++G** level of theory. Subsequently, frequency calculations were performed to prove that the structures lay in minima. The vertical excitation energies of [VO2(HTAR)] were also calculated at this level. Furthermore, the cation and anion were paired in four different ways in neutral complexes distinguished by the mutual orientation of the constituents. Because of the large size of the systems, their stability was estimated by the computed energies at the HF/6-31G theoretical level. The most stable structure of the ion pair was finally reoptimized at the higher theoretical level—BLYP/6-31G. All calculations were carried out using the GAUSSIAN 16 program package [48]. The Chemcraft graphical program (https://chemcraftprog.com (accessed on 1 February 2023)) was used to visualize the results of the quantum chemistry computations [49].

4. Conclusions

A sensitive, precise, fast, and robust extraction–spectrophotometric method was developed for the determination of HZH. It was successfully applied to the analysis of pharmaceutical products. The method is based on an ion-association complex of the monocationic form of HZH and the anionic chelate of V(V) with a new commercially available azo dye—HTAR. Due to some peculiarities of its structure, the V(V)–HTAR anionic chelate exhibits selectivity for the extraction of HZH+, and the dye HTAR cannot be replaced by similar dyes, such as PAR, TAR, or TAO. Using quantum chemical calculations, the ground-state equilibrium geometry of the extracted species was optimized. A good match between the experimental spectrum and the simulated spectrum of the chromophore anion [VO2(HTAR)] is a guarantee of the correctness of the proposed structure.

Author Contributions

Conceptualization, K.B.G. and Z.Y.V.; formal analysis, G.K.K. and K.B.G.; methodology, K.B.G. and V.B.D.; software, V.B.D.; validation, G.K.K. and K.B.G.; investigation, G.K.K. and Z.Y.V.; resources, K.B.G., Z.Y.V., V.B.D. and G.K.K.; writing—original draft preparation, K.B.G.; writing—review and editing, G.K.K., K.B.G. and V.B.D.; supervision, K.B.G.; project administration, V.B.D.; funding acquisition, K.B.G. All authors have read and agreed to the published version of the manuscript.

Funding

This research was funded in part by the National Centre for High-Performance and Distributed Computing through grant No. D01-168/28.07.2022. The APC was funded by the Medical University of Plovdiv.

Institutional Review Board Statement

Not applicable.

Informed Consent Statement

Not applicable.

Data Availability Statement

Not applicable.

Acknowledgments

We acknowledge the provided access to the e-infrastructure of the NCHDC—a part of the Bulgarian National Roadmap on RIs—with the financial support through Grant No. D01-168/28.07.2022.

Conflicts of Interest

The authors declare no conflict of interest.

Sample Availability

Samples of the compounds are not available from the authors.

References

  1. Hydroxyzine Hydrochloride (Code C47559). Available online: https://ncit.nci.nih.gov/ncitbrowser/ConceptReport.jsp?dictionary=NCI_Thesaurus&ns=ncit&code=C47559 (accessed on 24 January 2023).
  2. Tsau, J.; DeAngelis, N. Hydroxyzine Dihydrochloride. In Analytical Profiles of Drug Substances; Florey, K., Ed.; Academic Press: San Diego, CA, USA, 1978; pp. 319–341. [Google Scholar] [CrossRef]
  3. Hammad, S.F.; Mokhtar, M.M.; Ahmed, H.; Hamed, E.; Naoya, K.; Kenichiro, N.; Naotaka, K. Precolumn fluorescence labeling method for simultaneous determination of hydroxyzine and cetirizine in human serum. Biomed. Chromatogr. 2007, 21, 1030–1035. [Google Scholar] [CrossRef] [PubMed]
  4. Krueger, J.A.; Kaduk, J.A.; Gindhart, A.M.; Blanton, T.N. Crystal structure of hydroxyzine dihydrochloride, C21H29ClN2O2Cl2. Powder Diffr. 2019, 34, 66–73. [Google Scholar] [CrossRef]
  5. Prasad, R.; Siddaraju, C. A Selective PVC Matrix Assisted Potentiometric Sensor for the Determination of Hydroxyzine Hydrochloride (HDH). Port. Electrochim. Acta 2022, 40, 347–362. [Google Scholar] [CrossRef]
  6. Anderson, P.O.; Knoben, J.E.; Troutman, W.G. Handbook of Clinical Drug Data, 10th ed.; McGraw-Hill: New York, NY, USA, 2022; pp. 794–796. [Google Scholar]
  7. High Risk Medications. NCQA’s HEDIS Measure: Use of High-Risk Medications in the Elderly. Available online: http://www.ncqa.org/Portals/0/Newsroom/SOHC/Drugs_Avoided_Elderly.pdf (accessed on 24 January 2023).
  8. Ackermann, H.; Kretzschmann, F.; Krüger, S.; Lexow, B. Dünnschichtchromatographisches Verfahren zur semiquantitativen Bestimmung von Hydroxyzinrückstanden in tierischem Material. Die Nahr. 1977, 21, 603–610. [Google Scholar] [CrossRef] [PubMed]
  9. Sher, N.; Siddiqui, F.A.; Fatima, N.; Perveen, S.; Shafi, N. New Method Development for Hydroxyzine Determination: Application in Stability Studies, Pharmaceutical Formulations, and Humane Serum. J. Liq. Chromatogr. Relat. Technol. 2015, 38, 911–918. [Google Scholar] [CrossRef]
  10. Kintz, P.; Godelar, B.; Mangin, P. Gas chromatographic identification and quantification of hydroxyzine: Application in a fatal self-poisoning. Forensic Sci. Int. 1990, 48, 139–143. [Google Scholar] [CrossRef]
  11. Ho, Y.-H.; Wu, H.-L.; Wu, S.-M.; Chen, S.-H.; Kou, H.-S. Quantitative enantiomeric analysis of chlorcyclizine, hydroxyzine, and meclizine by capillary electrophoresis. Anal. Bioanal. Chem. 2003, 376, 859–863. [Google Scholar] [CrossRef]
  12. Rajendraprasad, N.; Basavaiah, K.; Vinay, B.K. Acid-base titrimetric assay of hydroxyzine dihydrochloride in pharmaceutical samples. Chem. Ind. Chem. Eng. Q. 2010, 16, 127–132. [Google Scholar] [CrossRef]
  13. Mikulski, R.; Dembiński, B. Determination of colloidal electrolytes: Conductimetric titration of hydroxyzine hydrochloride with ammonium molybdate. Anal. Chim. Acta 1993, 272, 233–235. [Google Scholar] [CrossRef]
  14. Zayed, S.I.; Al-Talhi, A.A.; Thagafi, A.E.A. Determination of hydroxyzine by differential pulse anodic voltammetry using carbon paste electrode. J. Chil. Chem. Soc. 2018, 63, 4064–4067. [Google Scholar] [CrossRef] [Green Version]
  15. Budevski, O. Handbook of Practical Exercises in Analytical Chemistry for Pharmacy Students, 5th ed.; ARSO Medical Publishing House: Sofia, Bulgaria, 1999; pp. 270–271. [Google Scholar]
  16. Kurzawa, M.; Dembinski, B.; Szydiowska-Czerniak, A. Spectrophotometric determination of imipramine hydrochloride, doxepin hydrochloride, and hydroxyzine dihydrochloride with Reinecke salt. Acta Pol. Pharm. 1999, 56, 255–260. [Google Scholar]
  17. Basavaiah, K.; Charan, V.S. Titrimetric and spectrophotometric assay of some antihistamines through the determination of the chloride of their hydrochlorides. Farmaco 2002, 57, 9–17. [Google Scholar] [CrossRef]
  18. Basavaiah, K.; Charan, V. Spectrophotometric determination of two antihistamines by charge-transfer complex formation with chloranilic acid. Indian J. Pharm. Sci. 2003, 65, 660–662. [Google Scholar]
  19. Rajendraprasad, N.; Basavaiah, K.; Vinay, K.B.; Revanasiddappa, H.D. Sensitive and selective extractive spectrophotometric method for the determination of hydroxyzine dihydrochloride in pharmaceuticals. J. Mex. Chem. Soc. 2010, 54, 233–239. [Google Scholar] [CrossRef]
  20. Rajendraprasad, N.; Basavaiah, K.; Vinay, K.B. Optimized and validated spectrophotometric methods for the determination of hydroxyzine hydrochloride in pharmaceuticals and urine using iodine and picric acid. J. Serb. Chem. Soc. 2011, 76, 1551–1560. [Google Scholar] [CrossRef]
  21. Naveed, S.; Qamar, F.; Zainab, S.; Sarwar, G.; Alam, M.T. Simple UV spectrophotometric assay of hydroxazine. World J. Pharm. Life Sci. 2015, 1, 65–70. [Google Scholar]
  22. Milcheva, N.P.; Genç, F.; Racheva, P.V.; Delchev, V.B.; Andruch, V.; Gavazov, K.B. An environmentally friendly cloud point extraction–spectrophotometric determination of trace vanadium using a novel reagent. J. Mol. Liq. 2021, 334, 116086. [Google Scholar] [CrossRef]
  23. Racheva, P.V.; Milcheva, N.P.; Genc, F.; Gavazov, K.B. A centrifuge-less cloud point extraction-spectrophotometric determination of copper(II) using 6-hexyl-4-(2-thiazolylazo)resorcinol. Spectrochim. Acta A Mol. Biomol. Spectrosc. 2021, 262, 120106. [Google Scholar] [CrossRef]
  24. Gavazov, K.B.; Racheva, P.V.; Milcheva, N.P.; Divarova, V.V.; Kiradzhiyska, D.D.; Genç, F.; Saravanska, A.D. Use of a hydrophobic azo dye for the centrifuge-less cloud point extraction–spectrophotometric determination of cobalt. Molecules 2022, 27, 4725. [Google Scholar] [CrossRef]
  25. Hristov, D.; Milcheva, N.; Gavazov, K. Extraction-chromogenic systems for vanadium(V) based on azo dyes and xylometazoline hydrochloride. Acta Chim. Slov. 2019, 66, 987–994. [Google Scholar] [CrossRef]
  26. Hanocq, M.; Croisier, P.; Damme, M.V.; Aelvoet, C. Macro ionization constants of hydroxyzine, cetirizine and an analog. Anal. Lett. 1989, 22, 117–140. [Google Scholar] [CrossRef]
  27. Tôei, K. Ion-association reagents. A review. Anal. Sci. 1987, 3, 479–488. [Google Scholar] [CrossRef] [Green Version]
  28. Galesic, N.; Siroki, M. The structure of tetraphenylphosphonium dioxo [4-(2-pyridylazo)resorcinolato]vanadate(V), C24H20P+.C11H7N3O4V. Acta Crystallogr. B 1979, 35, 2931–2937. [Google Scholar] [CrossRef]
  29. Galesic, N.; Siroki, M. Structure of tetraphenylphosphonium dioxo [4-(1,3-thiazol-2-ylazo)resorcinolato]vanadate(V) monohydrate, [P(C6H5)4][VO2(C9H5N3O2S)].H2O. Acta Crystallogr. C 1984, 40, 378–381. [Google Scholar] [CrossRef]
  30. Yerramilli, A.; Kavipurapu, C.S.; Manda, R.R.; Pillutla, C.M. Extractive spectrophotometric method for the determination of vanadium(V) in steels and titanium base alloy. Anal. Chem. 1986, 58, 1451–1453. [Google Scholar] [CrossRef]
  31. Uslu, M.; Ulutürk, H.; Yartaşı, A.; Döker, S. A sensitive method for selective determination of vanadium species by dispersive liquid-liquid microextraction (DLLME) with spectrophotometric detection. Toxicol. Environ. Chem. 2013, 95, 1638–1649. [Google Scholar] [CrossRef]
  32. Gavazov, K.B.; Stefanova, T.S. Liquid-liquid extraction-spectrophotometric investigations of three ternary complexes of vanadium. Croat. Chem. Acta 2014, 87, 233–240. [Google Scholar] [CrossRef]
  33. Gavazov, K.B.; Delchev, V.B.; Mileva, K.T.; Stefanova, T.S.; Toncheva, G.K. A 2:2:2 complex of vanadium(V) with 4-(2-thiazolylazo)orcinol and 2,3,5-triphenyl-2H-tetrazolium chloride. Acta Chim. Slov. 2016, 63, 392–398. [Google Scholar] [CrossRef] [Green Version]
  34. Gavazov, K.B. Liquid-liquid extraction of ion-association complexes. In Advances in Chemistry Research; Taylor, J.C., Ed.; Nova Science Publishers: New York, NY, USA, 2019; Volume 50, pp. 203–238. [Google Scholar]
  35. Pilipenko, A.T.; Tananajko, M.M. Mixed Ligand and Mixed Metal Complexes and Their Use in Analytical Chemistry; Khimiya: Moscow, Russia, 1983; pp. 72–165. [Google Scholar]
  36. Gavazov, K.B.; Dimitrov, A.N.; Lekova, V.D. The use of tetrazolium salts in inorganic analysis. Russ. Chem. Rev. 2007, 76, 169–179. [Google Scholar] [CrossRef]
  37. Divarova, V.V.; Saravanska, A.D.; Toncheva, G.K.; Milcheva, N.; Delchev, V.B.; Gavazov, K.B. Spectrophotometric determination of molybdenum(VI) as a ternary complex with 4-nitrocatechol and benzalkonium chloride. Molecules 2022, 27, 1217. [Google Scholar] [CrossRef]
  38. Saravanska, A.D.; Racheva, P.V.; Divarova, V.V.; Toncheva, G.K.; Milcheva, N.P.; Delchev, V.B.; Gavazov, K.B. Extraction-spectrophotometric and theoretical studies on a ternary complex obtained from vanadium(V) and 4-nitrocatechol. Russ. J. Inorg. Chem. 2021, 66, 1880–1886. [Google Scholar] [CrossRef]
  39. Konermann, L. Addressing a common misconception: Ammonium acetate as neutral pH “buffer” for native electrospray mass spectrometry. J. Am. Soc. Mass Spectrom. 2017, 28, 1827–1835. [Google Scholar] [CrossRef]
  40. Yoe, J.H.; Jones, A.L. Colorimetric determination of iron with disodium-1,2-dihydroxybenzene-3,5-disulfonate. Ind. Eng. Chem. Anal. Ed. 1944, 16, 111–115. [Google Scholar] [CrossRef]
  41. Bent, H.E.; French, C.L. The structure of ferric thiocyanate and its dissociation in aqueous solution. J. Am. Chem. Soc. 1941, 63, 568–572. [Google Scholar] [CrossRef]
  42. Asmus, E. Eine neue Methode zur Ermittlung der Zusammensetzung schwacher Komplexe. Fresenius’ J. Anal. Chem. 1960, 178, 104–116. [Google Scholar] [CrossRef]
  43. Zhiming, Z.; Dongsten, M.; Cunxiao, Y. Mobile equilibrium method for determining composition and stability constant of coordination compounds of the form MmRn. J. Rare Earths 1997, 15, 216–219. [Google Scholar]
  44. Holme, A.; Langmyhr, F.J. A modified and a new straight-line method for determining the composition of weak complexes of the form AmBn. Anal. Chim. Acta 1966, 36, 383–391. [Google Scholar] [CrossRef]
  45. Harvey, A.E.; Manning, D.L. Spectrophotometric methods of establishing empirical formulas of colored complexes in solution. J. Am. Chem. Soc. 1950, 72, 4488–4493. [Google Scholar] [CrossRef]
  46. ATARAX Syrup 200 mL. Available online: https://apteka.framar.bg/01005291/ (accessed on 24 January 2023).
  47. Atarax™. Available online: https://www.e-lactancia.org/media/papers/Hydroxyzine-DS-Glaxo-SK2013.pdf (accessed on 24 January 2023).
  48. Frisch, M.J.; Trucks, G.W.; Schlegel, H.B.; Scuseria, G.E.; Robb, M.A.; Cheeseman, J.R.; Scalmani, G.; Barone, V.; Petersson, G.A.; Nakatsuji, H.; et al. Gaussian 16; Gaussian, Inc.: Wallingford, CT, USA, 2016. [Google Scholar]
  49. ChemCraft. Available online: http://www.chemcraftprog.com (accessed on 1 February 2023).
Figure 1. Molecular structure of hydroxyzine dihydrochloride (HZH) [2,4,26] (a) and 6-hexyl-4-(2-thiazolylazo)resorcinol (HTAR) [24,25] (b).
Molecules 28 02484 g001
Figure 2. Absorption spectra in chloroform of the V(V)-HTAR-HZH complex (1) and the blank V(V)-HTAR (2); 3 × 10⁻⁵ mol L−1 of V(V), 2.4 × 10⁻⁴ mol L−1 of HTAR, 1.7 × 10⁻⁵ mol L−1 of HZH, pH of 4.3 (ammonium acetate buffer), extraction time of 45 s.
Molecules 28 02484 g002
Figure 3. Effect of pH on the absorbance of the chloroform extract; 3 × 10⁻⁵ mol L−1 of V(V), 3 × 10⁻⁴ mol L−1 of HTAR, 1 × 10⁻⁴ mol L−1 of HZH, extraction time of 45 s, λ = 554 nm.
Molecules 28 02484 g003
Figure 4. Effect of extraction time; 3 × 10⁻⁵ mol L−1 of V(V), 2.4 × 10⁻⁴ mol L−1 of HTAR, 1.7 × 10⁻⁵ mol L−1 of HZH, pH of 4.3 (ammonium acetate buffer), λ = 554 nm. The empty marker on the left indicates a slow phase separation process.
Molecules 28 02484 g004
Figure 5. Saturation curves with HZH at two different HTAR concentrations: 2.4 × 10⁻⁴ mol L−1 (blue markers) and 3.0 × 10⁻⁴ mol L−1 (orange markers); 3 × 10⁻⁵ mol L−1 of V(V), pH of 4.3, extraction time of 45 s, λ = 554 nm. The full markers refer to the linear portions of the curves.
Molecules 28 02484 g005
Figure 6. Determination of the HZH-V(V) molar ratio by the molar ratio method (a), Bent–French method (b), Asmus method (c), and mobile equilibrium method (d); 3 × 10⁻⁵ mol L−1 of V(V), 2 × 10⁻⁴ mol L−1 of HTAR, extraction time of 45 s, λ = 554 nm.
Molecules 28 02484 g006
Figure 7. B3LYP-optimized ground-state equilibrium geometries of the cation (a) and anion (b). Visualization using the Chemcraft graphical program (https://chemcraftprog.com (accessed on 1 February 2023)).
Molecules 28 02484 g007
Figure 8. Comparison of the experimental spectrum of the extracted complex with a simulated spectrum (B3LYP/6-311++G** level of theory) of its anion moiety. A Lorentzian broadening and a scaling coefficient of 1.17 were used for the theoretical spectrum.
Molecules 28 02484 g008
Figure 9. Optimized ground-state structures of the ion-association complex at the HF/6-31G level of theory: (a) Str. 1, E1 = –3909.6590 a.u.; (b) Str. 2, E2 = –3909.6660 a.u.; (c) Str. 3, E3 = –3909.6644 a.u.; (d) Str. 4, E4 = –3909.6633 a.u. Visualization using the Chemcraft graphical program (https://chemcraftprog.com (accessed on 1 February 2023)).
Molecules 28 02484 g009
Figure 10. Reoptimized Str. 2 at the BLYP/6-31G level of theory. Visualization using the Chemcraft graphical program (https://chemcraftprog.com (accessed on 1 February 2023)).
Molecules 28 02484 g010
Table 1. Spectrophotometric procedures for the determination of HZH.
Reagent(s)λmax, nmLinear Range, μg mL−1ε, L mol−1 cm−1LODCommentsRef.
Methyl orange510Includes both extraction and re-extraction. Chloroform consumption per sample: 20 mL[15]
Reinecke salt525.530–5201.27 × 105A slow and tedious procedure involving precipitation and drying of a Cr(III) complex for 6 h[16]
Diphenylcarbazone + Hg(II) 540Up to 606.62 × 10³An indirect determination based on the decrease in the absorption of the Hg(II)–diphenylcarbazone complex[17]
Chloranilic acid53525–1501.37 × 1031.25A low-sensitivity procedure involving a charge-transfer complexation reaction in chloroform/acetonitrile[18]
Orange II4801.5–152.07 × 1040.14Based on a chloroform-extracted ion pair. Chloroform consumption per sample: 20 mL[19]
Picric acid4003.75–458.06 × 1030.62Based on a charge-transfer complexation reaction in chloroform[20]
Iodine3801.25–152.59 × 1040.13Based on a charge-transfer complexation reaction in dichloromethane. Short shelf life of the used reagent solution[20]
230Not used for the analysis of real samples[21]
HTAR + V(V)554Up to 12.23.50 × 1040.13A sensitive, fast, and robust extraction–spectrophotometric procedure based on a ternary ion-association complexThis work
Table 2. Vertical excitation energies and oscillator strengths of excited states of the anionic chelate calculated at the B3LYP/6-311++G** level of theory.
Excited StateVertical Excitation Energy, nmOscillator Strength
1ππ*5040.0200
1ππ*4750.5214
1nπ*4520.0005
Table 3. Extraction–spectrophotometric optimization.
Optimized ParameterScope of OptimizationOptimal Value
Wavelength, nm500–760554
Concentration of V(V), mol L−13.0 × 10⁻⁵
Concentration of HTAR, mol L−1(2–3) × 10−42.4 × 10⁻⁴
pH (ammonium acetate buffer)3.0–6.0 4.3
Extraction time, s15–18045
Table 4. Determination (n = 4) of HZH in unspiked and spiked samples.
SampleHZH Spike,
μg mL−1
HZH Found, *
μg mL−1
RSD, %Recovery, %
Neurolax® tablets
(Batch 1)
03.04 ± 0.072.3
1.54.58 ± 0.112.4103
3.06.07 ± 0.091.5101
4.57.52 ± 0.141.999.6
Syrup02.99 ± 0.082.7
1.54.44 ± 0.081.896.7
3.06.03 ± 0.122.0101
4.57.46 ± 0.131.799.3
* mean ± SD.
Disclaimer/Publisher’s Note: The statements, opinions and data contained in all publications are solely those of the individual author(s) and contributor(s) and not of MDPI and/or the editor(s). MDPI and/or the editor(s) disclaim responsibility for any injury to people or property resulting from any ideas, methods, instructions or products referred to in the content.

