Article

Deep Eutectic Solvent Based Reversed-Phase Dispersive Liquid–Liquid Microextraction and High-Performance Liquid Chromatography for the Determination of Free Tryptophan in Cold-Pressed Oils

1
Faculty of Pharmacy, University of Belgrade, Vojvode Stepe 450, 11221 Belgrade, Serbia
2
Innovation Center of the Faculty of Technology and Metallurgy, Karnegijeva 4, 11120 Belgrade, Serbia
3
Faculty of Technology and Metallurgy, University of Belgrade, Karnegijeva 4, 11120 Belgrade, Serbia
*
Authors to whom correspondence should be addressed.
Molecules 2023, 28(5), 2395; https://doi.org/10.3390/molecules28052395
Submission received: 25 December 2022 / Revised: 27 February 2023 / Accepted: 3 March 2023 / Published: 5 March 2023

Abstract

:
A fast and straightforward reversed-phase dispersive liquid–liquid microextraction (RP-DLLME) using a deep eutectic solvent (DES) procedure to determine free tryptophan in vegetable oils was developed. The influence of eight variables affecting the RP-DLLME efficiency has been studied by a multivariate approach. A Plackett–Burman design for screening the most influential variables followed by a central composite response surface methodology led to an optimum RP-DLLME setup for a 1 g oil sample: 9 mL hexane as the diluting solvent, vortex extraction with 0.45 mL of DES (choline chloride–urea) at 40 °C, without addition of salt, and centrifugation at 6000 rpm for 4.0 min. The reconstituted extract was directly injected into a high-performance liquid chromatography (HPLC) system working in the diode array mode. At the studied concentration levels, the obtained method detection limits (MDL) was 11 mg/kg, linearity in matrix-matched standards was R2 ≥ 0.997, relative standard deviations (RSD) was 7.8%, and average recovery was 93%. The combined use of the recently developed DES -based RP-DLLME and HPLC provides an innovative, efficient, cost-effective, and more sustainable method for the extraction and quantification of free tryptophan in oily food matrices. The method was employed to analyze cold-pressed oils from nine vegetables (Brazil nut, almond, cashew, hazelnut, peanut, pumpkin, sesame, sunflower, and walnut) for the first time. The results showed that free tryptophan was present in the range of 11–38 mg/100 g. This article is important for its contributions to the field of food analysis, and for its development of a new and efficient method for the determination of free tryptophan in complex matrices, which has the potential to be applied to other analytes and sample types.

1. Introduction

Tryptophan (Trp), an essential amino acid, is a precursor of many biologically active substances, including serotonin, melatonin, quinolinic acid, kynurenic acid, and tryptamine, as well as coenzymes important for electron transfer reactions (redox balance of metabolism), such as nicotinamide adenine dinucleotide (NAD+) [1]. A variety of pathological processes in humans are caused by the disorders of tryptophan metabolism, including neurologic disorders, inflammatory bowel disease, malignancies, and cardiovascular disease [2].
The human body cannot synthesize Trp and is dependent on dietary sources of Trp. It is found in foods that naturally contain protein, in dietetic and fortified food products, and in specific pharmaceutical formulations [3]. Nuts and seed oils are particularly rich in Trp [4,5]. Thus, detecting and quantifying this compound in vegetables is needed, but it is a significant analytical challenge [1].
Many analytical techniques have been recently investigated for Trp detection and quantification, including colorimetry [6,7,8,9], fluorimetry [10], voltammetry [11,12,13,14,15], capillary electrophoresis [16,17], gas chromatography–mass spectrometry (GC-MS) [18], high-performance liquid chromatography (HPLC) [19,20,21,22,23,24,25,26,27,28], and HPLC single [29] or tandem mass spectrometry (HPLC-MS/MS) [30,31,32,33,34,35]. Among these techniques, HPLC has been the most widely used due to its high selectivity and good sensitivity for quantifying Trp.
Since the complex matrix of food samples, which often contain large quantities of interfering substances, may influence the Trp content determination [36], a sample pre-treatment is necessary. Acid hydrolysis is used in the analytical protocols of most amino acids [36]. However, when determining protein-bound Trp in food samples, it was shown that good results could only be obtained after the preparation of samples by alkaline hydrolysis [23] or enzymatic hydrolysis [25]. In any case, an additional extraction step prior to instrumental measurements is unavoidable. Whereas protein-bound Trp can be determined if only a sample hydrolysis step is included in the sample preparation procedure, the hydrolysis may be omitted if the content of free Trp is determined [37].
Time-consuming solid-phase extraction (SPE) and conventional liquid–liquid extraction (LLE), which need a large quantity of potentially toxic solvents [38,39], are recently being replaced with greener, miniaturized sample preparation techniques [40,41,42]. Numerous methods have been developed for this purpose, of which dispersive liquid-liquid microextraction (DLLME) has proven to be effective, simple, fast, economical, and environmentally friendly [43,44,45,46].
Reversed-phase DLLME (RP-DLLME) is a new modification of DLLME in which an extraction solvent compatible with the HPLC mobile phase is used [47,48]. In RP-DLLME, a small volume of extraction solvent is rapidly dispersed in the hydrophobic sample solution using a dispersive solvent to form a fine droplet phase. The analytes partition into the aqueous extraction phase, which is then collected and analyzed. The aqueous phase can often be injected directly into an HPLC system. In this way, the time required for solvent evaporation is saved. RP-DLLME has recently been used for the enrichment and extraction of a wide range of analytes from various lipophilic sample matrices, including biological samples [49], cosmetics [50], and vegetable oils [51,52,53].
The recently introduced DLLME using a deep eutectic solvent (DES) has attracted tremendous attention [54,55,56,57,58]. DES represents a mixture of a hydrogen bond donor (HBD) and hydrogen bond acceptor (HBA). Owing to the hydrogen bond interactions, this mixture is able to self-associate and form a eutectic mixture with a lower melting point than those of the individual constituents [57]. Unlike traditional ionic liquids with similar extraction properties, these compounds are more environmentally friendly and cheaper. In addition, hydrophilic DESs have the advantage of being compatible with the RP-HPLC mobile phase [59].
This work investigates a new analytical method for separating and determining free Trp in an oily matrix using DES–RP-DLLME followed by an HPLC–diode array detector (DAD). The DES–RP-DLLME variables were optimized using the design of experiments (DoE) [60,61]. The method was validated and applied to determine free Trp in cold-pressed vegetable oils.
The novelty of this study lies in the development of a method for the determination of free Trp in cold-pressed oils using a combination of DoE-optimized DES–RP-DLLME and HPLC. It offers several advantages over conventional extraction techniques, including improved selectivity and reduced solvent consumption. A small volume of DES, used as the extraction solvent, provides additional benefits, including its low toxicity, biodegradability, and cost effectiveness, making it an environmentally friendly and efficient choice for sample preparation.

2. Results and Discussion

2.1. Selection of DESs

Seven hydrophilic DESs based on ChCl receptor bonds have been evaluated as candidates for the RP-DLLME extractant. Two DESs, ChCl:DA and ChCl:CA, were not clear liquids at room temperature.
FTIR spectra of these DESs placed in pressed KBr tablets are illustrated in Figure 1. A comparison between the spectrums ChCl and its DES mixtures was made in order to identify the changes in the structure and the new interactions between the constituents in the synthesized DESs. It can be noted that ChCl has retained its structure, as some of its peaks were also observed in the DES spectrums. The presence of water had an insignificant effect on the vibration frequencies in the formed ChCl:water DES [62]. The bands related to pure ChCl compared to those related to the DESs showed a small frequency deviation and change in bandwidth [63]. Thus, the positions of some characteristic ChCl peaks, symmetrical C-H stretch at 2800 cm−1, and asymmetric C-CH3 stretch at 3000 cm−1 were changed in the DESs
The OH vibration of the ChCl at 3200 cm−1 was shifted to 3400 cm−1. This shift and the broadening of the O-H vibration bands indicate the presence of hydrogen bonds between ChCl and donor compounds when the DES is formed. This may be attributed to the transfer of oxygen atom cloud electrons to hydrogen bonding [64]. The peak at 1000 cm−1 is indicative of the C-N vibration. The carboxylic group at 1700 cm−1 can be observed in ChCl:CA and ChCl:DA. In the spectra of ChCl:DA, a polyunsaturated fatty acid chain is represented by the band at 3000 cm−1 [65,66], while the frequencies of 1600 cm−1 indicate the vibration of N-H and C-N in ChCl:U. At 1100 cm−1, C-N bond vibration is shown.
These DESs were tested as the candidate solvent for RP-DLLME of Trp from oils. For this purpose, all experimental variables were set to the middle point in the RP-DLLME experimental domain (Table 1). Enrichment factor (EF), calculated as the ratio between the Trp concentration in the final DES solution (Cf) and the Trp concentration in the initial oil sample (Ci), was used to estimate the extraction recovery (ER) applying the following equation:
ER = 100 × EF × (Vf/Vi)
where Vi and Vf are the initial sample volume and the volume of the final reconstituted DES extract, respectively.
Figure 2 shows the comparison of ERs in RP-DLLME of Trp from spiked samples for seven DESs. It is obvious that ChCl:U is capable of extracting the highest amount of Trp from an oily matrix (68%). In addition, this DES gives a clear solution and is straightforward for RP-DLME. In general, the results revealed that ChCl:U was the most suitable DES compared to other ones.
ChCl:urea was able to extract free Trp from an oily matrix by a combination of several intermolecular forces [50]. One of the most important forces is the hydrogen bonding that occurs between the hydrogen atom of the hydroxyl group of choline chloride and the nitrogen and oxygen atoms of the functional groups of Trp. This interaction facilitates the transfer of Trp from the sample matrix to the Chl:urea phase. Another important force is the hydrophobic interaction that occurs between the hydrophobic alkyl chains of the ChCl:urea DES and the nonpolar side chains of Trp. This interaction promotes the partitioning of Trp from the sample matrix into the ChCl:urea phase because Trp prefers to interact with nonpolar molecules rather than polar molecules. Furthermore, some additional intermolecular forces, such as electrostatic and van der Waals forces, contribute to the extraction mechanism. Unlike other DESs, both the ChCl and urea components of the DES have the ability to form hydrogen bonds, which increases the solubilizing power for Trp. Indeed, Trp is an aromatic amino acid with polar and nonpolar moieties, which has a relatively high polarity due to the presence of amino and carboxyl groups and can form hydrogen bonds with the polar functional groups of ChCl and urea.

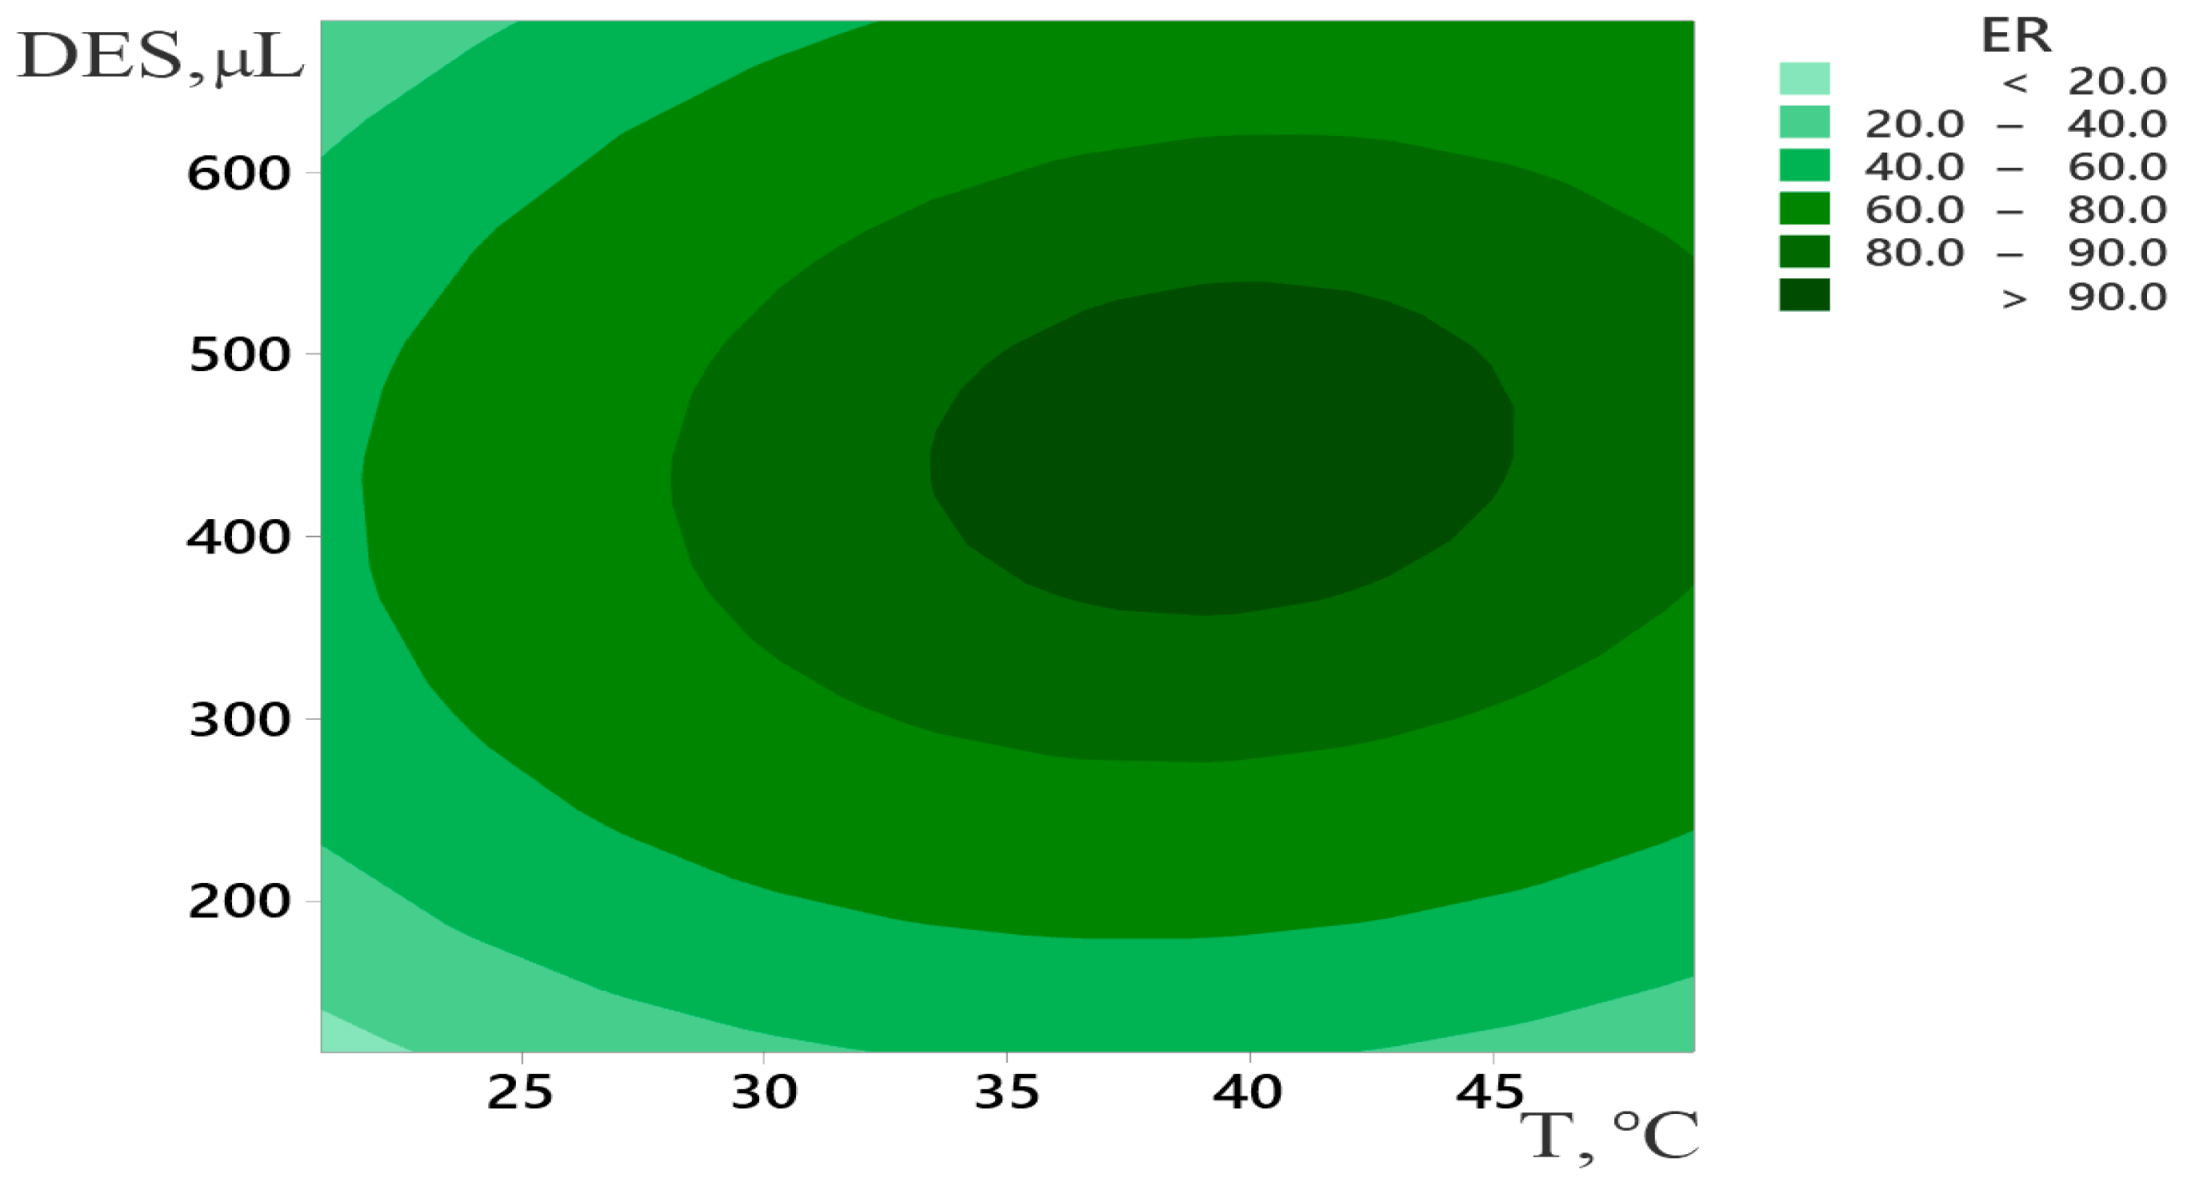
2.2. Optimization of DLLME Procedure

Optimal microextraction of Trp was obtained by optimizing eight RP-DLLME variables in two steps. At first, the data obtained from the PBD experiments were analyzed using the ANOVA test, and the results are shown in Table 2. This helped in precisely choosing the variables with the largest influence using a minimal number of experiments. Here, the temperature and the DES amount appeared to be the two most influential variables, with the highest F-values (30.8 and 12.1). It was also observed that increasing the diluting factor, the extraction time, the centrifugation rate, and decreasing the amount of added salt and the centrifugation time resulted in an increase in ER. At the same time, vortexing was found to give better results than sonicating.
The next step in the optimization used RSM to find the best ER from RP-DLLM of Trp. In this case, the experimental domain was extended to 700 μL of DES. Figure 3 presents the response surface plot of ER as a function of the temperature and the DES amount. This method included quadratic and interaction terms in the model. Therefore, it was possible to account for the detailed effects of selected variables on each other and also on ER.
Thus, the experimental data were fitted by a second-order polynomial model (Equation (2)), which consisted of two main effect terms, two two-factor interaction effect terms and two curvature effect terms. The regression equation is
ER = A + BT + CDES + DT2 + EDES2 + FTDES
where A (−144.2), B (7.92), C (0.3656), D (0.1087), E (−0.000472), and F (0.00147) terms were optimized iteratively to fit the model.
Finally, the optimized RP-DLLME variables may be summarized as follows: initial sample dilution ratio of 1:9, DES amount 450 μL, extraction time 3 min, extraction temperature 40 °C, no salt addition, vortex stirring type, centrifuge speed 6000 rpm, and centrifugation time 4 min.
Because samples containing a significant amount of tryptophan were analyzed in this study, an enrichment factor of 2.2 was sufficient for quantitative analysis.

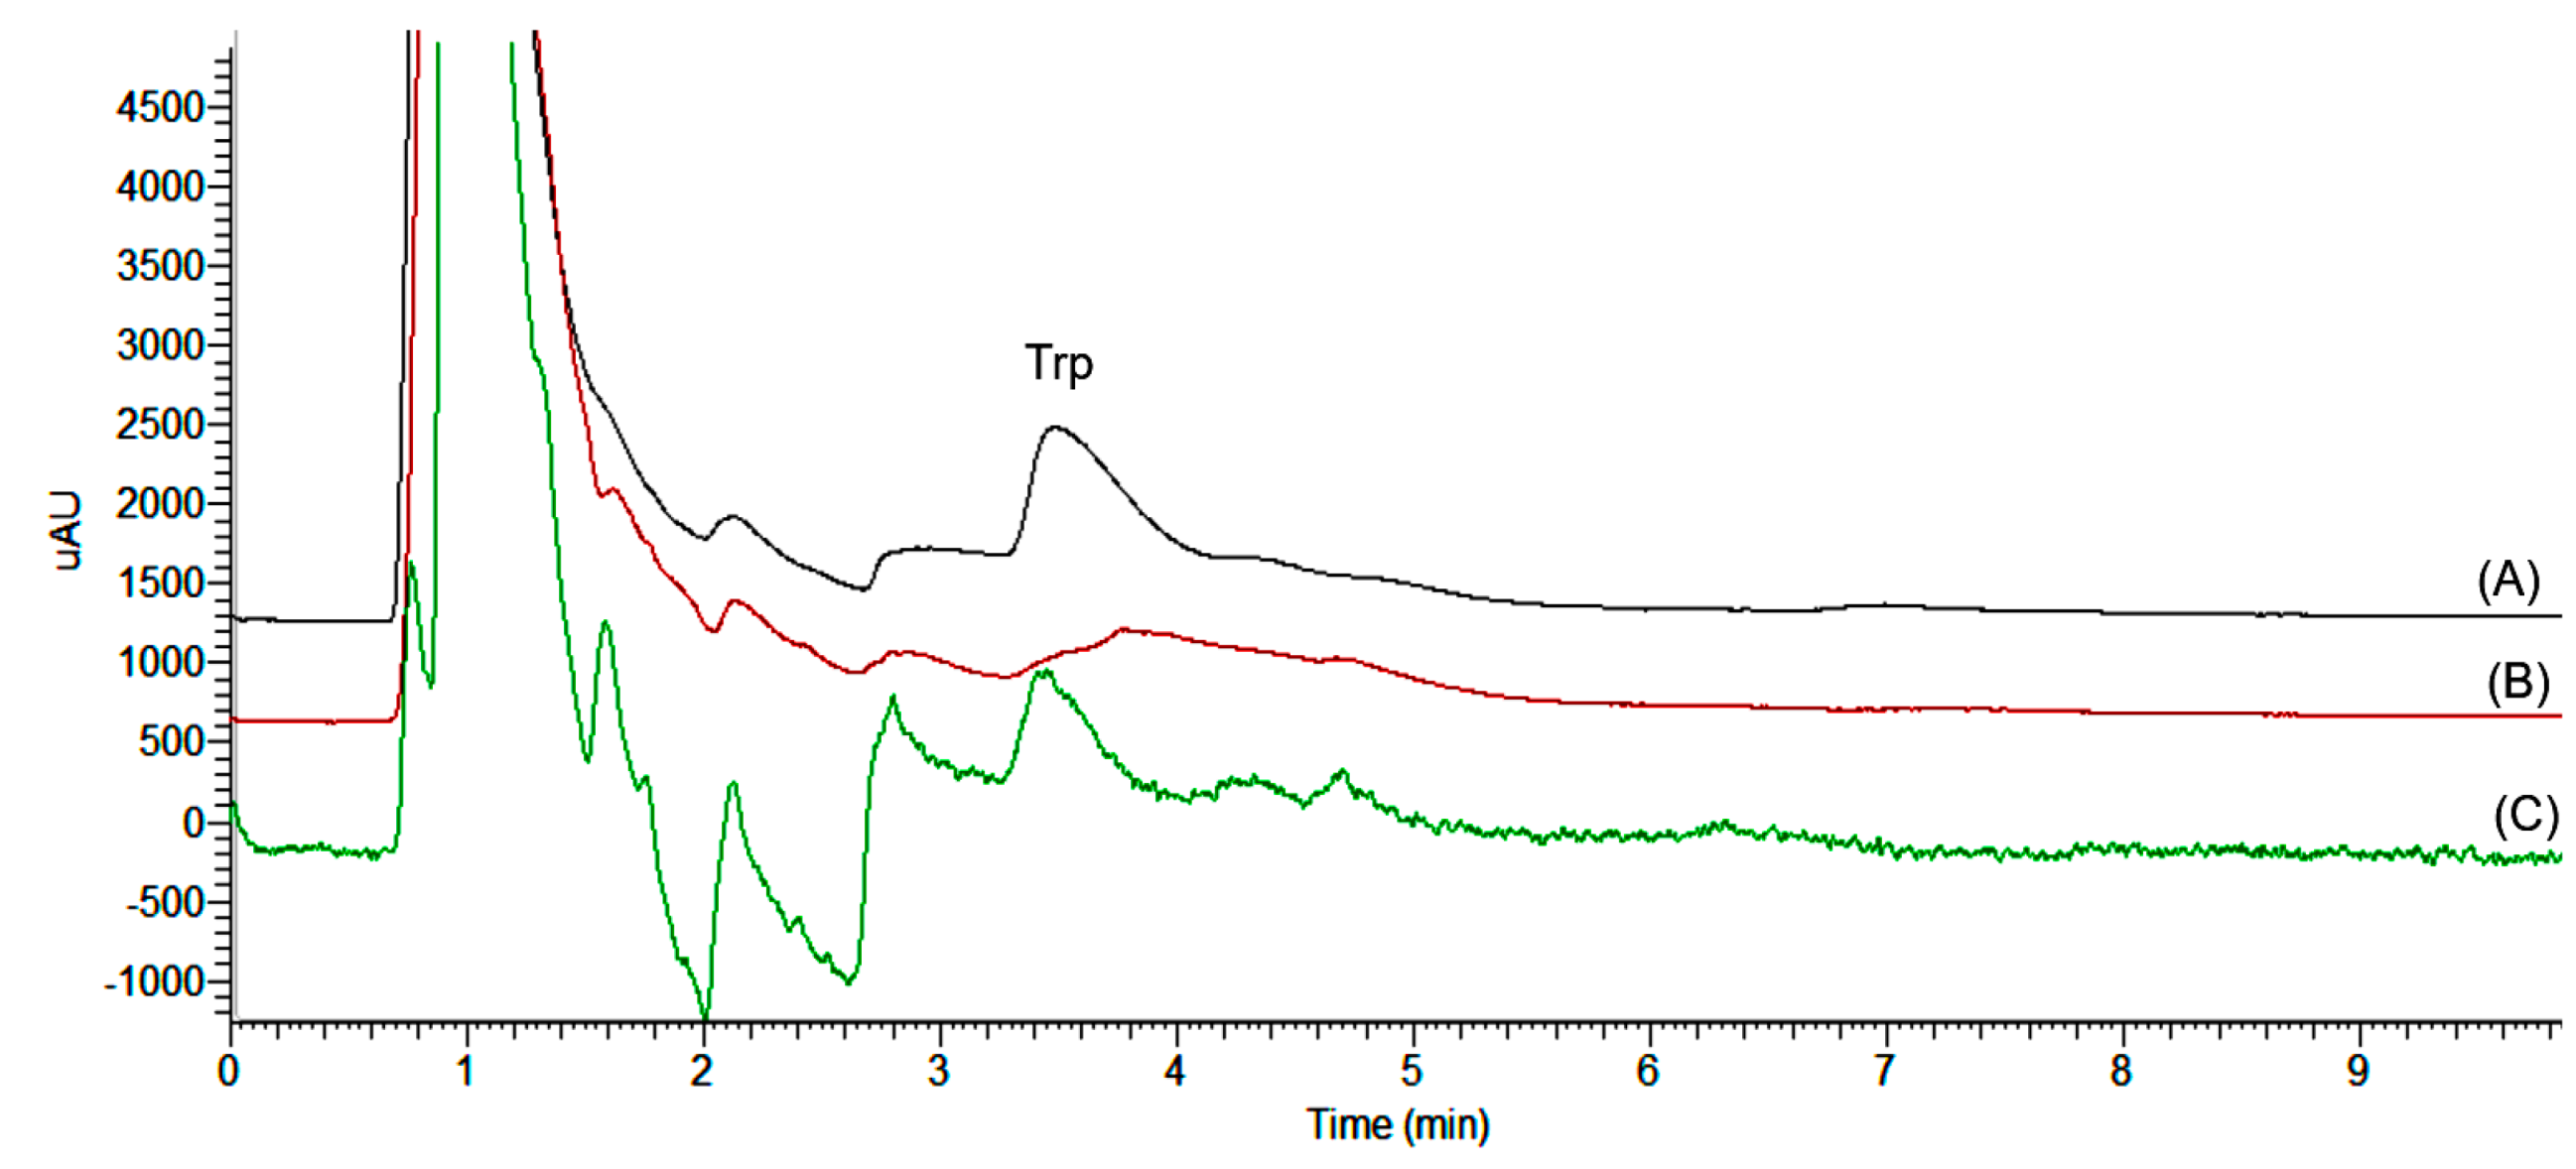
2.3. Validation of RP-DLLME-HPLC Method

Analytical figures of the current method were determined using spiked samples. A typical chromatogram obtained under the optimum DES-RP–DLLME–HPLC–DAD conditions for Trp in a cold-pressed almond oil sample is shown in Figure 4.
The method was validated by referring to US FDA official guidance [67]. The performance of the analytical method was evaluated by considering the recovery, precision, limit of detection (LOD), and matrix effect.
Six different calibration standards in the range of 10–400 mg/kg of Trp in methanol were analyzed by HPLC–DAD to obtain the linearity of the method. In addition, the matrix-matched standards at the same concentration levels were measured after RP-DLLME. The matrix effect (ME) was estimated by using the ratio between the slope of the calibration curve of the standards in methanol (b1 = 923,541) and the slope of the matrix-matched calibration curve (b2 = 775,774). In both cases, the linear correlation coefficients were r2 > 0.996. However, the estimated ME was 26%, which indicates a matrix-induced suppression of the analytical signal.
According to the FDA guideline, limit of detection (LOD) values should be ≥ten times lower than quantified concentrations in the 0.1–10,000 mg/kg range. The LOD value of Trp was selected to be the concentration that gave the signal-to-noise ratio (S/N = 3) for the Trp peak which was 11 mg/kg. This LOD value allows the determination of Trp in cold-pressed vegetable oils.
Precision was evaluated by determining the RSD of six replicate spiked samples at three concentrations (50, 200, and 400 mg/kg), and it was determined to be 9%, 6%, and 5%, respectively. The predicted relative reproducibility standard deviation acceptable by the FDA for the concentration levels of 10, 100, and 1000 mg/kg are 11, 8, and 6%, respectively.
The average recovery for the same spikes was found to be 91%, 94%, and 93%, respectively. The FDA required recoveries for a quantitative method at the concentration level of 100 mg/L to be 90–107%.

2.4. Critical Analysis of the Method Performances

Although hydrophilic ChCl-based DESs have recently been used as an extraction solvent for RP-DLLME [58,67,68,69], no published method has been found for DLLME of Trp from foods The proposed method for the determination of Trp in vegetable oils using DoE-optimized DES–RP-DLLME and HPLC has a unique combination of features that make it a highly efficient and environmentally friendly technique. Comparing the developed RP-DLLME method for free Trp determination in oil samples with other reported methodologies reveals its pros and cons (Table 3). Electroanalytical techniques such as voltammetry cannot compete with chromatographic techniques in terms of separation power. For the analysis of real samples of complex matrices, only HPLC and LC-MS can be used. The latter has a much higher sensitivity. However, the detector MS is complex and expensive, requires extensive sample preparation, and is often not available in a small laboratory. It is likely that the current HPLC method requires a simpler and less expensive procedure that increases labor while reducing analytical costs.
Unlike simple extraction or dilution in the analysis of hydrophilic samples, an oily matrix requires greater removal of interferences. An alternative technique to RP-DLLME, which can achieve lower LODs, is solid phase extraction (SPE). However, SPE consumes more organic solvents and requires an SPE manifold. Considering that sample cleanup is required for nuts and seed oils and the tryptophan concentration in the samples tested is high, the sensitivity of this method is quite acceptable.
In general, the green analytical chemistry (GAC) aspects of this method are its main advantages. All 12 GAC principles affecting the quality attributes of the analytical method were addressed here: green (G1. Toxicity of reagents, G2. Number and amount of reagents and waste, G3. Energy, G4. Direct impacts on the human), red (R1. Scope of application, R2. LOD and LOQ, R3. Precision, R4. Accuracy), and blue (B1. Cost-efficiency, B2. Time-efficiency, B3. Minimal requirements, B4. Operational simplicity).
Three greenness assessment approaches [70,71,72] were used to evaluate the environmental impact of this method: Analytical Eco-Scale, Green Analytical Procedure Index (GAPI), and Analytical Greenness metric (AGREE).
The Analytical Eco-Scale tool is used to assess the greenness level of analytical procedures in terms of the number of hazards. This method assigns penalty points for the amount and type of reagents used, hazards, energy consumed, and waste generated. The penalty points are then subtracted from a value of 100. It is considered an excellent green method if the method receives a score of ≥75. The method is considered inadequate if the Eco-scale value is less than 50. A high Eco-Scale score is primarily attributed to the amount and type of solvents consumed. The calculated penalty points (14) for our method resulted in an Eco-scale score of 86 out of 100, indicating that the developed method was excellent green (Supplementary Table S1).
GAPI evaluates the greenness level of an analytical method through five fields. Each field represents a different aspect of the developed method (Supplementary Table S2). Fields are colored green, yellow, or red depending on the ecological impact of each step. In this work, the GAPI pentagram had five green, seven yellow, and two red fields (Figure 5A). One of the red fields is because this method is not an in-, at-, or on-line method. Another pentagram is shaded red because sample preparation is required.
The AGREE method assesses the environmental impact of the method using a pictogram divided into twelve sections, which correspond to the twelve GAC principles. Each section and the middle zone of the AGREE pictogram is colored from green to red. According to the method greenness, the total score of the method is calculated and appears in the middle zone of the AGREE pictogram. The AGREE score in this study was 0.69 (Figure 5B), indicating that the method is environmentally friendly and has no negative impact on the environment.

2.5. Analysis of Real Samples

Five samples of each vegetable were purchased in different stories and analyzed (Supplementary Table S3). The analytical results of free Trp in different vegetable oils, using the DES–RP-DLLME–HPLC–DAD method, are presented in Table 4. The results, expressed in mg of Trp per 100 g of cold-pressed oils, are in the range between 11 and 38 mg/100 g oil.
Sunflower seed oil shows the highest average Trp concentration (38 mg/100 g), while cashew oil has the lowest (11 mg/100 g). Trp levels significantly differed among the nut and seed samples. In general, cold-pressed oils from seeds have higher Trp content than those from nuts.

3. Materials and Methods

3.1. Reagents and Chemicals

L-Tryptophan, reagent grade standard (≥98% purity), was purchased from Sigma-Aldrich Chemie GmbH (Taufkirchen, Germany). The stock solution (100 mg/kg) of Trp was prepared in methanol/deionized water (50:50 v/v). The working solutions were prepared by appropriately diluting the stock solution with methanol/deionized water (50:50 v/v). Methanol, acetonitrile (HPLC-grade), and sodium chloride (99%) were purchased from Merck KGaA, (Darmstadt, Germany). All standard solutions were stored at 4 °C and brought to an ambient temperature just prior to use.
Seven different types of DESs, at a molar ratio of 1:2, were prepared by mixing choline chloride:urea (ChCl:U), choline chloride:phenol (ChCl:Ph), choline chloride:citric acid (ChCl:CA), choline chloride:decanoic acid (ChCl:DA), choline chloride:glycerol (ChCl:G), choline chloride:ethylene glycol (ChCl:EG), and choline chloride:water (ChCl:W). The mixtures were stirred at 80 °C until DESs were formed. These DESs were used for RP-DLLME of Trp from vegetable oil samples.

3.2. Sample Preparation

Nine vegetable samples (sunflower seeds, sesame seeds, peanuts, cashews, Brazil nuts, pumpkin seeds, almonds, walnuts, and hazelnuts) underwent cold pressing using a press model VitaWAY OP650W (Gorenje d.o.o. Valjevo, Serbia), and the produced oils were stored at 4 °C until analysis. Trp was extracted from the oils using the following RP-DLLME procedure (Figure 6).
First, a 1.0 g sample measured in a 15 mL amber glass centrifuge tube was diluted to an appropriate ratio by adding n-hexane. Next, a volume of a DES, as the extractant, was rapidly added to the sample solution. The resulting mixture was vigorously shaken using a vortex agitator or ultrasonic bath. After centrifugation, two clear phases were observed, and the DES phase containing the extracted Trp was settled at the bottom of the tube. Next, an aliquot of the DES phase (lower phase) was withdrawn through a syringe and diluted with methanol. Finally, 5 µL of this solution was injected into an HPLC–DAD system for measurement. Spiked samples were prepared by adding an appropriate amount of Trp into a linoleic acid/oleic acid (1:1) mixture and processed in the same way.
A vortex (IKA model MS2 Mixer, IKA-Werke GmbH, Staufen, Germany) or ultrasonic bath (model Eumax 3L 100W, Skymen Cleaning Equipment Co. Ltd., Shenzhen, China) was used for mixing, whereas the phase separation was performed using a centrifuge (model Colo Lace16AS, Colo d.o.o., Rogatska Slatina, Slovenia). The extraction was performed in a temperature-controlled, shaking water bath (Memmert, model WNB 14, Memmert GmbH, Schwabach, Germany). Fourier-transform infrared (FTIR) spectra of the DESs were recorded in the wavelength range from 500 to 4000 cm−1 on a Thermo model Nicolet iS10 FTIR spectrometer equipped with the Omnic software (Thermo Electron Scientific Instruments LLC, Madison, WI, USA).

3.3. RP-DLLME Optimization

The RP-DLLME procedure has been optimized using the Plackett–Burman screening design (PBD) [46] for variable selection, followed by the central composite design (CCD) [45] used to find the optimal values for the variables. Table 1 shows the eight investigated RP-DLLME variables and their ranges.
After PBD screening experiments, thew variables that significantly influenced the RP-DLLME process were optimized following a response surface methodology using CCD.

3.4. HPLC Measurements

The Trp quantification was performed using an HPLC system comprising a pump, autosampler, and diode array detector (model Accela, Thermo Fisher Scientific Inc., Waltham, MA, USA). Isocratic elution at a 1.0 mL/min flow rate was used on a Thermo Scientific Hypersil ODS (C18) Column (5 μm particle size, length 100 mm, 4.6 mm I.D.) at 35 °C. The mobile phase consisted of methanol:water (with 1% acetic acid) (40:60 v/v). The DAD spectrum was continuously recorded along with UV detection at a wavelength of 280 nm. The retention time for Trp was 3.54 min.

3.5. Method Validation
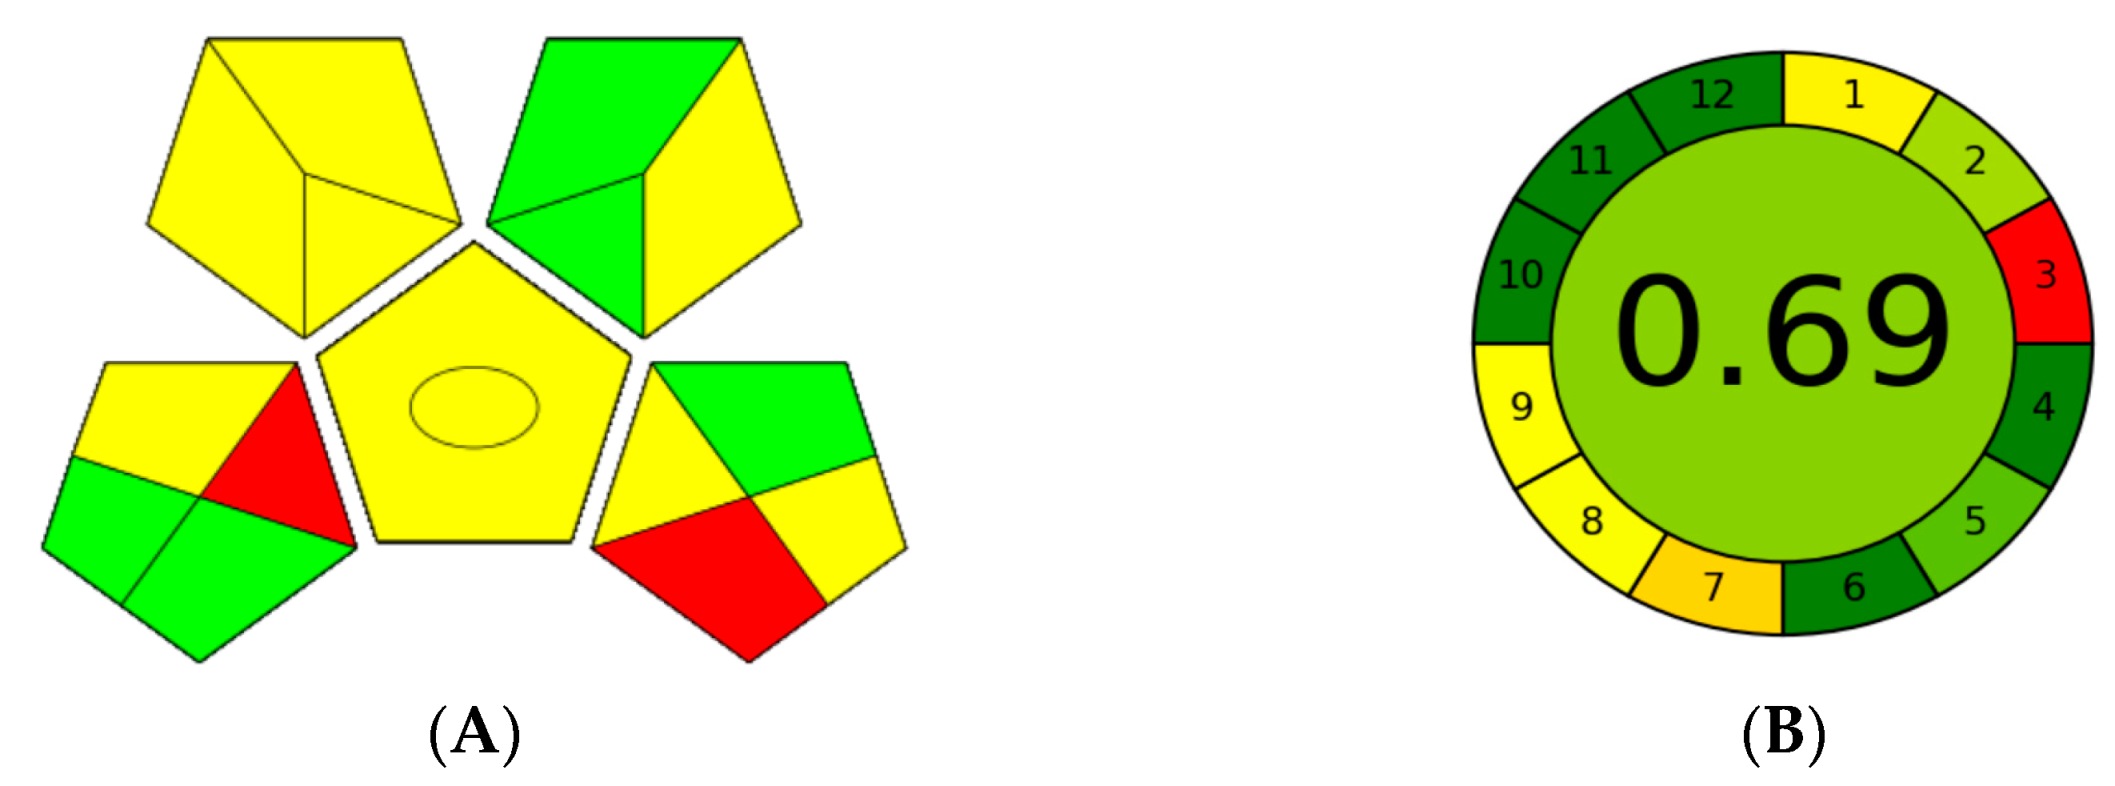
Analytical method validation was conducted using a mixture of linoleic:oleic (1:1) acids spiked with Trp at different levels. Linearity and the matrix effect were determined using calibration standards in methanol and matrix-matched standards. Recovery and relative standard deviation (RSD) values were determined using the spiked replicate samples.

3.6. Software

Statistical analysis for Plackett–Burman (PBD) design and ANOVA test was conducted using a software package of Minitab (release ver. 13.20).

4. Conclusions

RP-DLLME combined with HPLC–DAD was developed to determine the free Trp content of cold-pressed nuts and seed oils. A DES solvent comprised of choline chloride and urea was found as the most suitable. Plackett–Burman screening DoE, followed by the central composite RSM, was employed to estimate the optimum RP-DLLME conditions that yield the maximum extraction efficiency. Good analytical recovery and RSD for the method were obtained by analyzing spiked replicates. Applying this method, free Trp was determined in cold-pressed oils from cashews, walnuts, Brazil nuts, almonds, hazelnuts, peanuts, pumpkin seeds, sesame seeds, and sunflower seeds at the levels of 11, 12, 14, 16, 17, 18, 32, 33, and 38 mg/100 g, respectively. The findings of this study suggest that the use of DES-based methods for extraction and analysis of target analytes in complex food matrices can contribute to sustainable development in the analytical chemistry and food industry and may serve as a model for the development of greener and more sustainable food analytical methods in the future.

Supplementary Materials

The following supporting information can be downloaded at: https://www.mdpi.com/article/10.3390/molecules28052395/s1, Tables S1: Analytical eco-scale of the DES-RP-DLLME-HPLC method for tryptophan in oils. Table S2: GAPI of the DES-RP-DLLME-HPLC method for tryptophan in oils. Table S3: The content of tryptophan in nut vegetables from the following stores: A. JEZGRO (address: Ruzveltova 24, Belgrade); B. BIO ŠPAJZ (address: Bulevar Kralja Aleksandra 297, Belgrade); C. ZDRAVAC (address: Čumićevo sokače, Lokal 45, Belgrade); D. BIO MARKET (address: Svetogorska 18, Belgrade); E. DREN (address: Bulevar Despota Stefana 90, Belgrade); F. BIO SHOP (address: Braće Jerković 116, Belgrade); G. (address: EFEDRA, Prvomajska 8k, Zemun).

Author Contributions

Conceptualization, A.O.; methodology, J.L.; software, J.L.; validation, T.B.; investigation, T.B.; resources, A.T.; data curation, T.B.; writing—original draft preparation, A.O.; writing—review and editing, S.R.; visualization, A.T.; project administration, S.R.; funding acquisition, A.T. All authors have read and agreed to the published version of the manuscript.

Funding

This research was funded by the Ministry of Education, Science, and Technological Development, Republic of Serbia (Contract Nos. 451-03-47/2023-01/200161, 451-03-47/2023-01/200135 and 451-03-47/2023-01/200287).

Institutional Review Board Statement

Not applicable.

Informed Consent Statement

Not applicable.

Data Availability Statement

Data presented in this article are available upon request from the corresponding authors.

Acknowledgments

This article is supported by the Study Group Sample Preparation of the Division of Analytical Chemistry of the European Chemical Society (DAC-EuChemS).

Conflicts of Interest

The authors declare no conflict of interest. The funders had no role in the design of the study; in the collection, analyses, or interpretation of data; in the writing of the manuscript; or in the decision to publish the results.

References

  1. Friedman, M. Analysis, Nutrition, and Health Benefits of Tryptophan. Int. J. Tryptophan Res. 2018, 11, 1178646918802282. [Google Scholar] [CrossRef] [PubMed] [Green Version]
  2. Comai, S.; Bertazzo, A.; Brughera, M.; Crotti, S. Tryptophan in Health and Disease. In Advances in Clinical Chemistry; Elsevier: Amsterdam, The Netherlands, 2020; Volume 95, pp. 165–218. ISBN 978-0-12-821165-6. [Google Scholar]
  3. Strasser, B.; Gostner, J.M.; Fuchs, D. Mood, Food, and Cognition: Role of Tryptophan and Serotonin. Curr. Opin. Clin. Nutr. Metab. Care 2016, 19, 55–61. [Google Scholar] [CrossRef] [PubMed]
  4. Venkatachalam, M.; Sathe, S.K. Chemical Composition of Selected Edible Nut Seeds. J. Agric. Food Chem. 2006, 54, 4705–4714. [Google Scholar] [CrossRef] [PubMed]
  5. Garcia-Aloy, M.; Hulshof, P.J.M.; Estruel-Amades, S.; Osté, M.C.J.; Lankinen, M.; Geleijnse, J.M.; de Goede, J.; Ulaszewska, M.; Mattivi, F.; Bakker, S.J.L.; et al. Biomarkers of Food Intake for Nuts and Vegetable Oils: An Extensive Literature Search. Genes Nutr. 2019, 14, 7. [Google Scholar] [CrossRef] [Green Version]
  6. Pinter-Szakacs, M.; Molnar-Perl, I. Determination of Tryptophan in Unhydrolyzed Food and Feedstuffs by the Acid Ninhydrin Method. J. Agric. Food Chem. 1990, 38, 720–726. [Google Scholar] [CrossRef]
  7. Wu, Y.; Wang, T.; Zhang, C.; Xing, X.-H. A Rapid and Specific Colorimetric Method for Free Tryptophan Quantification. Talanta 2018, 176, 604–609. [Google Scholar] [CrossRef]
  8. Hosokawa, S.; Morinishi, T.; Ohara, K.; Yamaguchi, K.; Tada, S.; Tokuhara, Y. A Spectrophotometric Method for the Determination of Tryptophan Following Oxidation by the Addition of Sodium Hypochlorite Pentahydrate. PLoS ONE 2023, 18, e0279547. [Google Scholar] [CrossRef]
  9. Li, L.; Luo, Y.; Jia, L. Genetically Engineered Bacterium-Modified Magnetic Particles Assisted Chiral Recognition and Colorimetric Determination of D/L-Tryptophan in Millets. Food Chem. 2023, 407, 135125. [Google Scholar] [CrossRef]
  10. Fernández, L.G.; Vera-López, S.; Díez-Pascual, A.M.; San Andrés, M.P. Easy, Fast, and Clean Fluorescence Analysis of Tryptophan with Clays and Graphene/Clay Mixtures. J. Food Compos. Anal. 2022, 114, 104858. [Google Scholar] [CrossRef]
  11. Lima, D.; Andrade Pessôa, C.; Wohnrath, K.; Humberto Marcolino-Junior, L.; Fernando Bergamini, M. A Feasible and Efficient Voltammetric Sensor Based on Electropolymerized L-Arginine for the Detection of L-Tryptophan in Dietary Supplements. Microchem. J. 2022, 181, 107709. [Google Scholar] [CrossRef]
  12. Khoshsafar, H.; Bagheri, H.; Hashemi, P.; Bordbar, M.M.; Madrakian, T.; Afkhami, A. Combination of an Aptamer-Based Immunochromatography Assay with Nanocomposite-Modified Screen-Printed Electrodes for Discrimination and Simultaneous Determination of Tryptophan Enantiomers. Talanta 2023, 253, 124090. [Google Scholar] [CrossRef]
  13. Tasić, Ž.Z.; Mihajlović, M.B.P.; Radovanović, M.B.; Simonović, A.T.; Medić, D.V.; Antonijević, M.M. Electrochemical Determination of L-Tryptophan in Food Samples on Graphite Electrode Prepared from Waste Batteries. Sci. Rep. 2022, 12, 5469. [Google Scholar] [CrossRef]
  14. Rezaei, F.; Ashraf, N.; Zohuri, G.H. A Smart Electrochemical Sensor Based upon Hydrophilic Core–Shell Molecularly Imprinted Polymer for Determination of L-Tryptophan. Microchem. J. 2023, 185, 108260. [Google Scholar] [CrossRef]
  15. Alam, I.; Lertanantawong, B.; Sutthibutpong, T.; Punnakitikashem, P.; Asanithi, P. Molecularly Imprinted Polymer-Amyloid Fibril-Based Electrochemical Biosensor for Ultrasensitive Detection of Tryptophan. Biosensors 2022, 12, 291. [Google Scholar] [CrossRef]
  16. Forteschi, M.; Sotgia, S.; Assaretti, S.; Arru, D.; Cambedda, D.; Sotgiu, E.; Zinellu, A.; Carru, C. Simultaneous Determination of Aromatic Amino Acids in Human Blood Plasma by Capillary Electrophoresis with UV-Absorption Detection: Other Techniques. J. Sep. Sci. 2015, 38, 1794–1799. [Google Scholar] [CrossRef]
  17. Jastrzębska, A.; Kowalska, S.; Szłyk, E. Determination of Free Tryptophan in Beer Samples by Capillary Isotachophoretic Method. Food Anal. Methods 2020, 13, 850–862. [Google Scholar] [CrossRef] [Green Version]
  18. Michalczuk, L.; Bialek, K.; Cohen, J.D. Rapid Determination of Free Tryptophan in Plant Samples by Gas Chromatography-Selected Ion Monitoring Mass Spectrometry. J. Chromatogr. A 1992, 596, 294–298. [Google Scholar] [CrossRef]
  19. Zhu, Y.; Yang, Y.; Zhou, Z.; Li, G.; Jiang, M.; Zhang, C.; Chen, S. Direct Determination of Free Tryptophan Contents in Soy Sauces and Its Application as an Index of Soy Sauce Adulteration. Food Chem. 2010, 118, 159–162. [Google Scholar] [CrossRef]
  20. Lomenova, A.; Hroboňová, K. Application of Achiral–Chiral Two-dimensional HPLC for Separation of Phenylalanine and Tryptophan Enantiomers in Dietary Supplement. Biomed. Chromatogr. 2021, 35, e4972. [Google Scholar] [CrossRef]
  21. Draher, J.; White, N. HPLC Determination of Total Tryptophan in Infant Formula and Adult/Pediatric Nutritional Formula Following Enzymatic Hydrolysis: Single-Laboratory Validation, First Action 2017.03. J. AOAC Int. 2018, 101, 824–830. [Google Scholar] [CrossRef]
  22. Yust, M.M.; Pedroche, J.; Girón-Calle, J.; Vioque, J.; Millán, F.; Alaiz, M. Determination of Tryptophan by High-Performance Liquid Chromatography of Alkaline Hydrolysates with Spectrophotometric Detection. Food Chem. 2004, 85, 317–320. [Google Scholar] [CrossRef]
  23. ISO 13904; Animal Feeding Stuffs—Determination of Tryptophan Content. 2005. Available online: https://www.iso.org/standard/37259.html (accessed on 2 March 2023).
  24. Ravindran, G.; Ravindran, V.; Bryden, W.L. Total and Ileal Digestible Tryptophan Contents of Feedstuffs for Broiler Chickens. J. Sci. Food Agric. 2006, 86, 1132–1137. [Google Scholar] [CrossRef]
  25. Allred, M.C.; Macdonald, J.L. Determination of Sulfur Amino Acids and Tryptophan in Foods and Food and Feed Ingredients: Collaborative Study. J. AOAC Int. 1988, 71, 603–606. [Google Scholar] [CrossRef]
  26. Ravindran, G.; Bryden, W.L. Tryptophan Determination in Proteins and Feedstuffs by Ion Exchange Chromatography. Food Chem. 2005, 89, 309–314. [Google Scholar] [CrossRef]
  27. Ritota, M.; Manzi, P. Rapid Determination of Total Tryptophan in Yoghurt by Ultra High Performance Liquid Chromatography with Fluorescence Detection. Molecules 2020, 25, 5025. [Google Scholar] [CrossRef]
  28. Zhang, J.; Xue, X.; Zhou, J.; Chen, F.; Wu, L.; Li, Y.; Zhao, J. Determination of Tryptophan in Bee Pollen and Royal Jelly by High-Performance Liquid Chromatography with Fluorescence Detection. Biomed. Chromatogr. 2009, 23, 994–998. [Google Scholar] [CrossRef]
  29. la Cour, R.; Jørgensen, H.; Schjoerring, J.K. Improvement of Tryptophan Analysis by Liquid Chromatography-Single Quadrupole Mass Spectrometry Through the Evaluation of Multiple Parameters. Front. Chem. 2019, 7, 797. [Google Scholar] [CrossRef]
  30. Protti, M.; Cirrincione, M.; Mandrioli, R.; Rudge, J.; Regazzoni, L.; Valsecchi, V.; Volpi, C.; Mercolini, L. Volumetric Absorptive Microsampling (VAMS) for Targeted LC-MS/MS Determination of Tryptophan-Related Biomarkers. Molecules 2022, 27, 5652. [Google Scholar] [CrossRef]
  31. Boulet, L.; Faure, P.; Flore, P.; Montérémal, J.; Ducros, V. Simultaneous Determination of Tryptophan and 8 Metabolites in Human Plasma by Liquid Chromatography/Tandem Mass Spectrometry. J. Chromatogr. B 2017, 1054, 36–43. [Google Scholar] [CrossRef]
  32. Soto, M.E.; Ares, A.M.; Bernal, J.; Nozal, M.J.; Bernal, J.L. Simultaneous Determination of Tryptophan, Kynurenine, Kynurenic and Xanthurenic Acids in Honey by Liquid Chromatography with Diode Array, Fluorescence and Tandem Mass Spectrometry Detection. J. Chromatogr. A 2011, 1218, 7592–7600. [Google Scholar] [CrossRef]
  33. Su, M.; Cheng, Y.; Zhang, C.; Zhu, D.; Jia, M.; Zhang, Q.; Wu, H.; Chen, G. Determination of the Levels of Tryptophan and 12 Metabolites in Milk by Liquid Chromatography-Tandem Mass Spectrometry with the QuEChERS Method. J. Dairy Sci. 2020, 103, 9851–9859. [Google Scholar] [CrossRef]
  34. Vitalini, S.; Dei Cas, M.; Rubino, F.M.; Vigentini, I.; Foschino, R.; Iriti, M.; Paroni, R. LC-MS/MS-Based Profiling of Tryptophan-Related Metabolites in Healthy Plant Foods. Molecules 2020, 25, 311. [Google Scholar] [CrossRef] [Green Version]
  35. Weber, P. Determination of Amino Acids in Food and Feed by Microwave Hydrolysis and UHPLC-MS/MS. J. Chromatogr. B 2022, 1209, 123429. [Google Scholar] [CrossRef]
  36. Cooper, C.; Packer, N.; Williams, K. Amino Acid Analysis Protocols; Methods in Molecular Biology; Humana Press: Totowa, NJ, USA, 2000; Volume 159, ISBN 978-1-59259-047-6. [Google Scholar]
  37. Taş, N.G.; Yılmaz, C.; Gökmen, V. Investigation of Serotonin, Free and Protein-Bound Tryptophan in Turkish Hazelnut Varieties and Effect of Roasting on Serotonin Content. Food Res. Int. 2019, 120, 865–871. [Google Scholar] [CrossRef]
  38. Faraji, M.; Yamini, Y.; Gholami, M. Recent Advances and Trends in Applications of Solid-Phase Extraction Techniques in Food and Environmental Analysis. Chromatographia 2019, 82, 1207–1249. [Google Scholar] [CrossRef]
  39. Lukić, J.; Radulović, J.; Lučić, M.; Đurkić, T.; Onjia, A. Chemometric Optimization of Solid-Phase Extraction Followed by Liquid Chromatography-Tandem Mass Spectrometry and Probabilistic Risk Assessment of Ultraviolet Filters in an Urban Recreational Lake. Front. Environ. Sci. 2022, 10, 916916. [Google Scholar] [CrossRef]
  40. Rutkowska, M.; Płotka-Wasylka, J.; Sajid, M.; Andruch, V. Liquid–Phase Microextraction: A Review of Reviews. Microchem. J. 2019, 149, 103989. [Google Scholar] [CrossRef]
  41. Lukić, J.; Đurkić, T.; Onjia, A. Dispersive Liquid–Liquid Microextraction and Monte Carlo Simulation of Margin of Safety for Octocrylene, EHMC, 2ES, and Homosalate in Sunscreens. Biomed. Chromatogr. 2023, e5590. [Google Scholar] [CrossRef]
  42. Mohammadi, A.; Barzegar, F.; Kamankesh, M.; Mousavi Khaneghah, A. Heterocyclic Aromatic Amines in Doner Kebab: Quantitation Using an Efficient Microextraction Technique Coupled with Reversed-phase High-performance Liquid Chromatography. Food Sci. Nutr. 2020, 8, 88–96. [Google Scholar] [CrossRef] [Green Version]
  43. Wang, Y.; Li, J.; Ji, L.; Chen, L. Simultaneous Determination of Sulfonamides Antibiotics in Environmental Water and Seafood Samples Using Ultrasonic-Assisted Dispersive Liquid-Liquid Microextraction Coupled with High Performance Liquid Chromatography. Molecules 2022, 27, 2160. [Google Scholar] [CrossRef]
  44. Han, Q.; Liu, Y.; Huo, Y.; Li, D.; Yang, X. Determination of Ultra-Trace Cobalt in Water Samples Using Dispersive Liquid-Liquid Microextraction Followed by Graphite Furnace Atomic Absorption Spectrometry. Molecules 2022, 27, 2694. [Google Scholar] [CrossRef] [PubMed]
  45. Slavković-Beškoski, L.; Ignjatović, L.; Bolognesi, G.; Maksin, D.; Savić, A.; Vladisavljević, G.; Onjia, A. Dispersive Solid–Liquid Microextraction Based on the Poly(HDDA)/Graphene Sorbent Followed by ICP-MS for the Determination of Rare Earth Elements in Coal Fly Ash Leachate. Metals 2022, 12, 791. [Google Scholar] [CrossRef]
  46. Tadić, T.; Marković, B.; Radulović, J.; Lukić, J.; Suručić, L.; Nastasović, A.; Onjia, A. A Core-Shell Amino-Functionalized Magnetic Molecularly Imprinted Polymer Based on Glycidyl Methacrylate for Dispersive Solid-Phase Microextraction of Aniline. Sustainability 2022, 14, 9222. [Google Scholar] [CrossRef]
  47. Sereshti, H.; Karimi, M.; Samadi, S. Application of Response Surface Method for Optimization of Dispersive Liquid–Liquid Microextraction of Water-Soluble Components of Rosa damascena Mill. Essential Oil. J. Chromatogr. A 2009, 1216, 198–204. [Google Scholar] [CrossRef] [PubMed]
  48. Hashemi, P.; Raeisi, F.; Ghiasvand, A.R.; Rahimi, A. Reversed-Phase Dispersive Liquid–Liquid Microextraction with Central Composite Design Optimization for Preconcentration and HPLC Determination of Oleuropein. Talanta 2010, 80, 1926–1931. [Google Scholar] [CrossRef]
  49. Wang, Q.F.; Liang, L.J.; Sun, J.B.; Zhou, J. Application of a Reversed-Phase Ionic Liquid Dispersive Liquid-Liquid Microextraction Method for the Extraction and Preconcentration of Domoic Acid from Urine Samples. Heliyon 2022, 8, e10152. [Google Scholar] [CrossRef]
  50. Schettino, L.; García-Juan, A.; Fernández-Lozano, L.; Benedé, J.L.; Chisvert, A. Trace Determination of Prohibited Acrylamide in Cosmetic Products by Vortex-Assisted Reversed-Phase Dispersive Liquid-Liquid Microextraction and Liquid Chromatography-Tandem Mass Spectrometry. J. Chromatogr. A 2023, 1687, 463651. [Google Scholar] [CrossRef]
  51. Hassan, M.; Erbas, Z.; Alshana, U.; Soylak, M. Ligandless Reversed-Phase Switchable-Hydrophilicity Solvent Liquid–Liquid Microextraction Combined with Flame-Atomic Absorption Spectrometry for the Determination of Copper in Oil Samples. Microchem. J. 2020, 156, 104868. [Google Scholar] [CrossRef]
  52. Shishov, A.; Volodina, N.; Semenova, E.; Navolotskaya, D.; Ermakov, S.; Bulatov, A. Reversed-Phase Dispersive Liquid-Liquid Microextraction Based on Decomposition of Deep Eutectic Solvent for the Determination of Lead and Cadmium in Vegetable Oil. Food Chem. 2022, 373, 131456. [Google Scholar] [CrossRef]
  53. Ferreira, V.J.; Lemos, V.A.; Teixeira, L.S.G. Dynamic Reversed-Phase Liquid-Liquid Microextraction for the Determination of Cd, Cr, Mn, and Ni in Vegetable Oils by Energy Dispersive X-Ray Fluorescence Spectrometry. J. Food Compos. Anal. 2023, 117, 105098. [Google Scholar] [CrossRef]
  54. Ma, S.; Li, F.; Liu, L.; Liao, L.; Chang, L.; Tan, Z. Deep-Eutectic Solvents Simultaneously Used as the Phase-Forming Components and Chiral Selectors for Enantioselective Liquid-Liquid Extraction of Tryptophan Enantiomers. J. Mol. Liq. 2020, 319, 114106. [Google Scholar] [CrossRef]
  55. Santos, L.B.; Assis, R.S.; Barreto, J.A.; Bezerra, M.A.; Novaes, C.G.; Lemos, V.A. Deep Eutectic Solvents in Liquid-Phase Microextraction: Contribution to Green Chemistry. TrAC Trends Anal. Chem. 2022, 146, 116478. [Google Scholar] [CrossRef]
  56. Wang, H.; Huang, X.; Qian, H.; Lu, R.; Zhang, S.; Zhou, W.; Gao, H.; Xu, D. Vortex-Assisted Deep Eutectic Solvent Reversed-Phase Liquid–Liquid Microextraction of Triazine Herbicides in Edible Vegetable Oils. J. Chromatogr. A 2019, 1589, 10–17. [Google Scholar] [CrossRef]
  57. Hansen, B.B.; Spittle, S.; Chen, B.; Poe, D.; Zhang, Y.; Klein, J.M.; Horton, A.; Adhikari, L.; Zelovich, T.; Doherty, B.W.; et al. Deep Eutectic Solvents: A Review of Fundamentals and Applications. Chem. Rev. 2021, 121, 1232–1285. [Google Scholar] [CrossRef]
  58. Cao, J.; Wang, C.; Shi, L.; Cheng, Y.; Hu, H.; Zeng, B.; Zhao, F. Water Based-Deep Eutectic Solvent for Ultrasound-Assisted Liquid–Liquid Microextraction of Parabens in Edible Oil. Food Chem. 2022, 383, 132586. [Google Scholar] [CrossRef]
  59. Xie, Q.; Xia, M.; Lu, H.; Shi, H.; Sun, D.; Hou, B.; Jia, L.; Li, D. Deep Eutectic Solvent-Based Liquid-Liquid Microextraction for the HPLC-DAD Analysis of Bisphenol A in Edible Oils. J. Mol. Liq. 2020, 306, 112881. [Google Scholar] [CrossRef]
  60. Heidari, H.; Ghanbari-Rad, S.; Habibi, E. Optimization Deep Eutectic Solvent-Based Ultrasound-Assisted Liquid-Liquid Microextraction by Using the Desirability Function Approach for Extraction and Preconcentration of Organophosphorus Pesticides from Fruit Juice Samples. J. Food Compos. Anal. 2020, 87, 103389. [Google Scholar] [CrossRef]
  61. Lučić, M.; Sredović Ignjatović, I.; Lević, S.; Pećinar, I.; Antić, M.; Đurđić, S.; Onjia, A. Ultrasound-assisted Extraction of Essential and Toxic Elements from Pepper in Different Ripening Stages Using Box–Behnken Design. Food Process. Preserv. 2022, 46, e16493. [Google Scholar] [CrossRef]
  62. Du, C.; Zhao, B.; Chen, X.-B.; Birbilis, N.; Yang, H. Effect of Water Presence on Choline Chloride-2urea Ionic Liquid and Coating Platings from the Hydrated Ionic Liquid. Sci. Rep. 2016, 6, 29225. [Google Scholar] [CrossRef] [Green Version]
  63. Banjare, M.K.; Behera, K.; Satnami, M.L.; Pandey, S.; Ghosh, K.K. Self-Assembly of a Short-Chain Ionic Liquid within Deep Eutectic Solvents. RSC Adv. 2018, 8, 7969–7979. [Google Scholar] [CrossRef]
  64. Khezeli, T.; Daneshfar, A.; Sahraei, R. A Green Ultrasonic-Assisted Liquid–Liquid Microextraction Based on Deep Eutectic Solvent for the HPLC-UV Determination of Ferulic, Caffeic and Cinnamic Acid from Olive, Almond, Sesame and Cinnamon Oil. Talanta 2016, 150, 577–585. [Google Scholar] [CrossRef] [PubMed]
  65. dos Santos, C.; Padilha, C.; Damasceno, K.; Leite, P.; de Araújo, A.; Freitas, P.; Vieira, É.; Cordeiro, A.; de Sousa, F., Jr.; de Assis, C. Astaxanthin Recovery from Shrimp Residue by Solvent Ethanol Extraction Using Choline Chloride:Glycerol Deep Eutectic Solvent as Adjuvant. J. Braz. Chem. Soc. 2021, 32, 1030–1039. [Google Scholar] [CrossRef]
  66. Ijardar, S.P.; Singh, V.; Gardas, R.L. Revisiting the Physicochemical Properties and Applications of Deep Eutectic Solvents. Molecules 2022, 27, 1368. [Google Scholar] [CrossRef] [PubMed]
  67. FDA. FDA Guidelines for the Validation of Chemical Methods for the FDA Foods Program, 3rd ed.; FDA: Silver Spring, MD, USA, 2019.
  68. Karimi, M.; Shabani, A.M.H.; Dadfarnia, S. Deep Eutectic Solvent-Mediated Extraction for Ligand-Less Preconcentration of Lead and Cadmium from Environmental Samples Using Magnetic Nanoparticles. Microchim. Acta 2016, 183, 563–571. [Google Scholar] [CrossRef]
  69. Liu, W.; Zong, B.; Wang, X.; Yang, G.; Yu, J. Deep Eutectic Solvents as Switchable Solvents for Highly Efficient Liquid–Liquid Microextraction of Phenolic Antioxidant: Easily Tracking the Original TBHQ in Edible Oils. Food Chem. 2022, 377, 131946. [Google Scholar] [CrossRef]
  70. Alañón, M.E.; Ivanović, M.; Gómez-Caravaca, A.M.; Arráez-Román, D.; Segura-Carretero, A. Choline Chloride Derivative-Based Deep Eutectic Liquids as Novel Green Alternative Solvents for Extraction of Phenolic Compounds from Olive Leaf. Arab. J. Chem. 2020, 13, 1685–1701. [Google Scholar] [CrossRef]
  71. Zhang, K.; Guo, R.; Wang, Y.; Wang, J.; Nie, Q.; Li, B.; Zhu, G. Temperature-Controlled Air-Assisted Liquid–Liquid Microextraction Based on the Solidification of Floating Deep Eutectic Solvents for the Determination of Triclosan and Alkylphenols in Water Samples via HPLC. Microchem. J. 2022, 182, 107864. [Google Scholar] [CrossRef]
  72. Moema, D.; Makwakwa, T.A.; Gebreyohannes, B.E.; Dube, S.; Nindi, M.M. Hollow Fiber Liquid Phase Microextraction of Fluoroquinolones in Chicken Livers Followed by High Pressure Liquid Chromatography: Greenness Assessment Using National Environmental Methods Index Label (NEMI), Green Analytical Procedure Index (GAPI), Analytical GREEnness Metric (AGREE), and Eco Scale. J. Food Compos. Anal. 2023, 117, 105131. [Google Scholar] [CrossRef]
Figure 1. FTIR spectra of the synthesized deep eutectic solvents. (A) ChCl:W; (B) ChCl:CA; (C) ChCl:DA; (D) ChCl:EG; (E) ChCl:Ph; (F) ChCl:G; and (G) ChCl:U.
Molecules 28 02395 g001
Figure 2. Extraction efficiency of different deep eutectic solvents for RP-DLLME of tryptophan from oil.
Molecules 28 02395 g002
Figure 3. Response surface plot for optimization of RP-DLLME of tryptophan.
Molecules 28 02395 g003
Figure 4. HPLC chromatograms of free tryptophan after RP−DLLME. (A) Matrix-matched standard (20 mg/kg 100 g oil); (B) blank; and (C) almond oil sample.
Molecules 28 02395 g004
Figure 5. Greenness assessment of the DES–RP-DLLME-HPLC method for tryptophan in oils. (A) GAPI pentagram; (B) AGREE pictogram.
Molecules 28 02395 g005
Figure 6. Scheme of the RP-DLLME-HPLC procedure. (A) Diluted oil sample; (B) injection of DES; (C) vortexing; (D) centrifugation; (E) retrieval of the DES phase; (F) HPLC measurement.
Molecules 28 02395 g006
Table 1. Variables and their ranges (−1, 0, +1) for the Plackett–Burman screening design.
No.VariableSymbolLevel
−10+1
1.Initial sample dilution ratio (:)dil1:11:51:9
2.DES amount (μL)DES100200300
3.Extraction time (min)tex135
4.Extraction temperature (°C)T253545
5.Salt (NaCl) addition (%)salt0510
6.Stirring type (vortex or ultrasonic)stirVor-Us
7.Centrifuge speed (rpm)w2000600010,000
8.Centrifuge time (min)tcfg2610
Table 2. ANOVA results from the Plackett–Burman (PBD) design.
SourceDFAdj SSAdj MSF-Valuep-Value
Model82222277.78.970.049
Linear82222277.78.970.049
dil1184.0184.15.940.093
DES1374.0374.112.10.040
tex124.0824.080.780.443
T1954.0954.030.80.012
salt1270.7270.78.780.060
stir1310.1310.110.010.051
W190.7590.752.930.185
tcfg114.0814.080.450.548
Error392.9230.97
Total112314
Table 3. Comparison of the proposed method with other reported methods for the determination of tryptophan.
No.MatrixConcentration
Range
Sample
Preparation
Method
Reagents/
Extractant
Analytical
Technique
Limit of
Detection
Linearity
(R2)
Recovery
(%)
RSD
(%)
Reference
1Protein10-100 μgacid hydrolysisHCl/ninhydrinViSn.a.n.a.98.32.7[6]
2Yeast extract *100–600 μMenzymatic hydrolysishydroxylamineViS100 μM0.696986n.a.[7]
3Solution *10–100 mg/LoxidationNaOClViS10 mg/L0.999690.51.19[8]
4Millets *9–36 mg/LbiorecognitionMP@PDA-E. coliViS5.6 μM0.981067.3[9]
5Beer *0.02–0.12 mg/LdSPEgraphene/clay/ Brij L23FL0.01 mg/L0.9991905.0[10]
6Dietary supplements *1.0–7.0 μmol/LdilutionGCE/p-ARGSWV0.30 μmol/L0.99097.62.1[11]
7Plasma *0.08–20.0 μMscreen-printed electrodePdCuCo/RGODPV0.03 μM0.997103.72.8[12]
8Milk *5.0–150 µMelectrochemical sensorgraphite electrodeDPV5.78 µM0.984199.38.6[13]
9Pharmaceutics *1–350 μMMIP electrochemical sensorAuNPs@PVP@SiO2MIPLSV1 μM0.9951054[14]
10Milk *0.01–80 μMMIP biosensorMIP-AFEIS0.008 μM0.9998.21.8[15]
11Plasma *0.005–0.1 mol/LdilutionHBP/SSACE5 μmol/L0.998101.95.4[16]
12Beer *n.d.–40.7 mg/Lacid hydrolysisHCl/HEC//BTP/EACA/AMPDcITP4.35 mg/L0.999395.94.3[17]
13Leaf tissue *n.a.SPEacetic anhydride deriv.GC-MSn.a.n.a.602[18]
14Soy sauces *136–262 mg/LprecipitationethanolHPLC1 mg/L0.9951084.9[19]
15Dietary supplements *5.0–500 μg/mHILIC1-octane sulfonateHPLC1.2 mg/mL0.97996.52.3[20]
16Infant formula0.018–30 mg/kgenzymatic hydrolysispronase enzymeHPLC18 μg/kg0.999993.86.9[21]
17Rapeseed10–400 ngalkaline hydrolysisNaOHHPLC10 ng0.99898.61.6[22]
18Pig feed *n.a.dilutionHClHPLCn.a.n.a.n.a.5.0[23]
19Chicken feed59–130 g/kgalkaline hydrolysisNaOH/o-phthalaldehydeHPLC-FLDn.a.n.a.864.0[24]
20White bread alkaline hydrolysisNaOHHPLCn.a.n.a.8516.1[25]
21Wheat1.3–14.8 g/kgalkaline hydrolysisNaOH/O-phthalaldehydeHPLC-FLDn.a.n.a.91.61.9[26]
22Yogurt352–1220 mg/kgalkaline hydrolysisNaOH/5-methyl-l-tryptophanHPLC-FLD11 μg/kg0.9995931.1[27]
23Bee pollen *0.069 mg/gultrasonic extractionACNHPLC-FLD0.003 mg/L0.999893.83.82[28]
24Ryegrass shoot0.5–40 µMalkaline hydrolysisNaOHLC-MS0.02 µM0.9989.98.5[29]
25Whole blood0.1–25 ng/mLVAMSACN/H2OLC-MS/MS25 ng/mL0.9987859.6[30]
26Plasma0–160 μMacid hydrolysisMeOH/ZnSO4/TFALC-MS/MS83 nM/L0.9958811[31]
27Honey *0.7–9.94 mg/kgSPEOasis MCX 30 µmLC-MS/MS1.0 μg/kgn.a.604.3[32]
28Milk *89.6–117QuEChERSCANLC-MS/MS2 ng/mL0.99103.72.6[33]
29Plant material *1–50 ng/mLSPEHybrid SPE–phospholipidsLC-MS/MS4 ng/mL0.99687.815[34]
30Chicken feedn.a.microwave hydrolysisAQC-derivatizationLC-MS/MS1 fmoln.a.994.2[35]
31Hazelnut *42–127 μg/gwater extractionwaterUPLC-MS/MSn.a.n.a.11730[37]
32Nuts and
seed oils *
10–400 mg/kgRP-DLLMEDES (ChCl:U)HPLC11 mg/kg0.996919.0This study
*—free Trp was analyzed; ViS—visible spectrophotometry; DPV—differential pulse voltammetry; LSV—linear sweep voltammetry; SWV—square wave voltammetry; MIP—molecularly imprinted polymer; EIS—electrochemical impedance spectroscopy; VAMS—volumetric absorptive microsampling; FL—fluorescence; FLD—fluorescence detector; CE—capillary electrophoresis; cITP—capillary isotachophoresis; dSPE—dispersive solid phase extraction; SPE—solid-phase extraction; HILIC—hydrophilic interaction liquid chromatography; n.a.—not available; n.d.—not detected.
Table 4. Trp (free) content in vegetable oils.
No.Oils Made fromTrp Content
(mg/100 g)
±Variation of Trp Content between Samples
(%)
1.Almonds16±16
2.Brazil nuts14±18
3.Cashews11±15
4.Hazelnuts17±14
5.Peanuts18±13
6.Pumpkin seeds32±26
7.Sesame seeds33±27
8.Sunflower seeds38±21
9.Walnuts12±14
Disclaimer/Publisher’s Note: The statements, opinions and data contained in all publications are solely those of the individual author(s) and contributor(s) and not of MDPI and/or the editor(s). MDPI and/or the editor(s) disclaim responsibility for any injury to people or property resulting from any ideas, methods, instructions or products referred to in the content.

