Article

Phytochemicals, Antioxidant and Antimicrobial Potentials and LC-MS Analysis of Centaurea parviflora Desf. Extracts

by
Fatima Zohra Hechaichi
1,
Hamdi Bendif
1,2,*,
Chawki Bensouici
3,
Sulaiman A. Alsalamah
4,
Boutheina Zaidi
5,
Mustapha Mounir Bouhenna
6,
Nabila Souilah
7,8,
Mohammed I. Alghonaim
4,
Abderrahim Benslama
9,
Samir Medjekal
9,
Ashraf A. Qurtam
4,
Mohamed Djamel Miara
10 and
Fehmi Boufahja
4,*
1
Biodiversity and Biotechnological Techniques for Plant Resources Valorization Laboratory, Department of Natural and Life Sciences, Faculty of Sciences, University of Msila, Msila 28000, Algeria
2
Laboratory of Ethnobotany and Natural Substances, Department of Natural Sciences, Ecole Normale Supérieure (ENS), Alger 16308, Algeria
3
Biotechnology Research Center, UV 03, BP E7, Ali Mendjeli, Constantine 25000, Algeria
4
Biology Department, College of Science, Imam Mohammad Ibn Saud Islamic University (IMSIU), Riyadh 11623, Saudi Arabia
5
Faculty of Nature and Life Sciences, University of Constantine, Constantine 25000, Algeria
6
Scientific and Technical Research Center in Physico-Chemical Analysis, Algiers 16000, Algeria
7
Laboratory for the Optimization of Agricultural Production in Sub-Humid Zones (LOPAZS), Department of Agricultural Sciences, Faculty of Sciences, University of Skikda, Skikda 21000, Algeria
8
Laboratory for Valorization of Natural Resources, Bioactive Molecules and Physico-Chemical and Biological Analysis, Department of Chemistry, University of Constantine, Constantine 25000, Algeria
9
Department of Microbiology and Biochemistry, University of Msila, Msila 28000, Algeria
10
Department and Faculty of Nature and Life Sciences, University of Tiaret, Tiaret 14000, Algeria
*
Authors to whom correspondence should be addressed.
Molecules 2023, 28(5), 2263; https://doi.org/10.3390/molecules28052263
Submission received: 25 January 2023 / Revised: 16 February 2023 / Accepted: 24 February 2023 / Published: 28 February 2023

Abstract

:
Centaurea parviflora (C. parviflora), belonging to the family Asteraceae, is an Algerian medicinal plant used in folk medicine to treat different diseases related to hyperglycemic and inflammatory disorders, as well as in food. The present study aimed to assess the total phenolic content, in vitro antioxidant and antimicrobial activity and phytochemical profile of the extracts of C. parviflora. The extraction of phenolic compounds from aerial parts was conducted using solvents of increasing polarity starting from methanol, resulting in crude extract (CE), to chloroform extract (CHE), ethyl acetate extract (EAE) and butanol extract (BUE). The total phenolic, flavonoid and flavonol contents of the extracts were determined using the Folin–Ciocalteu and AlCl3 methods, respectively. The antioxidant activity was measured with seven methods: 2,2-diphenyl-1-picrylhydrazyl (DPPH) assay, galvinoxyl free-radical-scavenging test, 2,2′-Azino-Bis(3-Ethylbenzothiazoline-6-Sulfonic Acid) (ABTS) assay, cupric reducing antioxidant capacity (CUPRAC), reducing power, Fe+2-phenanthroline reduction assay and superoxide-scavenging test. The disc-diffusion method aimed at testing the sensitivity of bacterial strains toward our extracts. A qualitative analysis with thin-layer chromatography of the methanolic extract was performed. Moreover, HPLC-DAD-MS was used to establish the phytochemical profile of the BUE. The BUE was found to contain high amounts of total phenolics (175.27 ± 2.79 µg GAE/mg E), flavonoids (59.89 ± 0.91 µg QE/mg E) and flavonols (47.30 ± 0.51 µg RE/mg E). Using TLC, different components such as flavonoids and polyphenols were noted. The highest radical-scavenging ability was recorded for the BUE against DPPH (IC50 = 59.38 ± 0.72 µg/mL), galvinoxyl (IC50 = 36.25 ± 0.42 µg/mL), ABTS (IC50 = 49.52 ± 1.54 µg/mL) and superoxide (IC50 = 13.61 ± 0.38 µg/mL). The BUE had the best reducing power according to the CUPRAC (A0.5 = 71.80 ± 1.22 μg/mL), phenanthroline test (A0.5 = 20.29 ± 1.16 μg/mL) and FRAP (A0.5 = 119.17 ± 0.29 μg/mL). The LC-MS analysis of BUE allowed us to identify eight compounds including six phenolic acids and two flavonoids: quinic acid, five chlorogenic acid derivatives, rutin and quercetin 3-o-glucoside. This preliminary investigation revealed that the extracts of C. parviflora have a good biopharmaceutical activity. The BUE possesses an interesting potential for pharmaceutical/nutraceutical applications.

1. Introduction

Algeria, because of its particular geographical location and climatic diversity, presents a rich and very large vegetation. There are more than 3000 plant species, 15% of which are endemic, belonging to several botanical families [1]. Several plants of the Asteraceae family are grown for their nutritional value (sunflower, artichoke, lettuce, chicory, chamomile, etc.) or as decorative plants (dahlias, asters, etc.) [2]. Indeed, it has been reported that the flowers and leaves of this family possess antibacterial, antifungal, antiviral, anti-inflammatory, antiproliferative and anti-leishmaniasis activity [3,4]. The secondary metabolite diversity of the Asteraceae explains their multiple pharmacological activities, and as a result, many species of this family are used in traditional medicine [5]. The genus Centaurea comprises more than 500 species, 45 of which grow naturally in Algeria, seven of which occur in the Sahara Desert [6]. Centaurea species are latex-free-resin or -essence plants that grow in tufts or in seedlings, usually in spring, and occur in different habitat types [7].
The main secondary metabolites of Centaurea species are represented by triterpenes, flavonoids and lignans, and they are also known to produce sesquiterpene lactones [8,9,10,11]. These secondary metabolites can be isolated from the leaves, aerial parts and sometimes roots of Centaurea [12].
Centaurea parviflora Desf. is a suffrutescent plant at its base, with a height of 40–60 cm, growing in dense, intricate bushes. The appendix of the bracts lacks a whitish scarious part or has a faintly marked scarious part with 8–12 lateral laciniures.
The highest leaves are not decurrent on the stem. The plant is characterized among the other knapweeds by its small (5 mm wide, 15 mm long), solitary flower head. The appendices are characterized by a strongly covered median spine. The flowers are purple with black, bellied, pubescent achenes with four marked streaks. C. parviflora is endemic to Algeria and Tunisia [13]. In Algeria, the plant is quite rare, but can be found in different biogeographical sectors from the west to the east of the country and from the coast to the highlands.
Many species of the genus Centaurea have been used in traditional medicine to treat various ailments and diseases. These species of the genus are used as anticancer, anti-inflammatory, antinociceptive, antipyretic, anti-arteropic, antineoplastic, anti-ulcerogenic and antimicrobial treatments. They are also used for rheumatic pain, cardiovascular problems, headaches, gastrointestinal symptoms and parasites and as a fever reliever, stimulant remedy and wound healer [6,14,15,16,17,18]. They are highly active in living systems and therefore have a strong pharmacological interest, which explains the long-term use of these plants in traditional medicine [19].
Due to their interesting health properties, polyphenols have received a growing interest and popularity, even though their amounts in most natural sources are often not sufficient for an optimal dietary intake. Phenolic compounds are commonly found in plants, and many of these effective components have several biological activities including antioxidative, anti-diabetic, anti-carcinogenic, antimicrobial, anti-allergic, anti-mutagenic and anti-inflammatory properties [20].
The present study aimed to carry out phytochemical profiling through a qualitative analysis with thin-layer chromatography and HPLC-DAD-MS of the butanolic extract and the TPCs. It also evaluated the in vitro antioxidant and antimicrobial activities of C. parviflora.

2. Results and Discussion

2.1. Extraction Yield

Extraction is the main step for recovering and isolating phytochemicals from plant materials. The extraction yield can be affected by the chemical nature of the phytochemicals, the method used, the solvent used, as well as the presence of interfering substances [21,22,23].

2.2. Qualitative Analysis

2.2.1. Thin-Layer Chromatography Analysis (TLC)

After the development of the chromatogram, and when the solvent reached the upper line, the plate was removed, dried and examined under the UV lamp in order to identify the constituents present [24]. TLC profiling of the plant extracts in different solvent systems confirms the presence of a diverse group of phytochemicals.
The qualitative analysis made it possible to highlight numerous spots, especially those colored in blue, mauve, yellow and pink. These three stains confirm the presence of phenolic compounds [25]. According to the results (Table 1 and Figure 1), the following remarks can be noted:
The number of spots in system 1 and system 3 is higher than that in the other three systems (2, 4 and 5); this means that the plant C. parviflora is rich in phenolic compounds. Finally, we can conclude that the TLC results confirm the presence of phenolic compounds and flavonoids in the extracts of the C. parviflora plant and also reinforce what we obtained for the biological activity.
The number of spots indicates that the quantity of phenolic compounds in C. parviflora is higher. This confirms that this plant is rich in phenolic compounds, and these results are confirmed by our finding above (Table 1), where the plant appeared to be rich in TPC (Tukey’s HSD test: p-values < 0.01). Moreover, the LC-MS analysis of the butanolic fraction of C. parviflora mentioned six phenolic acids and 2 flavonoids, quinic acid, five derivatives of chlorogenic acid, rutin and quercetin 3-o-glucoside, which confirm the richness of this plant in phenolic compounds.

2.2.2. LC-MS Analyses

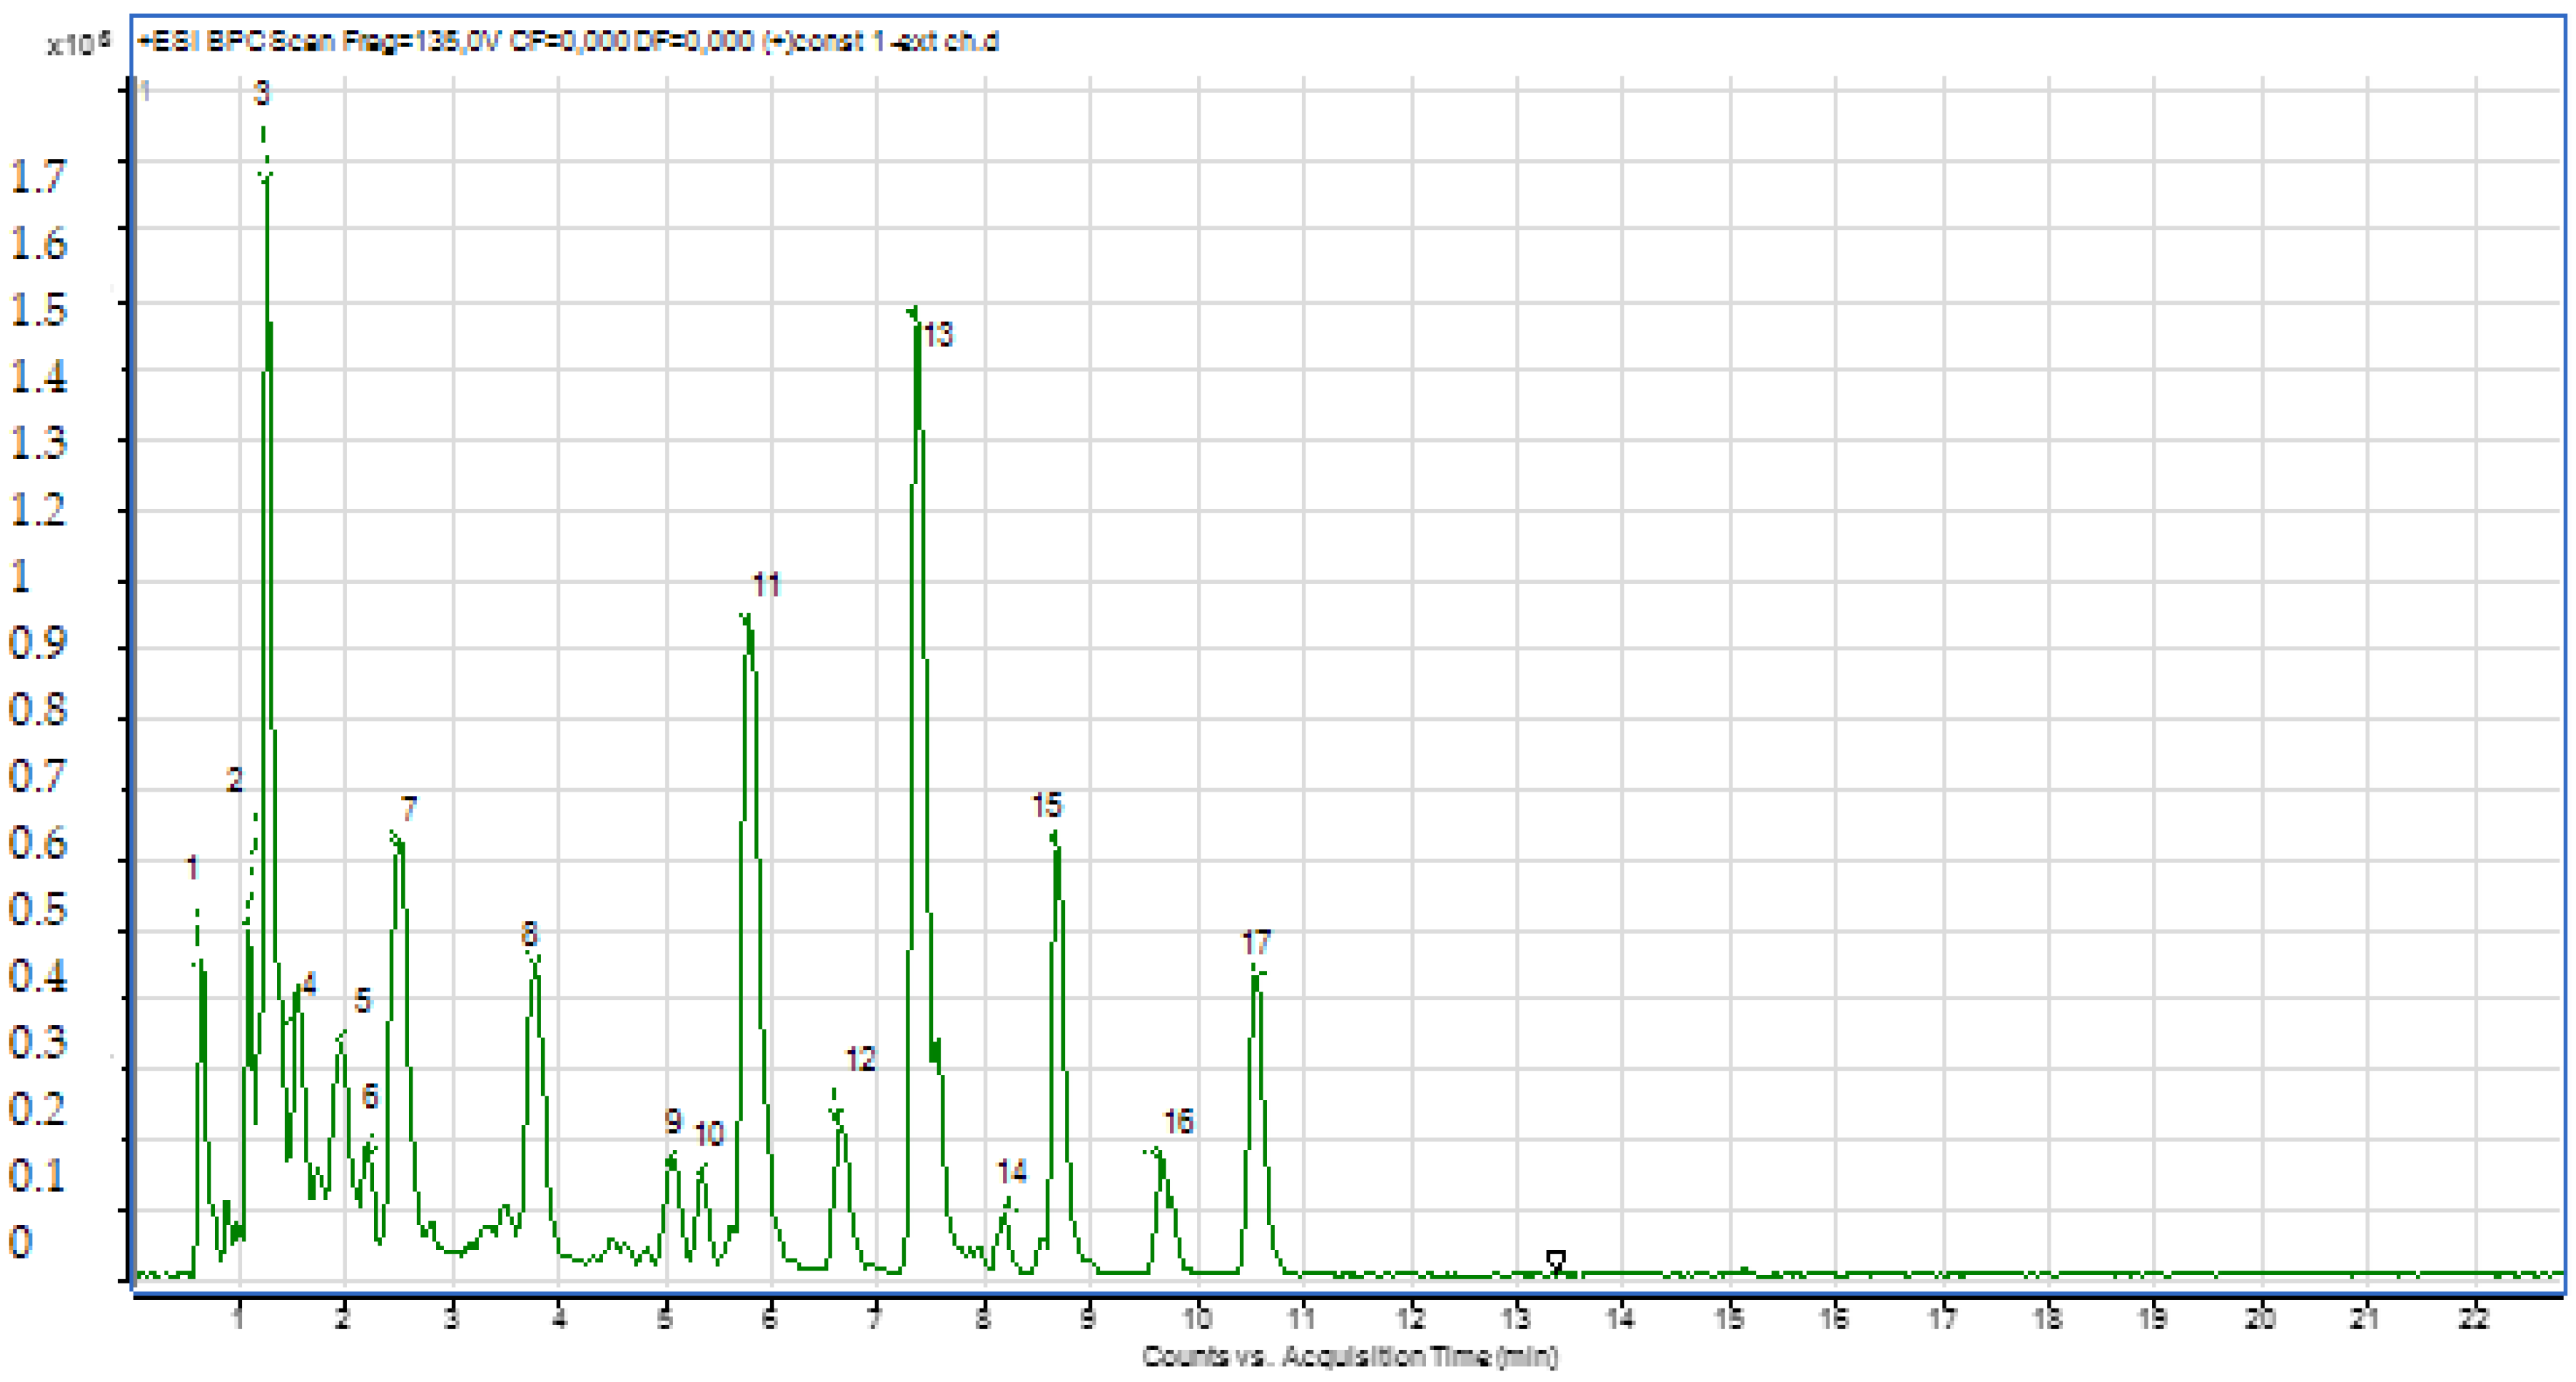
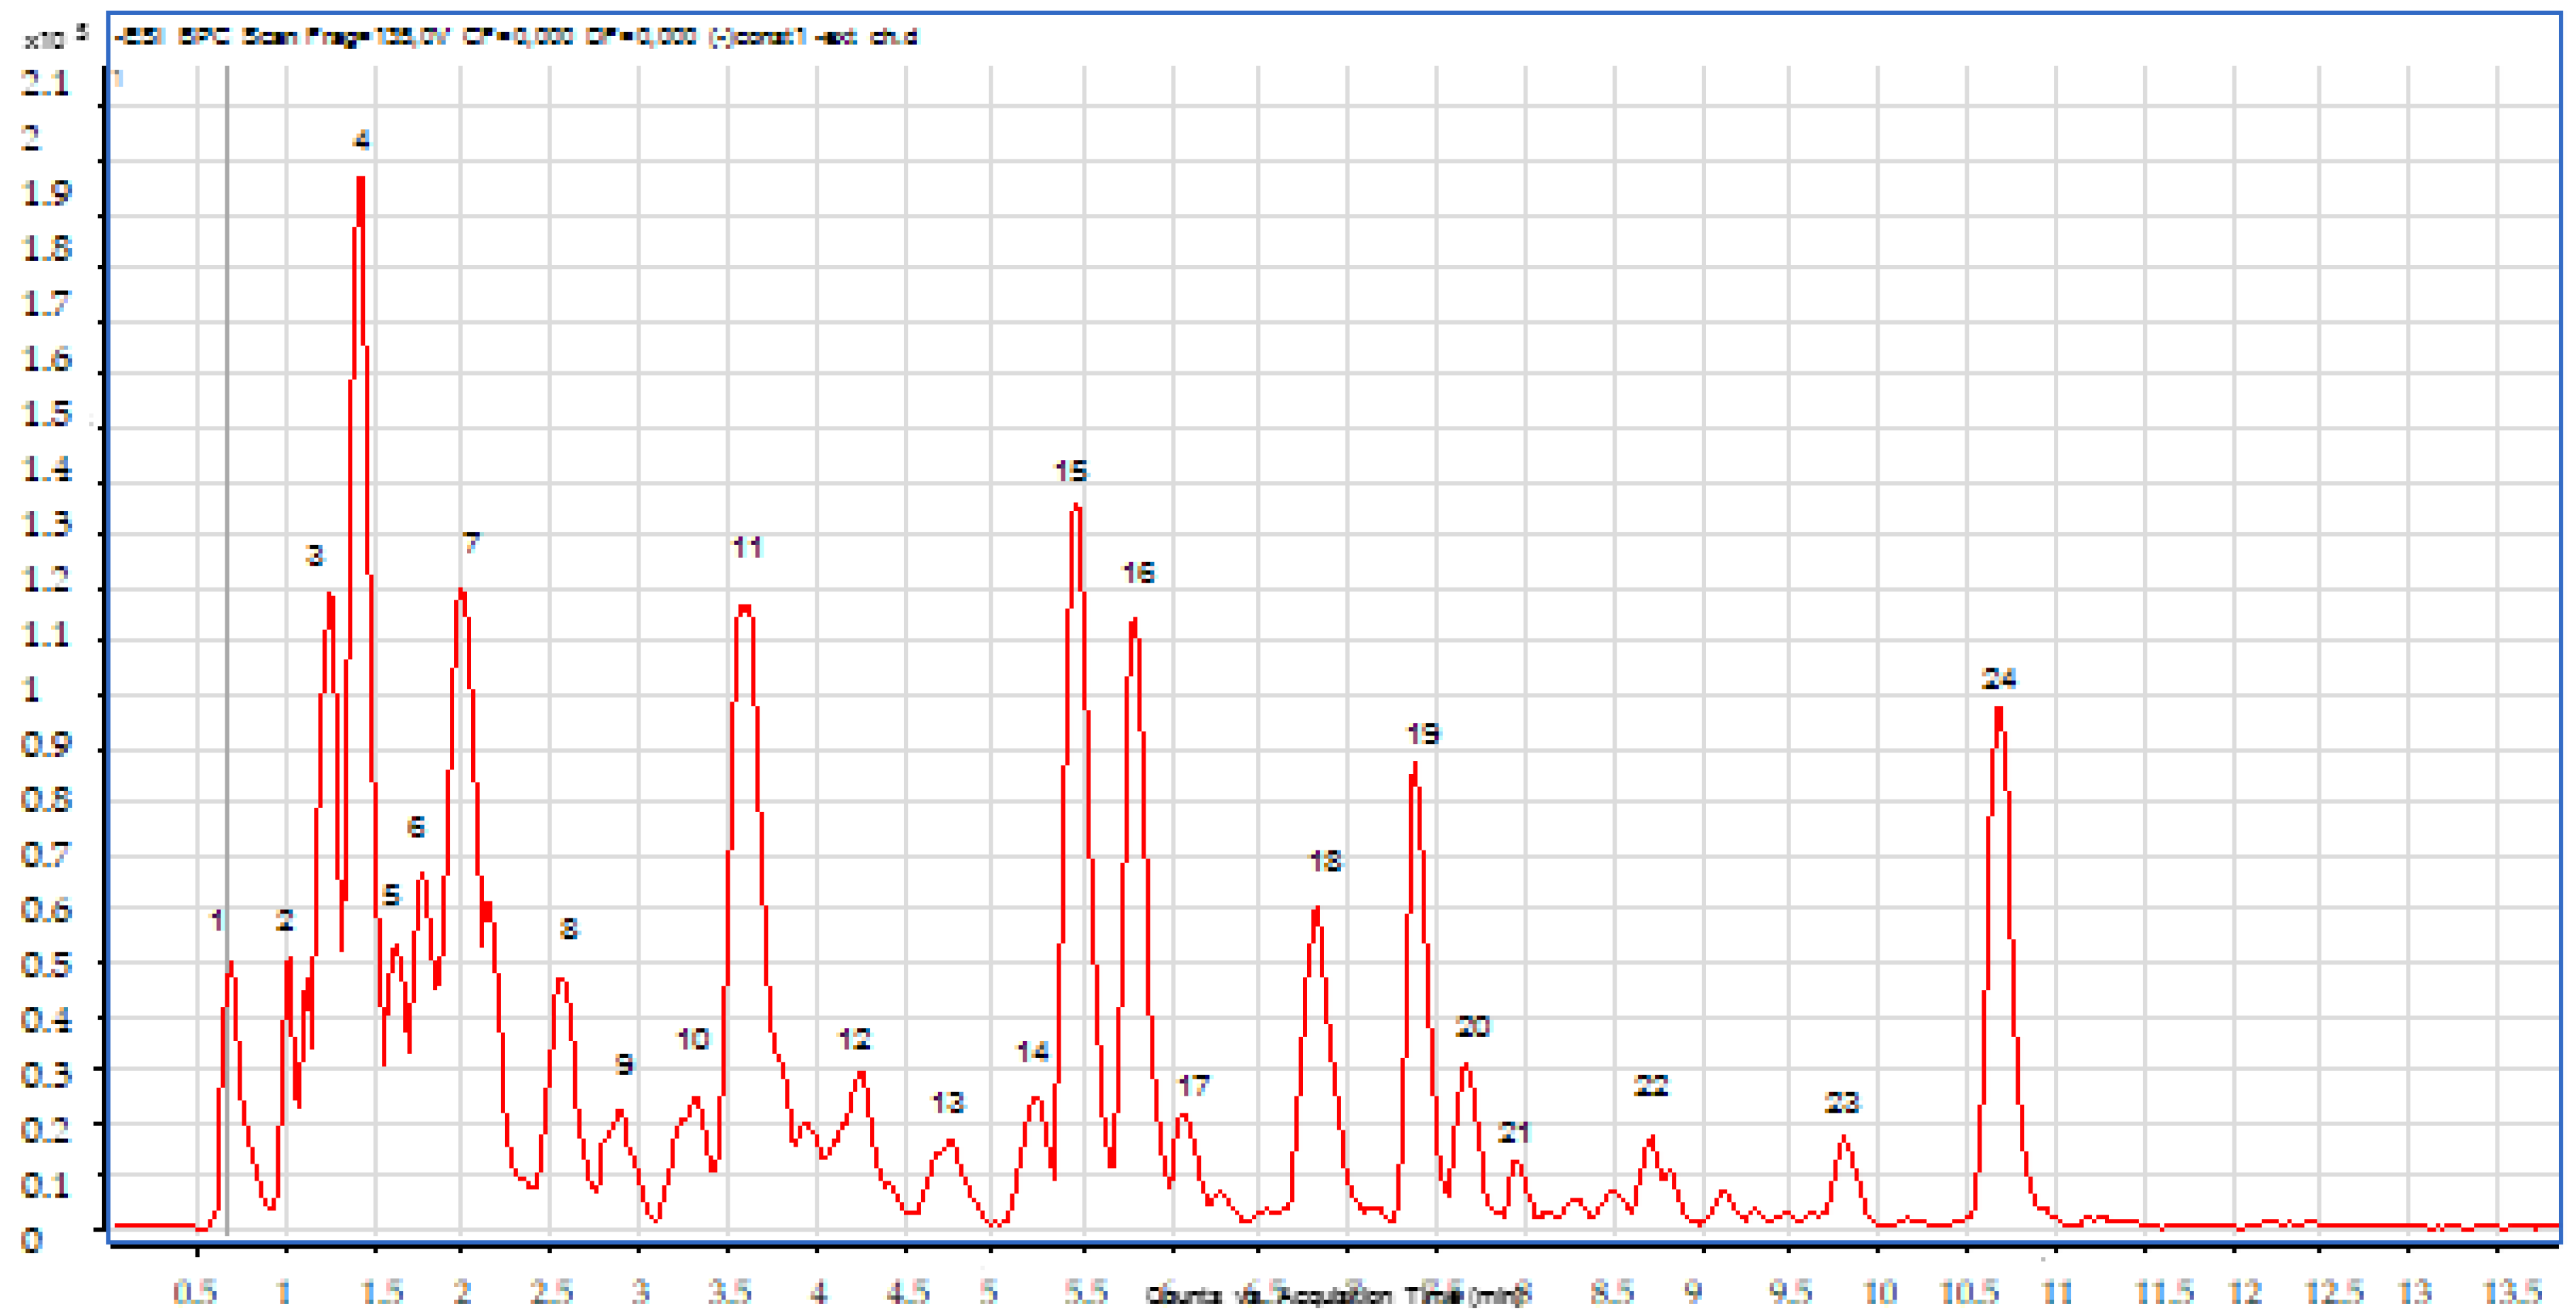
A solution of 1000 ppm was prepared in methanol and injected into the LC-ESI-MS instrument. Both positive and negative ionization chromatograms show a rich concentration of the majority compounds between 0.5 and 11 min (Figure 2 and Figure 3).
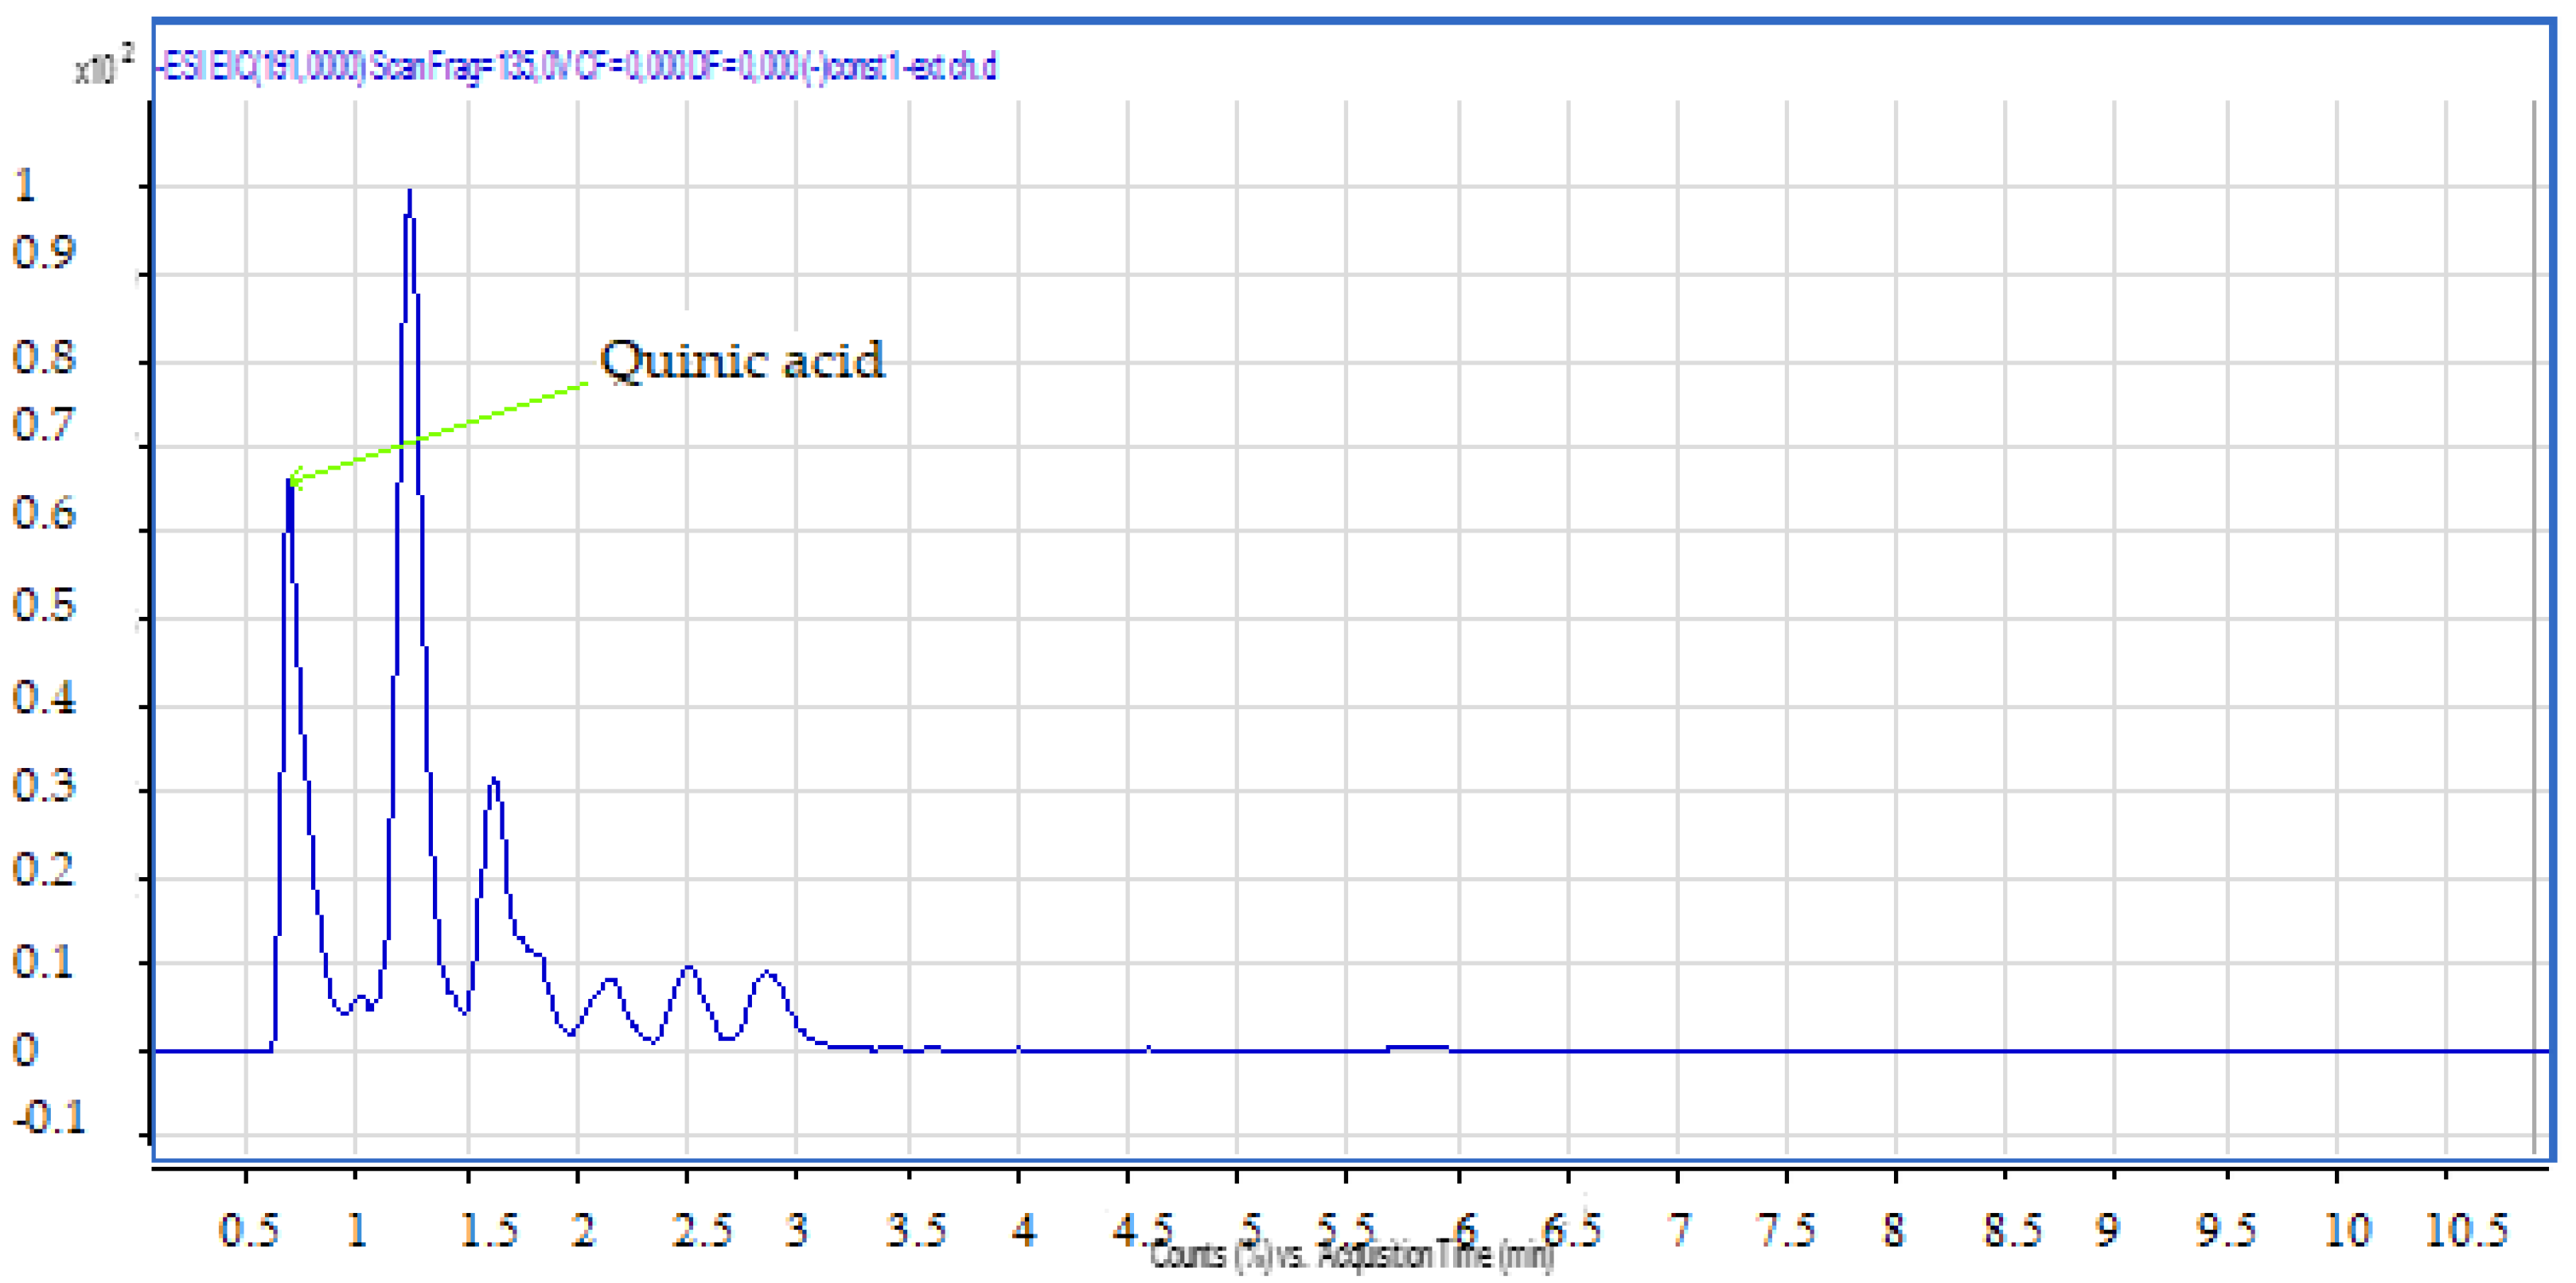
Compound 1: The peak that appears at a retention time of 0.68 mn with m/z = 191.00 and a crude formula of C7H12O6 was identified as quinic acid (Figure 4 and Figure 5).
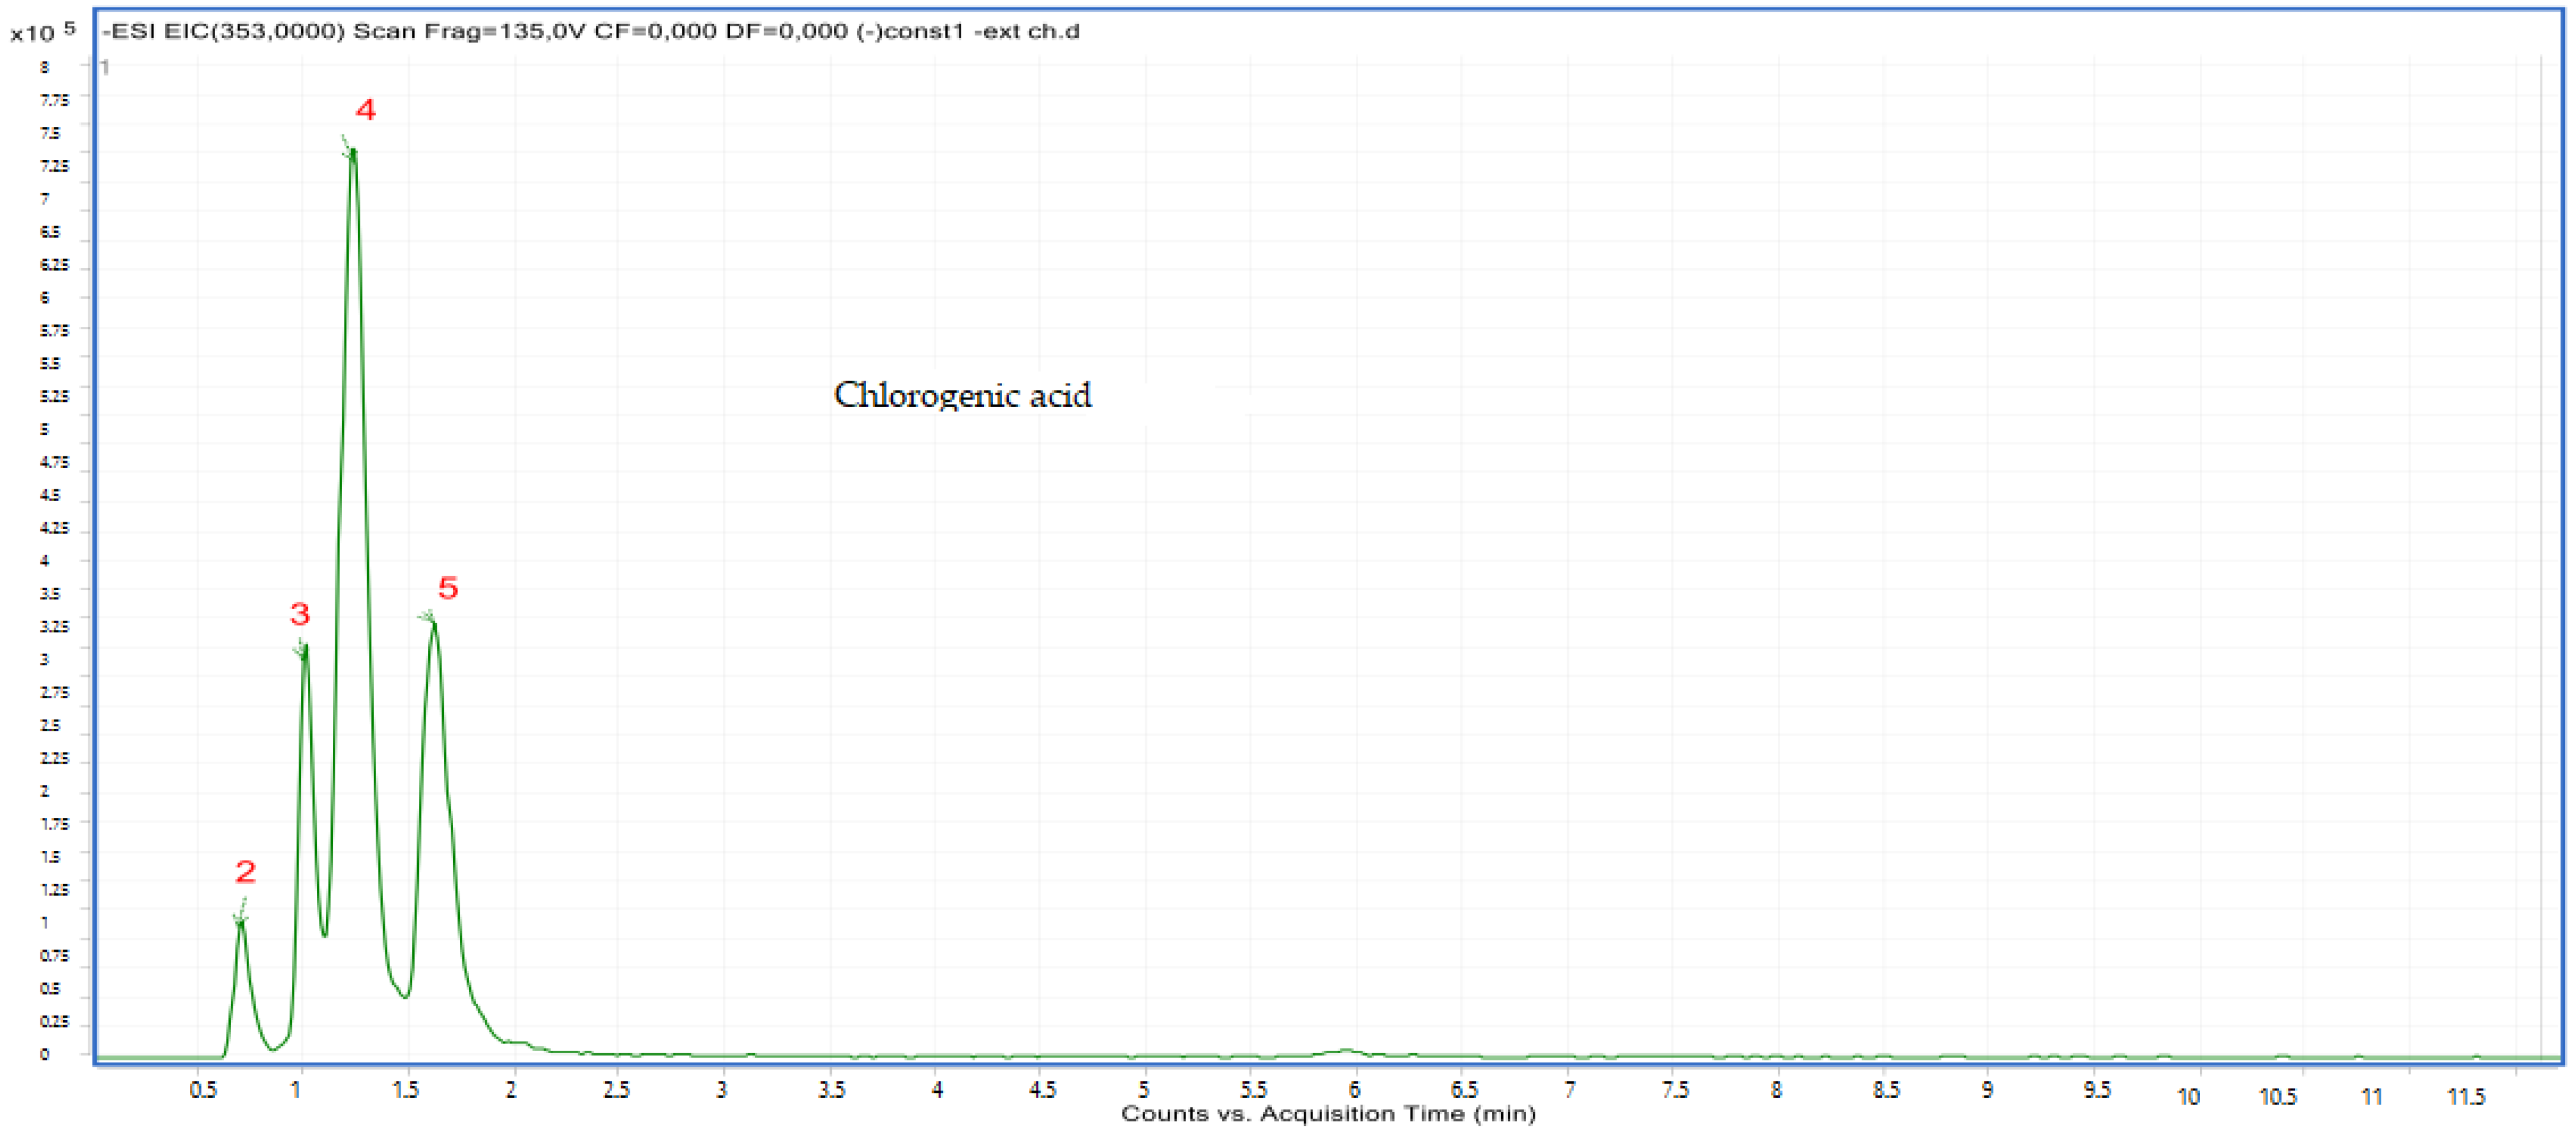
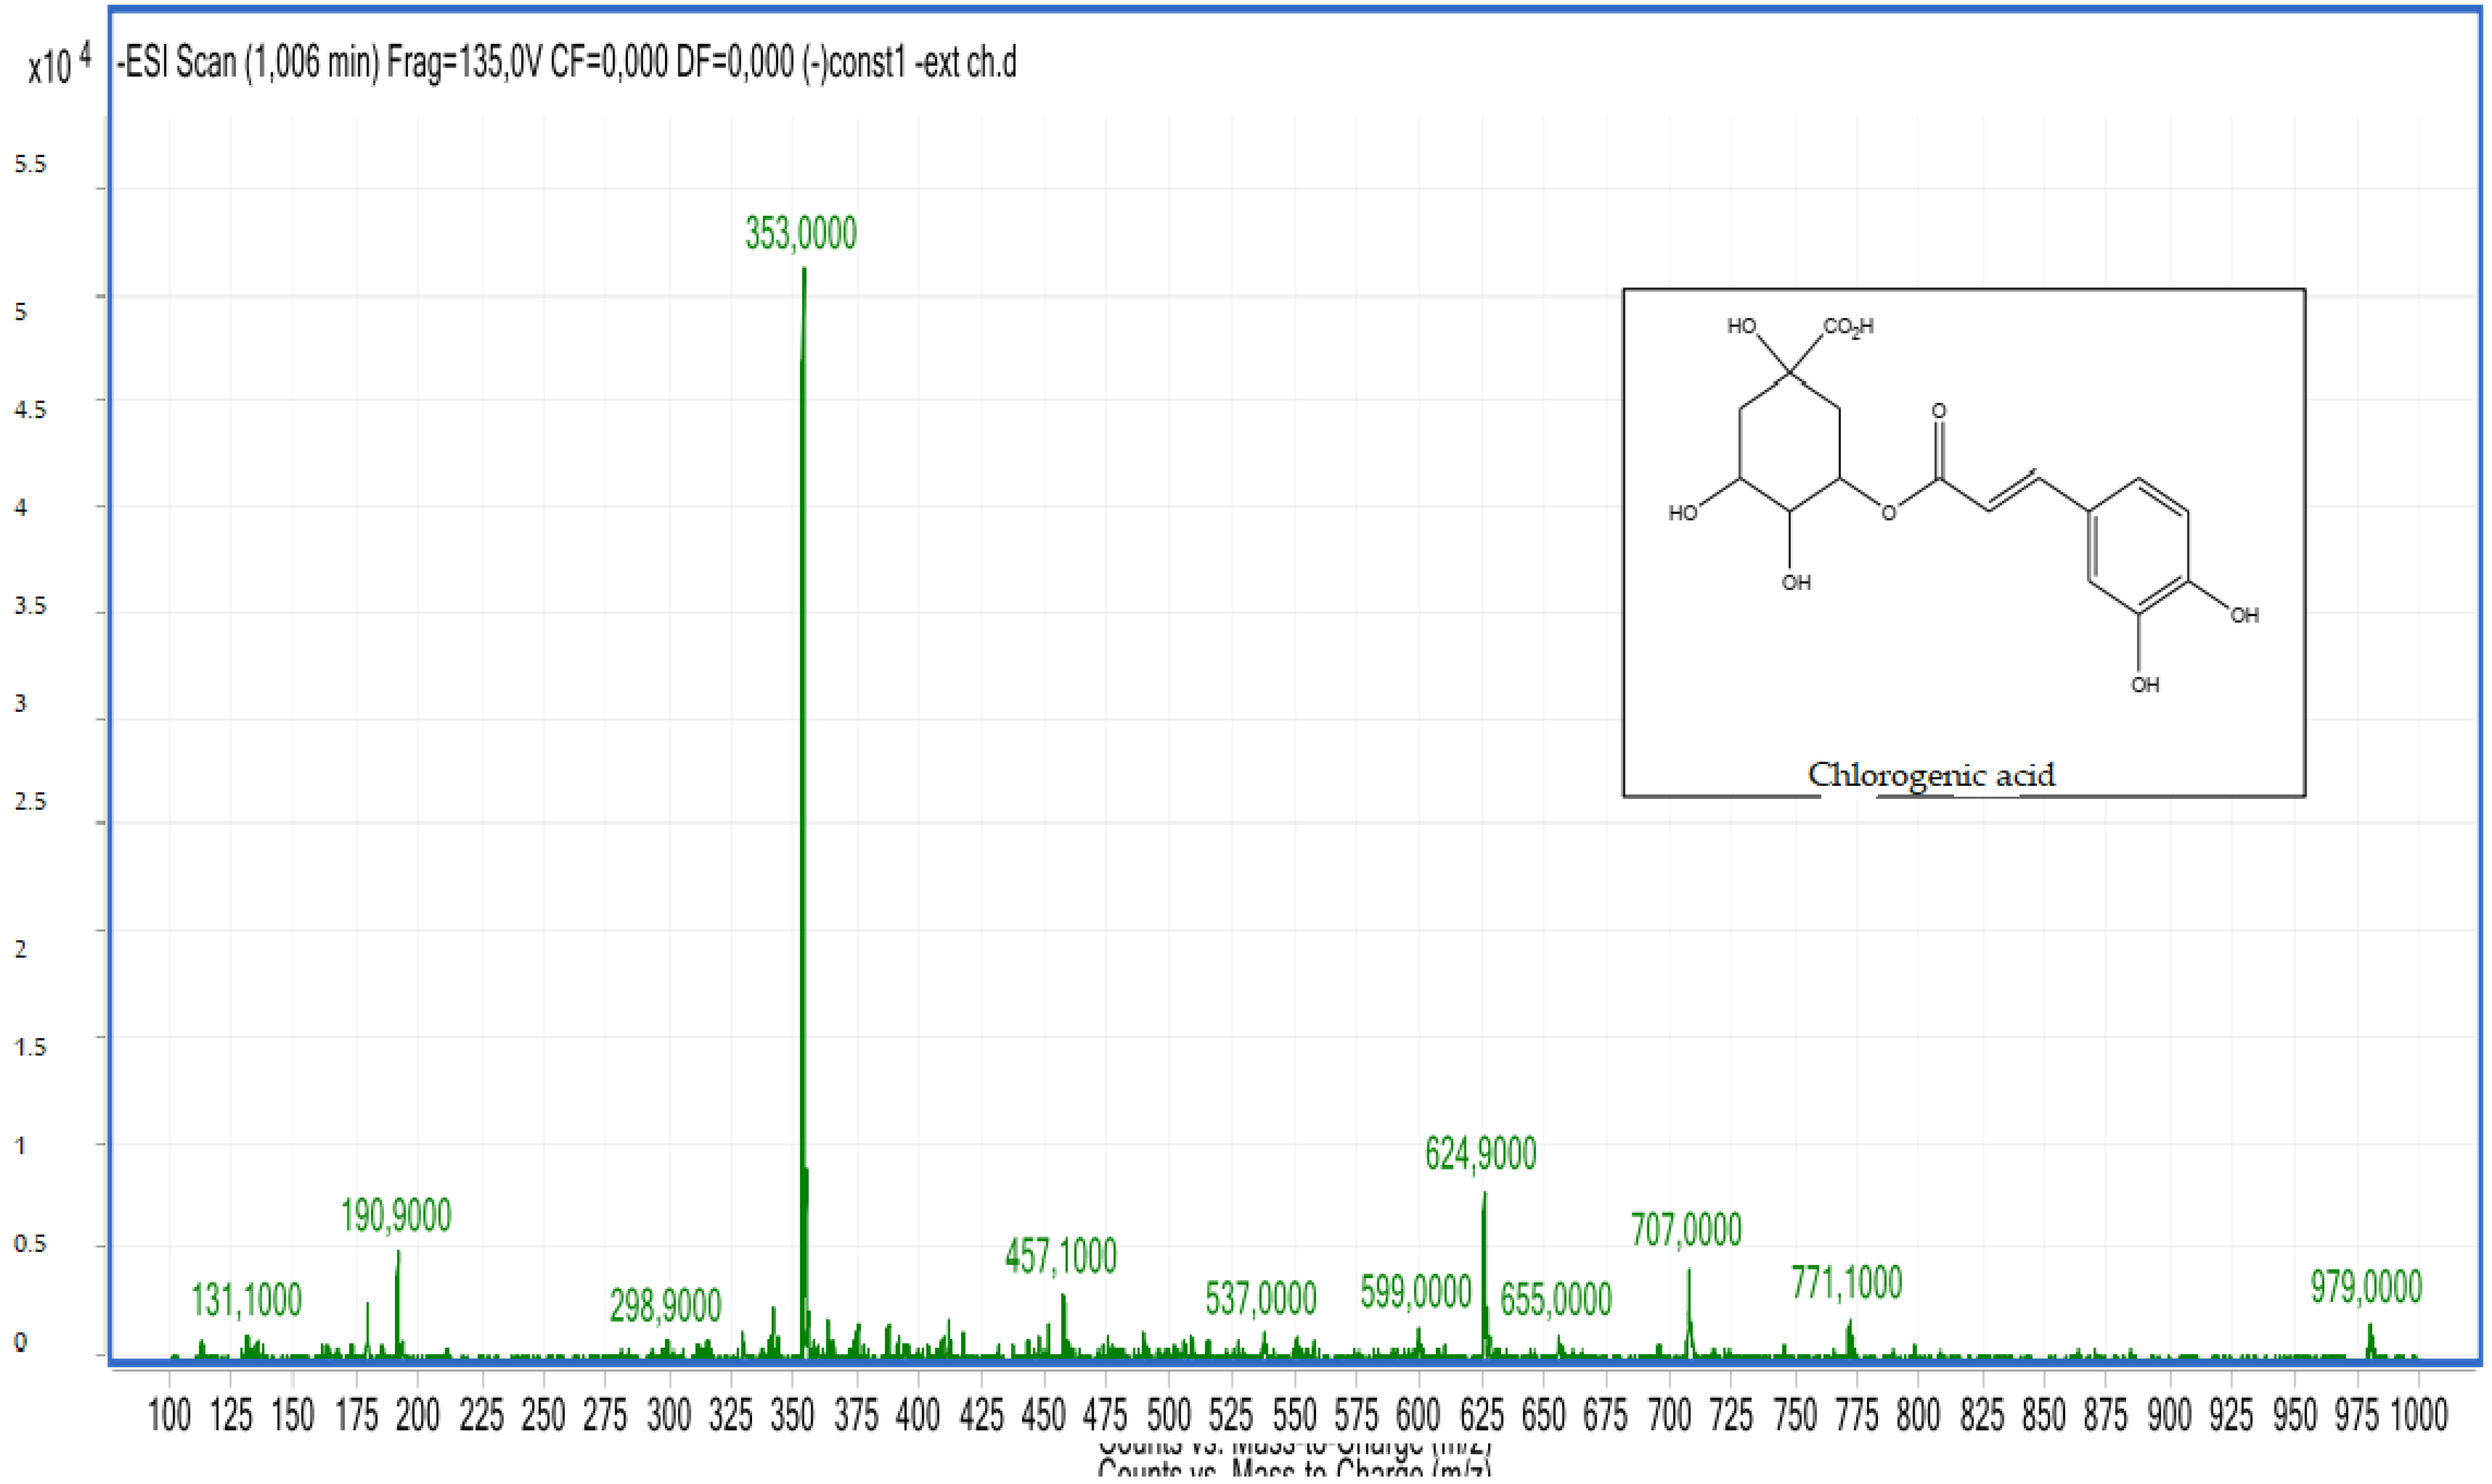
Compounds 2, 3, 4 and 5: The peak that appears at the retention times of 0.72, 1.00, 1.22, 1.62 mn with m/z = 353.00 and a crude formula of C16H18O9 was identified as chlorogenic acid (Figure 6 and Figure 7).
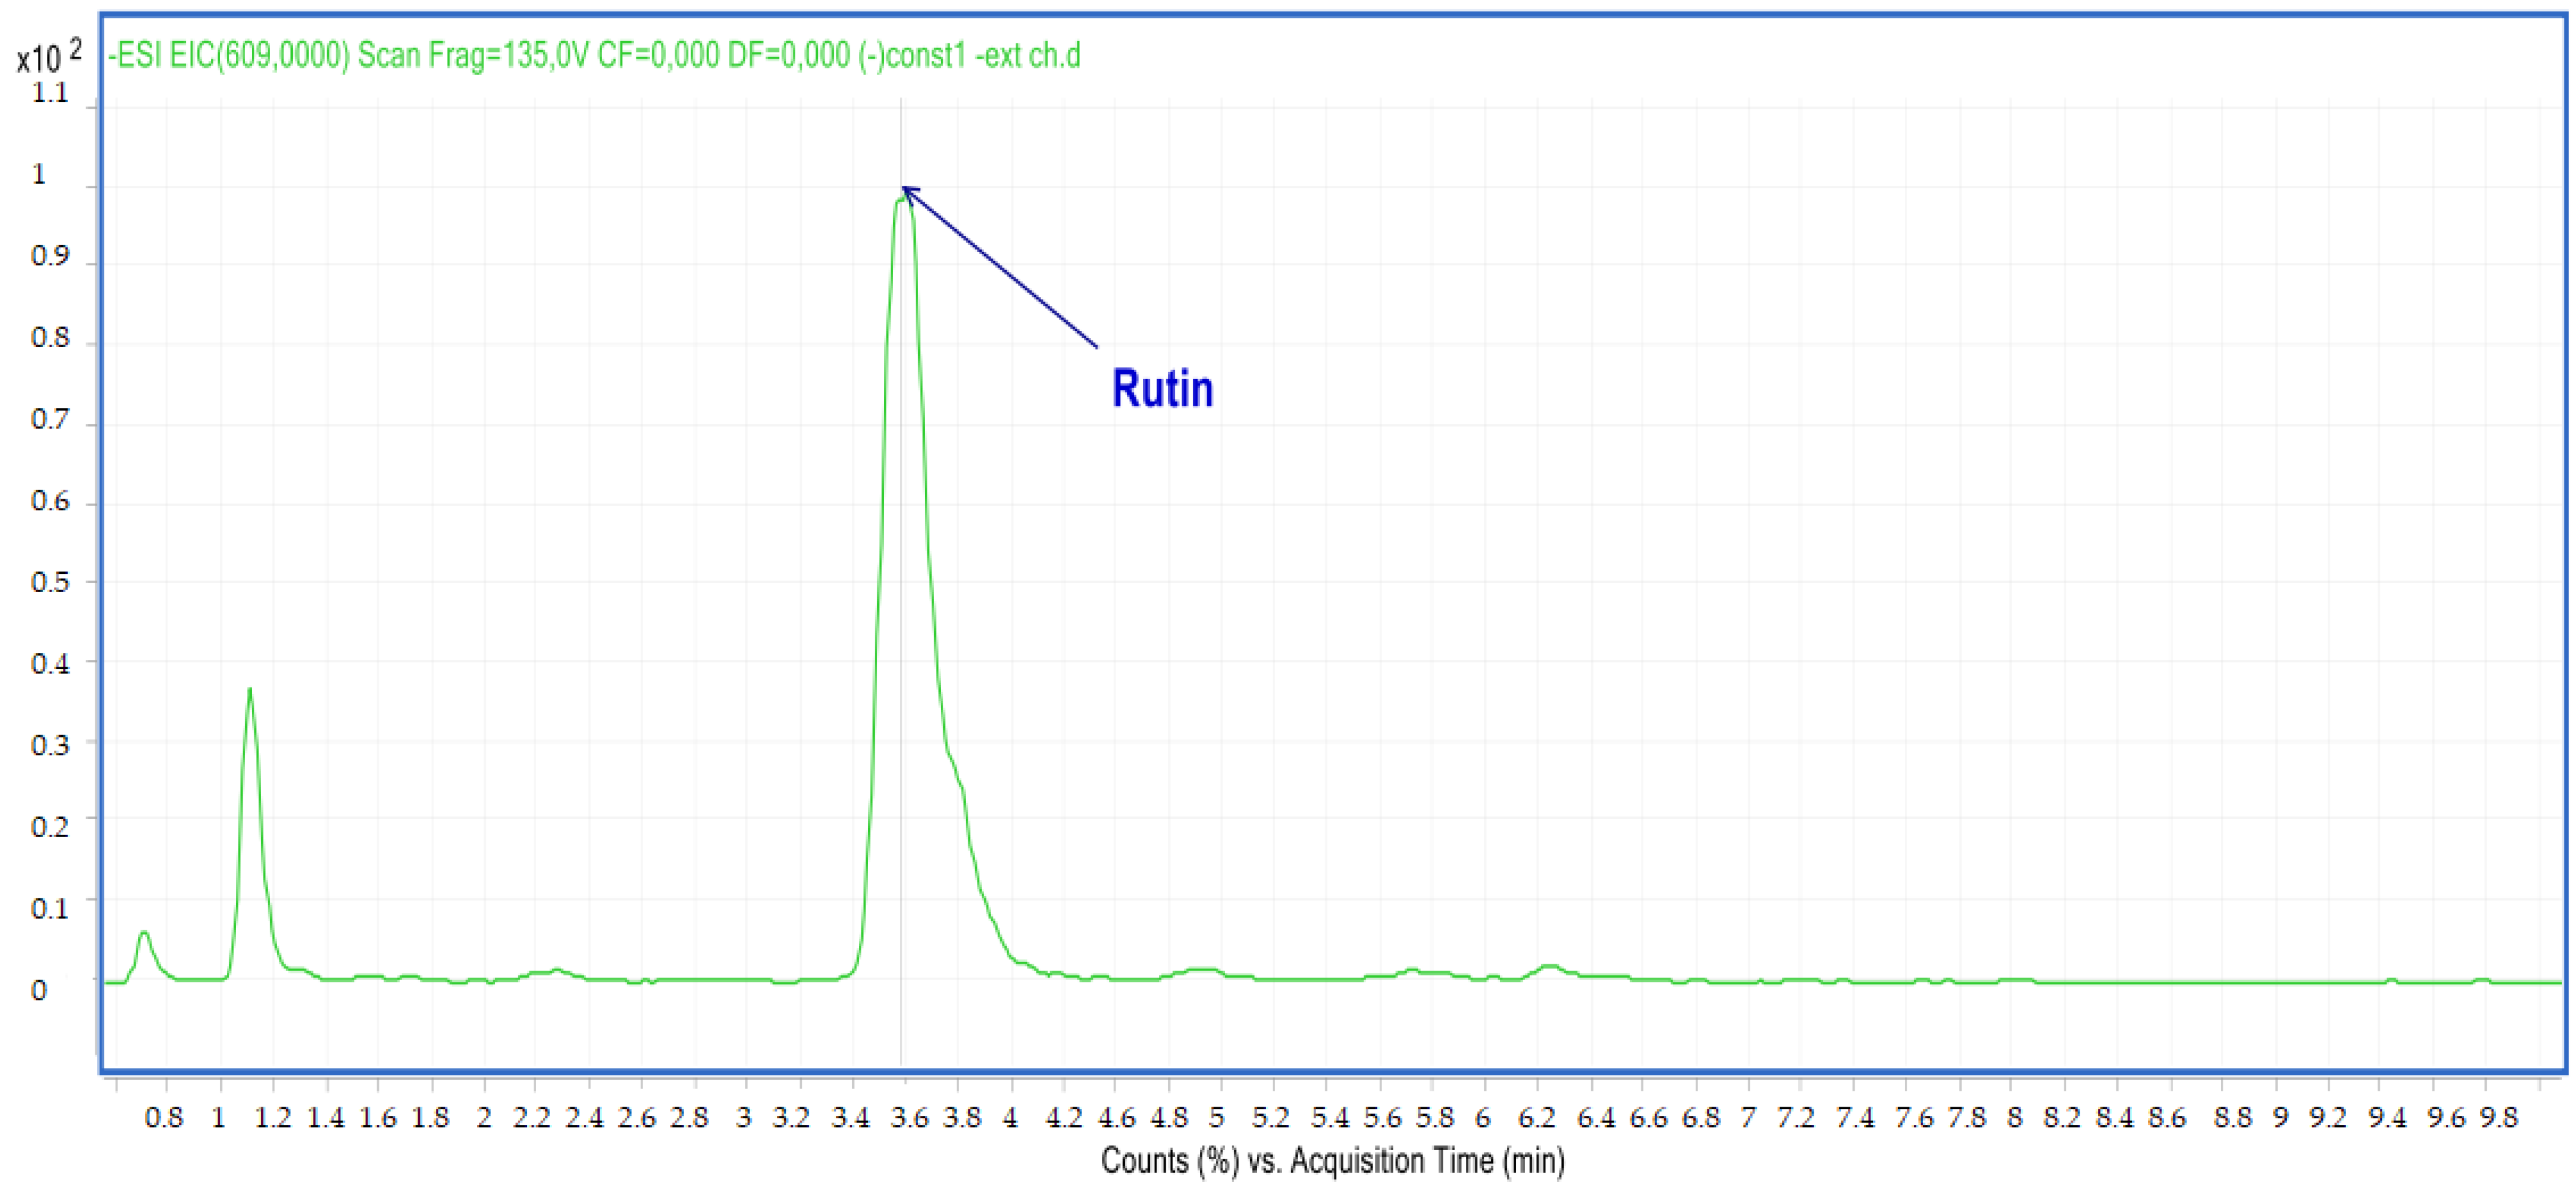
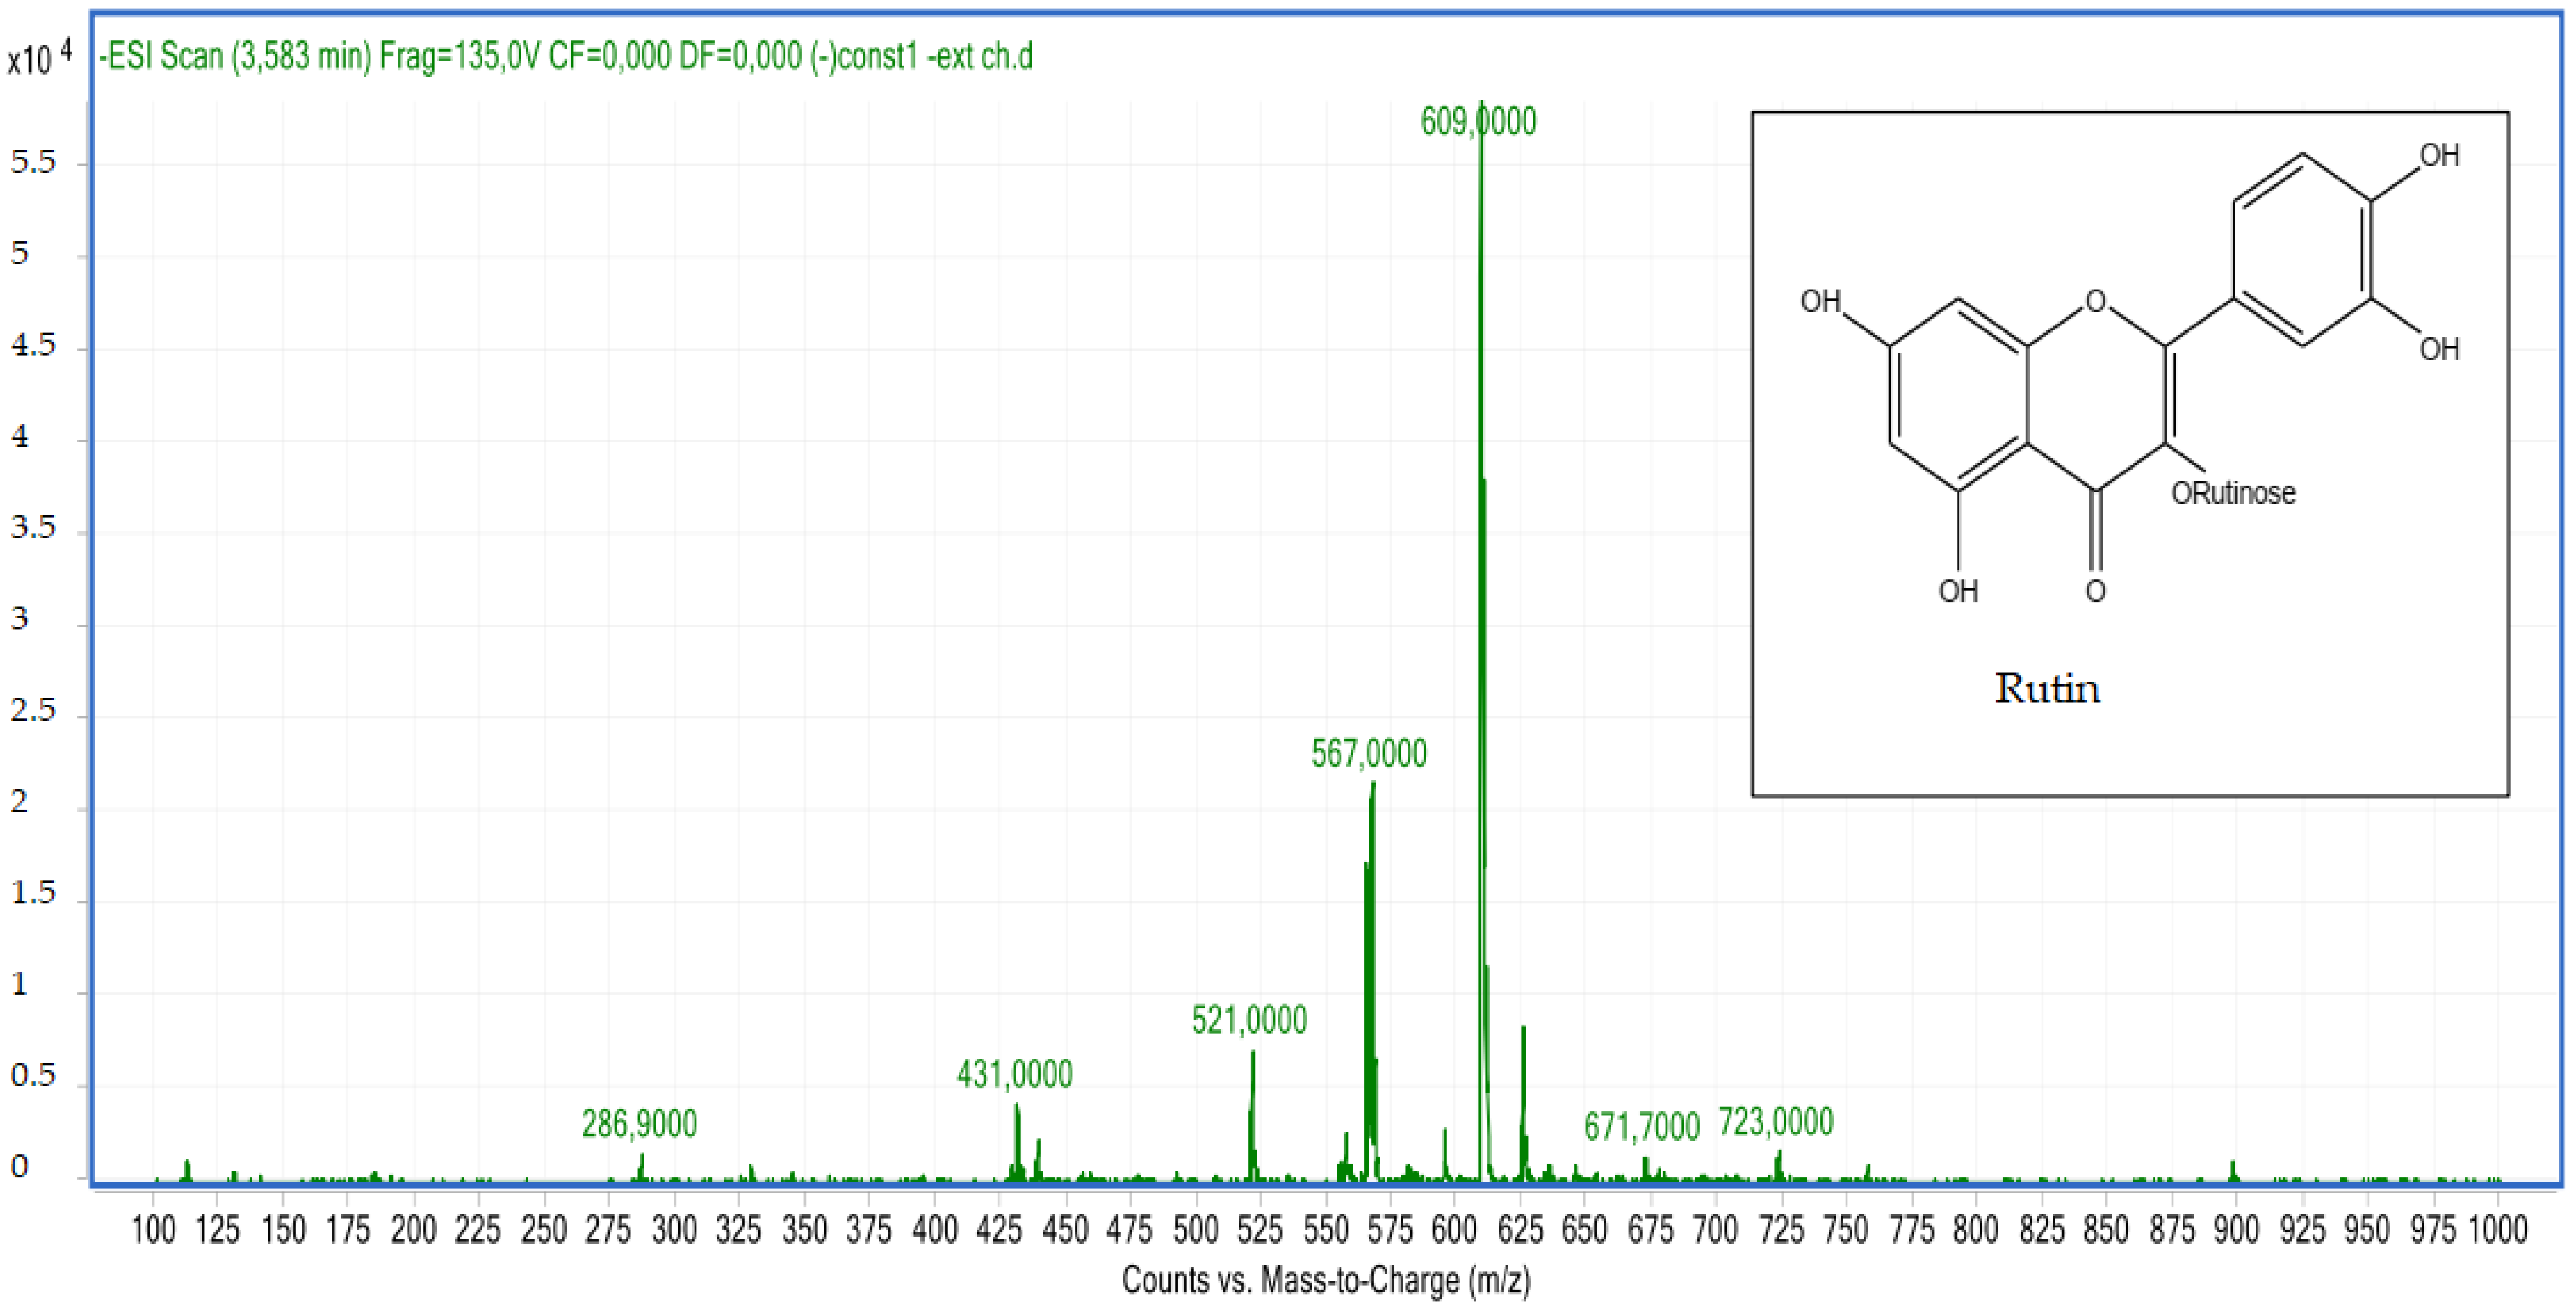
Compound 6: The peak that appears at a retention time of 3.58 mn with m/z =609.00 and a crude formula of C27H30O16 was identified as rutin (Figure 8 and Figure 9).
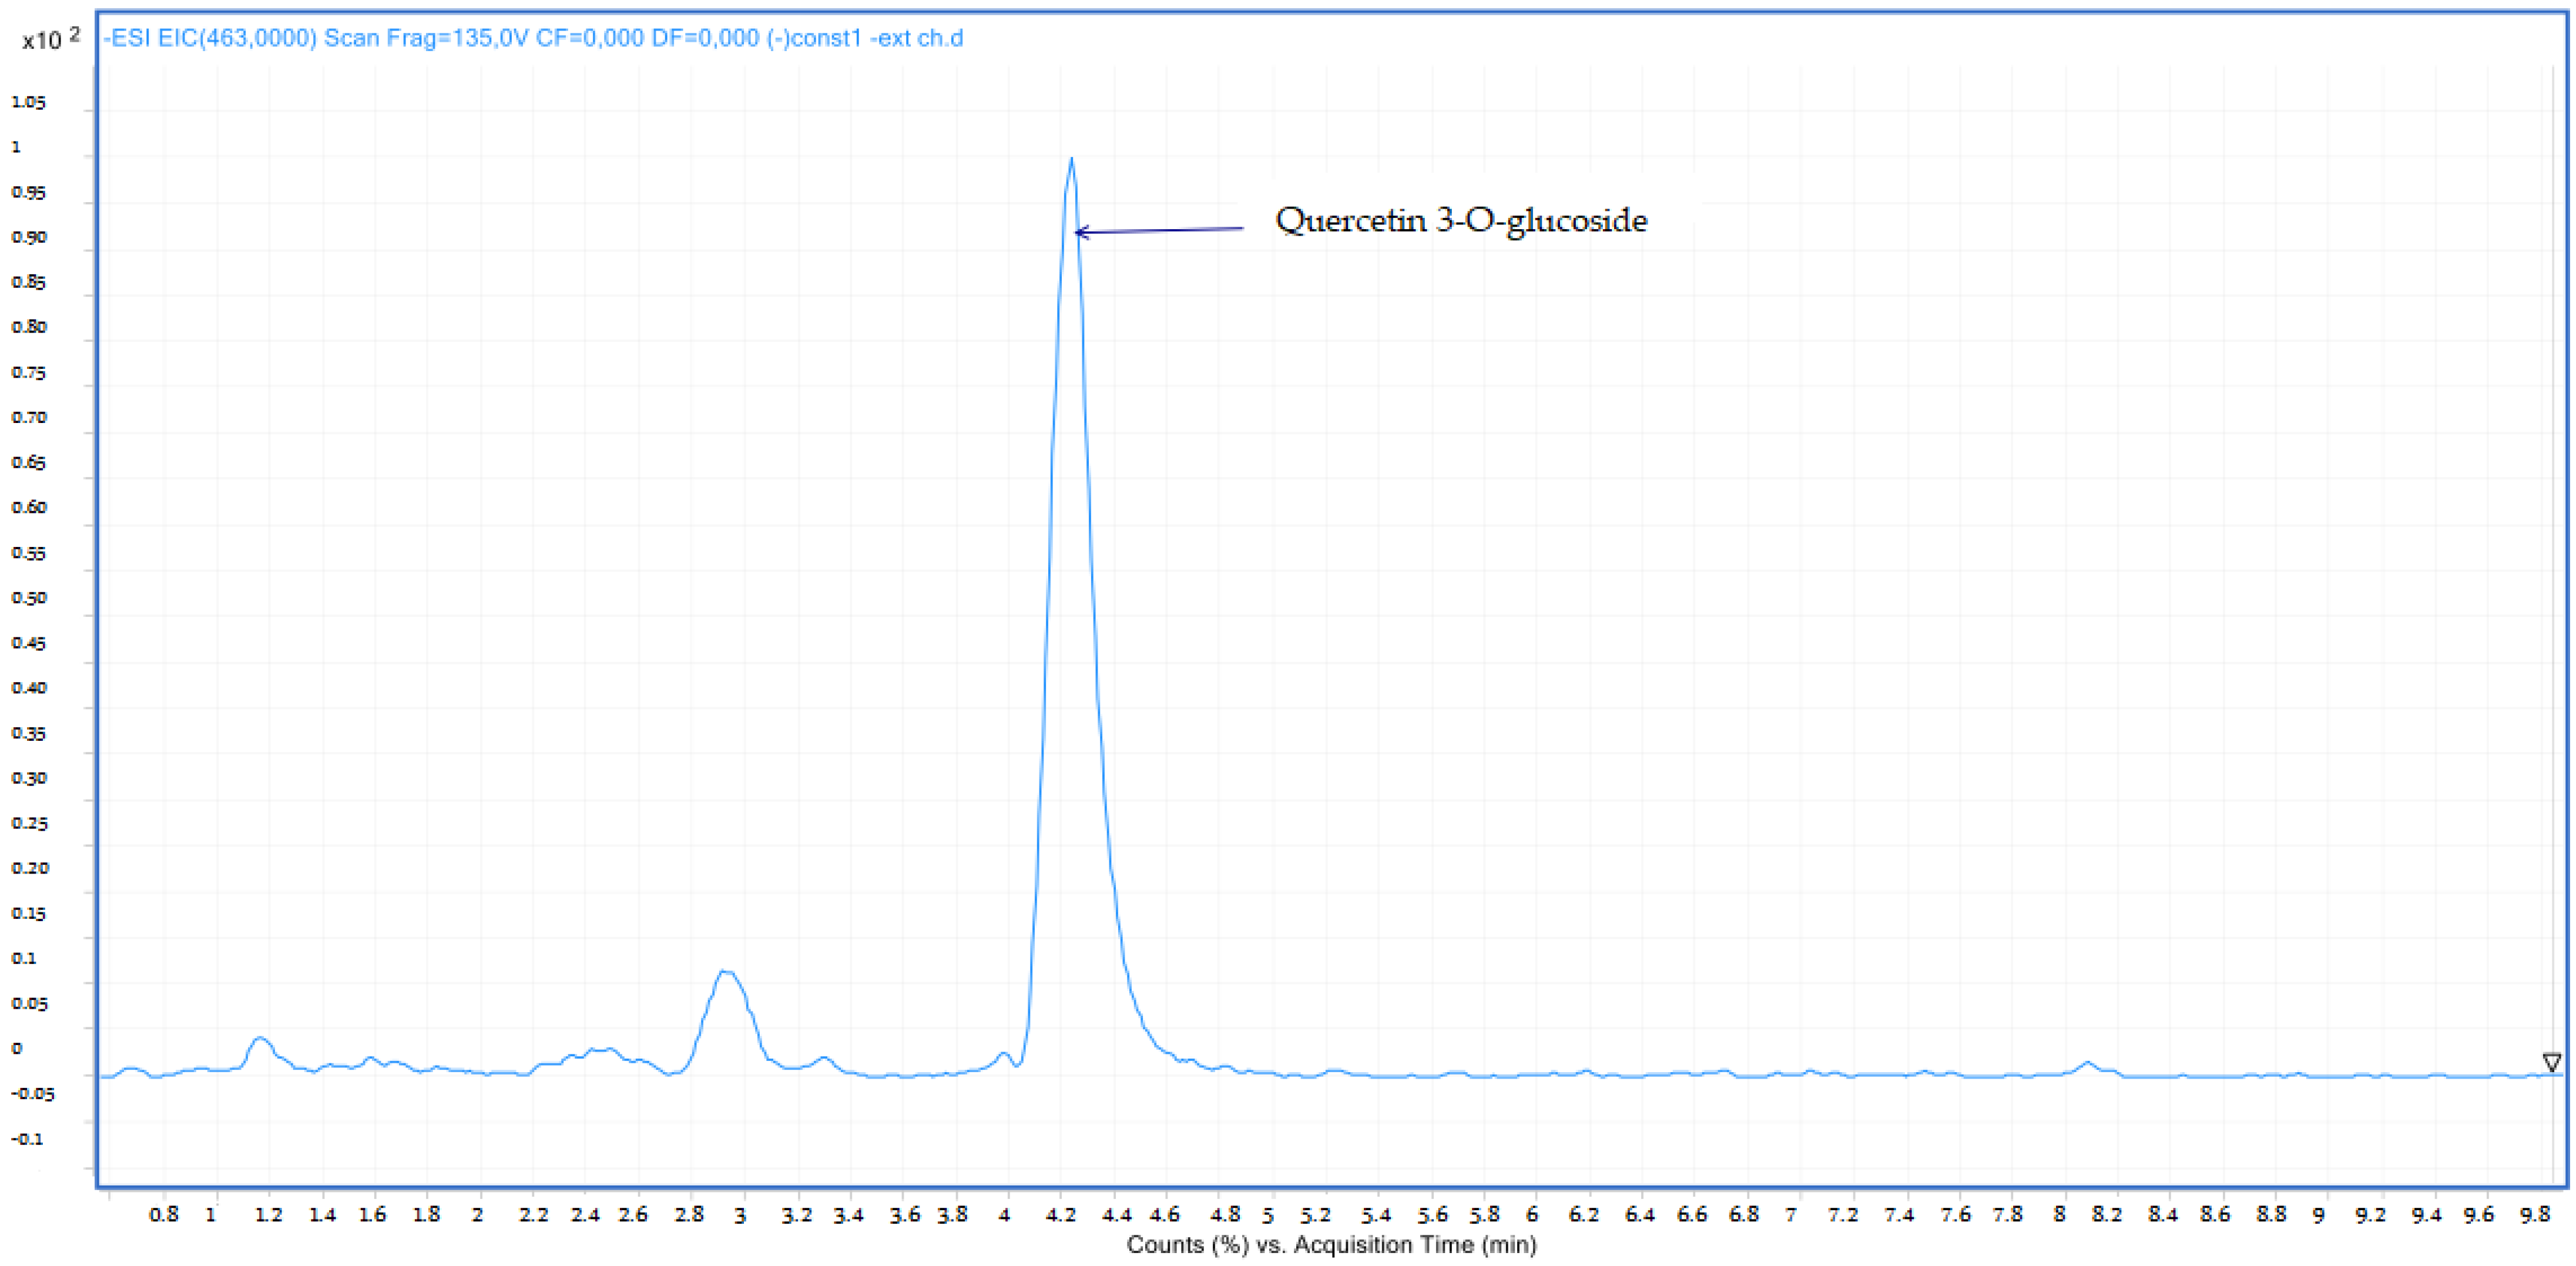
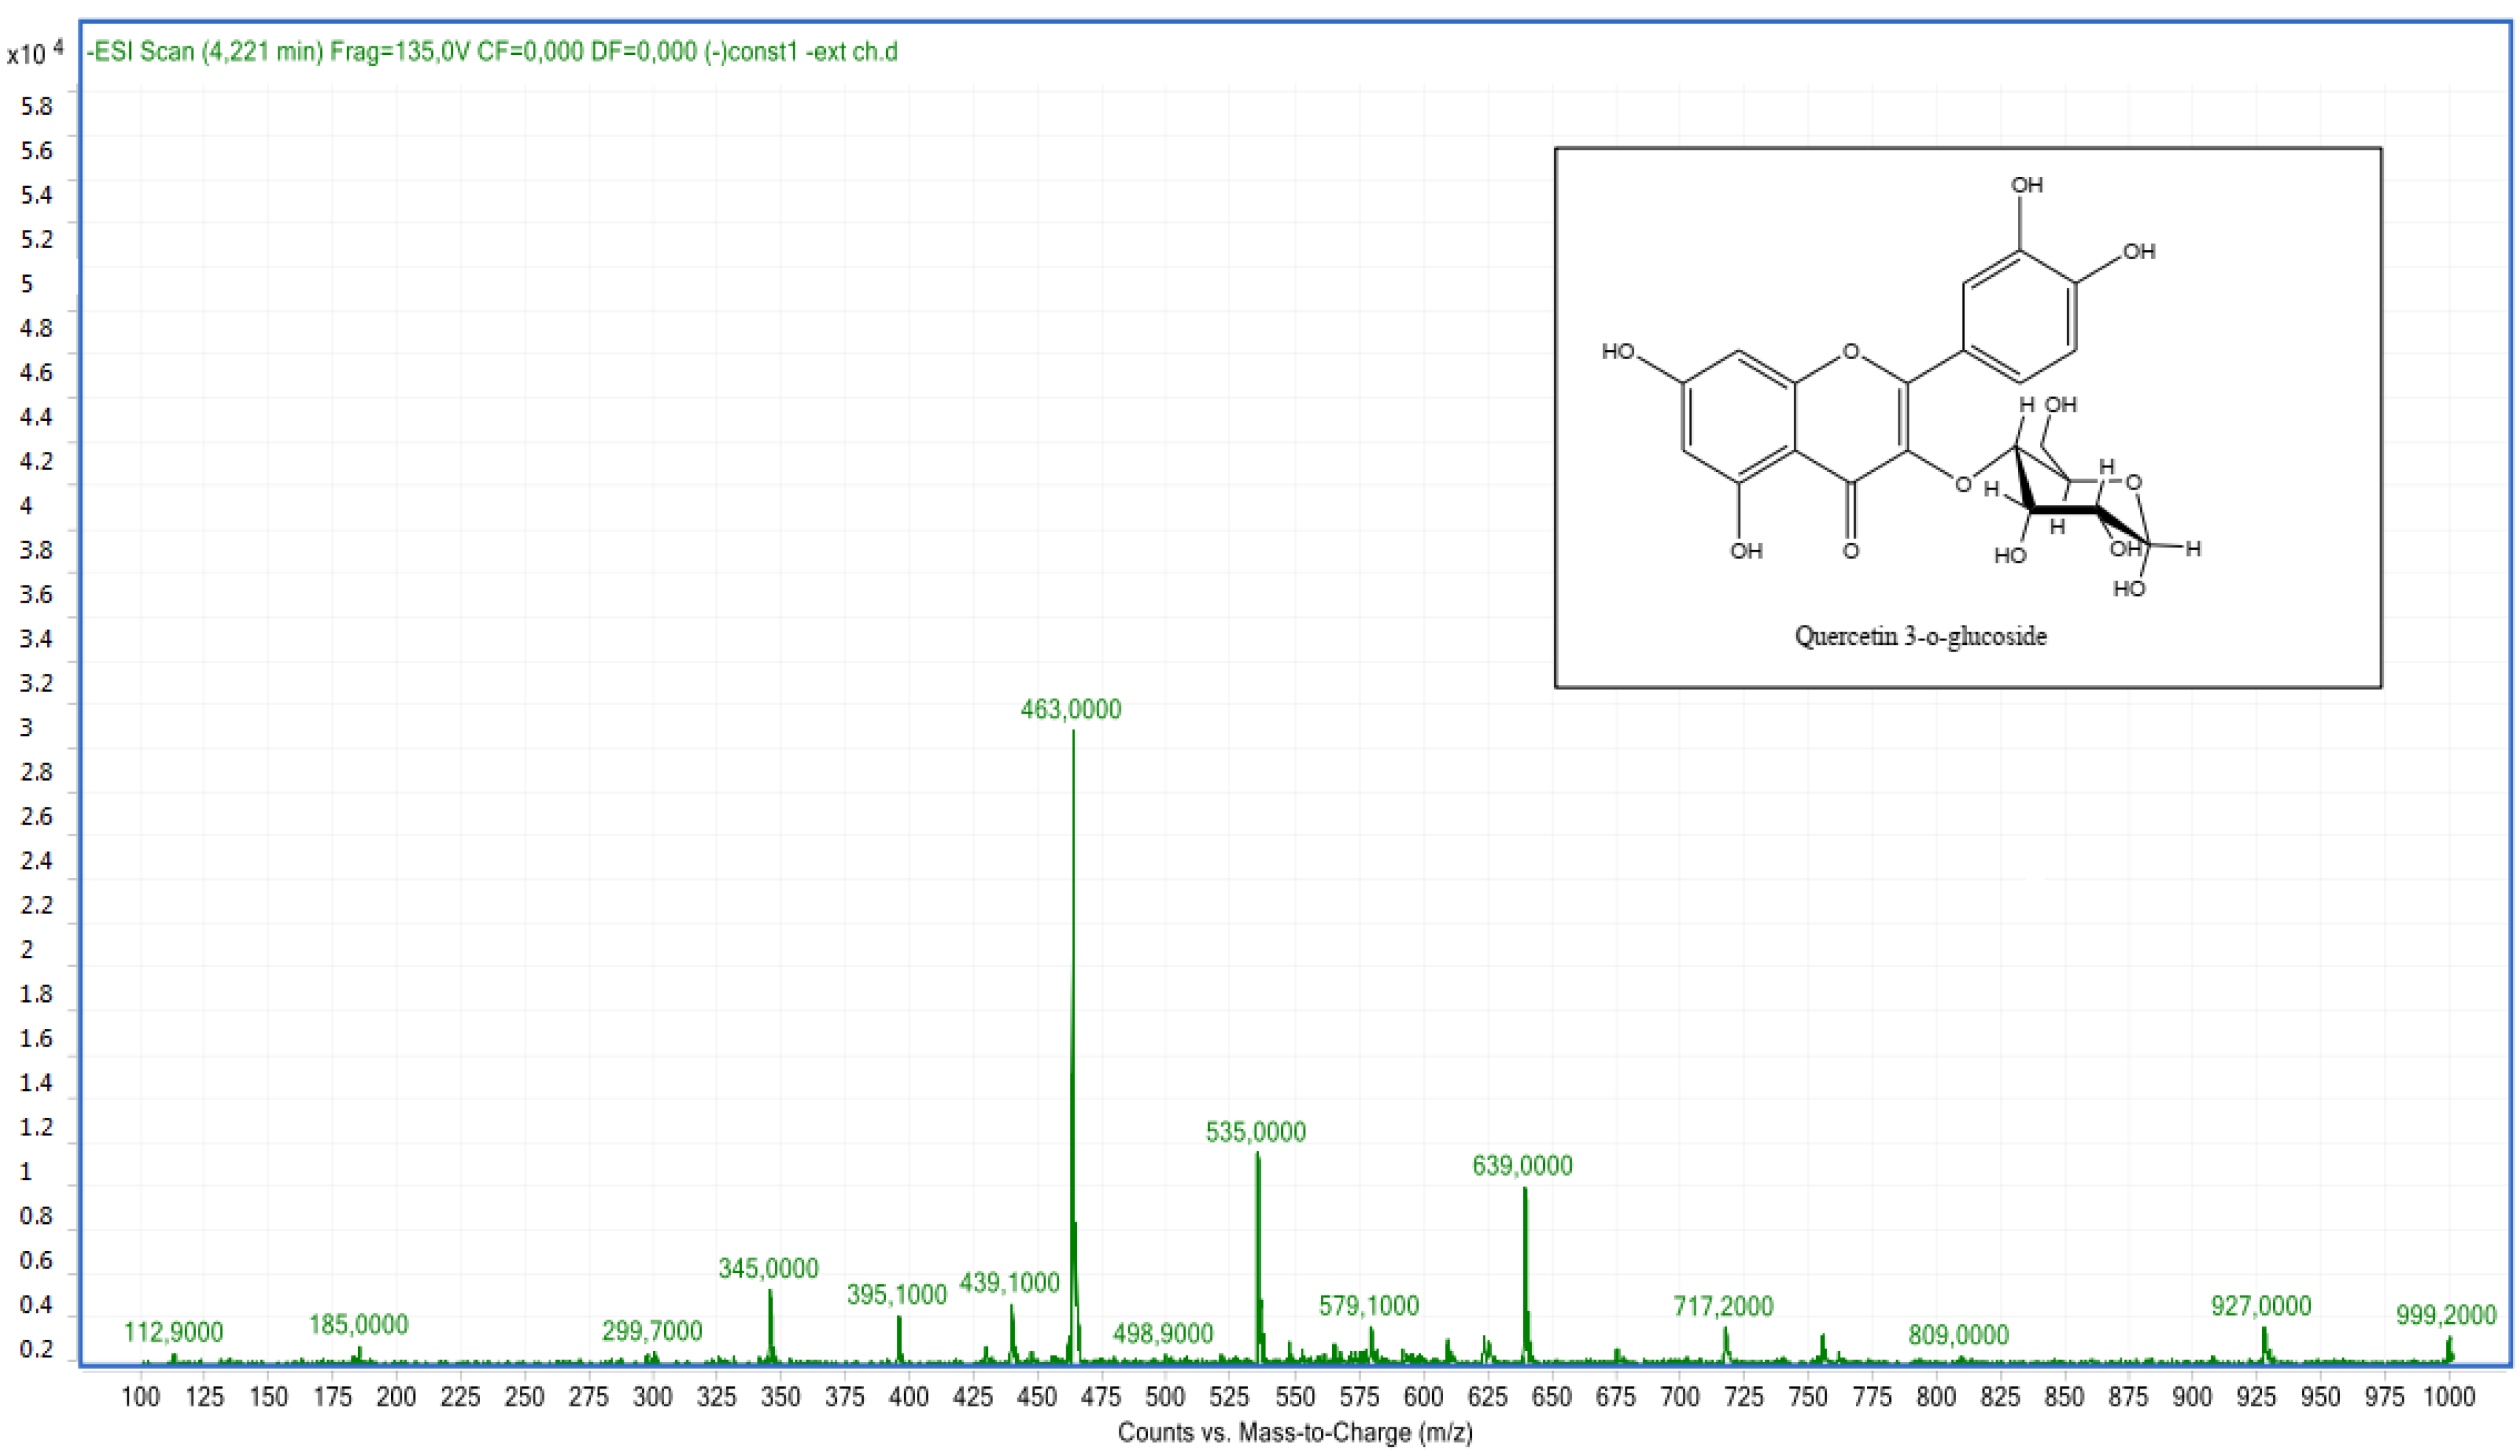
Compound 7: The peak that appears at a retention time of 4.26 mn with m/z = 463.00 and a crude formula of C21H20O12 has been identified as quercetin 3-O-glucoside (Figure 10 and Figure 11).
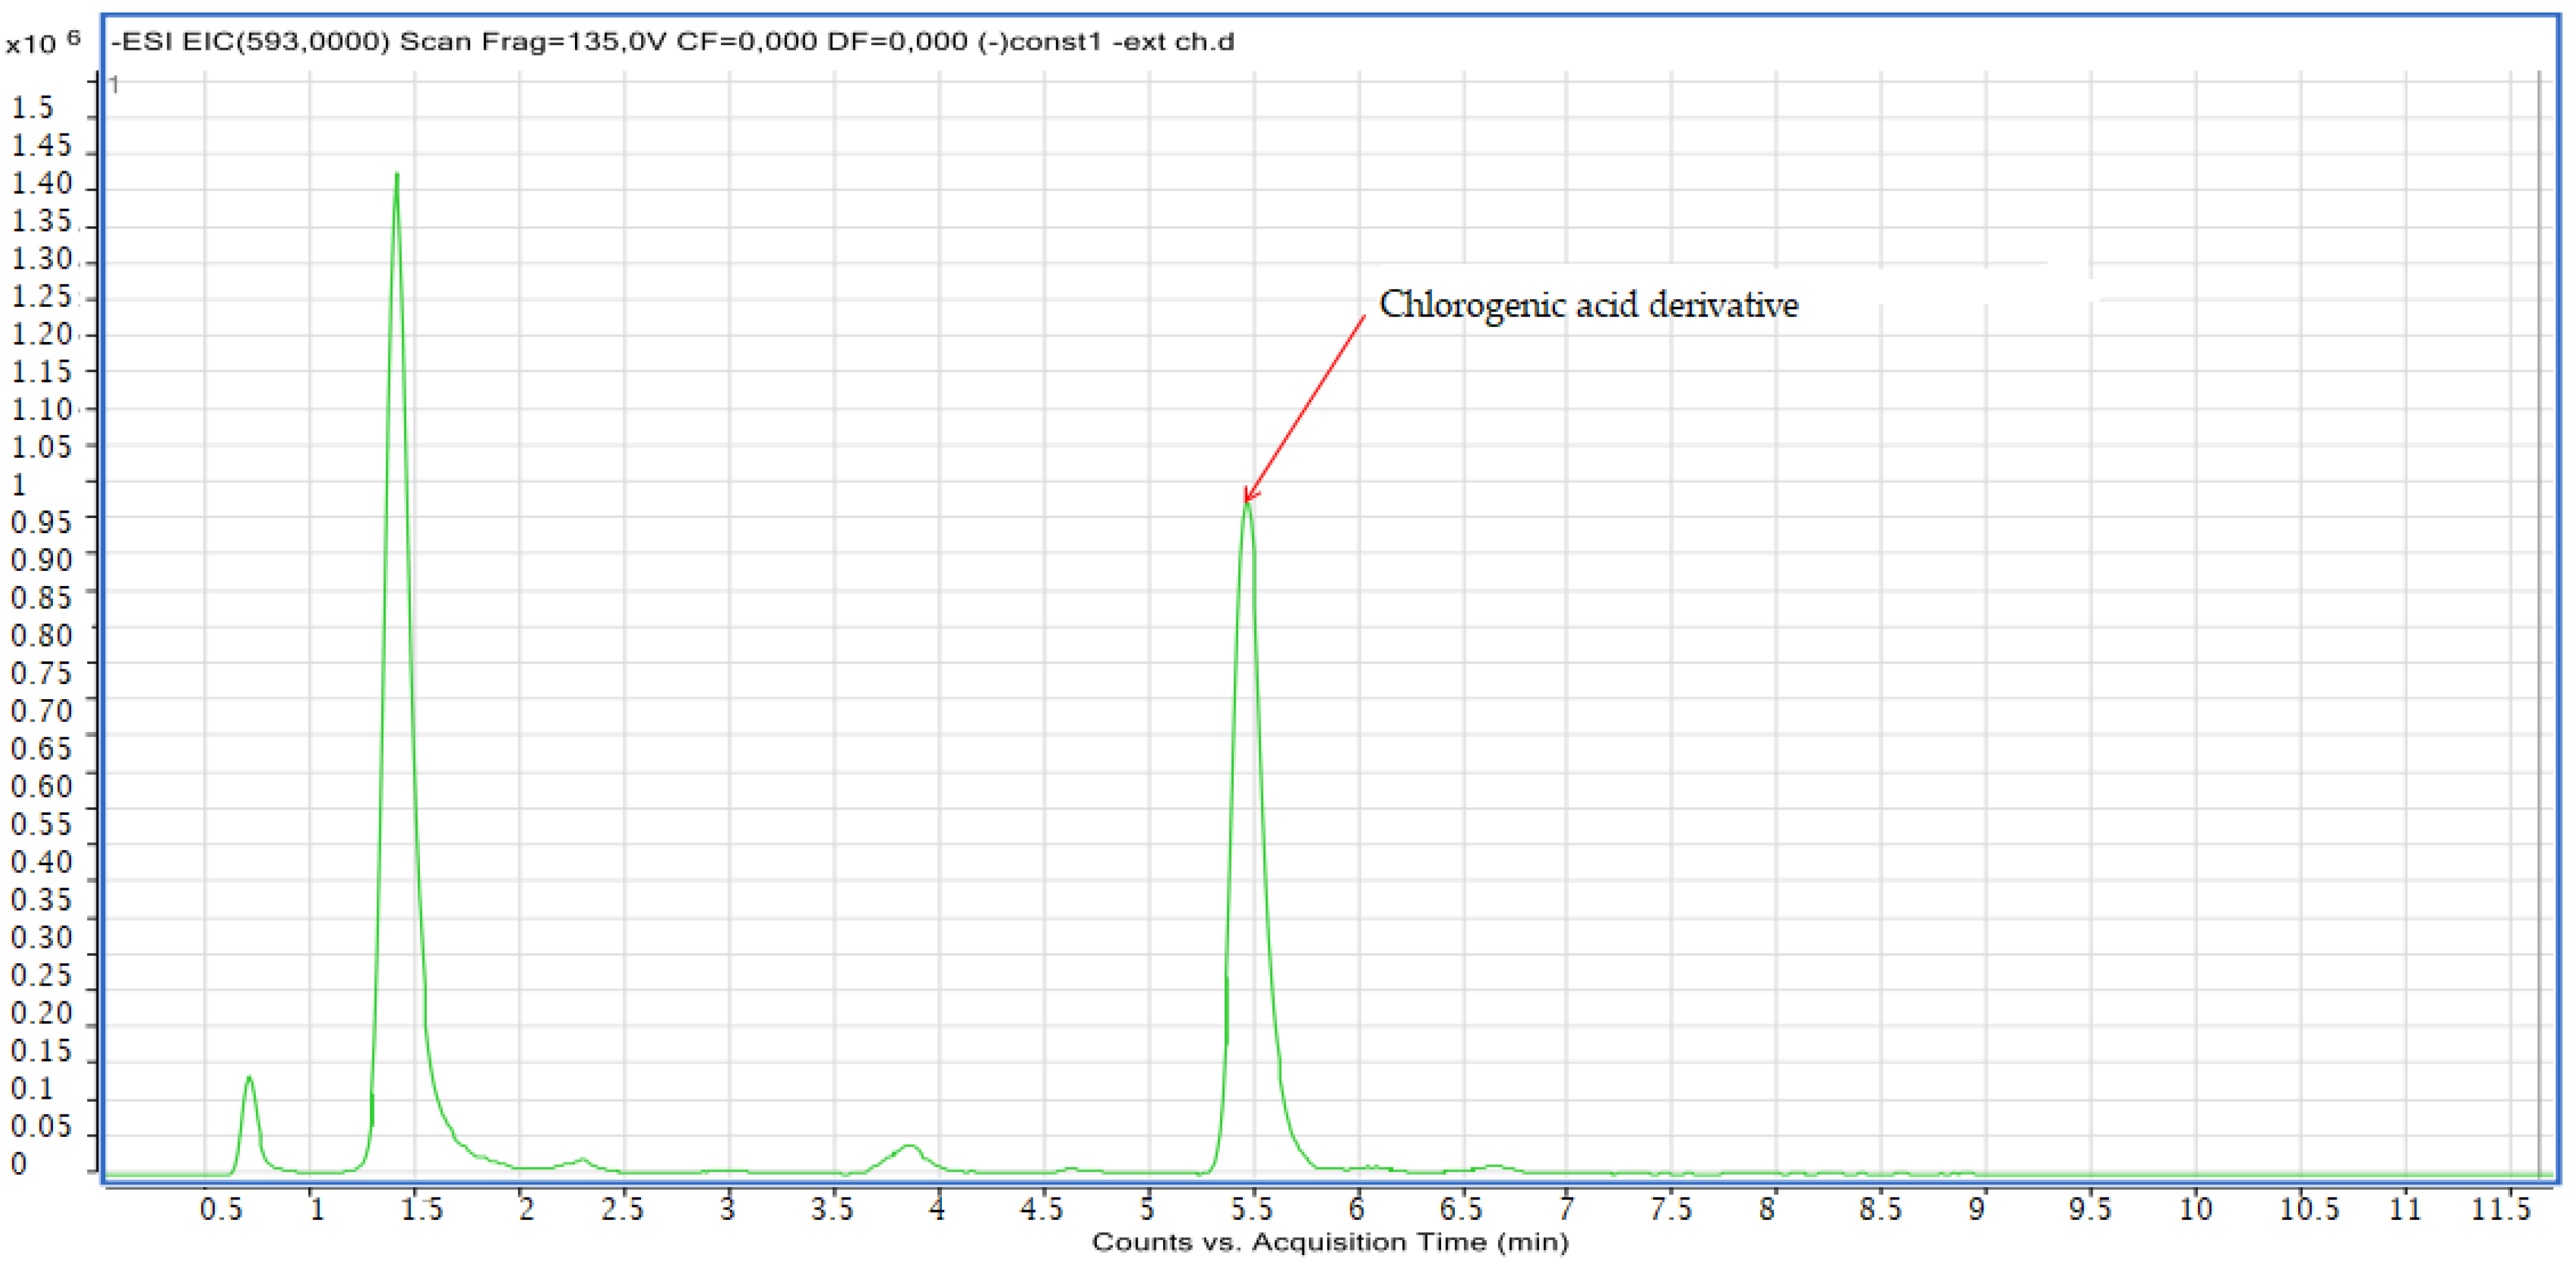
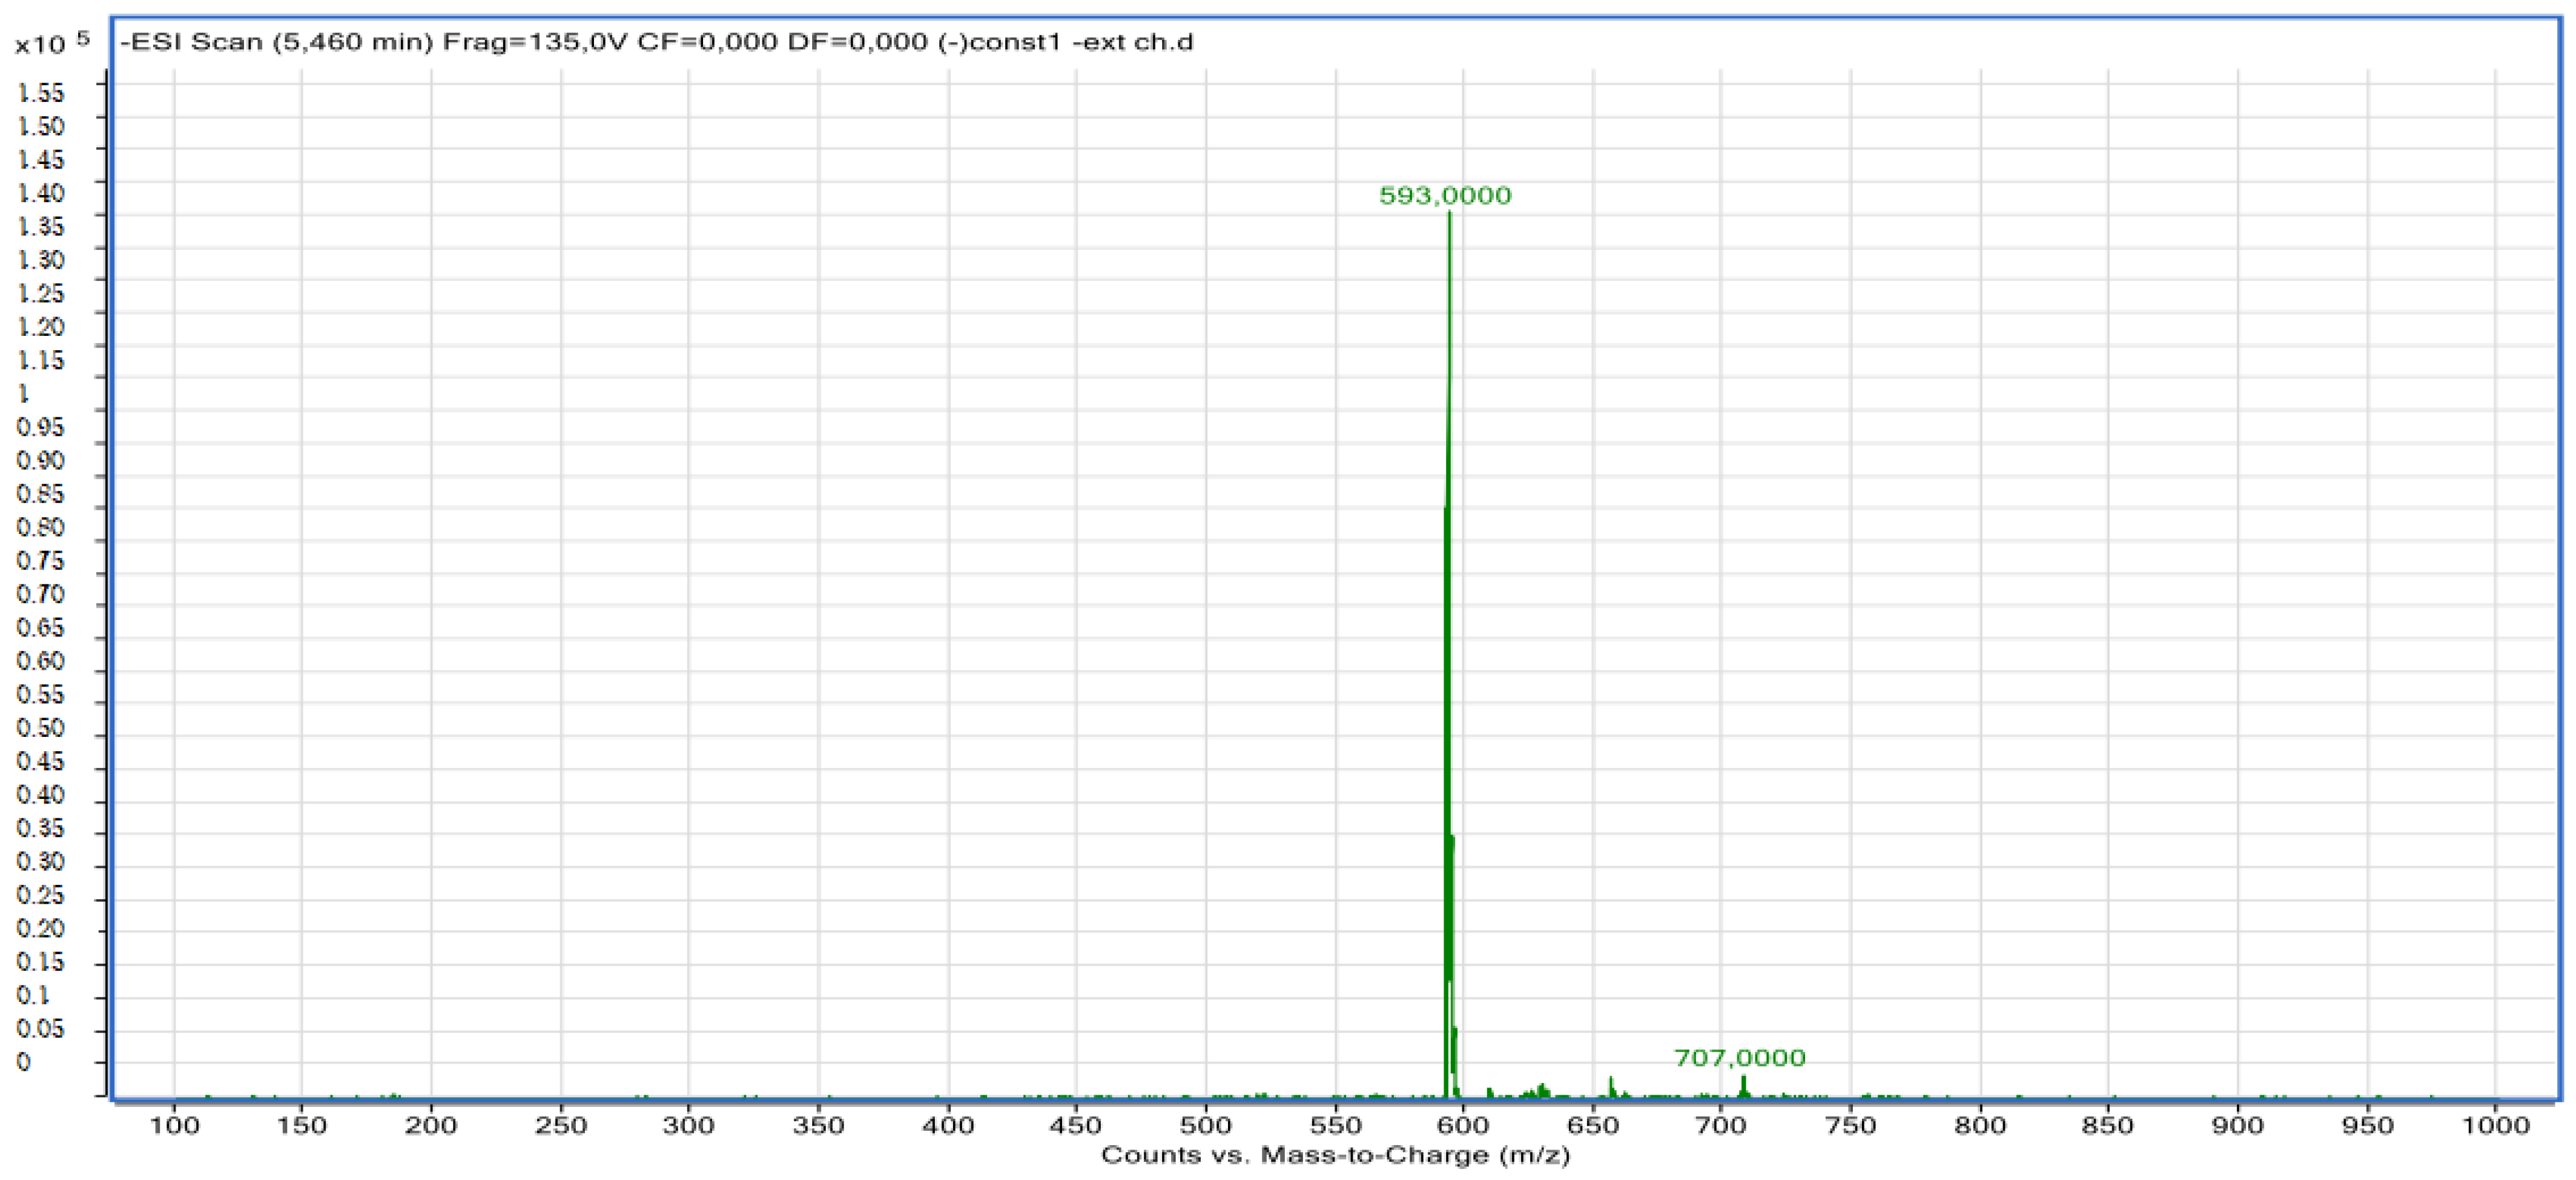
Compound 8: The peak that appears at a retention time of 5.46 mn with m/z =463.00 and a crude formula of C30H10O14 was identified as chlorogenic acid derivative (Figure 12 and Figure 13).
Analysis of the results from the Agilent Mass Hunter Workstation Qualitative Analysis Software B.06.00 for negative ionization in comparison with the data in the literature allowed us to identify eight compounds (Table 2).
An attempt to identify the phenolic compounds contained in the BUE was based on accurate mass comparisons [M-H] of pseudo-molecular ions with those found in accordance with the literature. The LC-MS analysis of the butanolic extract of C. parviflora identified eight compounds including six phenolic acids and two flavonoids: quinic acid, five derivatives of chlorogenic acid, rutin and quercetin 3-o-glucoside.

2.3. Antioxidant Activity

The total phenolic content (TPC), total flavonoid content (TFC) and total flavonol (TFOL) content and the antioxidant activity of the different extracts and fractions of C. parviflora were determined using different methods, and the results are shown in Table 1 and Table 3.
The difference in the polyphenol and flavonoid contents of the crude extracts and their fractions results from the difference in polarity of the organic solvents, the extraction time and temperature, the solid–liquid extraction ratio as well as the chemical and physical characteristics of the samples [30]. By comparing the results obtained, the TPC, TFC and TFOL of the different extracts were analyzed and presented in Table 1.
The results of the determination of the total phenolic compounds were obtained by extrapolating the absorbance of the extracts on the gallic acid calibration curve. The results show that the BUE is the extract richest in polyphenols with a content of 175.27 ± 2.79 µg GAE/mg of extract followed by the EAE (136.94 ± 2.94 µg GAE/mg of extract, Tukey’s HSD test: p-value < 0.01). In fact, the CE and CHE have the lowest phenolic contents, with 113.51 ± 2.95 and 105.47 ± 1.35 GAE/mg extract, respectively. According to the results in Table 1, the BUE is the richest in flavonoids with 59.89 ± 0.91, followed by the CE with a content of 24.49 ± 0.49 µg QE/mg extract. The flavonol content of the extracts was determined using the aluminum trichloride colorimetric method (AlCl3) at 440 nm. As shown in Table 1, the results indicate that the BUE exhibited higher flavonols (47.30 ± 0.51), followed by EAE (27.86 ± 1.45 µg QE/mg of extract).
The TPC of plant extracts depend on the type of extract, i.e., the polarity of the solvent used in extraction. The high solubility of phenols in polar solvents provides a high concentration of these compounds in the extracts obtained using polar solvents. The concentration of flavonoids in plant extracts depends on the polarity of the solvents used in the extract preparation [31]. Therefore, many studies have demonstrated that polar solvents give higher yields than non-polar solvents, since polar solvents have the ability to spread within the plant powder, reaching the vegetable matrix and therefore recovering the possible metabolites. In contrast, non-polar solvents, which are immiscible with water, do not have the ability to extract the maximum number of bioactive molecules because of the water contained in the plant tissue.
The anti-radical activity of the extracts toward the radical DPPH• was evaluated with spectrophotometry at 517 nm following the reduction of this radical, which is accompanied by a change from violet to yellow color. In this test the results were compared to the reference standards (BHA and BHT). The BUE showed the best anti-radical activity compared with the other extracts (IC50 = 59.38 ± 0.72 µg/mL); this activity was twice as low as BHT (IC50 = 22.32 ± 1.19 µg/mL) and eleven times as low as BHA (IC50 = 5.73 ± 0.41 µg/mL).
The scavenging activity towards the galvinoxyl radical was evaluated with spectrophotometry at 428 nm following the anti-radical reaction, which changes the solution’s color from dark yellow to light yellow. In this test the results were compared to the reference standards (BHA and BHT). From the values of IC50 (μg/mL) calculated from the inhibition percentage curves, it is noted that the BUE showed the highest scavenging activity with a value of (IC50 = 36.25 ± 0.72 μg/mL) followed by the EAE (IC50 = 97.72 ± 3.07μg/mL), CE (IC50 = 88.87 ± 1.86 μg/mL) and the CHE (IC50 > 200 μg/mL). The BUE’s activity was ten times lower than against BHT (IC50 = 3.32 ± 0.18 µg/mL) and six times lower than against BHA (IC50 = 5.38 ± 0.06 µg/mL). This test confirms the results of the previous test.
The antioxidant activity assessed using CUPRAC is based on the measurement of the absorbance at 450 nm, which indicates the reduction in the presence of an antioxidant of the stable complex neocuproine-copper (II) (blue color) to the stable complex neocuproine-copper (I) (orange color). Based on the results in Table 3, the BUE has the highest inhibitory activity of the samples studied, with a value of A0.5 = 71.80 ± 1.22 µg/mL, followed by the EAE, CE and CHE with values of A0.5 equal to 92.00 ± 4.85, 128.44 ± 4.14 and 188.33 ± 4.62 µg/mL, respectively (Tukey’s HSD test: p-value < 0.01). The BUE’s activity is seven times lower than that of BHT (A0.5 = 9.62 ± 0.87µg/mL) and twenty times lower than that of BHA (A0.5 = 3.64 ± 0.19 µg/mL) (Tukey’s HSD test: p-value < 0.01). The results of this test confirm the results of the first two tests.
Potassium ferricyanide is reduced in the presence of an antioxidant to form potassium ferrocyanide, which then reacts with ferric chloride to form a blue-green ferrous iron complex, which has a maximum absorbance at 700 nm. The results are shown in Table 3. The results of the reducing potency test confirm the results of the first three tests: the BUE, with a value of A0.5 = 119.17 ± 0.29 µg/mL, showed the best activity compared to other extracts from the same plant (Tukey’s HSD test: p-value < 0.01). This activity is much lower than that of the two standards, ascorbic acid (A0.5 = 6.77 ± 1.15 µg/mL) and tannic acid (A0.5 = 5.39 ± 0.91 µg/mL), but is three times lower than the standard α-tocopherol (A0.5 = 34.93 ± 2.38 µg/mL). This result may be due to the presence of electron donor compounds, since the reducing-power method follows the mode of action of electron transfer (ET).
In the presence of an antioxidant, ferric iron (Fe+3) is reduced to ferrous iron (Fe+2), and the latter forms a stable complex with orange-red phenanthroline, which has a maximum absorbance at 510 nm. Compared to the other extracts, the BUE showed the best iron-reduction activity, with A0.5 = 20.29 ± 1.16 µg/mL, twenty times lower than BHA (A0.5 = 0.93 ± 0.07 µg/mL) and nine times lower than BHT (A0.5 = 2.24 ± 0.17 µg/mL). The results of this activity are consistent with the previous five methods.
ABTS (2,2′-azino-bis (3-ethylbenzothiazoline-6-sulphonic acid)) is a stable organic compound used in the evaluation of anti-radical activity, with a maximum absorbance at 734 nm. In the presence of an antioxidant donor of hydrogen, the cation ABTS•+ undergoes a reduction from blue-green to a neutral colorless state. The results of the ABTS test revealed that the BUE has the best anti-radical activity (IC50 = 49.52 ± 1.54 µg/mL) compared to other extracts from the same plant. Its activity is moderate compared to those of the two standards, BHT and BHA (IC50 = 1.29 ± 0.30, 1.81 ± 0.10 µg/mL, respectively). The results of the sixth test confirm the results of the previous tests.
The superoxide-radical-scavenging activity of the extracts was measured. As shown in Table 3, all the extracts have a scavenging activity against the superoxide radical and the highest activity was recorded for the BUE (IC50 = 13.61 ± 0.384 µg/mL), followed by the EAE (IC50 = 14.36 ± 0.90 µg/mL), the CE (IC50 = 21.91 ± 0.70 µg/mL) and finally the CHE (IC50 = 64.77± 2.37µg/mL) (Tukey’s HSD test: p-value < 0.01). Taking into account the high inhibition values of the extracts at the different concentrations, these results are almost within the range of the standards used, tannic acid and α-tocopherol (IC50 = 3.125 µg/mL).
Different plant extracts are potential sources of the natural chemical components responsible for antioxidant activities. It appears that the butanolic extract of C. parviflora shows a perfect antioxidant activity against DPPH, galvinoxyl, ABTS and superoxide free radicals as well as a reducing power in the CUPRAC, Fe+2-phenanthroline, and ferric-reducing tests. It should be noted that the order of efficacy of the studied extracts was similar in all the methods used, along with their polyphenol content, confirming that the effect of the extracts is completely consistent with the richness of these extracts in TPC.
Several studies showed that chronic diseases such as cancer, ageing and cardiovascular, inflammatory and neurodegenerative pathologies are associated with oxidative stress, a metabolic condition that causes cell degeneration. Antioxidant compounds present in fruits and vegetables appear to play a major role in the protection against oxidative stress. Besides fruits and vegetables, plant beverages such as coffee contribute to the dietary intake of antioxidants [32]. Epidemiological studies have shown relationships between the consumption of polyphenol-rich foods and the prevention of diseases such as cancer, coronary heart disease and osteoporosis, and the results of those studies have promoted an interest in polyphenols. Dietary polyphenols are thought to be beneficial for human health by exerting various biological effects such as free-radical scavenging, metal chelation, modulation of enzymatic activity, and alteration of signal transduction pathways [33]. The role of phenolic compounds has been widely shown in the protection against certain diseases due to their possible interaction with many enzymes and their antioxidant properties. Specifically, flavonoids are attributed various properties: antitumor, anti-radical, anti-inflammatory, analgesic, anti-allergic, antispasmodic, antibacterial, hepatoprotective, estrogenic and/or anti-estrogenic [34]. Polyphenols are associated with many physiological processes in the quality of food that occur when the plant is subjected to mechanical injuries. The ability of a plant species to resist attack by insects and microorganisms is often correlated with the content of phenolic compounds [35]. Due to the conjugated ring structure and the presence of hydroxyl groups, many phenolic compounds have the potential to act as antioxidants by hydrogenation or complexation with oxidizing species to scavenge or stabilize free radicals involved in the oxidation process [36]. Chlorogenic acid (CGA) is an important polyphenolic compound that occurs naturally in various agricultural products such as coffee, beans, potatoes, and apples [37]. It has been suggested that this compound exhibits an antioxidant property, and it has been reported that CGA inhibits vitamin A oxidation and protects against the oxidation of epinephrine in vitro. Recently, results from in vivo studies have suggested that CGA provides beneficial effects during ischemia-reperfusion injury of rat liver and paraquat-induced oxidative stress in rats [38]. Chlorogenic acids are phenolic compounds formed by the esterification of cinnamic acids. They exhibit various pharmacological properties. Its antioxidant, anti-obesity, anti-viral, anti-hypertension, antipyretic and anti-inflammatory properties are being studied by various researchers [39]. Chlorogenic acid is a biologically active polyphenol that is soluble in ethanol and acetone. Chlorogenic acids are present in abundance in green coffee beans. They are also found in potatoes, prunes and bamboo. Its wide availability makes it economical and aids its easy application. In addition, it has been found that chlorogenic acids have the capability to modulate lipid metabolism and glucose in both genetic and lifestyle-related metabolic disorders [40]. Chlorogenic acid and caffeic acid have vicinal hydroxyl groups on an aromatic residue, and they exhibit antimutagenic, anti-carcinogenic and antioxidant activities in vitro, which is attributed to the scavenging of reactive oxygen species (ROS) [41]. Chlorogenic acid is a principle phenolic compound in nectarine fruit pulp and has strong antioxidant activity, which is positively correlated with ROS-scavenging ability in peach and nectarine fruit. However, little is known about the effects of polyphenols on fruit proteins. In previous studies, researchers have demonstrated that exogenous CHA can significantly delay the senescence of nectarine fruit [42].
In total, ten flavonoids representing four major categories were screened to evaluate their antioxidant activity. Rutin showed the highest level of free-radical-scavenging capacity, followed by kaempferol, luteolin, quercetin, apigenin, hesperidin, sinensetin, naringenin, naringin and 3,5,6,7,8,3’,4’-heptamethoxyflavone [43]. However, quercetin and quercetin 3-O-glucoside displayed antioxidant activities that were consistent with the reported activities of these flavonoids in the literature [44]. The results obtained by Razavi [45] showed that quercetin 3-O-glucoside exhibits a high antioxidant effect with an RC50 of 22 µg/mL, has low cytotoxicity and has no antibacterial effects. Quercetin 3-O-glucoside also exhibits a high phytotoxic effect, with an IC50 value of 282.7 µg/mL.

Antimicrobial Activity

The antimicrobial activities of the C. parviflora extract were evaluated using the well-diffusion technique, and the results are shown in Table 4 and Figure 14.
The antimicrobial activities of the methanolic extract against bacterial reference and pathogenic fungi were assessed (Table 4). According to the obtained data, the disc method made it possible to determine the action of the plant extracts dissolved in DMSO on the different strains. These tests revealed a good antimicrobial effect of the methanolic extract against most of the tested microbes expect Escherichia coli and Candida albicans. Broadly speaking, we found values for the inhibition zone diameter (IZD, mm) ranging from 7.00 to 12.12 mm and 8.03 to 15.23 mm, respectively, for the 20 and 30 mg/mL extract concentrations. The extracts at a concentration of 30 mg/mL are active and exhibit antimicrobial activity by inhibiting the in vitro growth of microbial germs: S. aureus ATCC6538 (IZD, 8.64 and 7.00 mm), S. aureus ATCC25923 (IZD, 13.22 and 12.00 mm), Salmonella (IZD, 8.03 and 7.00 mm), A. niger (IZD, 8.22 and 7.00 mm) and Pseudomonas sp. (IZD, 15.23 and 12.12 mm). The marked observation to emerge from the data comparison was the potential inhibition effect of C. parviflora extract against Staphylococcus aureus, a leading cause of skin and soft tissue infections, and Pseudomonas sp., which particularly causes infections in the blood, lungs (pneumonia) or other parts of the body after surgery. This is in good agreement with the findings of Naeim et al. [46], who reported a high antibacterial activity of the methanol extract from C. pumilio roots and aerial parts against Staphylococcus aureus and Acinetobacter baumannii strains (MIC, 62.50 μg/mL and 250 μg/mL, respectively). Furthermore, Karamenderes et al. [47] demonstrated high antiprotozoal (Plasmodium falciparum and Leishmania donovani) and antimicrobial (Candida albicans, Candida glabrata, Candida krusei, Cryptococcus neoformans, Mycobacterium intracellulare, Aspergillus fumigatus, and methicillin-resistant Staphylococcus aureus) activities of ten Centaurea L. species growing in Turkey. The data obtained are broadly consistent with the major trends reported in the literature [48]. To cure diseases in humans and animals brought on by microorganisms that are medication-resistant, new antimicrobial medicines are required. Additionally, there is a persistent desire from consumers for “natural” and/or “preservative-free” foods and cosmetics that are microbiologically safe [49]. Plants are a significant source of bioactive constituents including phenols, aromatic components, terpenoids, sterols, essential oils, alkaloids, tannins and anthocyanins that play a significant role in the treatment of many diseases [50]. Methanolic extracts can potentially be used as natural antimicrobial and antioxidant agents against infectious diseases in humans and for the preservation of food products. The development of such natural agents will also help to solve environmental problems caused by synthetic products and synthetic drugs such as pollution and resistance of certain microorganisms.
Phenolic acids have recently gained substantial attention due to their various practical, biological and pharmacological effects. The extended list of chlorogenic acids contains approximately 400 compounds. Chlorogenic acid is an important and biologically active dietary polyphenol, playing several important and therapeutic roles such as antioxidant activity, antibacterial, hepatoprotective, antiviral and antimicrobial [51].

3. Material and Methods

3.1. Plant Materials

The aerial parts of C. parviflora Desf. were harvested in Djebel Djedoug (forest of Dréat, Msila, northern Algeria in June 2021 (altitude 1179 m, latitude 35.8838° or 35°53′2″ North, longitude: 4.3284° or 4°19′42″ East). The taxonomic identification of plant materials was confirmed by Dr. M.D. Miara at the Department of Biology, University of Tiaret, using Flora of Algeria [13], and an herbarium specimen was archived in the Herbarium of Tiaret University, Tiaret, Algeria.

3.2. Extraction and Fractionation

Chemicals

Chloroform, ethyl acetate, butanol, Folin–Ciocalteu reagent, sodium bicarbonate, aluminum chloride, tannic acid, ascorbic acid, 2,2-diphenyl-1-picrylhydrazyl (DPPH), 2,2′-azino-bis(3-ethylbenzothiazoline-6-sulfonic acid) diammonium salt (ABTS), potassium persulfate, hydrogen peroxide, disodium hydrogen phosphate, sodium phosphate monobasic dihydrate, ferrous chloride, trichloroacetic acid (TCA), nitroblue tetrazolium (NBT), ferric chloride, butylated hydroxyanisol (BHA) and butylated hydroxytoluene (BHT) were supplied by Sigma-Aldrich (St. Louis, MO, USA).
The extraction of the plant powder was conducted according to Zaak et al. [52] and Mammeri et al. [53]. The first step consisted of a solid–liquid extraction, where an amount of 50 g of aerial-art powder was macerated at room temperature three times with 300 mL methanol–water (80%). The combined filtrates were evaporated under low pressure with a rotary evaporator (40 °C) to yield the crude methanolic extract (CE). Then, the crude extract was subjected to liquid–liquid extraction (fractionation) using organic solvents of increasing polarity: chloroform giving chloroform extract (CHE), ethyl acetate giving ethyl acetate extract (EAE) and n-butanol giving butanol extract (BUE). All solvents were removed using a rotary evaporator.

3.3. Chromatographic Analysis

3.3.1. Qualitative Analysis with Thin-Layer Chromatography (TLC)

Thin-layer chromatography is a rapid analytical technique and method for separating compounds. It applies to pure molecules and extracts. It is a rapid physicochemical method based on the phenomena of adsorption, interaction and polarity. Compounds can be characterized according to their Rf (retention factor). It allows us to obtain a general idea of the metabolites present and allows an easy and fast control of the purity of a compound when the operating conditions are well-determined. The methanolic extract was checked with TLC on analytical plates over silica gel. Aluminum plates coated with Merck 60F254 silica gel were used. Solvent systems of different polarities were prepared (Table 5).
The methanolic extract was applied to pre-coated TLC plates using capillary tubes and developed in a TLC chamber using mobile phases. The developed TLC plates were air-dried and observed under visible light and ultra violet light (UV, 254 and 366 nm). The movement of the analyte was expressed as its retention factor (Rf):
Rf = Distance travel by solute/Distance travel by solvent (Rf—Retention factor)

3.3.2. HPLC Analysis

The phenolic constituents in the butanolic fraction of C. parviflora were investigated using LC-MS analysis and tentatively identified by comparison with the literature. The HPLC analysis was performed using the Agilent 6420 series triple-quadrupole double-MS instrument with the latest generation of high-performance liquid chromatography, the HPLC 1260 infinity LC, equipped with a vacuum degreaser, Infinity 1260 automatic injector, double-piston pump in series and ultra-sensitive diode (DAD) baratte UV detector. The column used for chromatographic separation was a Zorbax Eclipse Plus C18 (1.8 μm, 150 mm × 4.6 mm) (Agilent Technologies, Palo Alto, CA, USA). In separating the compounds from the butanolic fraction of C. parviflora, the rate of flux used was 0.80 mL/min and the analysis was performed at room temperature. A gradient elution was run, utilizing as eluent A water with 0.1% formic acid and as eluent B acetonitrile. The following multistage linear gradient was applied: 0 min, 15% B; 35 min, 95% B; 40 min, 95% B; 55 min, 15% B and, finally, a conditioning cycle of 5 min, with the same conditions for the following analysis. The injection volume was 10 µL. The flow rate of the mobile phase was 0.4 mL/min, and the temperature of the column was maintained at 40 °C. The mass spectrometer was operated in the negative ion mode with a capillary voltage of 4000 V and the drying gas stream was the nitrogen.

3.4. Antioxidant Activities

3.4.1. Total Phenolic Content (TPC)

The TPC of extracts was estimated with the method of Müller [54]. A mixture of 200 µL sample and 1 mL of 10% Folin–Ciocalteu reagent was incubated for 4 min, and then 800 µL of sodium carbonate (7.5%) was added. All reactants were finally incubated for 2 h and the absorbance was taken at 765 nm against the corresponding blank. Gallic acid was used as a standard and a calibration curve was prepared in the same conditions (y = 0.0034 x + 0.1044; R2 = 0.9972). The results were expressed as µg GAE/mg dry extract.

3.4.2. Total Flavonoid Content (TFC)

The total flavonoid content was evaluated following the aluminum trichloride method of Topçu [55] with some modifications. An amount of 300 µL of extract was mixed with the same volume of aluminum trichloride (2%) and incubated for 15 min. The absorbance was measured at 430 nm. For this assay, quercetin was used to prepare a calibration curve in the same conditions (Y = 0.0071x + 0.0274; R2 = 0.9985). The results were expressed as QE/mg.

3.4.3. Total Flavonol (TFOL) Content

To evaluate the flavonol content of our extracts, 1 mL of sample and 1 mL of aluminum trichloride (2%) were mixed with 1.5 mL of aqueous sodium acetate (5%) and incubated at 25 °C for 2.5 h. The absorbance was then read at 440 nm and the results were expressed as RE/mg dry extract using a calibration curve prepared with rutin (y = 0.0122x + 0.0179; R2 = 0.9991) [56].

3.4.4. DPPH Free-Radical Scavenging

The DPPH free-radical-scavenging activity was assessed using the Blois method [57]. Briefly, in a 96-well microplate (PerkinElmer Multimode Plate Reader EnSpire, Waltham, MA, USA), 40 µL of the sample at different concentrations was added to 160 µL of freshly prepared DPPH (0.1 mM). The absorbance of the reaction mixture was measured using spectrophotometry at a wavelength of 517 nm after an incubation of 30 min at room temperature in darkness. The percentage of inhibition was calculated using the following equation:
% Inhibition = (Ac − At/Ac) × 100
where Ac is the absorbance of the control and At is the absorbance of the test.
The inhibitions obtained were plotted against the sample concentrations and the resulting plots were used to calculate the IC50 (the concentration of the sample that reduced 50% of the DPPH).

3.4.5. Galvinoxyl Free-Radical Scavenging

The galvinoxyl free-radical-scavenging activity was determined using Shi’s [58] method. In a 96-well microplate, a volume of 160 µL of galvinoxyl (0.1 mM) was added to 40 µL of sample prepared at different concentrations. After 120 min, the absorbance was measured at a wavelength of 428 nm. The inhibition percentage was calculated according to the following equation:
% Inhibition = (Ac − At/Ac) × 100
where Ac is the absorbance of the control and At is the absorbance of the test.
The inhibitions obtained were plotted against the sample concentrations and the resulting plots were used to calculate the IC50 (the concentration of the sample that reduced 50% of the calvinoxyl).

3.4.6. ABTS-Scavenging Assay

The radical-scavenging activity was evaluated using the stable cation radical ABTS, as described by Re et al. [59]. The ABTS radical was generated by mixing the ABTS solution (7 mM) with 13.24 mg of potassium persulfate for 16 h. The resulting solution was refrigerated, then diluted to reach an absorbance of 0.7 ± 0.02 at 734 nm. A 100 µL volume of the sample was mixed with 1.9 mL of ABTS•+ solution and incubated. After 7 min, the absorbance was measured at 734 nm. BHA and BHT were used as standard compounds. The ABTS inhibition was calculated using the following formula:
% Inhibition = (Ac − At/Ac) × 100
where Ac is the absorbance of the control and At is the absorbance of the test.
The inhibitions obtained were plotted against the sample concentrations and the resulting plots were used to calculate the IC50 (the concentration of the sample that reduced 50% of the ABTS).

3.4.7. Superoxide-Radical-Scavenging Activity (O2•−)

The activity was determined according to the method of Elizabeth and Rao [60]. In a 96-well plate with a volume of 200 μL for each well, 40 μL of the sample solution at different concentrations (3.125, 6.25, 12.5, 25, 50, 100 and 200 μg/mL), 130 μL of alkaline DMSO (20 mg of NaOH in 100 mL DMSO), and 30 μL of NBT (10 mgNBT in 10 mL of distilled water). Absorbances are measured instantaneously at room temperature at 560 nm (results were expressed as the average of three separate measurements ± standard deviation).
A blank was prepared for each concentration. Tannic acid and ascorbic acid were used as reference compounds. Percent inhibition of superoxide was calculated according to the following equation:
% Inhibition = (Ac − At/Ac) × 100
where Ac is the absorbance of the control and At is the absorbance of the test.
The inhibitions obtained were plotted against the sample concentrations and the resulting plots were used to calculate the IC50 (the concentration of the sample that reduced 50% of the superoxide).

3.4.8. CUPric Reducing Antioxidant Capacity (CUPRAC)

This activity was determined with the method of Apak et al. [61]. In a 96-well plate, 40 μL of the sample was added to 60 μL of ammonium acetate buffer (1 M, PH = 7), 50 μL of neocuproine (7.5 mM) and 50 μL of CuCl2 (10 mM). After one hour, the absorbance was recorded at 450 nm with a microplate reader. The antioxidant activity results were calculated as A0.5 (µg/mL).

3.4.9. Ferric-Reducing Power

The reducing power of the extracts was determined according to the methods of Bouratoua [62]. A volume of 10 μL of the extract at different concentrations was mixed with 40 μL of phosphate buffer solution (0.2 M, pH = 6.6) and 50 μL of a potassium ferricyanide [K3Fe (CN)6] solution (1%). The mixture was incubated at 50 °C for 20 min. Then, 50 µL of trichloroacetic acid (10%) was added to stop the reaction and the whole was centrifuged at 3000 r/min for 10 min. Finally, 50 µL of the supernatant solution was mixed with 50 µL of distilled water and 10 µL of FeCl3 (0.1%) and the absorbance was recorded at 700 nm after incubation for 10 min. An increase in the absorbance corresponds to an increase in the reducing power of the test extracts.

3.4.10. Phenanthroline Test

The reduction activity in terms of the formation of the Fe+2-phenanthroline complex of the extracts was measured using the method described by Szydlowska-Czerniaka [63] and Aissani et al [64]. A volume of 10 μL of various concentrations of extract or standards was added to the reaction mixture containing deoxyribose, then 50 μL FeCl3 (0.2%), 30 µL phenanthroline (0.5%) and 110 µL of the methanol were added. The mixture was vigorously agitated and incubated for 20 min in the oven at 30 °C. The absorbance was determined at 510 nm. The results were calculated as A0.5 (μg/mL), corresponding to the concentration indicating 0.50 absorbance.

3.4.11. Microorganisms

A total of 8 microbial cultures belonging to bacteria, yeast and fungi species were used in this study. The antimicrobial activity of the methanolic extract of C. parviflora was evaluated In vitro with the growth of several bacterial, fungal and yeast strains, namely P. aeruginosa, S. aureus, B. subtilis, E. coli, Salmonella, Aspergillus niger and Candida albicans. The microorganisms were provided by the laboratory of the Department of Microbiology, M’sila University, M’sila, Algeria.
The crude methanolic extract was diluted to a final concentration of 30 mg/mL, then sterilized by filtration (0.45 m) with Millipore filters. The antimicrobial tests were carried out using the disc-diffusion method, using 100 µL of suspension containing 108 CFU/mL of bacteria or 106 CFU/mL of yeast spread on nutrient agar (NA) and Sabouraud dextrose agar (SDA), respectively. The discs (6 mm in diameter from Whatman N° 1 filter paper) were impregnated with 10 µL of the methanolic extracts placed on the surface of the agar. Negative controls were prepared using the same solvents. The Petri plates were placed at a low temperature (+4 °C) for 15 to 30 min to allow the extracts to diffuse into the agar before the bacteria began to multiply. After 24 h of incubation at 37 °C for bacterial strains and 48 h for yeast and fungi isolates, the diameter of inhibition (mm) surrounding the disc was measured using a graduated ruler. The diameter is proportional to the sensitivity of the germ studied. Each assay in this experiment was repeated twice.

3.5. Statistical Analyses

The results of the tests carried out are expressed as an average ± SD of analyses in three tests. The values of IC50 (50% inhibition concentration) and A0.5 (the concentration indicating 0.50 absorbance) are calculated using the linear regression method from the two curves: [% inhibition = f (concentration)] for IC50 and [Absorbance = f (concentration)] for A0.5. The data were tested first for normality (Kolmogorov–Smirnov test) and equality of variance (Bartlett test) to fulfill the requirements of parametric analyses, and log-transformations were applied when these assumptions were not met. One-way analysis of variance (ANOVA) and Tukey’s honestly significant difference (HSD) test were performed with the software STATISTICA v.8 in order to test for the significant global and pairwise comparisons, respectively.

4. Conclusions

The extraction of the aerial parts of C. parviflora using various solvents led to four extracts who’s phenolic, flavonoid and flavonol contents differ. The methanolic extract had a good antimicrobial effect, making it a product with potential interest in the pharmaceutical industries. Moreover, the antioxidant activity of the different extracts was studied in vitro using seven techniques. The best antioxidant capacity was observed with the BUE and EAE. The results showed that there is a divergent correlation between the TPC of the extracts and its activity as an antioxidant and antimicrobial. This relationship became clearer after the phytochemical analysis, which showed the existence of compounds with specialized effects.
The TLC of the CE confirmed the presence of bioactive compound such as flavonoids, polyphenols, etc. In addition, the LC-MS analysis of the BUE of C. parviflora allowed us to identify eight compounds including six phenolic acids and two flavonoids: quinic acid, five chlorogenic acid derivatives, rutin and quercetin-3-O-glucoside. This preliminary investigation reveals that the extracts of C. parviflora have a good biopharmaceutical activity. The BUE possesses an interesting potential for pharmaceutical/nutraceutical applications.

Author Contributions

Conceptualization, F.Z.H. and H.B.; methodology, C.B.; software, B.Z.; validation, M.M.B. and N.S.; formal analysis, M.I.A. and A.B.; investigation, S.M. and A.A.Q.; resources, S.A.A.; writing—review and editing, F.B.; supervision, M.D.M. and H.B., funding acquisition, S.A.A. and F.B. All authors have read and agreed to the published version of the manuscript.

Funding

The authors extend their appreciation to the Deanship of Scientific Research at Imam Mohammad Ibn Saud Islamic University for funding this work through Research Group no. RG-21-09-92.

Institutional Review Board Statement

Not applicable.

Informed Consent Statement

Not applicable.

Data Availability Statement

All the data are included in the paper.

Acknowledgments

The authors extend their appreciation to the Deanship of Scientific Research at Imam Mohammad Ibn Saud Islamic University for funding this work through Research Group no. RG-21-09-92.

Conflicts of Interest

The authors declare no conflict of interest.

Sample Availability

Samples of all the compounds are available from the authors.

References

  1. Sánchez-Chávez, E.; Rodríguez, A.; Castro-Castro, A.; Angel Pérez- Farrera, M.; Sosa, V. Spatio-temporal evolution of climbing habit in the Dahlia-Hidalgoa group (Coreopsidae, Asteraceae). Mol. Phylogenet. Evol. 2019, 135, 166–176. [Google Scholar] [CrossRef]
  2. Lawrence, G.H.M. Taxonomy of Vascular Plants; Rakes Press; Oxford and IBM Publishing Co.: New Delhi, India, 1973. [Google Scholar]
  3. Matsuda, H.; Morikawa, T.; Toguchida, I.; Harima, S.; Yoshikawa, M. Medicinal Flowers. VI. Absolute Stereostructures of Two New Flavanone Glycosides and a Phenylbutanoid Glycoside from the Flowers of Chrysanthemum indicum L.: Their Inhibitory Activities for Rat Lens Aldose Reductase. Chem. Pharm. Bull. 2002, 50, 972. [Google Scholar] [CrossRef] [Green Version]
  4. Da Silva, A.C.N.; do Nascimento, R.M.C.; do Rodrigues, D.C.N.; Ferreira, P.M.P.; Pessoa, C.; Lima, D.J.B.; de Moraes Filho, M.O.; de Almeida, R.M.; Ferreira, S.R.; Fujiwara, R.T.; et al. In vitro activity evaluation of seven Brazilian Asteraceae against cancer cells and Leishmania amazonensis. S. Afr. J. Bot. 2019, 121, 267–273. [Google Scholar] [CrossRef]
  5. Sarembaud, A.; Poitevin, B. Médicament à usage homéopathique; Ed. Masson: Paris, France, 1996; p. 256. [Google Scholar]
  6. Labed, F.; Masullo, M.; Mirra, V.; Nazzaro, F.; Benayache, F.; Benayache, S.; Piacente, S. Amino acid-sesquiterpene lactone conjugates from the aerial parts of Centaurea pungens and evaluation of their antimicrobial activity. Fitoterapia 2019, 133, 51–55. [Google Scholar] [CrossRef] [PubMed]
  7. Hellwig, F.H. Centaureinae (Asteraceae) in the Mediterranean history of ecogeographical radiation. Plant. Syst. Evol. 2004, 246, 137–162. [Google Scholar] [CrossRef]
  8. Bellakhdar, J. La pharmacopée marocaine traditionnelle. In Médecine Arabe Ancienne et Savoirs Populaires; Etienne, S., Ed.; Ibis Press: Paris, France, 1997; p. 764. [Google Scholar]
  9. Adekenov, S.M. Sesquiterpene lactones with unusual structure. Their biogenesis and biological activity. Fitoterapia 2017, 121, 16–30. [Google Scholar] [CrossRef] [PubMed]
  10. Formisano, C.; Formisano, C.; Sirignano, C.; Rigano, D.; Chianese, G.; Zengin, G.; Seo, E.J.; Efferth, T.; Taglialatela-Scafati, O. Antiproliferative activity against leukemia cells of sesquiterpene lactones from the Turkish endemic plant Centaurea drabifolia subsp detonsa. Fitoterapia 2017, 120, 98–102. [Google Scholar] [CrossRef]
  11. Shakeri, A.; Amini, E.; Asili, J.; Masullo, M.; Piacente, S.; Iranshahi, M. Screening of several biological activities induced by different sesquiterpene lactones isolated from Centaurea behen L. and Rhaponticum repens (L.) Hidalgo. Nat. Prod. Res. 2017, 32, 1436–1440. [Google Scholar] [CrossRef]
  12. Ayaz, F.A.; Ozcan, M.; Kurt, A.; Karayigit, B.; Ozogul, Y.; Glew, R.; Ozogul, F. Fatty acid composition and antioxidant capacity of cypselas in Centaurea s.l. taxa (Asteraceae, Cardueae) from NE Anatolia. S. Afr. J. Bot. 2017, 112, 474–482. [Google Scholar] [CrossRef]
  13. Quezel, P.; Santa, S. Nouvelle flore de l’Algérie et des régions désertiques méridionales; Tome, I., Ed.; C.N.R.S. Paris: Paris, France, 1963; p. 1023. [Google Scholar]
  14. Baharfar, R.; Khalilzadeh, M.A.; Gheibi, S.; Jazayeri, O.; Azimi, R.; Tajbakhsh, M. Antioxidant and antibacterial activities of the methanolic extract of Centaurea zuvandica Sosn. JICS 2009, 3, 172–177. [Google Scholar]
  15. Koca, U.; Süntar, I.P.; Keles, H.; Yesilada, E.; Akkol, E.K. In vivo antiinflammatory and wound healing activities of Centaurea iberica Trev. ex Spreng. J. Ethnopharmacol. 2009, 126, 551–556. [Google Scholar] [CrossRef] [PubMed]
  16. Leonardi, M.C.; Ivaldi, G.B.; Santoro, L.; Lazzari, R.; Ferrari, A.; Morra, A.; Caldarella, P.; Burgoa, L.; Bassi, F.D.; Sangalli, C. Long-term side effects and cosmetic outcome in a pool of breast cancer patients treated with intraoperative radiotherapy with electrons as sole treatmen. Tumori. J. 2011, 98, 324–330. [Google Scholar] [CrossRef] [PubMed]
  17. Kilic, O. Essential oil compounds of three Centaurea, L. taxa from Turkey and their chemotaxonomy. J. Med. Plants. Res. 2013, 7, 1344–1350. [Google Scholar]
  18. Belkacem, S.; Belbache, H.; Boubekril, C.; Mosset, P.; RachedMosbah, O.; Marchioni, E.; Benayache1, S.; Benayache, F. Biological and Chemical Sciences Chemical Constituents from C. parviflora Desf. Res. J. Pharm. 2014, 5, 1275–1279. [Google Scholar]
  19. Grafakou, M.E.; Djeddi, S.; Tarek, H.; Skaltsa, H. Secondary metabolites from the aerial parts of Centaurea papposa (Coss.) Greuter. Biochem. Syst. Ecol. 2018, 76, 15–22. [Google Scholar] [CrossRef]
  20. Arfaoui, L. Dietary plant polyphenols: Effects of food processing on their content and bioavailability. Molecules 2021, 26, 2959. [Google Scholar] [CrossRef]
  21. Altemimi, A.; Lakhssassi, N.; Baharlouei, A.; Watson, D.G.; Lightfoot, D.A. Phytochemicals: Extraction, isolation, and identification of bioactive compounds from plant extracts. Plants 2017, 6, 42. [Google Scholar] [CrossRef]
  22. Do, Q.D.; Angkawijaya, A.E.; Tran-Nguyen, P.L.; Huynh, L.H.; Soetaredjo, F.E.; Ismadji, S.; Ju, Y.H. Effect of extraction solvent on total phenol content, total flavonoid content, and antioxidant activity of Limnophila aromatica. J. Food Drug Anal. 2014, 22, 296–302. [Google Scholar] [CrossRef] [Green Version]
  23. Bui, N.T.; Pham, T.L.T.; Nguyen, K.T.; Le, P.H.; Kim, K.H. Effect of extraction solvent on total phenol, flavonoid content, and antioxidant activity of Avicennia officinalis. Res. Appl. Chem. 2021, 12, 2678–2690. [Google Scholar]
  24. Bougandoura, N. Pouvoir antioxydant et antimicrobien des extraits d’espèces végétales Satureja Calamintha Ssp Nepeta (nabta) et Ajuga iva L.(chendgoura) de l’ouest d’Algérie; Mémoire du Master en biologie, Université Abou Bekr Belkaid-Tlemcen: Tlemcen, Algeria, 2011; p. 52. [Google Scholar]
  25. Markham, K.R. Techniques of Flavonoid Identification; Academic Press: New York, NY, USA, 1982. [Google Scholar]
  26. Aslam, M.S.; Ahmad, M.S.; Mamat, A.S. Phytochemical evaluation of polyherbal formulation of Clinacanthus nutans and Elephantopus scaber to identify flavonoids. Pharmacogn. Rev. 2016, 8, 534–541. [Google Scholar] [CrossRef] [Green Version]
  27. Wang, H.; Nair, M.G.; Strasburg, G.M.; Booren, A.M.; Gray, J.I. Antioxidant polyphenols from tart cherries (Prunus cerasus). J. Agric. Food Chem. 1999, 47, 840–844. [Google Scholar] [CrossRef]
  28. Mbaïhougadobé, S.; Ngakegni-Limbili, A.C.; Gouollaly, T.; Koane, J.N.; Ngaïssona, P.; Loumpangou, C.N.; Mahmout, Y.; Ouamba, J.M. Evaluation de l’activité anti-oxydante de trois espèces de plantes utilisées dans le traitement de la goutte au Tchad. Méd. Tradit. Pharmacop. 2017, 18, 28–35. [Google Scholar]
  29. Fernando, L. Purification of fresh cassava root polyphenols by solidphase extraction with Amberlite XAD-8 resin. J. Chromatogr. A 2009, 657, 445–449. [Google Scholar]
  30. Dai, J.; Mumper, R.J. Plant phenolics: Extraction, analysis and their antioxidant and anticancer properties. Molecules 2010, 15, 7313–7352. [Google Scholar] [CrossRef] [PubMed]
  31. Gao, M.; Liu, C.Z. Comparison of techniques for the extraction of flavonoids from cultured cells of Saussurea medusa Maxim. World. J. Microbiol. Biotechnol. 2005, 21, 1461–1463. [Google Scholar] [CrossRef]
  32. Uttara, B.; Singh, A.V.; Zamboni, P.; Mahajan, R. Oxidative stress and neurodegenerative diseases: A review of upstream and downstream antioxidant therapeutic options. Curr. Neuropharmacol. 2009, 7, 65–74. [Google Scholar] [CrossRef] [PubMed] [Green Version]
  33. Lima, G.P.P.; Vianello, F.; Corrêa, C.R.; Campos, R.A.D.S.; Borguini, M.G. Polyphenols in fruits and vegetables and its effect on human health. Food. Sci. Nutr. 2014, 1065–1082. [Google Scholar] [CrossRef] [Green Version]
  34. Grgić, J.; Šelo, G.; Planinić, M.; Tišma, M.; Bucić-Kojić, A. Role of the encapsulation in bioavailability of phenolic compounds. J. Antioxid. 2020, 9, 923. [Google Scholar] [CrossRef]
  35. Tomás-Barberán, F.A.; Espín, J.C. Phenolic compounds and related enzymes as determinants of quality in fruits and vegetables. J. Sci. Food. Agric. 2001, 81, 853–876. [Google Scholar] [CrossRef]
  36. Pietta, P.G. Flavonoids as antioxidants. J. Nat. Prod. 2000, 63, 1035–1042. [Google Scholar] [CrossRef]
  37. Escarpa, A.; González, M.C. High-performance liquid chromatography with diode-array detection for the determination of phenolic compounds in peel and pulp from different apple varieties. J. Chromatogr. A 1998, 823, 331–337. [Google Scholar] [CrossRef]
  38. Zhang, L.Y.; Cosma, G.; Gardner, H.; Vallyathan, V.; Castranova, V. Effect of chlorogenic acid on hydroxyl radical. Mol. Cell. Biochem. 2003, 247, 205–210. [Google Scholar] [CrossRef]
  39. Mariadoss, A.V.A.; Park, S.; Saravanakumar, K.; Sathiyaseelan, A.; Wang, M.H. Ethyl acetate fraction of Helianthus tuberosus L. induces anti-diabetic, and wound-healing activities in insulin-resistant human liver cancer and mouse fibroblast cells. J. Antioxid. 2021, 10, 99. [Google Scholar] [CrossRef] [PubMed]
  40. Upadhyay, R.; Mohan Rao, L.J. An outlook on chlorogenic acids-occurrence, chemistry, technology, and biological activities. Crit. Rev. Food. Sci. Nutr. 2013, 53, 968–984. [Google Scholar] [CrossRef] [PubMed]
  41. Sato, Y.; Itagaki, S.; Kurokawa, T.; Ogura, J.; Kobayashi, M.; Hirano, T.; .Sugawara, M.; Iseki, K. In vitro and in vivo antioxidant properties of chlorogenic acid and caffeic acid. Int. J. Pharm. 2011, 403, 136–138. [Google Scholar] [CrossRef] [PubMed]
  42. Xi, Y.; Jiao, W.; Cao, J.; Jiang, W. Effects of chlorogenic acid on capacity of free radicals scavenging and proteomic changes in postharvest fruit of nectarine. PLoS ONE 2017, 2, e0182494. [Google Scholar] [CrossRef] [Green Version]
  43. Wang, Z.; Ding, Z.; Li, Z.; Ding, Y.; Jiang, F.; Liu, J. Antioxidant and antibacterial study of 10 flavonoids revealed rutin as a potential antibiofilm agent in Klebsiella pneumoniae strains isolated from hospitalized patients. Microb. Pathog. 2021, 159, 105121. [Google Scholar] [CrossRef]
  44. Babiaka, S.B.; Nia, R.; Abuga, K.O.; Mbah, J.A.; Vincent de Paul, N.N.; Paper, D.H.; Ntie-Kang, F. Antioxidant potential of flavonoid glycosides from Manniophyton fulvum Müll.(Euphorbiaceae): Identification and molecular modeling. Sci. Afr. 2020, 8, e00423. [Google Scholar] [CrossRef]
  45. Razavi, S.M.; Zahri, S.; Zarrini, G.; Nazemiyeh, H.; Mohammadi, S. Biological activity of quercetin-3-O-glucoside, a known plant flavonoid. Russ. J. Bioorganic Chem. 2009, 35, 376–378. [Google Scholar] [CrossRef]
  46. Naeim, H.; El-Hawiet, A.; Abdel Rahman, R.A.; Hussein, A.; El Demellawy, M.A.; Embaby, A.M. Antibacterial activity of Centaurea pumilio L. root and aerial part extracts against some multidrug resistant bacteria. BMC Complement. Med. Ther. 2020, 20, 79. [Google Scholar] [CrossRef] [Green Version]
  47. Karamenderes, C.; Khan, S.; Tekwani, B.L.; Jacob, M.R.; Khan, I.A. Antiprotozoal and Antimicrobial Activities of Centaurea. Species Growing in Turkey. Pharm. Biol. 2006, 44, 534–539. [Google Scholar] [CrossRef] [Green Version]
  48. Jafari-Sales, A.; Mobaiyen, H.; Jafari, B.; Sayyahi, J. Assessment of Antibacterial Effect of Alcoholic Extract of Centaurea depressa M.B., Reseda lutea L. and Fumaria asepala on Selected Standard Strains in vitro. Sci. J. Nurs. Midwifery 2019, 5, 63–73. [Google Scholar]
  49. Zink, D.L. The impact of consumer demands and trends on food processing. Emerging. Infect Dis. 1997, 3, 467–469. [Google Scholar] [CrossRef] [PubMed]
  50. Sharifi-Rad, M.; Epifano, F.; Fiorito, S.; Álvarez-Suarez, J.M. Phytochemical analysis and biological investigation of Nepeta juncea Benth. different extracts. Plants 2020, 9, 646. [Google Scholar] [CrossRef] [PubMed]
  51. Valanciene, E.; Malys, N. Advances in Production of Hydroxycinnamoyl-Quinic Acids: From Natural Sources to Biotechnology. Antioxidants 2022, 11, 2427. [Google Scholar] [CrossRef] [PubMed]
  52. Zaak, H.; Bendif, H.; Rebbas, K.; Aouati, L.; Abdennour, A.; Hamza, A.; Wandjou, J.G.N.; Maggi, F. Essential oil composition and biological activities of Ononis alba Poir (Fabaceae). Nat. Prod. Res. 2022, 36, 2418–2423. [Google Scholar] [CrossRef]
  53. Mammeri, A.; Bendif, H.; Bensouici, C.; Benslama, A.; Rebas, K.; Bouasla, A.; Rebaia, I.; Souilah, N.; Miara, M.D. Total phenolic contents, in vitro antioxidant activity, enzymes inhibition and antiinflammatory effect of the selective extracts from the Algerian Lavandula multifida. ACTA Pharm. Sci. 2022, 60, 1. [Google Scholar] [CrossRef]
  54. Müller, L.; Gnoyke, S.; Popken, A.M.; Böhm, V. Antioxidant capacity and related parameters of different fruit formulations. LWT—Food Sci. Technol. 2010, 43, 992–999. [Google Scholar] [CrossRef]
  55. Topçu, G.; Ay, A.; Bilici, A.; Sarıkürkcü, C.; Öztürk, M.; Ulubelen, A. A new flavone from antioxidant extracts of Pistacia terebinthus. Food.Chem. 2007, 103, 816–822. [Google Scholar] [CrossRef]
  56. Kumaran, A.; Karunakaran, R.J. In vitro antioxidant activities of methanol extracts of five Phyllanthus speciesfromIndia. LWT 2007, 40, 344–352. [Google Scholar] [CrossRef]
  57. Blois, M.S. Antioxidant determinations by the use of a stable Free Radical. Nature 1958, 4617, 1119–1200. [Google Scholar] [CrossRef]
  58. Shi, H.; Noguchi, N.; Niki, E. Galvinoxyl method for standardizing electron and proton donation activity. Meth. Enzymol. 2001, 335, 157–166. [Google Scholar]
  59. Re, R.; Pellegrini, N.; Proteggente, A.; Pannala, A.; Yang, M.; Rice-Evans, C. Antioxidant activity applying an improved ABTS radical cation de colorization assay. Free. Radical. Bio. Med. 1999, 26, 1231–1237. [Google Scholar] [CrossRef] [PubMed]
  60. Elizabeth, K.; Rao, M.N.A. Effect of curcumin on hydroxyl radical generation through fenton reaction. Int. J. Pharm. 1989, 57, 173–176. [Google Scholar]
  61. Apak, R.; Guclu, K.; Ozyurek, M.; Karademir, S.E. Novel total antioxidant capacity index for dietary polyphenols and vitamins C and E, using their cupric ion reducing capability in the presence of neocuproine: CUPRAC method. J. Agric. Food. Chem. 2004, 52, 7970–7981. [Google Scholar] [CrossRef] [PubMed]
  62. Bouratoua, A.; Khalfallah, A.; Bensouici, C.; Kabouche, Z.; Alabdul Magid, A.; Harakat, D.; Voutquenne-Nazabadioko, L.; Kabouche, A. Chemical composition and antioxidant activity of aerial parts of Ferula longipes Coss. ex Bonnier and Maury. Nat. Prod. Res. 2017, 32, 1873–1880. [Google Scholar] [CrossRef] [PubMed]
  63. Szydlowskaczerniak, A.; Dianoczki, C.; Recseg, K.; Karlovits, G.; Szlyk, E. Determination of antioxidant capacities of vegetable oils by ferric-ion spectrophotometric methods. Talanta 2008, 76, 899–905. [Google Scholar]
  64. Aissani, F.; Grara, N.; Bensouici, C.; Bousbia, A.; Ayed, H.; Idris, M.H.M.; Teh, L.K. Algerian Sonchus oleraceus L.: A comparison of different extraction solvent on phytochemical composition, antioxidant properties and anti-cholinesterase activity. Adv. Tradit. Med. 2021, 22, 383–394. [Google Scholar] [CrossRef]
Figure 1. Photos of TLC results of methanolic extract of C. parviflora. (A) Toluene/Chloroform/Methanol; (B) Chloroform/Methanol; (C) Ethyl Acetate/Methanol/Water; (D) Methanol/Water; (E) Butanol/Acetic acid/Water.
Molecules 28 02263 g001
Figure 2. Chromatogram of the positive ionization of the butanol extract of C. parviflora.
Molecules 28 02263 g002
Figure 3. Chromatogram of the negative ionization of the butanol extract of C. parviflora.
Molecules 28 02263 g003
Figure 4. Chromatogram of quinic acid (compound 1).
Molecules 28 02263 g004
Figure 5. Mass spectrum of quinic acid (compound 1).
Molecules 28 02263 g005
Figure 6. Chromatogram of chlorogenic acid (compounds 2, 3, 4 and 5).
Molecules 28 02263 g006
Figure 7. Mass spectrum of chlorogenic acid (compounds 2, 3, 4 and 5).
Molecules 28 02263 g007
Figure 8. Chromatogram of rutin (compound 6).
Molecules 28 02263 g008
Figure 9. Mass spectrum of rutin (compound 6).
Molecules 28 02263 g009
Figure 10. Chromatogram of quercetin 3-O-glucoside (compound 7).
Molecules 28 02263 g010
Figure 11. Mass spectrum of quercetin 3-O-glucoside (compound 7).
Molecules 28 02263 g011
Figure 12. Chromatogram of chlorogenic acid derivative (compound 8).
Molecules 28 02263 g012
Figure 13. Mass spectrum of chlorogenic acid derivative (compound 8).
Molecules 28 02263 g013
Figure 14. Photographs of the antibacterial activity results according to the agar disk-diffusion method of C. parviflora. 1. Standard (solvent), 2. 20 mg/mL, 3. 30 mg/mL.
Molecules 28 02263 g014aMolecules 28 02263 g014b
Table 1. Phytochemical analysis of methanolic extract of C. parviflora with thin-layer chromatography.
NChemical NameSolvent SystemRf ValueSpot Color References
1FlavonoidsToluene/0.12Pale pink[26]
Chloroform/0.18Light blue
Methanol (4/4/1) (v/v/v)0.56Pink
0.6Pink
0.65Blue
0.78Purple
0.95Light blue
2FlavonoidsChloroform/Methanol 0.29Mauve[27]
(10/1) (v/v)0.73Pale pink
3Polyphenols/FlavonoidsEthyl Acetate/Methanol0.12yellowish blue[28]
/Water (8/1/1) (v/v/v)0.24Grey
0.34Grey
0.39Grey
0.6Yellow
0.44Fluorescent White Blue Gray
0.74
4PolyphenolsMethanol/Water (7/3) (v/v)0.88dark gray[29]
5FlavonoidsButanol/Acetic acid/Water (40/10/50) (v/v/v)0.31Grey-
0.4dark gray
0.52Fluorescent white blue
Table 2. Compounds of the C. parviflora butanol extract identified with LC-MS.
Pic
N
CompoundsRetention Time (min)Molecular FormulaExperimental m/zCalculated m/zIonization Mode
1Quinic Acid0.68C7H12O6191.00191.05Neg
2Chlorogenic acid derivative0.72C16H18O9353.00353.08Neg
3Chlorogenic acid derivative1.03C16H18O9353.00353.08Neg
4Chlorogenic acid derivative1.20C16H18O9353.00353.08Neg
5Chlorogenic acid derivative1.60C16H18O9353.00353.08Neg
6Rutin3.60C27H30O16609.00609.14Neg
7Quercetin 3-O-glucoside4.26C21H20O12463.00463.08Neg
8Chlorogenic acid derivative5.73C30H10O14593.00593.00Neg
Table 3. In vitro antioxidant activity using different assays of C. parviflora extracts (n = 3, log-transformed data, Tukey’s HSD test: p-value < 0.01 (a,b and b,c); p-value < 0.0001 (a,c)).
DPPH (IC50 µg/mL)Galvinoxyl (IC50 μg/mL)ABTS (IC50 μg/mL)CUPRAC (A0.5, μg/mL)RP Phenanthroline (A0.5, μg/mL)RP (A0.5, μg/mL)Superoxide (IC50 μg/mL)
CE160.92 ± 5.11 (a)88.87 ± 1.86 (a)162.39 ± 0.15 (a)128.44 ± 4.14 (a)46.56 ± 1.54 (a)˃20021.91 ± 0.70 (a)
CHE˃200˃200˃200188.33 ± 4.62 (b)75.67 ± 0.29 (a)˃20064.77 ± 2.37 (b)
EAE144.75 ± 1.17 (a)97.72 ± 3.07 (a)124.22 ± 0.61 (a)92.00 ± 4.85 (a)56.56 ± 3.34 (a)193.67 ± 1.44 (a)14.36 ± 0.90 (a)
BUE59.38 ± 0.72 (b)36.25 ± 0.42 (b)49.52 ± 1.54 (b)71.80 ± 1.22 (a)20.29 ± 1.16 (b)119.17 ± 0.29 (b)13.61 ± 0.38 (a)
BHT22.32 ± 1.19 (b)3.32 ± 0.18 (c)1.29 ± 0.30 (c)9.62 ± 0.87 (c)2.24 ± 0.17 (c)ndnd
BHA5.73 ± 0.41 (c)5.38 ± 0.06 (c)1.81 ± 0.10 (c)3.64 ± 0.19 (c)0.93 ± 0.07 (c)ndnd
Tannic acidndndndndnd5.39 ± 0.91 (c)˂3.125
Ascorbic acidndndndndnd6.77 ± 1.15˂3.125
BHT: Butylhydroxyltoluene, BHA: Butylhydroxyanisole, nd: not detected. n.d. not determined.
Table 4. Antimicrobial and antifungal activities of C. parviflora methanolic extract.
Microorganisms Tested Extract Concentration
20 mg/mL 30 mg/mL
Inhibition Zone Diameter (IZD, mm)
Staphylococcus aureus ATCC6538Gram+7.008.64
Staphylococcus aureus ATCC25923Gram+12.0013.22
Bacillus subtilis ATCC6633Gram+NANA
Escherichia coli ATCC8739Gram−NANA
Salmonella sp. ATCC14028Gram−7.008.03
Pseudomonas sp. ATCC27853 Gram−12.1215.23
Candida albicans ATCC10234FungusNANA
Aspergillus niger ATCC16404Fungus7.008.22
NA: no activity.
Table 5. Yield and contents of phenolic, flavonoid and flavonol compounds of C. parviflora extracts. Different letters indicate significant differences (n = 3, log-transformed data, Tukey’s HSD test: p-value < 0.01 (a,b and b,c); p-value < 0.001 (a,c)).
ExtractsExtraction Yield (%)TPC (µg GAE/mgE) *TFC (µg QE/mg E) *TFOL (µg RE/mg E) *
Crude extract (CE)2.36113.51 ± 2.95 (a)24.49 ± 0.49 (a)20.03 ± 0.63 (a)
Chloroform extract (CHE)1.45105.47 ± 1.35 (a)17.78 ± 0.21 (a)22.89 ± 1.33 (a)
Ethyl Acetate Extract (EAE)0.95136.94 ± 2.94 (b)20.83 ± 0.21 (a)27.86 ± 1.45 (a)
Butanol Extract (BUE)0.83175.27 ± 2.79 (c)59.89 ± 0.91 (b)47.30 ± 0.51 (b)
* Values are expressed as means ± SD of three parallel measurements, GAE: Gallic acid equivalent, QE: Quercetin equivalent, RE: Rutin equivalent, TPC: Total phenolic content, TFC: Total flavonoid content, TFOL: Total flavonol.
Disclaimer/Publisher’s Note: The statements, opinions and data contained in all publications are solely those of the individual author(s) and contributor(s) and not of MDPI and/or the editor(s). MDPI and/or the editor(s) disclaim responsibility for any injury to people or property resulting from any ideas, methods, instructions or products referred to in the content.