
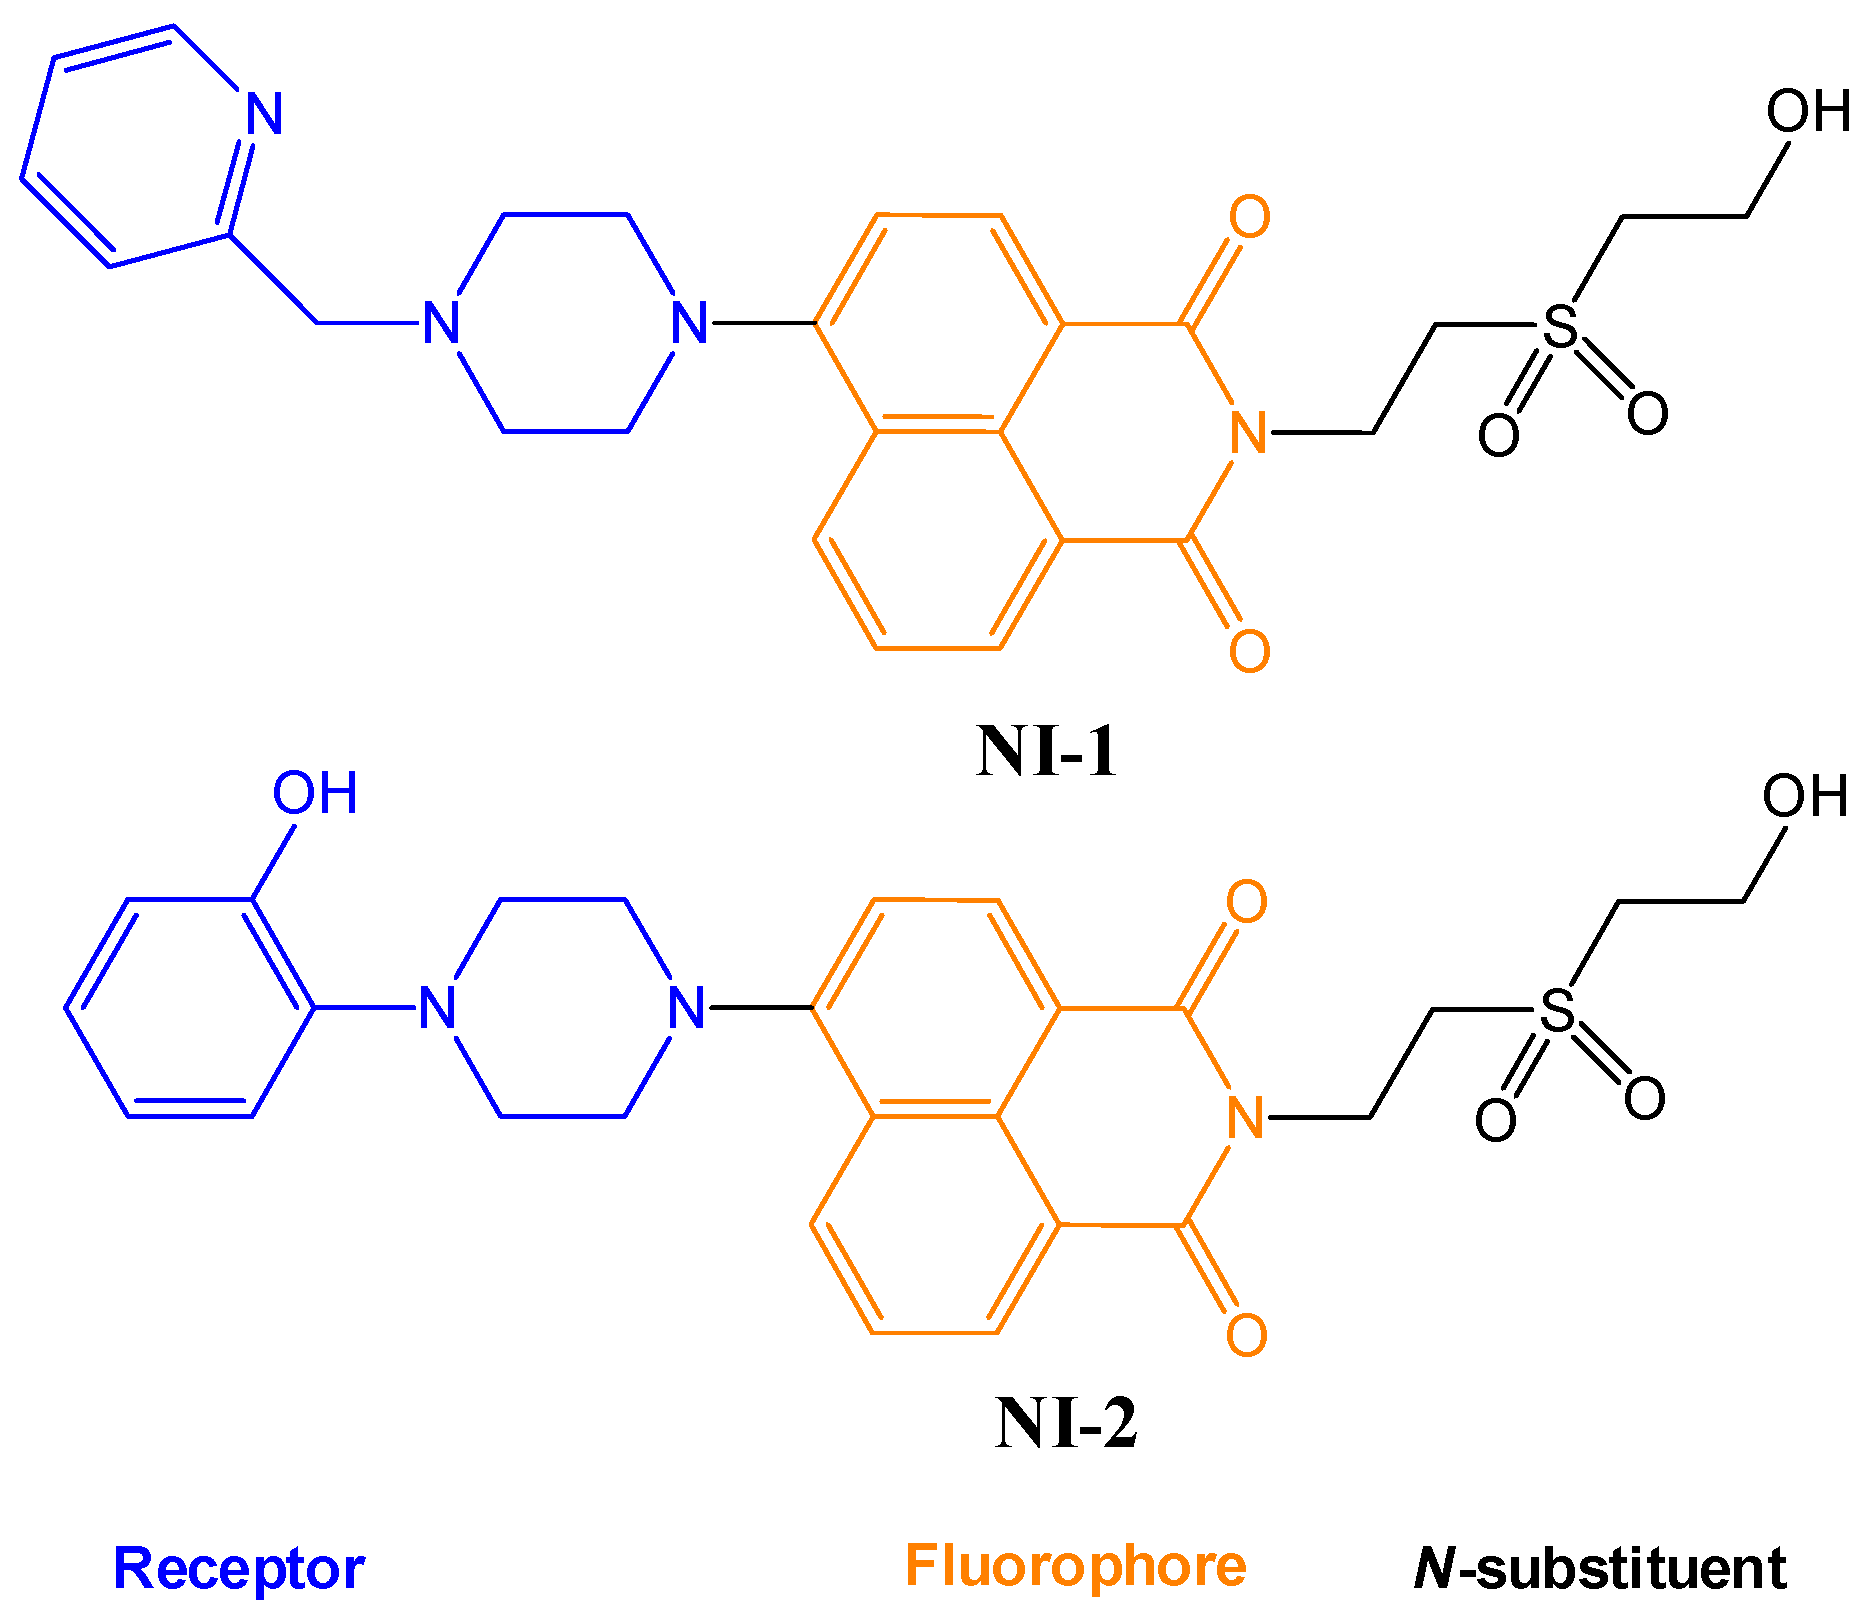
Naphthalimide-Piperazine Derivatives as Multifunctional “On” and “Off” Fluorescent Switches for pH, Hg2+ and Cu2+ Ions


Abstract
1. Introduction
2. Results and Discussion
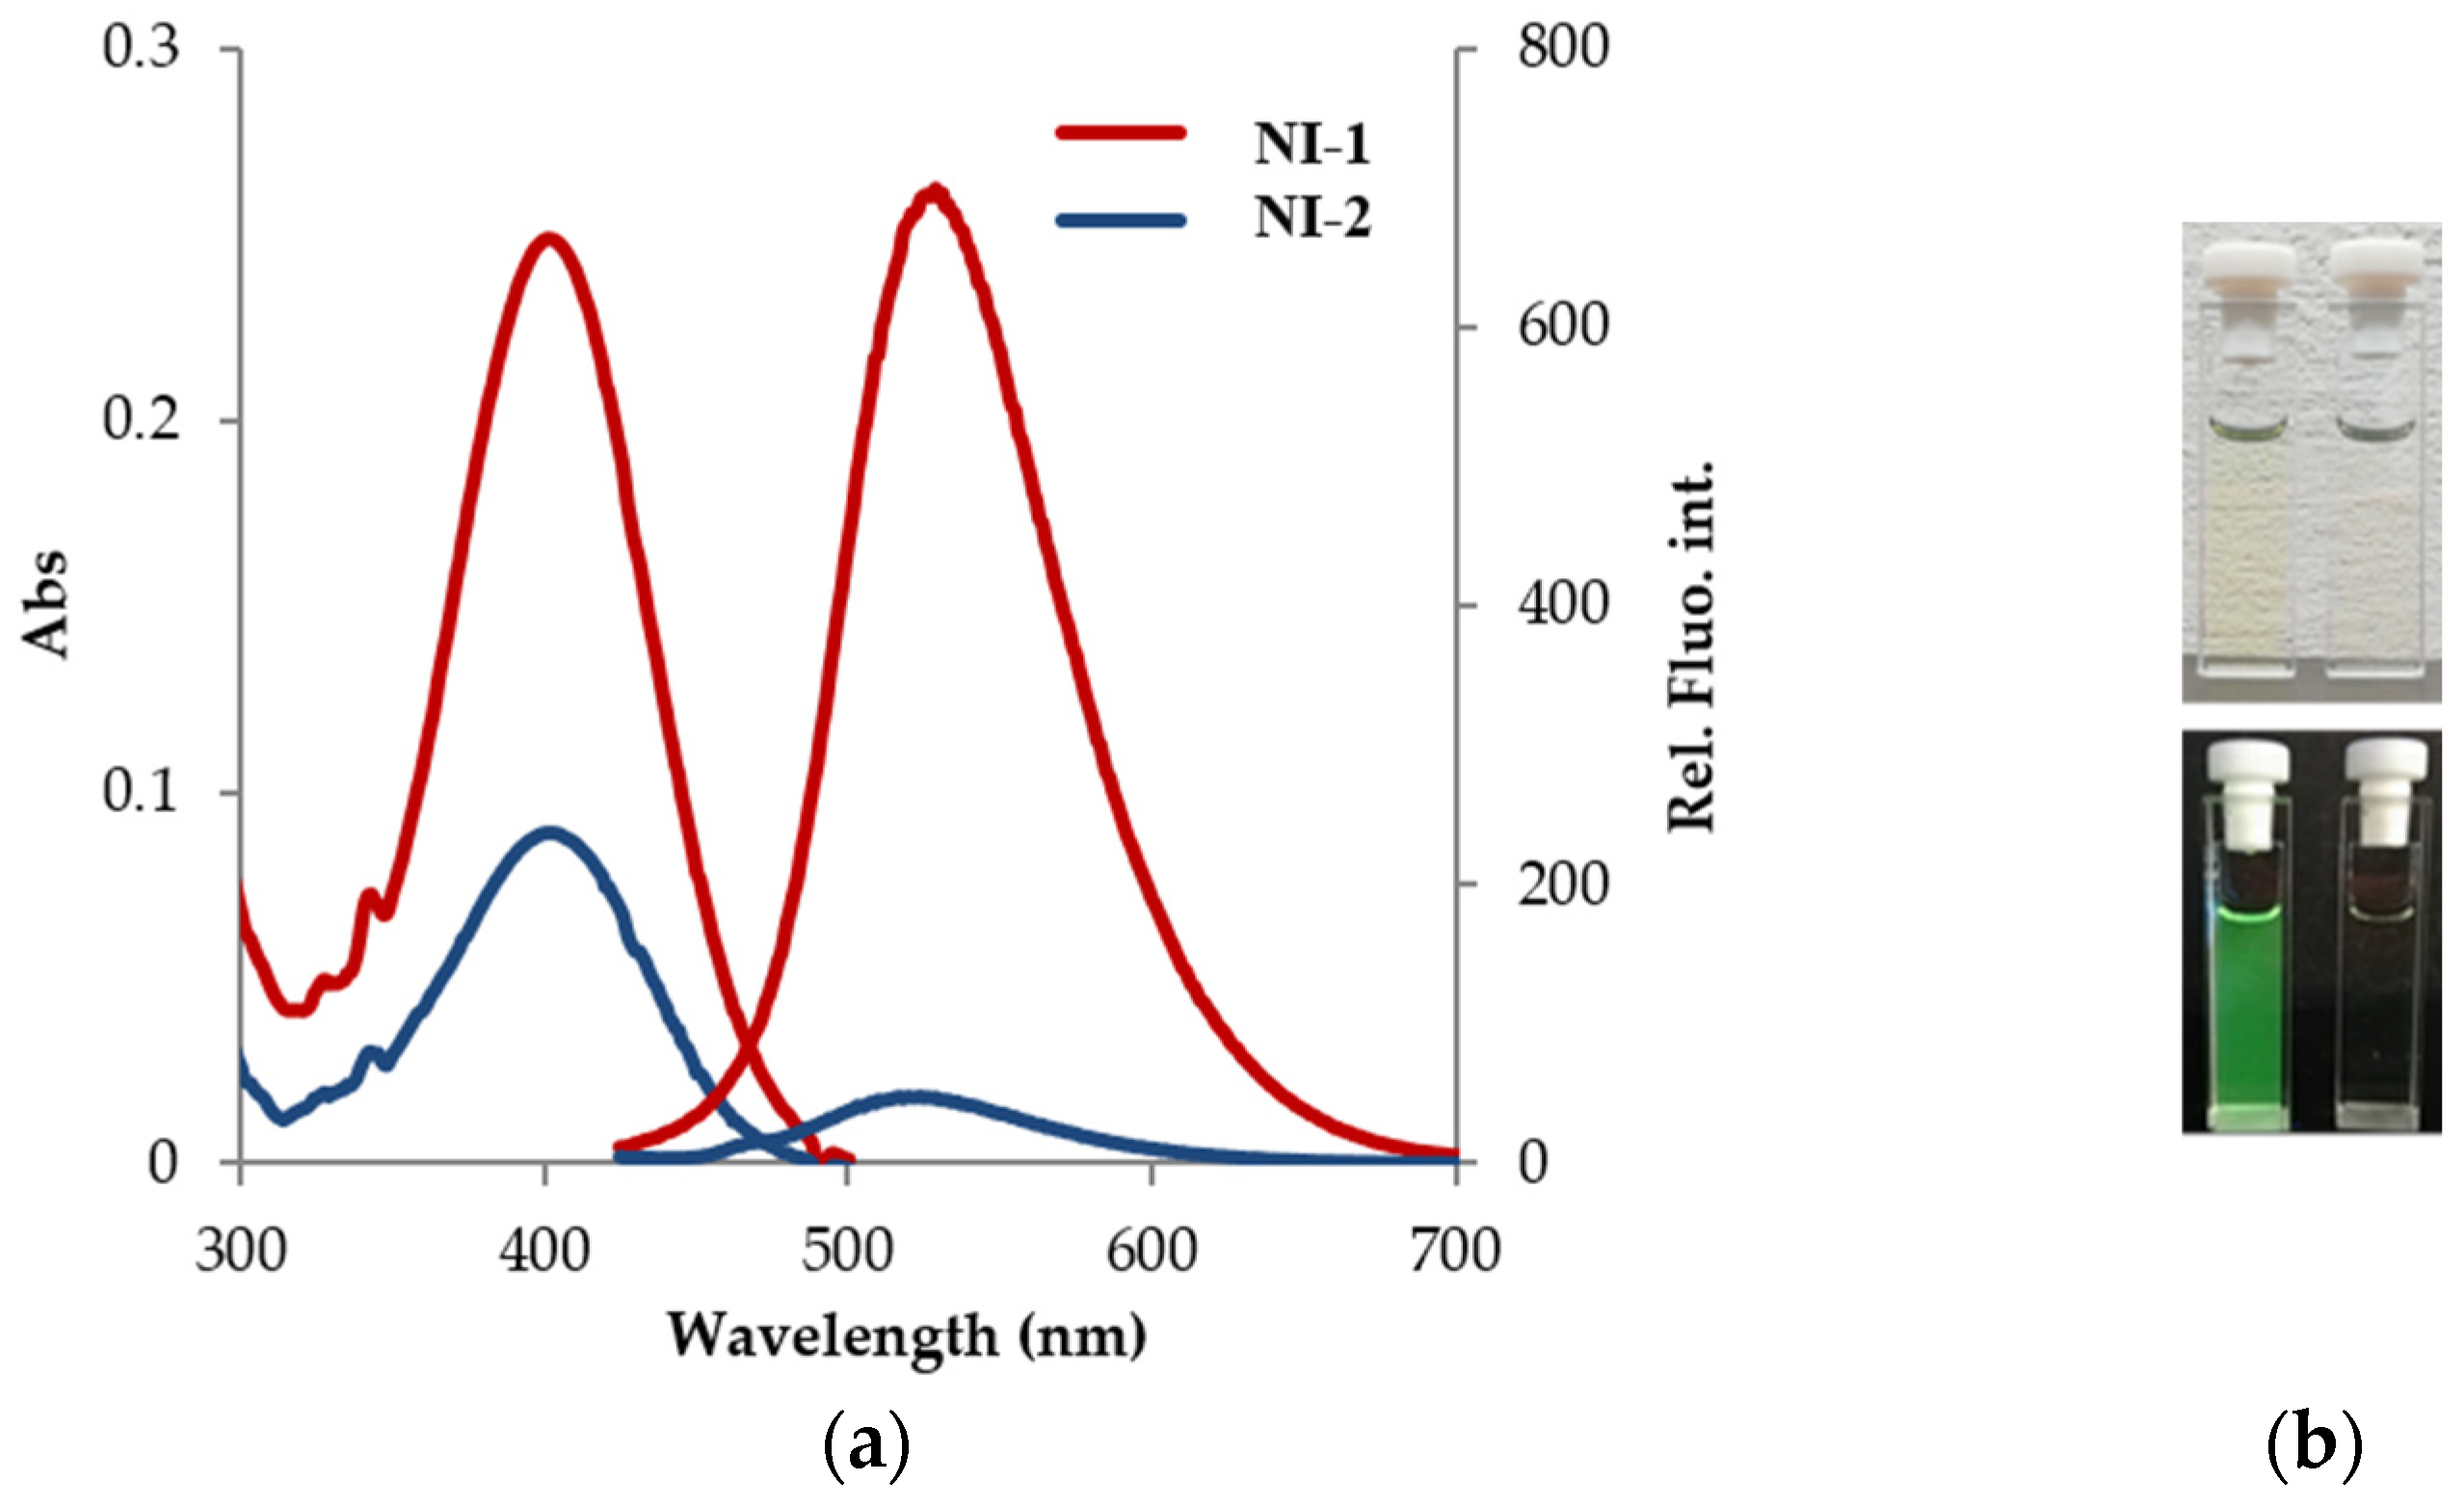
2.1. Spectral Characteristics of NI-1 and NI-2 in Methanol
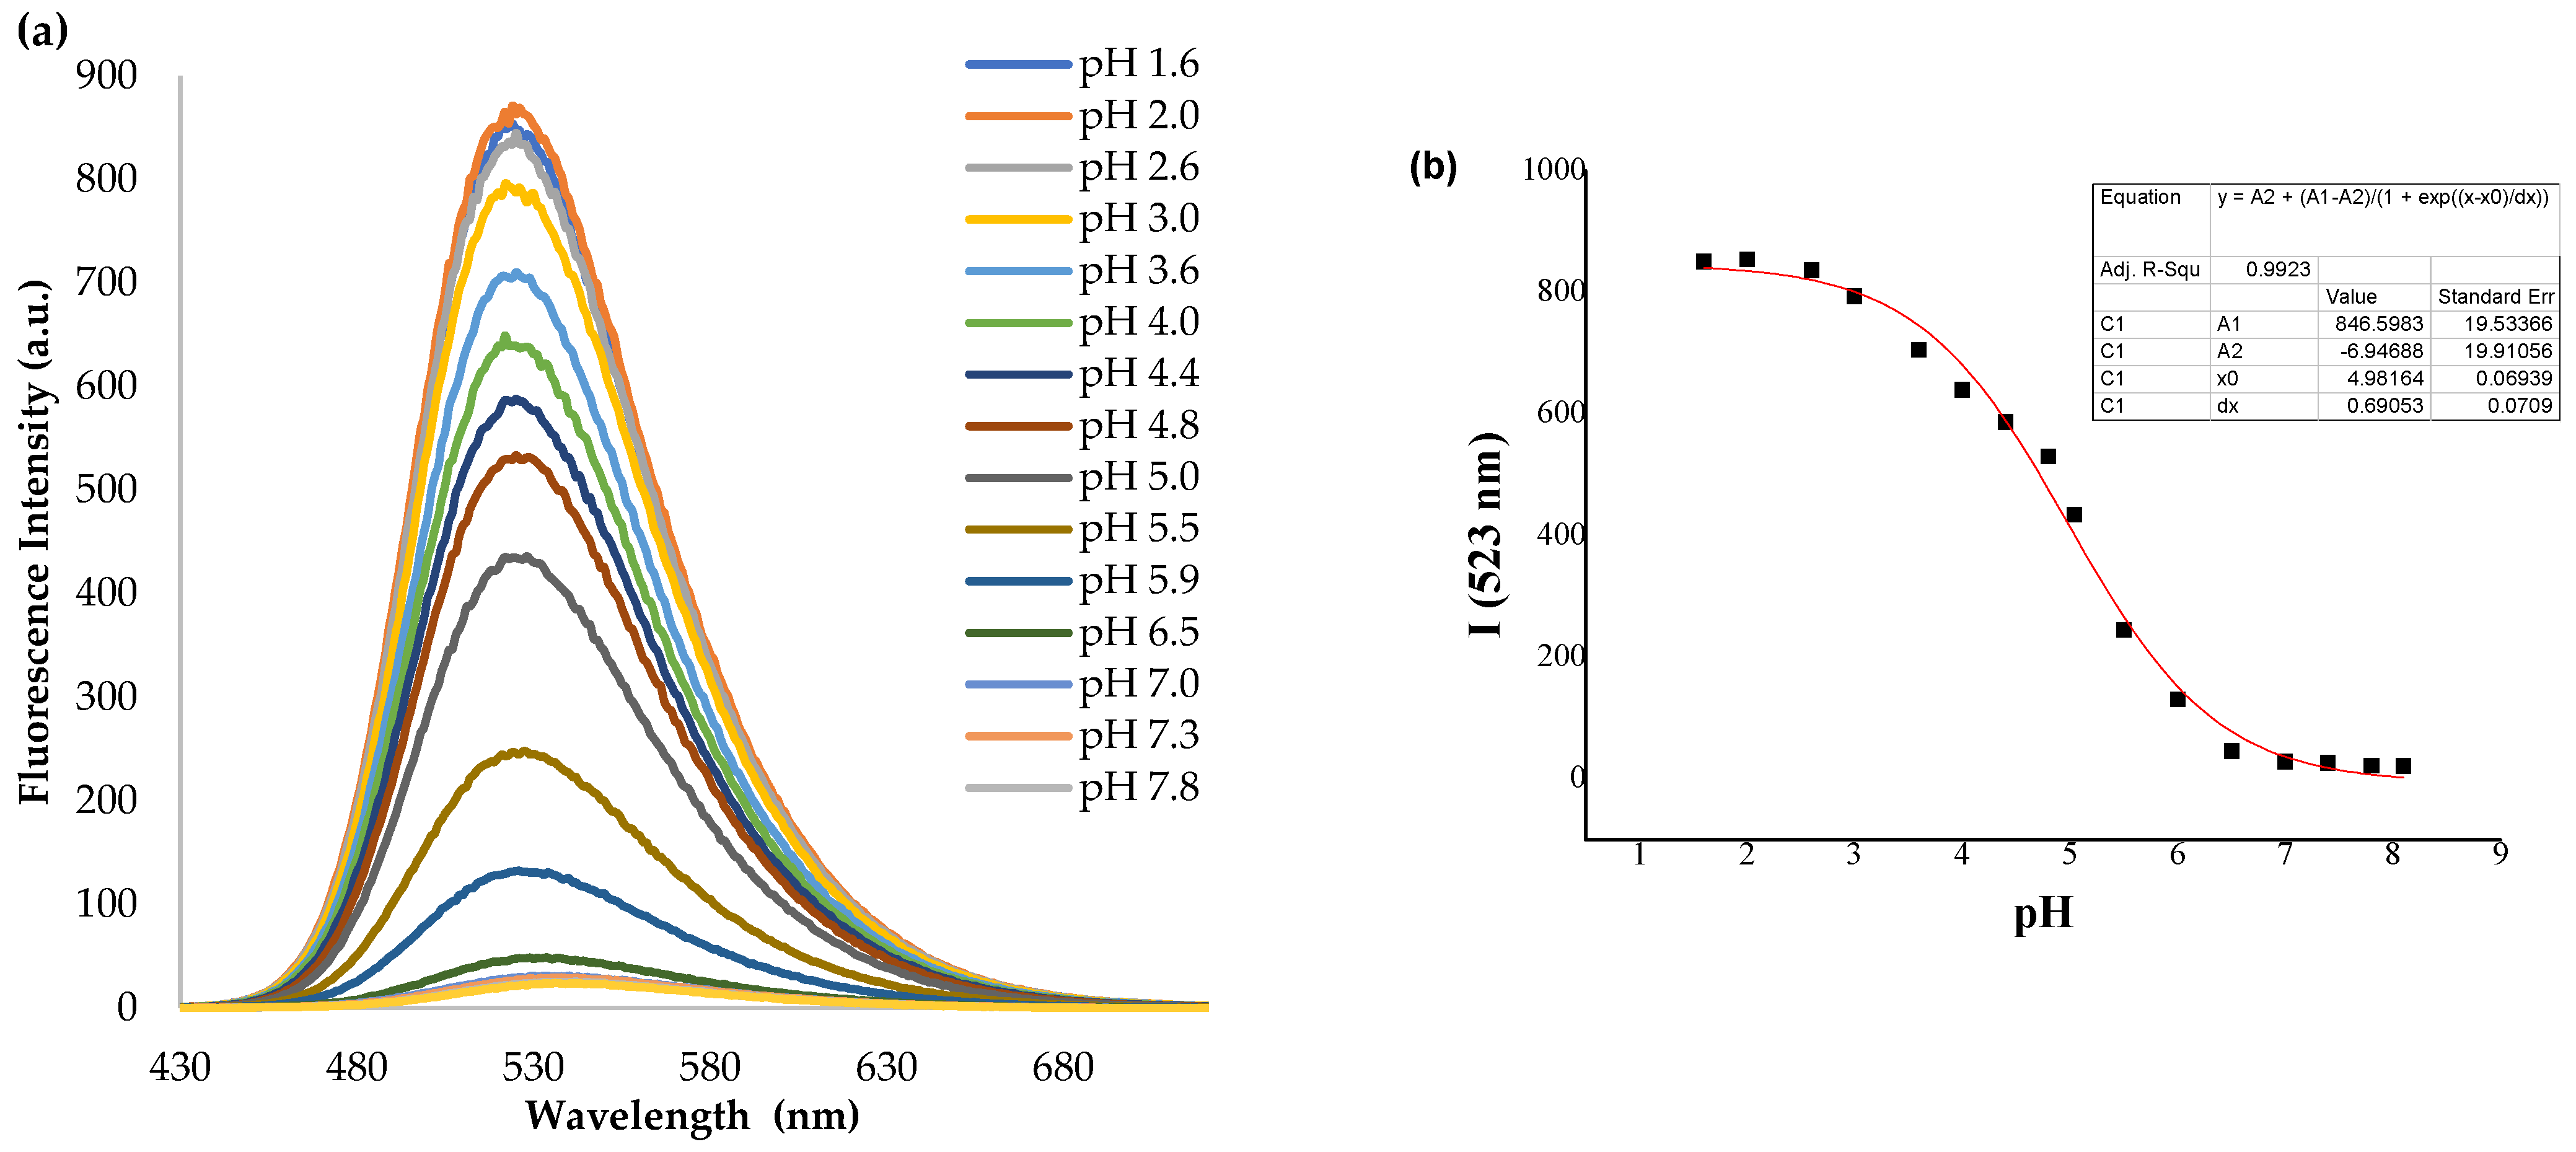
2.2. Effect of pH on Spectral Properties
2.2.1. UV–Visible Absorption Spectra
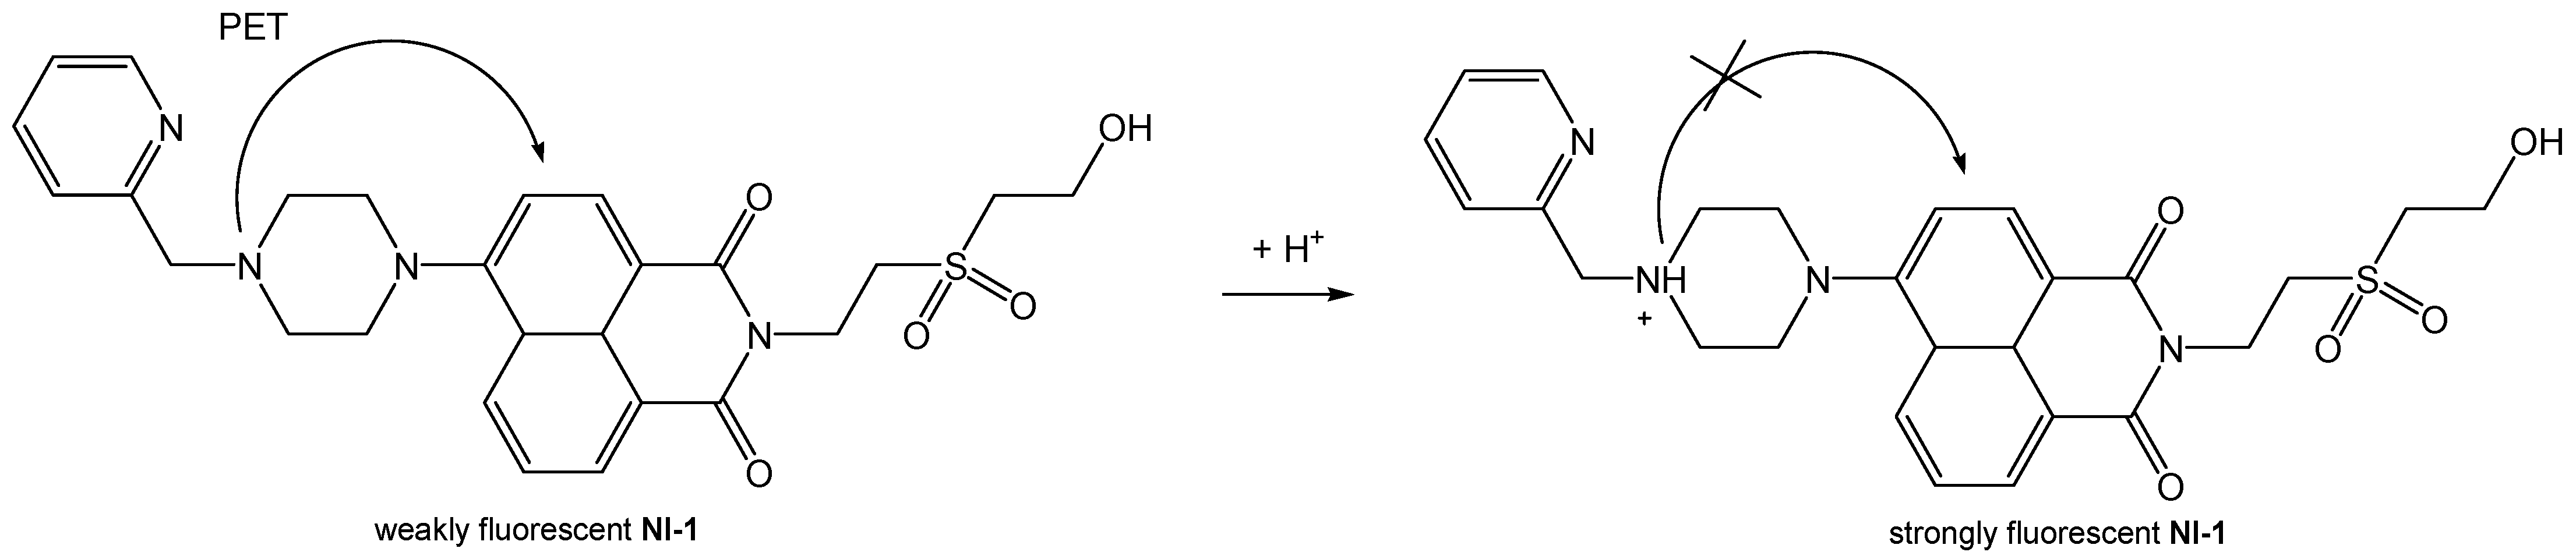
2.2.2. Fluorescence Emission Spectra
2.3. Metal Ion Sensing
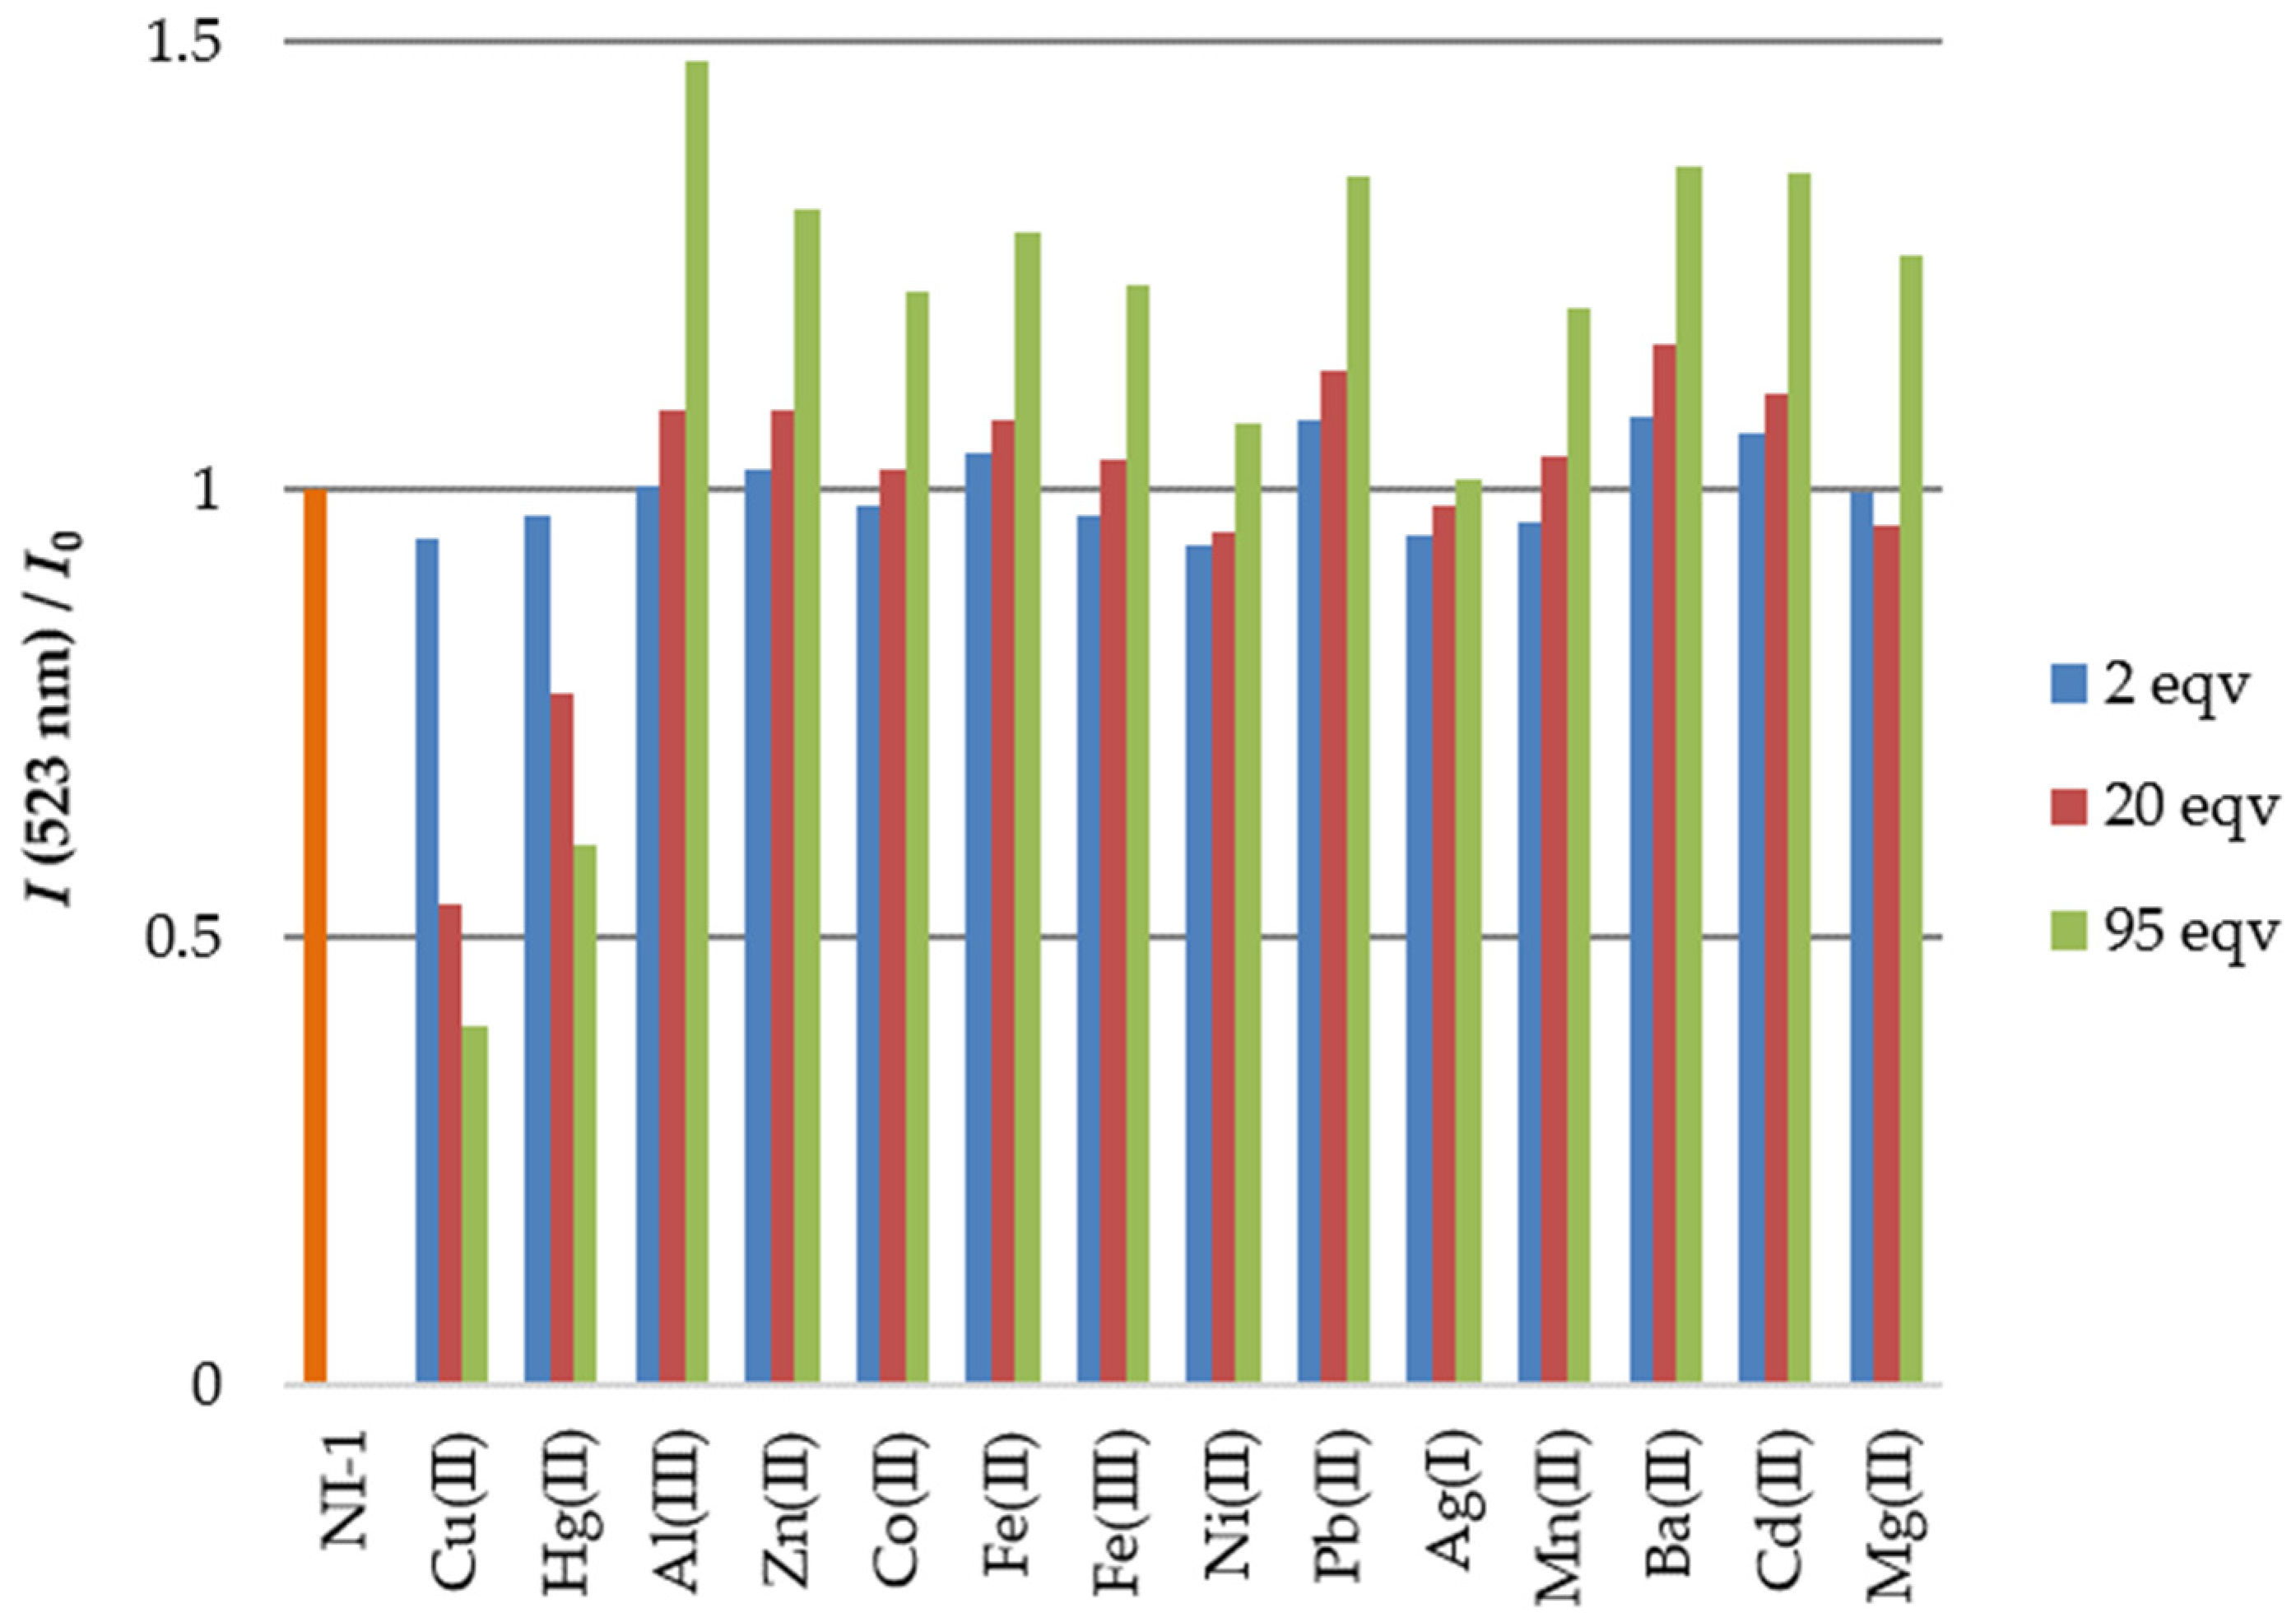
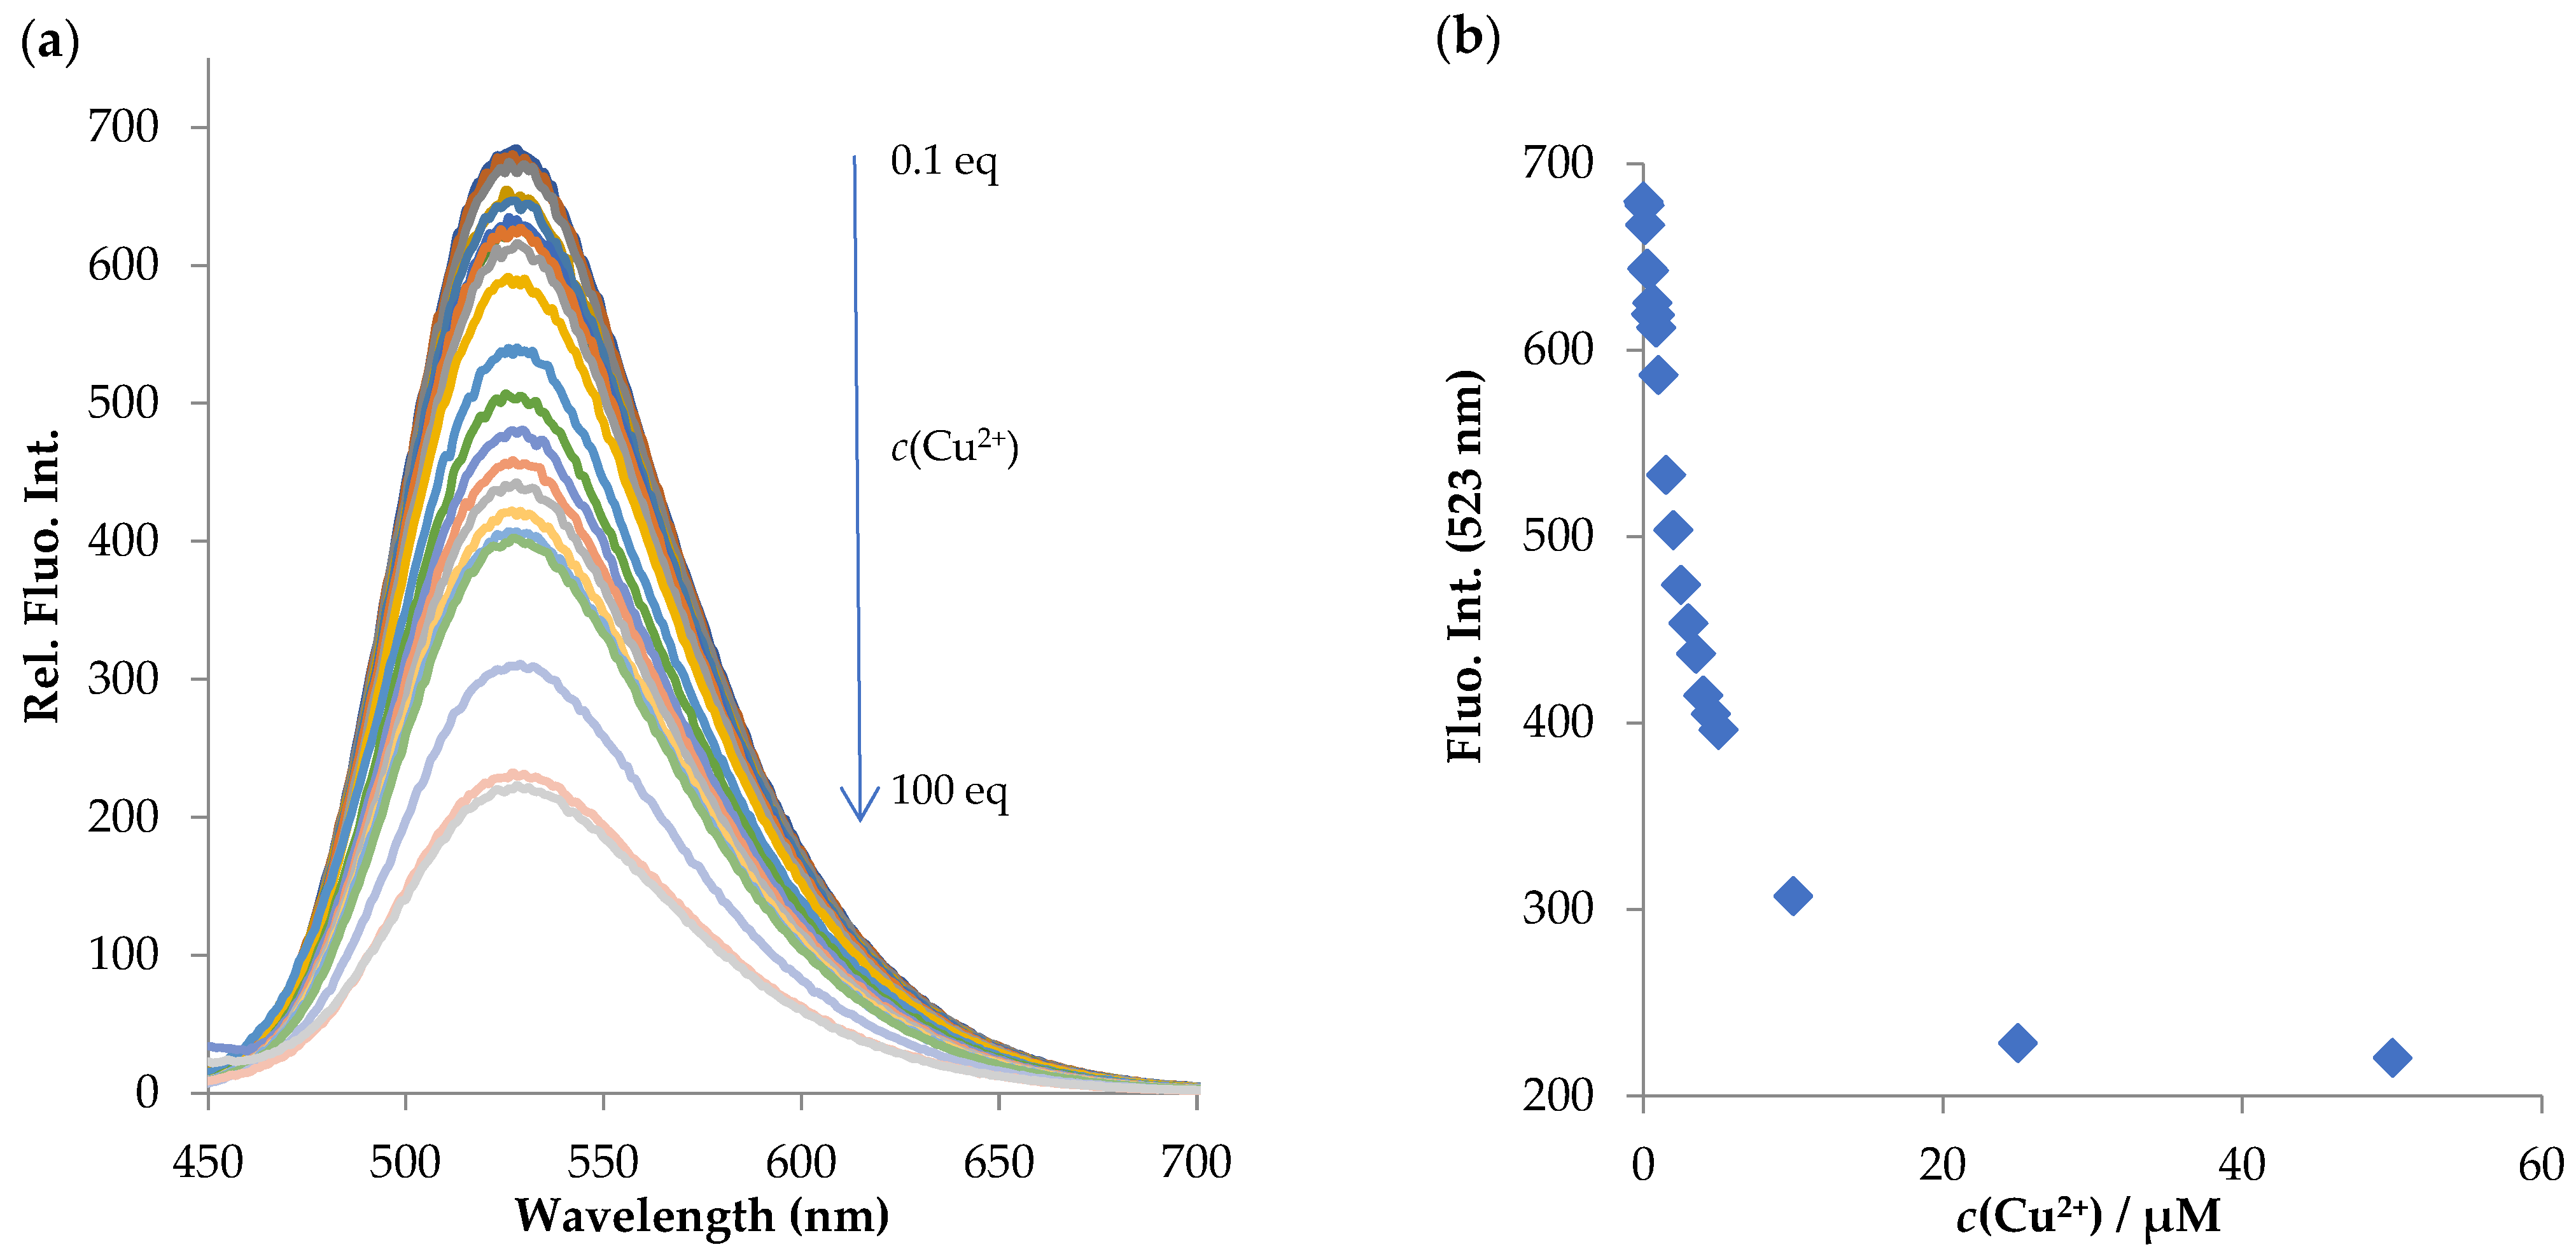
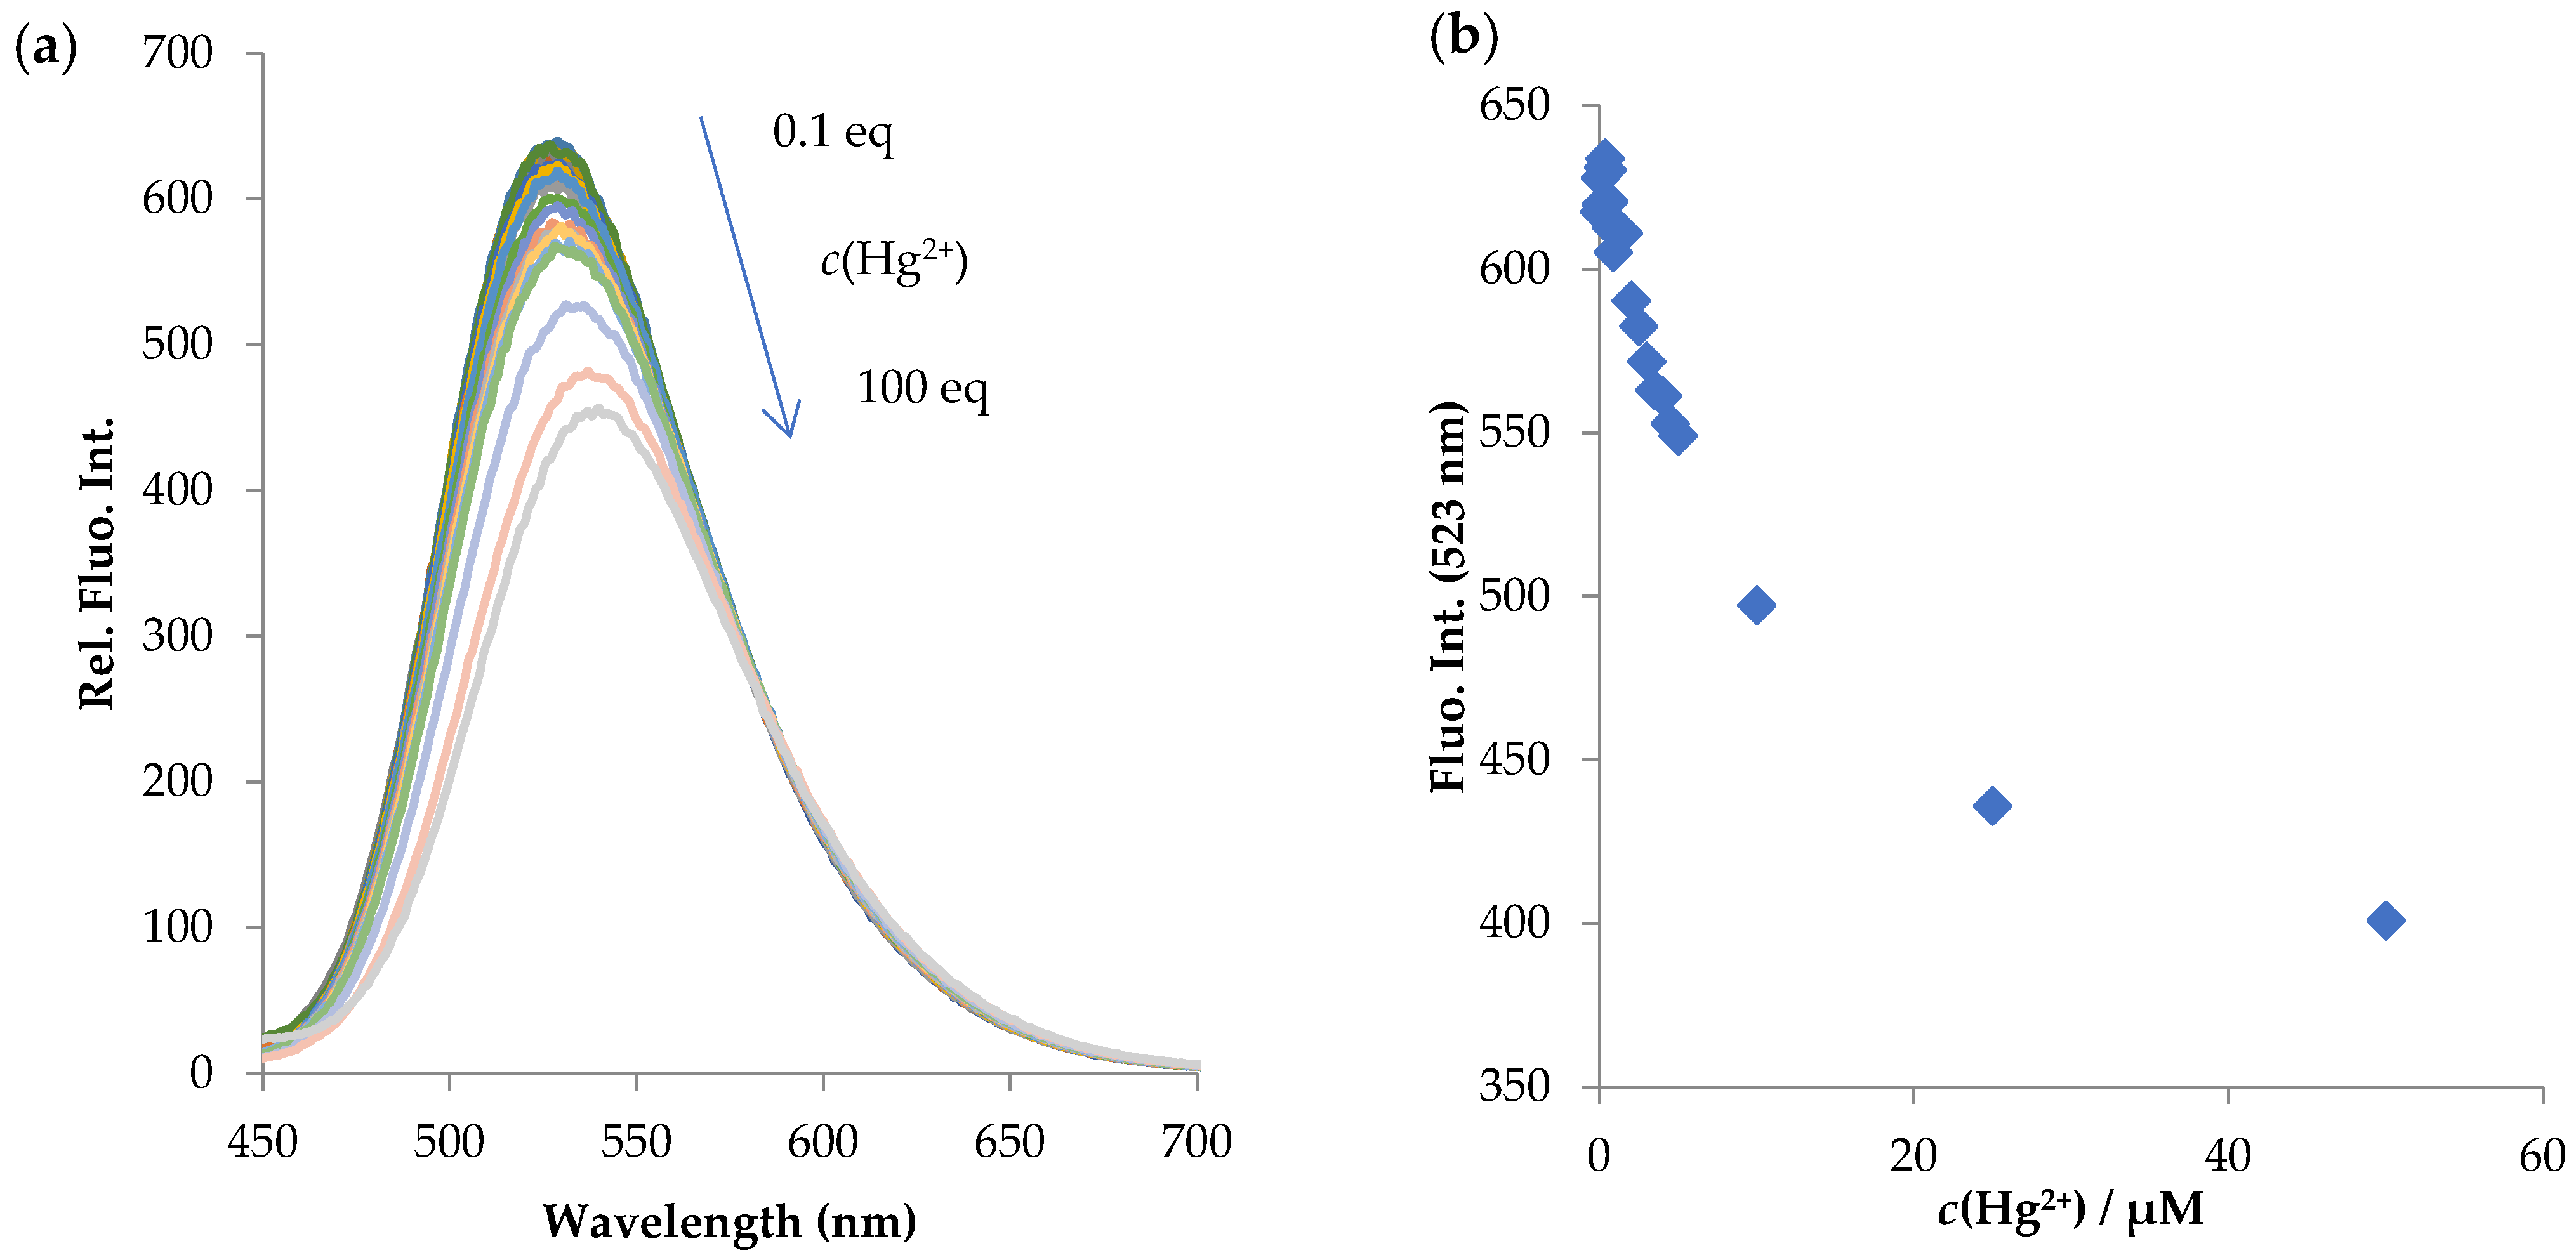
2.3.1. NI-1
- Visual detection of metal ion sensitivity
- Fluorescence titration experiments
- Reversibility tests
- Metal-binding studies
- LOD (limit of detection)
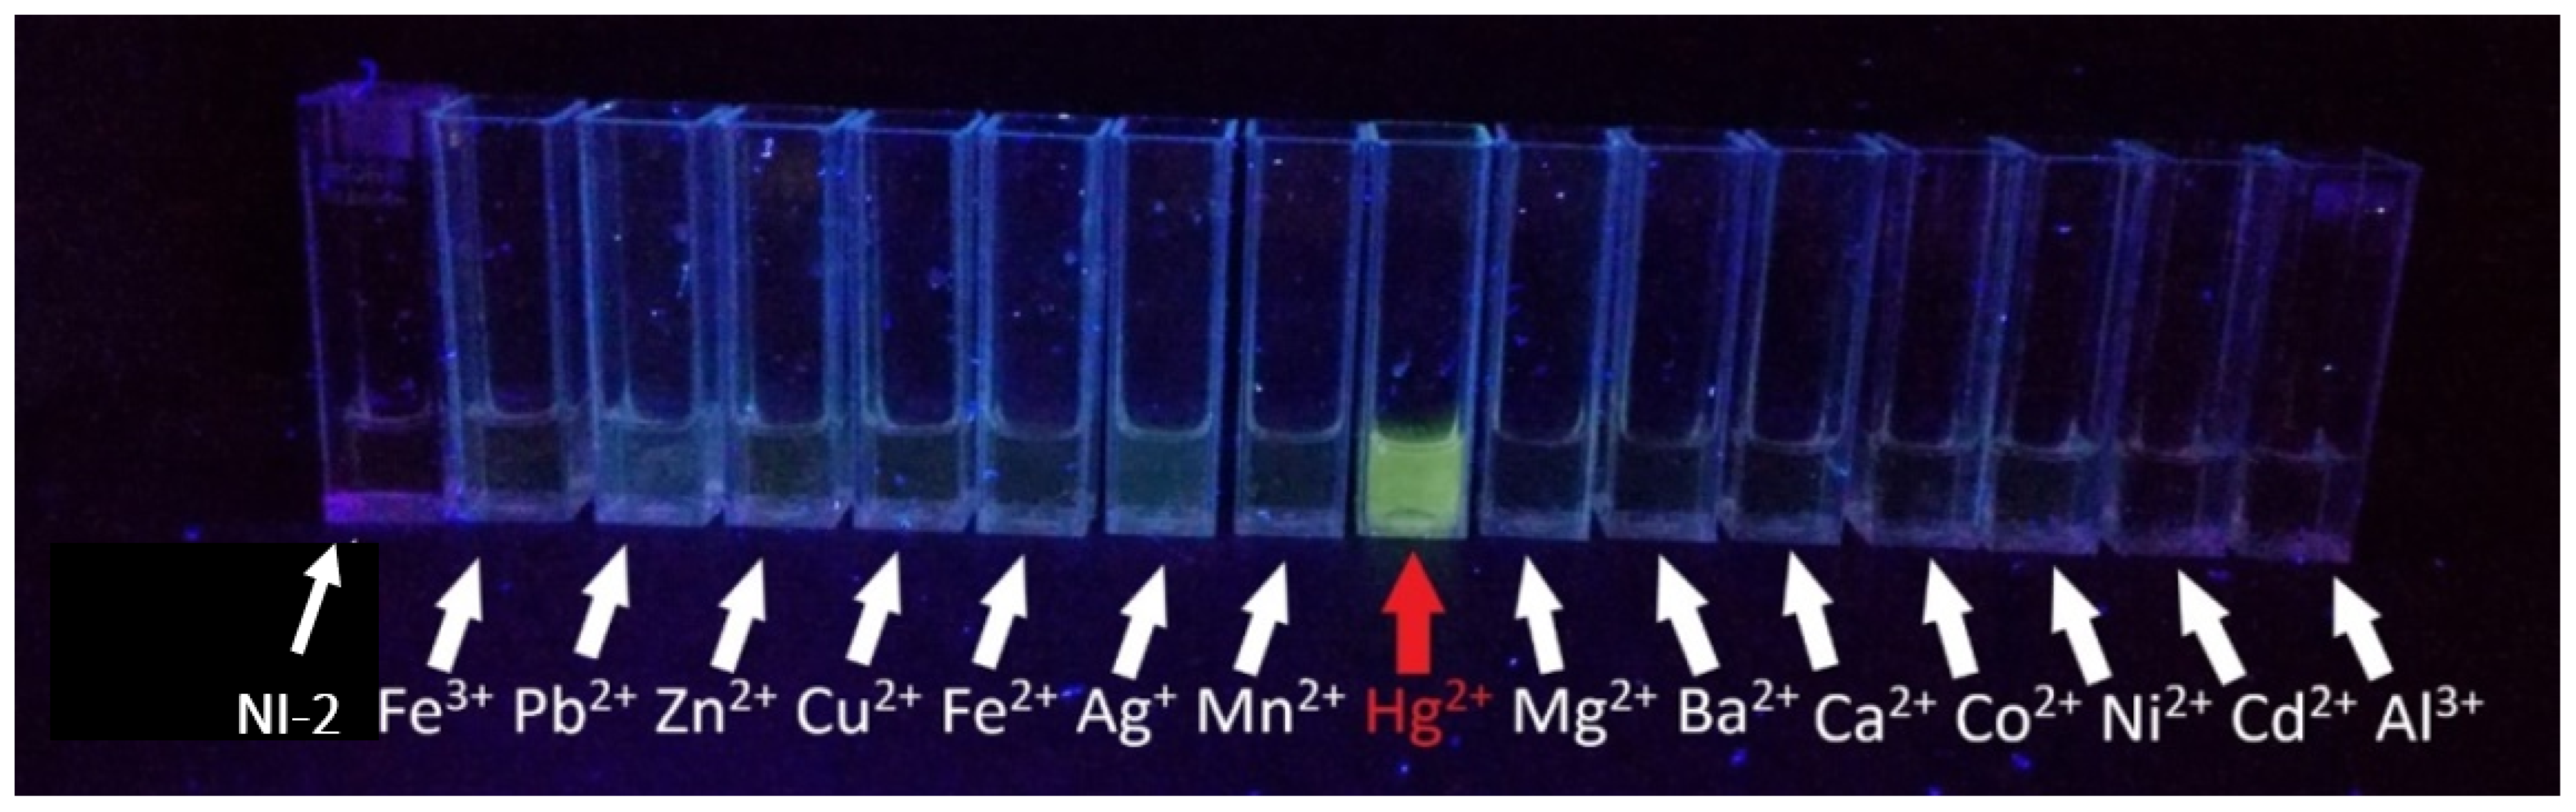
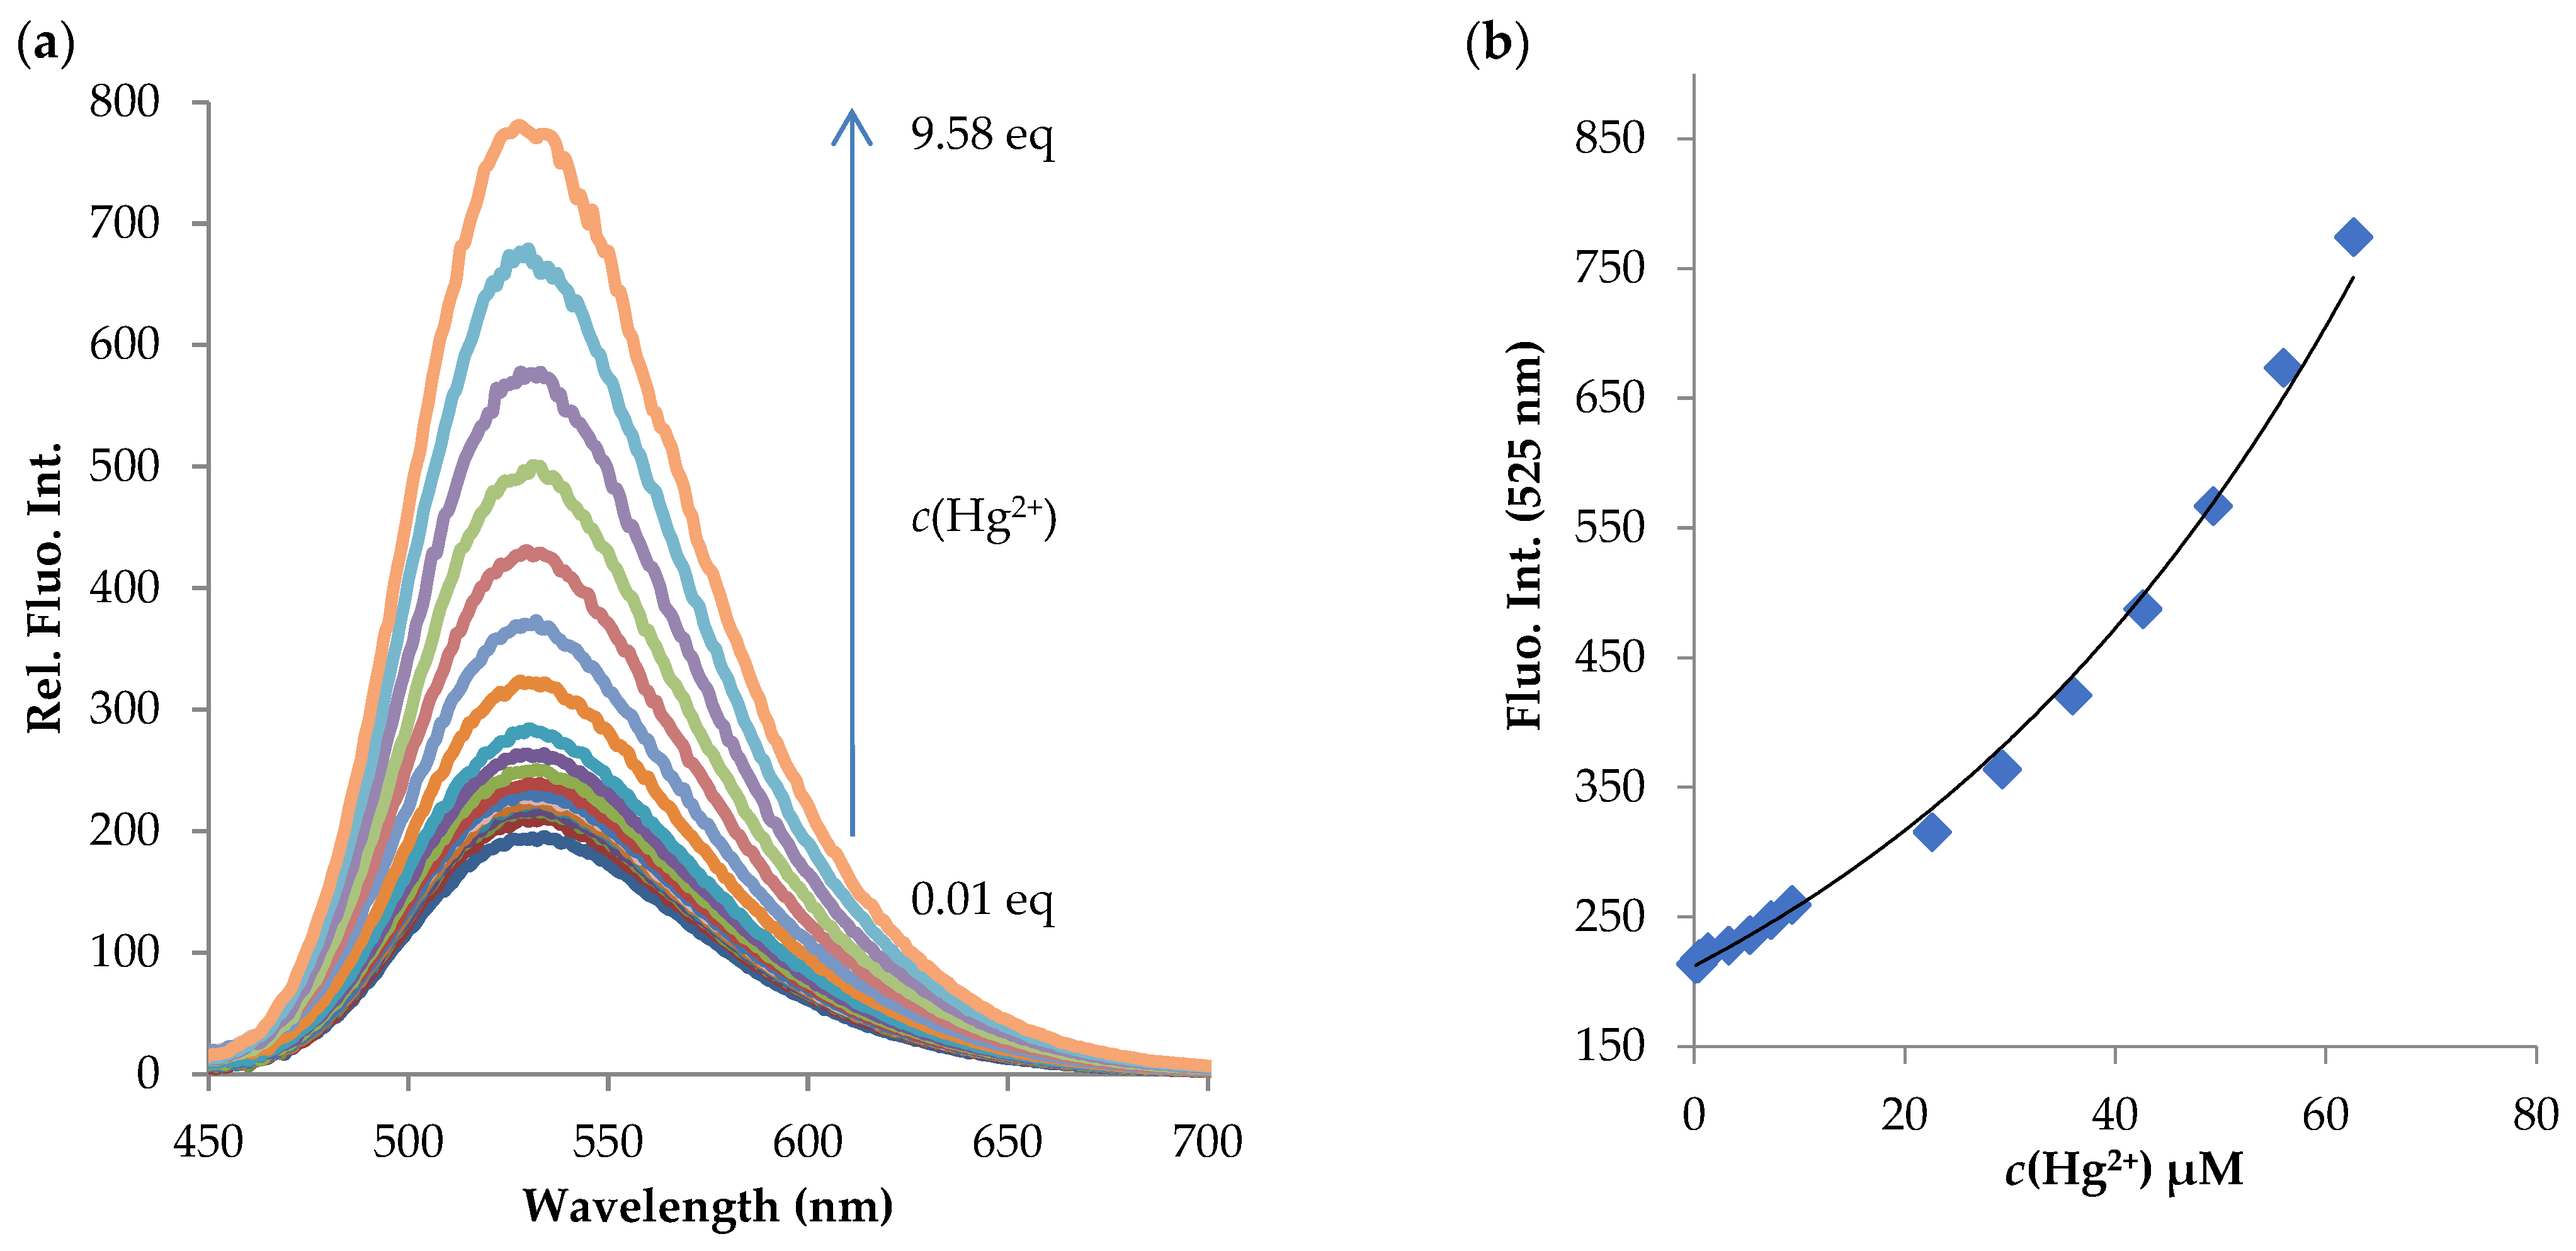
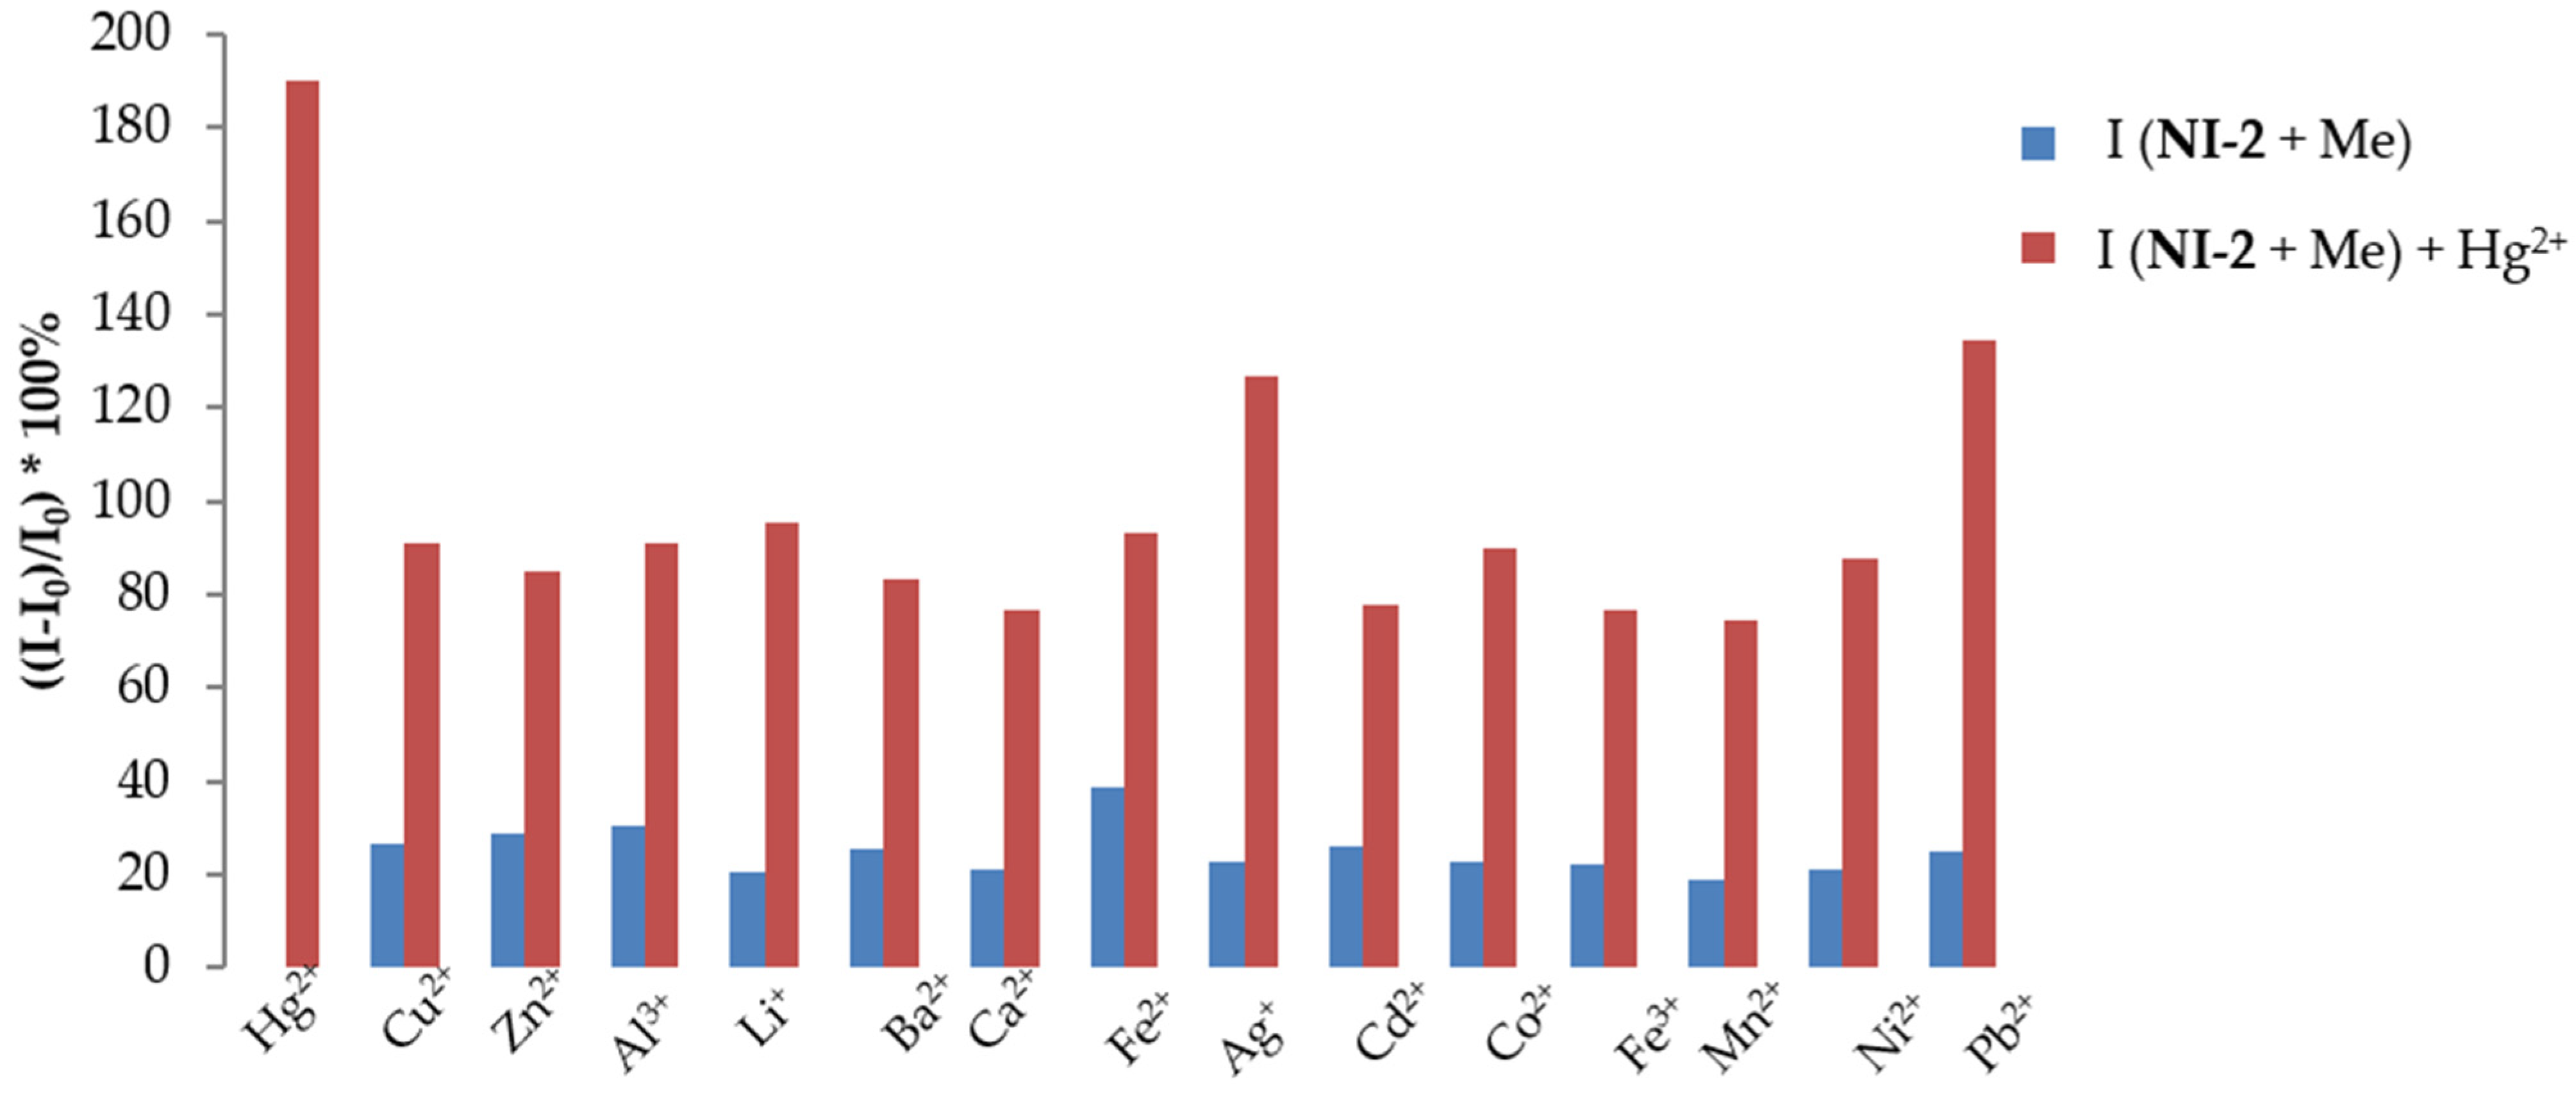
2.3.2. NI-2
- Visual detection of metal ion sensitivity
- Titration experiments
- Selectivity
- Metal-binding studies
- LOD (limit of detection)
- Reversibility
3. Materials and Methods
3.1. Reagents and Instruments
3.2. UV-Vis Absorbance and Fluorescence Spectra Measurements
3.2.1. The Effect of pH
3.2.2. Metal Ion Sensing
4. Conclusions
Supplementary Materials
Author Contributions
Funding
Institutional Review Board Statement
Informed Consent Statement
Data Availability Statement
Acknowledgments
Conflicts of Interest
Sample Availability
References
- Li, M.; Gou, H.; Al-Ogaidi, I.; Wu, N. Nanostructured Sensors for Detection of Heavy Metals: A Review. ACS Sustain. Chem. Eng. 2013, 1, 713–723. [Google Scholar] [CrossRef]
- Bhardwaj, V.; Nurchi, V.M.; Sahoo, S.K. Mercury Toxicity and Detection Using Chromo-Fluorogenic Chemosensors. Pharmaceuticals 2021, 14, 123. [Google Scholar] [CrossRef]
- Tchekwagep, P.M.S.; Crapnell, R.D.; Banks, C.E.; Betlem, K.; Rinner, U.; Canfarotta, F.; Lowdon, J.W.; Eersels, K.; van Grinsven, B.; Peeters, M.; et al. A Critical Review on the Use of Molecular Imprinting for Trace Heavy Metal and Micropollutant Detection. Chemosensors 2022, 10, 296. [Google Scholar] [CrossRef]
- Ullah, N.; Chohan, M.M.; Khan, I.; Qurashi, A. Nanomaterial-based optical chemical sensors for the detection of heavy metals in water: Recent advances and challenges. TrAC Trends Anal. Chem. 2018, 100, 155–166. [Google Scholar] [CrossRef]
- Garg, N.; Deep, A.; Sharma, A.L. Recent Trends and Advances in Porous Metal-Organic Framework Nanostructures for the Electrochemical and Optical Sensing of Heavy Metals in Water. Crit. Rev. Anal. Chem. 2022, 13, 1–25. [Google Scholar]
- Nagarajan, R.; Varadaraju, C.; Lee, K.H. Recent advancements in the role of N-Heterocyclic receptors on heavy metal ion sensing. Dyes Pigm. 2021, 191, 109331. [Google Scholar] [CrossRef]
- De Acha, N.; Elosua, C.; Corres, J.M.; Arregui, F.J. Fluorescent Sensors for the Detection of Heavy Metal Ions in Aqueous Media. Sensors 2019, 19, 599. [Google Scholar] [CrossRef]
- Valeur, B.; Leray, I. Design principles of fluorescent molecular sensors for cation recognition. Coord. Chem. Rev. 2000, 205, 3–40. [Google Scholar] [CrossRef]
- Murkovic, I.; Wolfbeis, O.S. Fluorescence-based sensor membrane for mercury(II) detection. Sens. Actuators B: Chem. 1997, 39, 246–251. [Google Scholar] [CrossRef]
- Murkovic, I.; Oehme, I.; Mohr, G.J.; Ferber, T.; Wolfbeis, O.S. Optode membrane for continuous measurement of silver ions. Mikrochim. Acta 1995, 121, 249–258. [Google Scholar] [CrossRef]
- Hranjec, M.; Horak, E.; Tireli, M.; Pavlović, G.; Karminski-Zamola, G. Synthesis, crystal structure and spectroscopic study of novel benzimidazoles and benzimidazo[1,2-a]quinolines as potential chemosensors for different cations. Dyes Pigm. 2012, 95, 644–656. [Google Scholar] [CrossRef]
- de Silva, A.P.; Gunaratne, H.Q.N.; Gunnlaugsson, T.; Huxley, A.J.M.; McCoy, C.P.; Rademacher, J.T.; Rice, T.E. Signaling Recognition Events with Fluorescent Sensors and Switches. Chem. Rev. 1997, 97, 1515–1566. [Google Scholar] [CrossRef]
- Quang, D.T.; Kim, J.S. Fluoro- and Chromogenic Chemodosimeters for Heavy Metal Ion Detection in Solution and Biospecimens. Chem. Rev. 2010, 110, 6280–6301. [Google Scholar] [CrossRef]
- Lobnik, A.; Turel, M.; Urek, S.K. Optical Chemical Sensors:Design and Applications. In Advances in Chemical Sensors; Wang, W., Ed.; IntechOpen: London, UK, 2012; pp. 3–28. [Google Scholar]
- Carter, K.P.; Young, A.M.; Palmer, A.E. Fluorescent Sensors for Measuring Metal Ions in Living Systems. Chem. Rev. 2014, 114, 4564–4601. [Google Scholar] [CrossRef]
- Wu, D.; Sedgwick, A.C.; Gunnlaugsson, T.; Akkaya, E.U.; Yoon, J.; James, T.D. Fluorescent chemosensors: The past, present and future. Chem. Soc. Rev. 2017, 46, 7105–7123. [Google Scholar] [CrossRef]
- Duke, R.M.; Veale, E.B.; Pfeffer, F.M.; Kruger, P.E.; Gunnlaugsson, T. Colorimetric and fluorescent anion sensors: An overview of recent developments in the use of 1,8-naphthalimide-based chemosensors. Chem. Soc. Rev. 2010, 39, 3936–3953. [Google Scholar] [CrossRef]
- Daly, B.; Ling, J.; de Silva, A.P. Current developments in fluorescent PET (photoinduced electron transfer) sensors and switches. Chem. Soc. Rev. 2015, 44, 4203–4211. [Google Scholar] [CrossRef]
- Yordanova-Tomova, S.; Cheshmedzhieva, D.; Stoyanov, S.; Dudev, T.; Grabchev, I. Synthesis, Photophysical Characterization, and Sensor Activity of New 1,8-Naphthalimide Derivatives. Sensors 2020, 20, 3892. [Google Scholar] [CrossRef]
- Nolan, E.M.; Lippard, S.J. Tools and tactics for the optical detection of mercuric ion. Chem. Rev. 2008, 108, 3443–3480. [Google Scholar] [CrossRef]
- Escandar, G.M.; Olivieri, A.C. A Critical Review on the Development of Optical Sensors for the Determination of Heavy Metals in Water Samples. The Case of Mercury(II) Ion. ACS Omega 2022, 7, 39574–39585. [Google Scholar] [CrossRef]
- Choudhury, N.; Saha, B.; De, P. Recent progress in polymer-based optical chemosensors for Cu2+ and Hg2+ Ions: A comprehensive review. Eur. Polym. J. 2021, 145, 110233. [Google Scholar] [CrossRef]
- Gerdan, Z.; Saylan, Y.; Denizli, A. Recent Advances of Optical Sensors for Copper Ion Detection. Micromachines 2022, 13, 1298. [Google Scholar] [CrossRef] [PubMed]
- Tang, L.; Sharma, S.; Pandey, S.S. Synthesis and Characterization of Newly Designed and Highly Solvatochromic Double Squaraine Dye for Sensitive and Selective Recognition towards Cu2+. Molecules 2022, 27, 6578. [Google Scholar] [CrossRef]
- Queirós, C.; Almodovar, V.A.S.; Martins, F.; Leite, A.; Tome, A.C.; Silva, A.M.G. Synthesis of Novel Diketopyrrolopyrrole-Rhodamine Conjugates and Their Ability for Sensing Cu2+ and Li+. Molecules 2022, 27, 7219. [Google Scholar] [CrossRef]
- Georgiev, N.I.; Dimitrova, M.D.; Mavrova, A.T.; Bojinov, V.B. Synthesis, fluorescence-sensing and molecular logic of two water-soluble 1,8-naphthalimides. Spectrochim. Acta A Mol. Biomol. Spectrosc. 2017, 183, 7–16. [Google Scholar] [CrossRef]
- McGlynn, S.P.; Sunseri, R.; Christodouleas, N. External Heavy-Atom Spin-Orbital Coupling Effect. I. The Nature of the Interaction. J. Chem. Phys. 1962, 37, 1818–1824. [Google Scholar] [CrossRef]
- Tian, M.; Wang, C.; Ma, Q.; Bai, Y.; Sun, J.; Ding, C. A Highly Selective Fluorescent Probe for Hg2+ Based on a 1,8-Naphthalimide Derivative. ACS Omega 2020, 5, 18176–18184. [Google Scholar] [CrossRef]
- Jain, N.; Kaur, N. A comprehensive compendium of literature of 1,8-Naphthalimide based chemosensors from 2017 to 2021. Coord. Chem. Rev. 2022, 459, 214454. [Google Scholar] [CrossRef]
- Georgiev, N.I.; Krasteva, P.V.; Bakov, V.V.; Bojinov, V.B. A Highly Water-Soluble and Solid State Emissive 1,8-Naphthalimide as a Fluorescent PET Probe for Determination of pHs, Acid/Base Vapors, and Water Content in Organic Solvents. Molecules 2022, 27, 4229. [Google Scholar] [CrossRef]
- Bakov, V.V.; Georgiev, N.I.; Bojinov, V.B. A Novel Fluorescent Probe for Determination of pH and Viscosity Based on a Highly Water-Soluble 1,8-Naphthalimide Rotor. Molecules 2022, 27, 7556. [Google Scholar] [CrossRef]
- Li, Z.; Chen, W.; Dong, L.; Song, Y.; Li, R.; Li, Q.; Qu, D.; Zhang, H.; Yang, Q.; Li, Y. A novel ratiometric and reversible fluorescent probe based on naphthalimide for the detection of Al3+ and pH with excellent selectivity. New J. Chem. 2020, 44, 3261–3267. [Google Scholar] [CrossRef]
- Zhu, H.; Liu, C.; Su, M.; Rong, X.; Zhang, Y.; Wang, X.; Wang, K.; Li, X.; Yu, Y.; Zhang, X.; et al. Recent advances in 4-hydroxy-1,8-naphthalimide-based small-molecule fluorescent probes. Coord. Chem. Rev. 2021, 448, 214153. [Google Scholar] [CrossRef]
- Zhou, X.; Su, F.; Gao, W.; Tian, Y.; Youngbull, C.; Johnson, R.H.; Meldrum, D.R. Triazacryptand-based fluorescent sensors for extracellular and intracellular K+ sensing. Biomaterials 2011, 32, 8574–8583. [Google Scholar] [CrossRef] [PubMed]
- Panchenko, P.A.; Fedorov, Y.V.; Perevalov, V.P.; Jonusauskas, G.; Fedorova, O.A. Cation-Dependent Fluorescent Properties of Naphthalimide Derivatives with N-Benzocrown Ether Fragment. J. Phys. Chem. A 2010, 114, 4118–4122. [Google Scholar] [CrossRef] [PubMed]
- Li, C.Y.; Xu, F.; Li, Y.-F.; Zhou, K.; Zhou, Y. A fluorescent chemosensor for Hg2+ based on naphthalimide derivative by fluorescence enhancement in aqueous solution. Anal. Chim. Acta 2012, 717, 122–126. [Google Scholar] [CrossRef]
- Wu, X.-F.; Ma, Q.-J.; Wei, X.-J.; Hou, Y.-M.; Zhu, X. A selective fluorescent sensor for Hg2+ based on covalently immobilized naphthalimide derivative. Sens. Actuators B Chem. 2013, 183, 565–573. [Google Scholar] [CrossRef]
- Kim, S.Y.; Hong, J.-I. Naphthalimide-based fluorescent Zn2+ chemosensors showing PET effect according to their linker length in water. Tetrahedron Lett. 2009, 50, 2822–2824. [Google Scholar] [CrossRef]
- Gao, Y.-G.; Liu, F.-L.; Patil, S.; Li, D.-J.; Qadir, A.; Lin, X.; Tian, Y.; Li, Y.; Qian, A.-R. 1,8-Naphthalimide-Based Multifunctional Compounds as Cu2+ Probes, Lysosome Staining Agents, and Non-viral Vectors. Front. Chem. 2019, 7, 616. [Google Scholar] [CrossRef] [PubMed]
- Aderinto, S.O.; Imhanria, S. Fluorescent and colourimetric 1, 8-naphthalimide-appended chemosensors for the tracking of metal ions: Selected examples from the year 2010 to 2017. Chem. Pap. 2018, 72, 1823–1851. [Google Scholar] [CrossRef]
- Gopikrishna, P.; Meher, N.; Iyer, P.K. Functional 1,8-Naphthalimide AIE/AIEEgens: Recent Advances and Prospects. ACS Appl. Mater. Interfaces 2018, 10, 12081–12111. [Google Scholar] [CrossRef] [PubMed]
- Singh, N.; Srivastava, R.; Singh, A.; Singh, R.K. Synthesis and Photophysical Studies on Naphthalimide Derived Fluorophores as Markers in Drug Delivery. J. Fluoresc. 2016, 26, 1431–1438. [Google Scholar] [CrossRef] [PubMed]
- Mohr, G.J. Synthesis of naphthalimide-based indicator dyes with a 2-hydroxyethylsulfonyl function for covalent immobilisation to cellulose. Sens. Actuators B Chem. 2018, 275, 439–445. [Google Scholar] [CrossRef]
- de Silva, A.P. Crossing the divide: Experiences of taking fluorescent PET (photoinduced electron transfer) sensing/switching systems from solution to solid. Dyes Pigm. 2022, 204, 110453. [Google Scholar] [CrossRef]
- Gan, J.; Chen, K.; Chang, C.-P.; Wu, W. Luminescent properties and photo-induced electron transfer of naphthalimides with piperazine substituent. Dyes Pigm. 2003, 57, 21–28. [Google Scholar] [CrossRef]
- Tian, Y.; Su, F.; Weber, W.; Nandakumar, V.; Shumway, B.R.; Jin, Y.; Zhou, X.; Holl, M.R.; Johnson, R.H.; Meldrum, D.R. A series of naphthalimide derivatives as intra and extracellular pH sensors. Biomaterials 2010, 31, 7411–7422. [Google Scholar] [CrossRef] [PubMed]
- Lee, M.H.; Park, N.; Yi, C.; Han, J.H.; Hong, J.H.; Kim, K.P.; Kang, D.H.; Sessler, J.L.; Kang, C.; Kim, J.S. Mitochondria-immobilized pH-sensitive off–on fluorescent probe. J. Am. Chem. Soc. 2014, 136, 14136–14142. [Google Scholar] [CrossRef] [PubMed]
- Kriltz, A.; Löser, C.; Mohr, G.J.; Trupp, S. Covalent immobilization of a fluorescent pH-sensitive naphthalimide dye in sol-gel films. J. Sol-Gel Sci. Technol. 2012, 63, 23–29. [Google Scholar] [CrossRef]
- Fu, Y.; Zhang, J.; Wang, H.; Chen, J.L.; Zhao, P.; Chen, G.R.; He, X.P. Intracellular pH sensing and targeted imaging of lysosome by a galactosyl naphthalimide-piperazine probe. Dyes Pigm. 2016, 133, 372–379. [Google Scholar] [CrossRef]
- Lee, M.H. Bis(Naphthalimide-Piperazine)-Based Off-On Fluorescent Probe for Acids. J. Fluoresc. 2016, 26, 807–811. [Google Scholar] [CrossRef]
- Liu, Y.; Zhang, J.; Feng, T.; Li, Y. Synthesis, structure–fluorescence relationships and density functional theory studies of novel naphthalimide–piperazine–pyridine-based polystyrene sensors for Hg(II) detection. RSC Adv. 2020, 10, 25281–25289. [Google Scholar] [CrossRef]
- Zhang, H.; Qu, Y.; Zhao, K.; Wang, C.; Wu, Y.; Wu, H. A fluorescence “on-off” sensor for the highly selective and sensitive detection of Cu2+ ion. J. Chin. Chem. Soc. 2020, 67, 1062–1069. [Google Scholar] [CrossRef]
- Qu, Y.; Wu, Y.; Wang, C.; Zhao, K.; Wu, H. A selective fluorescence probe for copper(II) ion in aqueous solution based on a 1,8-naphthalimide Schiff base derivative. Z. Naturforsch. B 2019, 74, 665–670. [Google Scholar] [CrossRef]
- Huang, G.Z.; Li, C.; Han, X.; Aderinto, S.O.; Shen, K.; Mao, S.; Wu, H. Sensitive and selective detection of Cu(II) ion: A new effective 1,8-naphthalimide-based fluorescence "turn off’ sensor. Luminescence 2018, 33, 660–669. [Google Scholar] [CrossRef]
- Dong, H.Q.; Wei, T.-B.; Ma, X.-Q.; Yang, Q.-Y.; Zhang, Y.-F.; Sun, Y.-J.; Shi, B.-B.; Yao, H.; Zhang, Y.-M.; Lin, Q. 1,8-Naphthalimide-based fluorescent chemosensors: Recent advances and perspectives. J. Mater. Chem. C 2020, 8, 13501–13529. [Google Scholar] [CrossRef]
- Anand, T.; Sivaraman, G.; Chellappa, D. Quinazoline copper(II) ensemble as turn-on fluorescence sensor for cysteine and chemodosimeter for NO. J. Photochem. Photobiol. A Chem. 2014, 281, 47–52. [Google Scholar] [CrossRef]
- Arslan, F.N.; Geyik, G.A.; Koran, K.; Ozen, F.; Aydin, D.; Elmas, S.N.K.; Gorgulu, A.O.; Yilmaz, I. Fluorescence “Turn On–Off” Sensing of Copper (II) Ions Utilizing Coumarin–Based Chemosensor: Experimental Study, Theoretical Calculation, Mineral and Drinking Water Analysis. J. Fluoresc. 2020, 30, 317–327. [Google Scholar] [CrossRef]
- Kim, G.; Choi, D.; Kim, C. A Benzothiazole-Based Fluorescence Turn-on Sensor for Copper(II). J. Fluoresc. 2021, 31, 1203–1209. [Google Scholar] [CrossRef]
- Silpcharu, K.; Soonthonhut, S.; Sukwattanasinitt, M.; Rashatasakhon, P. Fluorescent Sensor for Copper(II) and Cyanide Ions via the Complexation−Decomplexation Mechanism with Di(bissulfonamido)spirobifluorene. ACS Omega 2021, 6, 16696–16703. [Google Scholar] [CrossRef]
- Tamil Selvan, G.; Varadaraju, C.; Tamil Selvan, R.; Enoch, I.V.M.V.; Selvakumar, M. On/Off Fluorescent Chemosensor for Selective Detection of Divalent Iron and Copper Ions: Molecular Logic Operation and Protein Binding. ACS Omega 2018, 3, 7985–7992. [Google Scholar] [CrossRef]
- Xu, J.-H.; Hou, Y.-M.; Ma, Q.-J.; Wu, X.-F.; Wei, X.-J. A highly selective fluorescent sensor for Fe3+ based on covalently immobilized derivative of naphthalimide. Spectrochim. Acta A Mol. Biomol. Spectrosc. 2013, 112, 116–124. [Google Scholar] [CrossRef]
- Brynn Hibbert, D.; Thordarson, P. The death of the Job plot, transparency, open science and online tools, uncertainty estimation methods and other developments in supramolecular chemistry data analysis. Chem. Comm. 2016, 52, 12792–12805. [Google Scholar] [CrossRef] [PubMed]
- Li, G.; Gao, G.; Cheng, J.; Chen, X.; Zhao, Y.; Ye, Y. Two new reversible naphthalimide-based fluorescent chemosensors for Hg2+. Luminescence 2016, 31, 992–996. [Google Scholar] [CrossRef] [PubMed]
- Lei, F.; Shi, W.; Ma, J.; Yabin Chen, Y.; Kui, F.; Hui, Y.; Xie, Z. A novel thiosemicarbazone Schiff base derivative with aggregation-induced emission enhancement characteristics and its application in Hg2+ detection. Sens. Actuators B Chem. 2016, 237, 563–569. [Google Scholar]
- Sie, Y.-W.; Li, C.-L.; Wan, C.-F.; Chen, J.-H.; Hu, C.-H.; Wu, A.-T. 1,10-Phenanthroline based colorimetric and fluorescent sensor for Hg2+ in water: Experimental and DFT study. Inorganica Chim. Acta 2018, 469, 397–401. [Google Scholar] [CrossRef]
- Su, Q.; Niu, Q.; Sun, T.; Li, T. A simple fluorescence turn-on chemosensor based on Schiff-base for Hg2+-selective detection. Tetrahedron Lett. 2016, 57, 4297–4301. [Google Scholar] [CrossRef]
- Gamov, G.A. Processing of the spectrofluorimetric data using the graphical methods and the maximum likelihood approach. Spectrochim. Acta A Mol. Biomol. Spectrosc. 2021, 249, 119334. [Google Scholar] [CrossRef]
- Davidge, J.; Thomas, C.P.; Williams, D.R. Conditional formation constants or chemical speciation data? Chem. Speciat. Bioavailab. 2001, 13, 129–134. [Google Scholar] [CrossRef]
- van de Weert, M.; Stella, L. Fluorescence quenching and ligand binding: A critical discussion of a popular methodology. J. Mol. Struct. 2011, 998, 144–150. [Google Scholar] [CrossRef]
- Lentner, C. Wissenschaftliche Tabellen Geigy, 8th ed.; Ciba-Geigy: Basel, Switzerland, 1985. [Google Scholar]
- Fletcher, A.N. Quinine sulfate as a fluorescence quantum yield standard. Photochem. Photobiol. 1969, 9, 439–444. [Google Scholar] [CrossRef] [PubMed]


| pH (Form) | λabs/nm | ε/M−1 cm−1 | λemiss/nm | Rel. Fluo. Int. | Stokes Shift/cm−1 | pKa,abs | pKa,emiss | |
|---|---|---|---|---|---|---|---|---|
| NI-1 | 1.6 (NI-1H+) | 388 | 2662.90 | 523 | 836.2 | 6653 | 5.09 | 4.98 |
| 7.0 (NI-1) | 410 | 2020.58 | 531 | 30.2 | 5558 | |||
| NI-2 | 1.6 (NI-2H+) | 388 | 988.53 | 525 | 769.8 | 6726 | 3.18 | 2.91 |
| 7.0 (NI-2) | 410 | 916,58 | 533 | <4.95 | 5629 |
| Sensor Structure | Solvent Systems | Fluorescence Changes and Mechanism | Stoichiometry | K/M−1 | LOD/M | Ref. |
|---|---|---|---|---|---|---|
 | DMSO: H2O (1:9, v/v) at pH = 7.4 (HEPES) | Turn-off at 434 and 494 nm, Paramagnetic quenching | 1:1 | - | - | [56] |
 | CH3CN: HEPES (95:5, v/v) | Turn-off at 458 nm, Paramagnetic quenching | 1:1 | 9.0 × 10⁴ (BH) | 2.45 × 10⁻⁸ | [57] |
 | CH3CN | Fluorescence enhancement at 540 nm (turn-on), CHEF and ICT | 1:1 | 2.0 × 10³ (BH) | 3.3 × 10⁻⁶ | [58] |
 | CH3CN: HEPES (1:1, v/v) pH = 7.0 | Quenching at 530 nm (turn-off) | 1:1 | - | 9.82 × 10⁻⁸ | [59] |
 | H2O: DMF (9.9:0.1, v/v) | Turn-off at 410 nm, MLCT and paramagnetic quenching | 1:2 | 9.23 × 10⁸ (SV) | 1 × 10⁻⁷ | [60] |
 | DMF: Tris-HCl buffer (1:1, v/v) | Turn-off at 528 nm, Paramagnetic quenching | 2:1 | 4 × 10¹² | 1.92 × 10⁻⁷ | [50] |
 | MeOH: HEPES (1:1, v/v) | Turn-off at 525 nm, Paramagnetic quenching | 2:1 | 1.1 × 10⁴ | 5.67 × 10⁻⁷ | [53] |
 | DMSO: HEPES (1:1, v/v) | Turn-off at 523 nm | 1:1 | 1.14 × 10⁶ | 4.67 × 10⁻⁸ | [54] |
 | Tris-HCl buffer | Turn-off at 541 nm | 1:2 | n.d. | 2.62 × 10⁻⁹ | [39] |
 | HEPES | Turn-off at 396 nm, Paramagnetic quenching | 1:1 1:1 | 5.7 × 10⁵ 2.5 × 10⁵ | 1.5 × 10⁻⁶ 2.5 × 10⁻⁶ | [26] |
 | MeOH: phosphate buffer (1:2, v/v) | Turn-off at 523 nm | 1:1 | 3.6 × 10⁵ (BH) 1.5 × 10⁵ (SV) | 1.5 × 10⁻⁸ | This work |
| Sensor Structure | Solvent Systems | Fluorescence Changes And Mechanism | Stoichiometry | K/M−1 | LOD/M | Ref. |
|---|---|---|---|---|---|---|
 | DMSO: H2O (1:9, v/v) | Quenching at 510 nm and red shift (50 nm), AIEE | 1:2 | 2.51 × 10⁵ (BH) | 9.07 × 10⁻⁷ | [64] |
 | H2O with 0.5 % DMSO | Quenching at 480 and 540 nm | 1:2 | 1.77 × 10⁵ (SV) | 21.72 ppb | [65] |
 | CH3CN: H2O (1:1, v/v) | Turn-on at 415 nm and new band at 473 nm, C=N isomerization and ESIPT inhibition | 2:1 | 4.484 × 10⁵ (BH) | 2.27 × 10⁻⁸ | [66] |
 | Tris-HCl buffer | Turn-on t at 520 nm, PET inhibition | 1:1 | 3.5 × 10³ (BH) | 2.0 × 10⁻⁶ | [37] |
 | CH3CN: HEPES (1:1, v/v) | Enhancement 405 nm, PET inhibition | - | - | 1.98 × 10⁻⁶ | [49] |
 | Tris-HNO3 buffer | Enhancement at 529 nm, PET inhibition | 1:1 | 2.08 × 10⁵ (BH) | 4.93 × 10⁻⁸ | [36] |
 | Phosphate buffer | Quenching at 550 nm | 1:1 | - | 2.1 × 10⁻⁶ | [63] |
 | HEPES | Quenching at 396 nm, PET inhibition | 1:1 | 1.8 × 10⁵ 2.1 × 10⁵ (SV) | 1.9 × 10⁻⁶ 2.3 × 10⁻⁶ | [26] |
 | MeOH: phosphate buffer (1:2, v/v) | Quenching at 523 nm and red shift (18 nm) | 1:1 | 3.9 × 10⁴ (BH) 2.4 × 10⁴ (SV) | 8.8 × 10⁻⁸ | This work |
 | MeOH: phosphate buffer (1:2, v/v) | Enhancement at 525 nm | - | 8278 (BH) | 4.1 × 10⁻⁷ | This work |
Disclaimer/Publisher’s Note: The statements, opinions and data contained in all publications are solely those of the individual author(s) and contributor(s) and not of MDPI and/or the editor(s). MDPI and/or the editor(s) disclaim responsibility for any injury to people or property resulting from any ideas, methods, instructions or products referred to in the content. |
© 2023 by the authors. Licensee MDPI, Basel, Switzerland. This article is an open access article distributed under the terms and conditions of the Creative Commons Attribution (CC BY) license (https://creativecommons.org/licenses/by/4.0/).
Share and Cite
Pršir, K.; Matić, M.; Grbić, M.; Mohr, G.J.; Krištafor, S.; Steinberg, I.M. Naphthalimide-Piperazine Derivatives as Multifunctional “On” and “Off” Fluorescent Switches for pH, Hg2+ and Cu2+ Ions. Molecules 2023, 28, 1275. https://doi.org/10.3390/molecules28031275
Pršir K, Matić M, Grbić M, Mohr GJ, Krištafor S, Steinberg IM. Naphthalimide-Piperazine Derivatives as Multifunctional “On” and “Off” Fluorescent Switches for pH, Hg2+ and Cu2+ Ions. Molecules. 2023; 28(3):1275. https://doi.org/10.3390/molecules28031275
Chicago/Turabian StylePršir, Kristina, Mislav Matić, Marlena Grbić, Gerhard J. Mohr, Svjetlana Krištafor, and Ivana Murković Steinberg. 2023. "Naphthalimide-Piperazine Derivatives as Multifunctional “On” and “Off” Fluorescent Switches for pH, Hg2+ and Cu2+ Ions" Molecules 28, no. 3: 1275. https://doi.org/10.3390/molecules28031275
APA StylePršir, K., Matić, M., Grbić, M., Mohr, G. J., Krištafor, S., & Steinberg, I. M. (2023). Naphthalimide-Piperazine Derivatives as Multifunctional “On” and “Off” Fluorescent Switches for pH, Hg2+ and Cu2+ Ions. Molecules, 28(3), 1275. https://doi.org/10.3390/molecules28031275