

A Robust and Efficient FRET-Based Assay for Cannabinoid Receptor Ligands Discovery

 , , , and
Abstract
:1. Introduction
2. Results
2.1. CELT-335 Binding at CB1 and CB2 Receptors
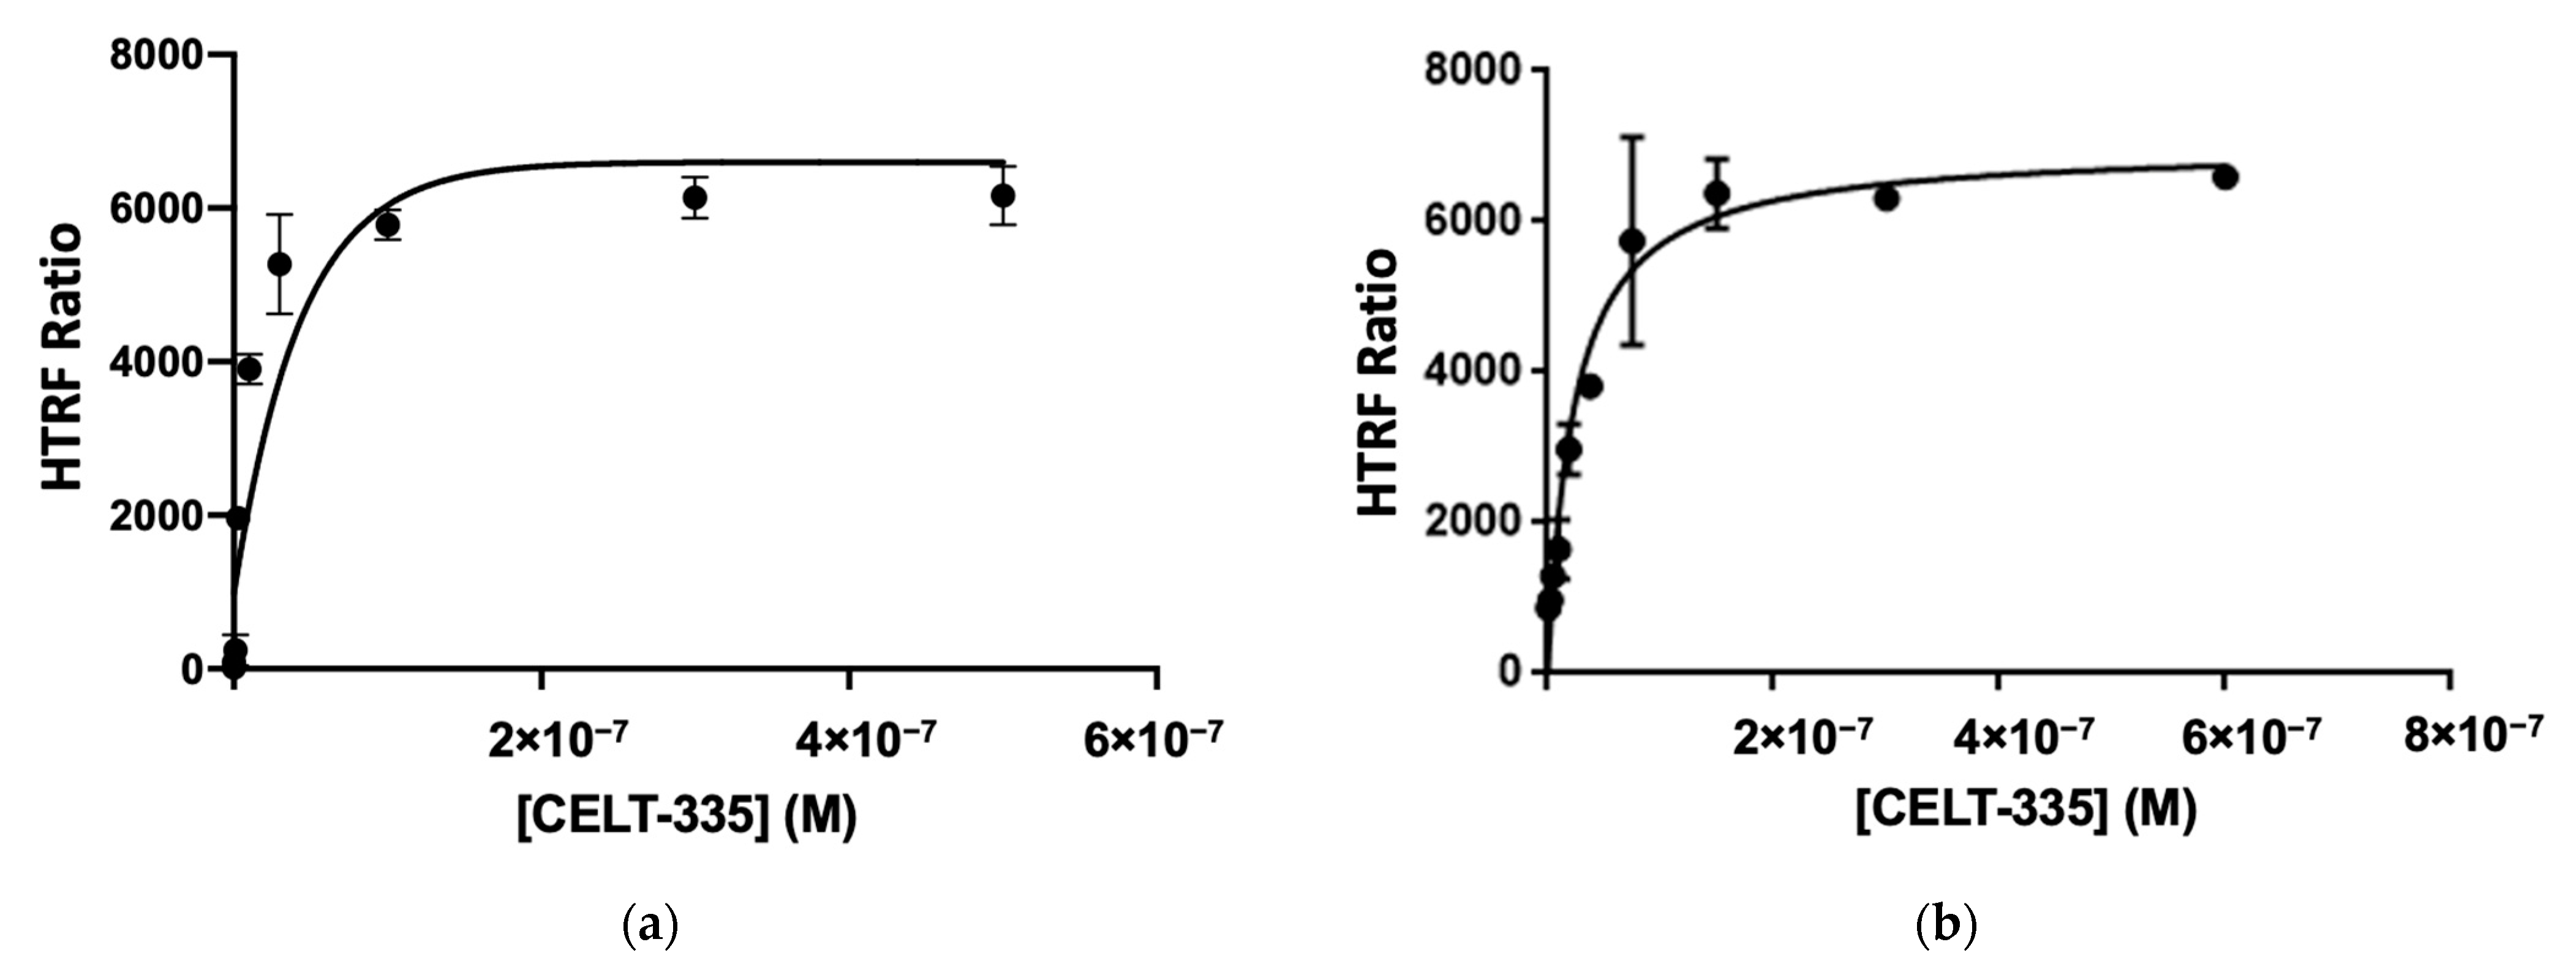
2.2. CELT-335 HTRF Assay Validation in hCB1R Expressing Adherent Cells
2.3. CELT-335 HTRF Assay Validation in hCB2R Expressing Adherent Cells
3. Discussion
4. Materials and Methods
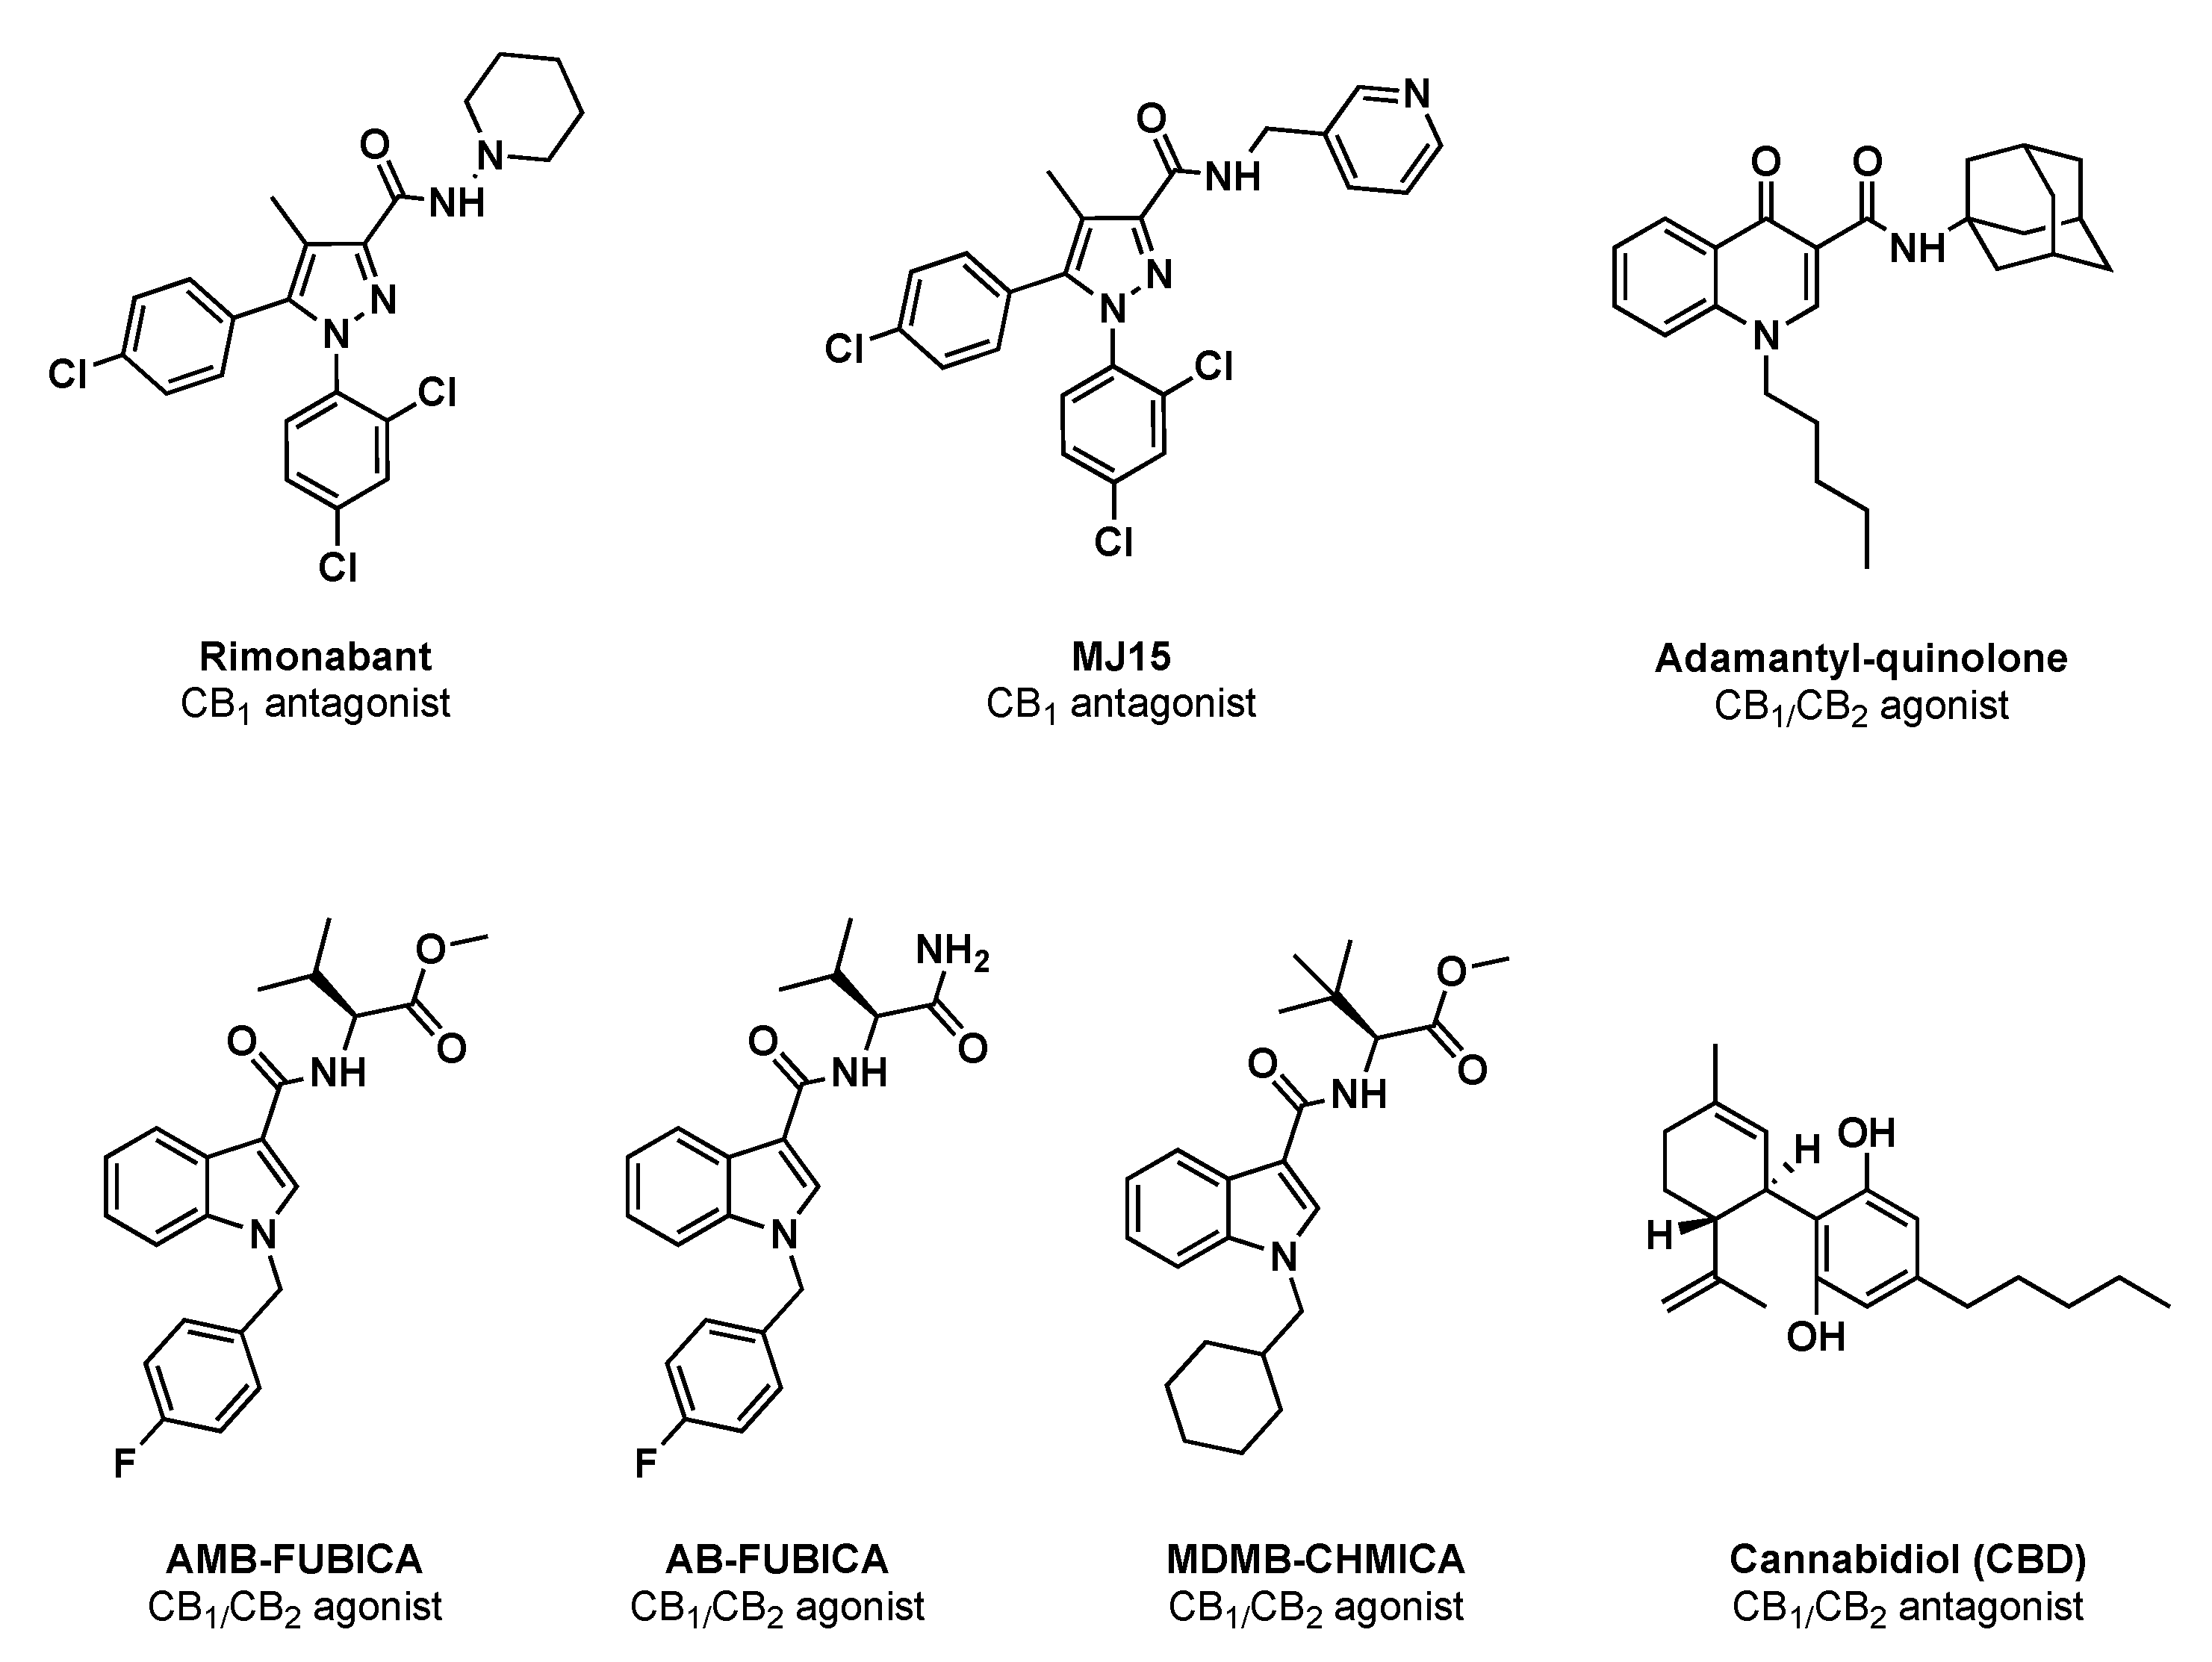
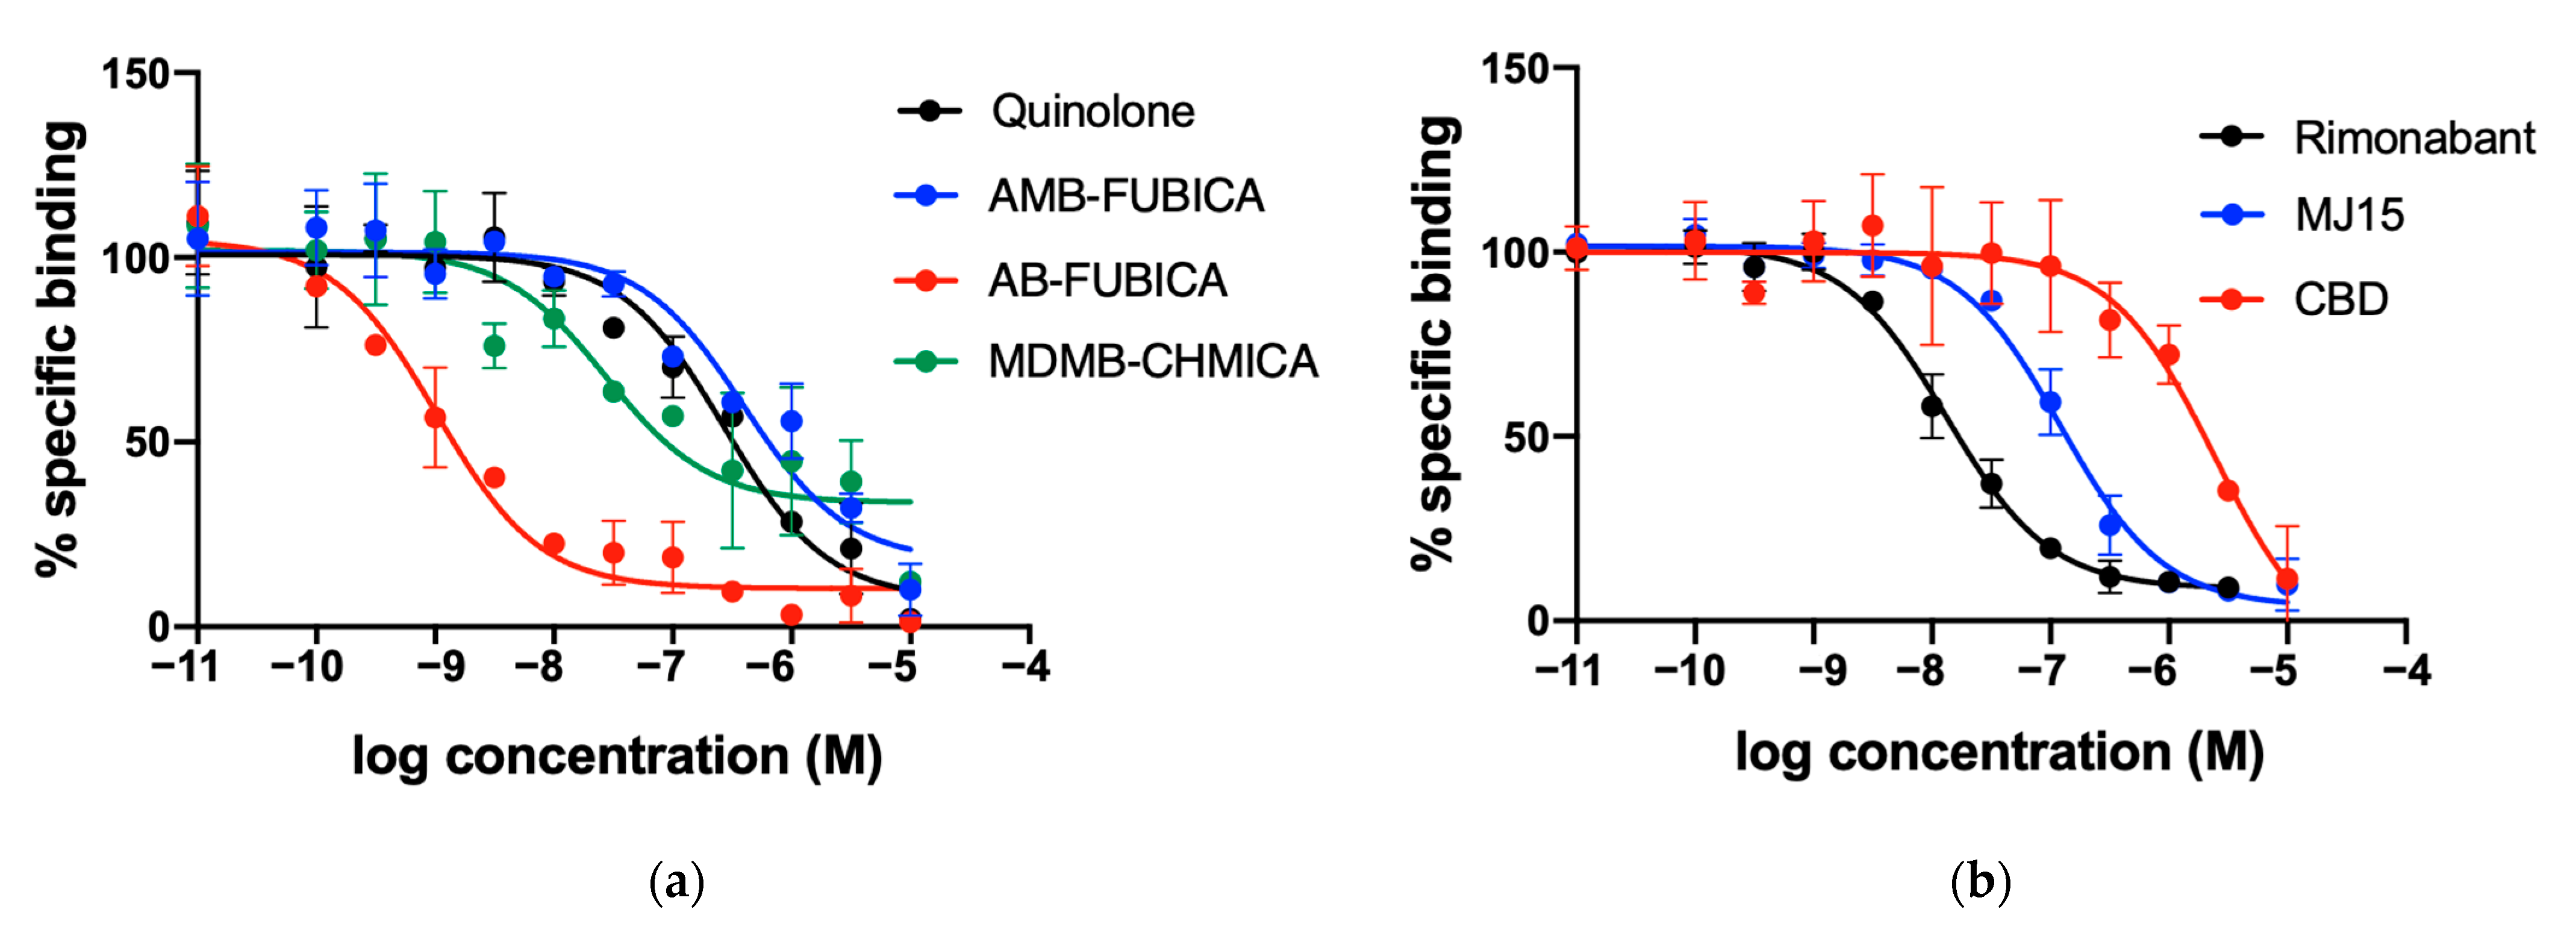
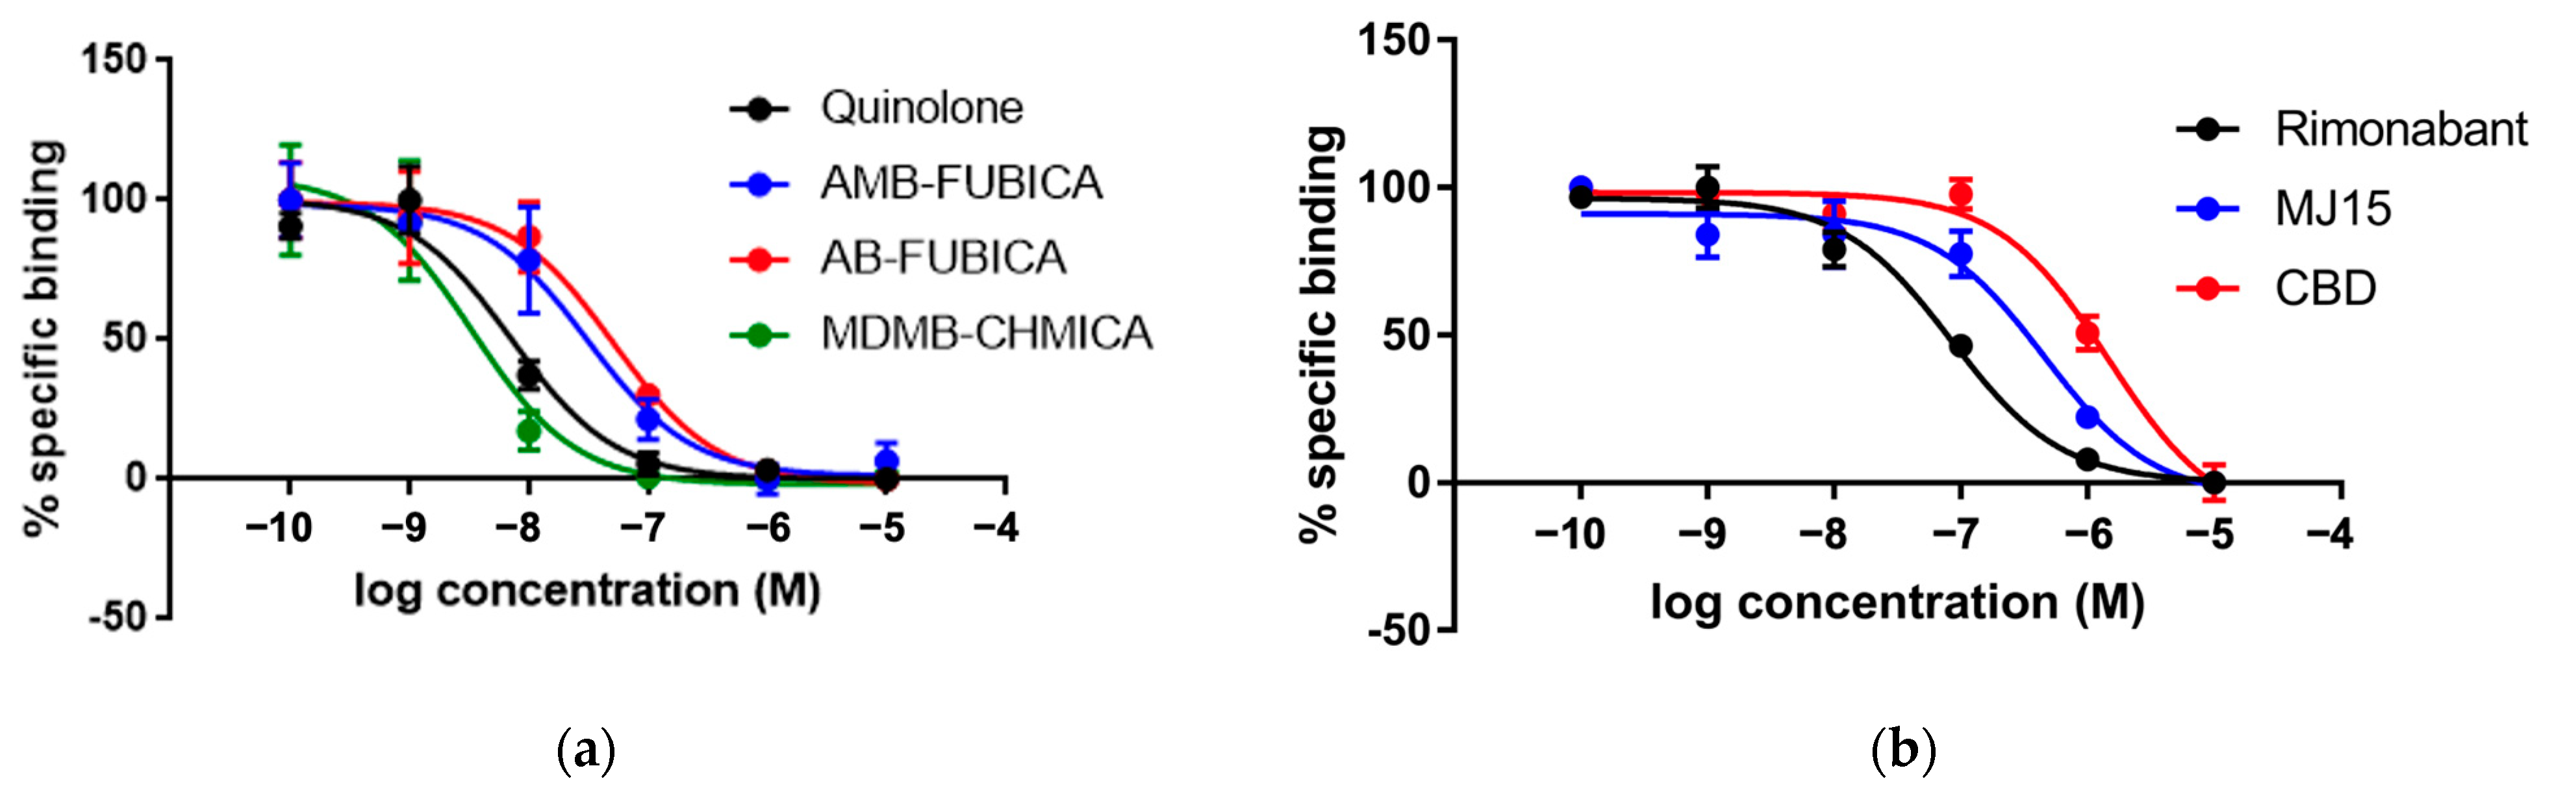
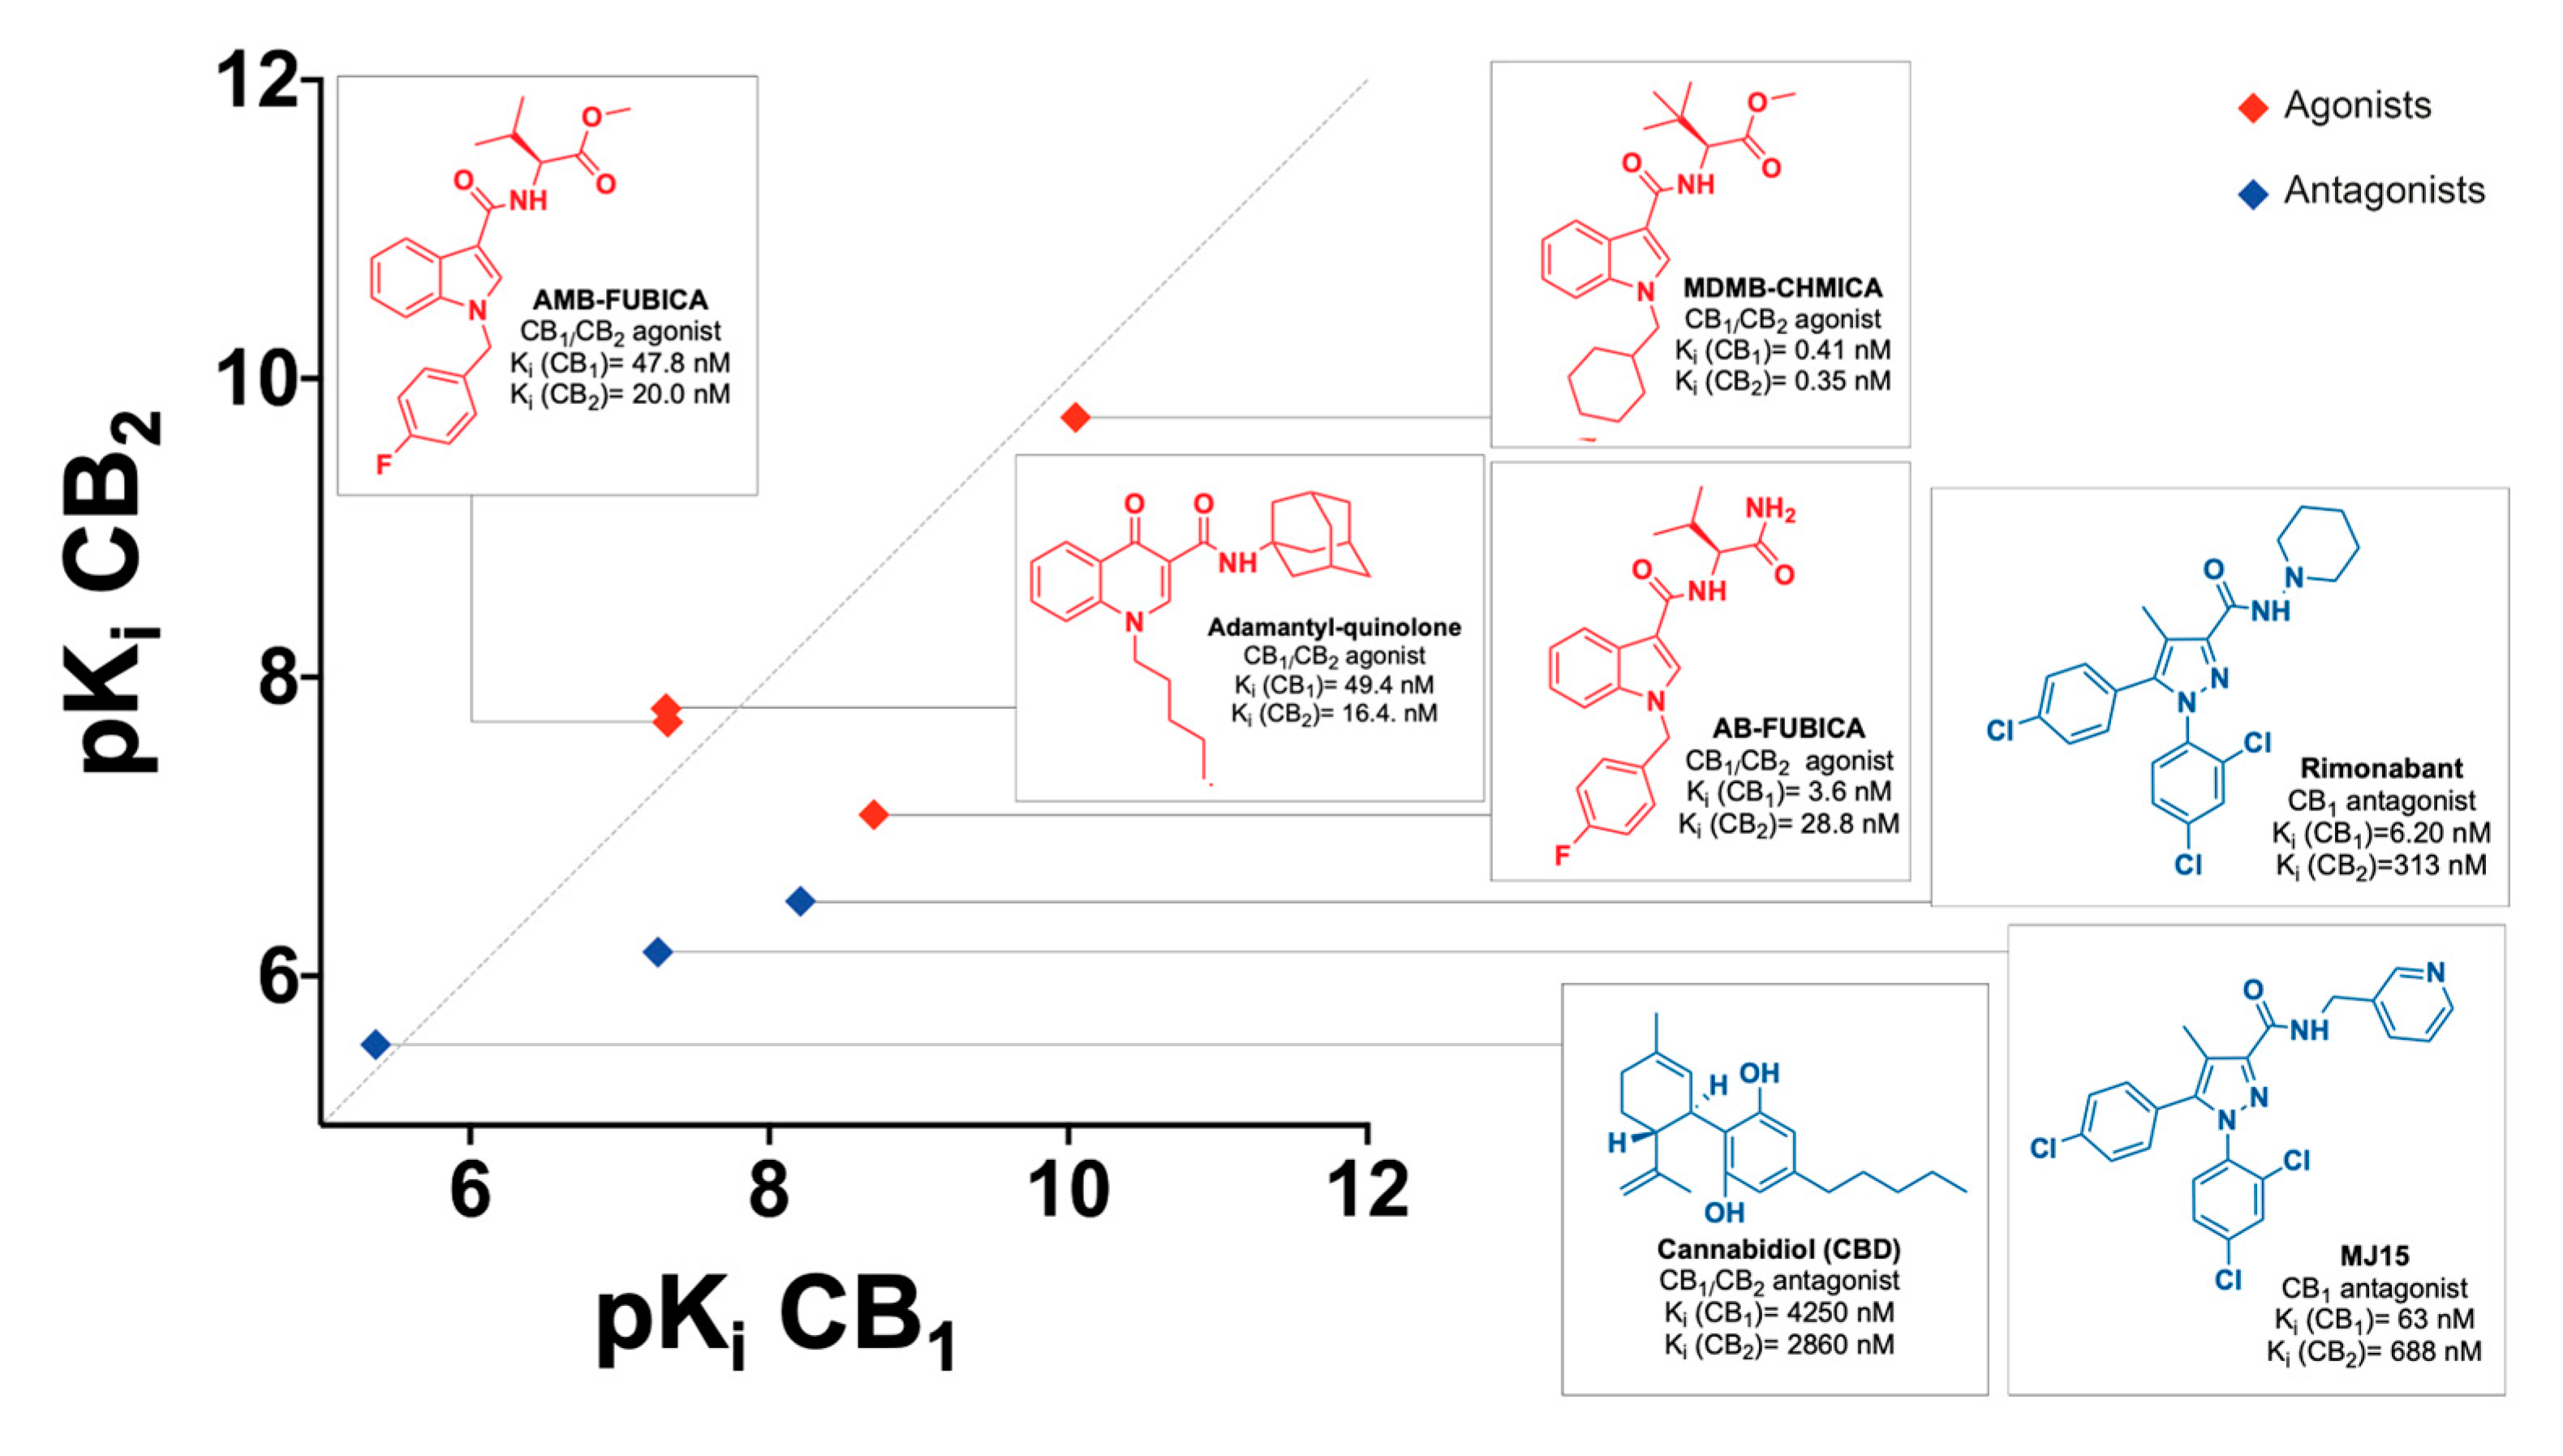
4.1. CELT-335 and Reference Compounds Used for Assay Validation
4.2. Radioligand Binding Assay
4.2.1. Competition Binding in Human CB1R
4.2.2. Competition Binding in Human CB2R
4.3. Tag-Lite® Saturation and Competition Binding Assays
4.3.1. Statistical Analysis and Curve Fitting
4.3.2. Tag-Lite® Saturation and Competition Binding Assays in Living Cells Expressing CB1R
Expression Vector
Cell Culture and Transfection
Labeling of Cells Expressing SNAP-Tagged CB1R
Competition and Saturation Binding Assays
4.3.3. Tag-Lite® Saturation and Competition Binding Assays in Living Cells Expressing CB2R
Expression Vector
Cell Culture and Transient Transfection
Labeling of Cells Expressing SNAP-Tagged CB2R
Competition and Saturation Binding Assays
5. Conclusions
Author Contributions
Funding
Institutional Review Board Statement
Informed Consent Statement
Data Availability Statement
Acknowledgments
Conflicts of Interest
References
- Lu, H.C.; MacKie, K. An Introduction to the Endogenous Cannabinoid System; Elsevier: Amsterdam, The Netherlands, 2016; Volume 79, ISBN 8128567187. [Google Scholar]
- Ajalin, R.M.; Al-Abdulrasul, H.; Tuisku, J.M.; Hirvonen, J.E.S.; Vahlberg, T.; Lahdenpohja, S.; Rinne, J.O.; Brück, A.E. Cannabinoid Receptor Type 1 in Parkinson’s Disease: A Positron Emission Tomography Study with [18F]FMPEP-D2. Mov. Disord. 2022, 37, 1673–1682. [Google Scholar] [CrossRef]
- Kibret, B.G.; Ishiguro, H.; Horiuchi, Y.; Onaivi, E.S. New Insights and Potential Therapeutic Targeting of CB2 Cannabinoid Receptors in CNS Disorders. Int. J. Mol. Sci. 2022, 23, 975. [Google Scholar] [CrossRef]
- Hinz, B.; Ramer, R. Cannabinoids as Anticancer Drugs: Current Status of Preclinical Research. Br. J. Cancer 2022, 127, 1–13. [Google Scholar] [CrossRef]
- Hua, T.; Vemuri, K.; Pu, M.; Qu, L.; Han, G.W.; Wu, Y.; Zhao, S.; Shui, W.; Li, S.; Korde, A.; et al. Crystal Structure of the Human Cannabinoid Receptor CB1. Cell 2016, 167, 750–762.e14. [Google Scholar] [CrossRef]
- Li, X.; Hua, T.; Vemuri, K.; Ho, J.H.; Wu, Y.; Wu, L.; Popov, P.; Benchama, O.; Zvonok, N.; Locke, K.; et al. Crystal Structure of the Human Cannabinoid Receptor CB2. Cell 2019, 176, 459–467.e13. [Google Scholar] [CrossRef]
- An, D.; Peigneur, S.; Hendrickx, L.A.; Tytgat, J. Targeting Cannabinoid Receptors: Current Status and Prospects of Natural Products. Int. J. Mol. Sci. 2020, 21, 5064. [Google Scholar] [CrossRef]
- Lu, D.; Immadi, S.S.; Wu, Z.; Kendall, D.A. Translational Potential of Allosteric Modulators Targeting the Cannabinoid CB1 Receptor. Acta Pharmacol. Sin. 2019, 40, 324–335. [Google Scholar] [CrossRef]
- Gado, F.; Di Cesare Mannelli, L.; Lucarini, E.; Bertini, S.; Cappelli, E.; Digiacomo, M.; Stevenson, L.A.; Macchia, M.; Tuccinardi, T.; Ghelardini, C.; et al. Identification of the First Synthetic Allosteric Modulator of the CB2 Receptors and Evidence of Its Efficacy for Neuropathic Pain Relief. J. Med. Chem. 2019, 62, 276–287. [Google Scholar] [CrossRef]
- Devane, W.A.; Dysarz, F.A., 3rd; Johnson, M.R.; Melvin, L.S.; Howlett, A.C. Determination and Characterization of a Cannabinoid Receptor in Rat Brain. Mol. Pharmacol. 1988, 34, 605–613. [Google Scholar]
- Adams, A.J.; Banister, S.D.; Irizarry, L.; Trecki, J.; Schwartz, M.; Gerona, R. “Zombie” Outbreak Caused by the Synthetic Cannabinoid AMB-FUBINACA in New York. N. Engl. J. Med. 2017, 376, 235–242. [Google Scholar] [CrossRef]
- Rosado, T.; Gonçalves, J.; Luís, Â.; Malaca, S.; Soares, S.; Vieira, D.N.; Barroso, M.; Gallardo, E. Synthetic Cannabinoids in Biological Specimens: A Review of Current Analytical Methods and Sample Preparation Techniques. Bioanalysis 2018, 10, 1609–1623. [Google Scholar] [CrossRef]
- Showalter, V.M.; Compton, D.R.; Martin, B.R.; Abood, M.E. Evaluation of Binding in a Transfected Cell Line Expressing a Peripheral Cannabinoid Receptor (CB2): Identification of Cannabinoid Receptor Subtype Selective Ligands. J. Pharmacol. Exp. Ther. 1996, 278, 989–999. [Google Scholar]
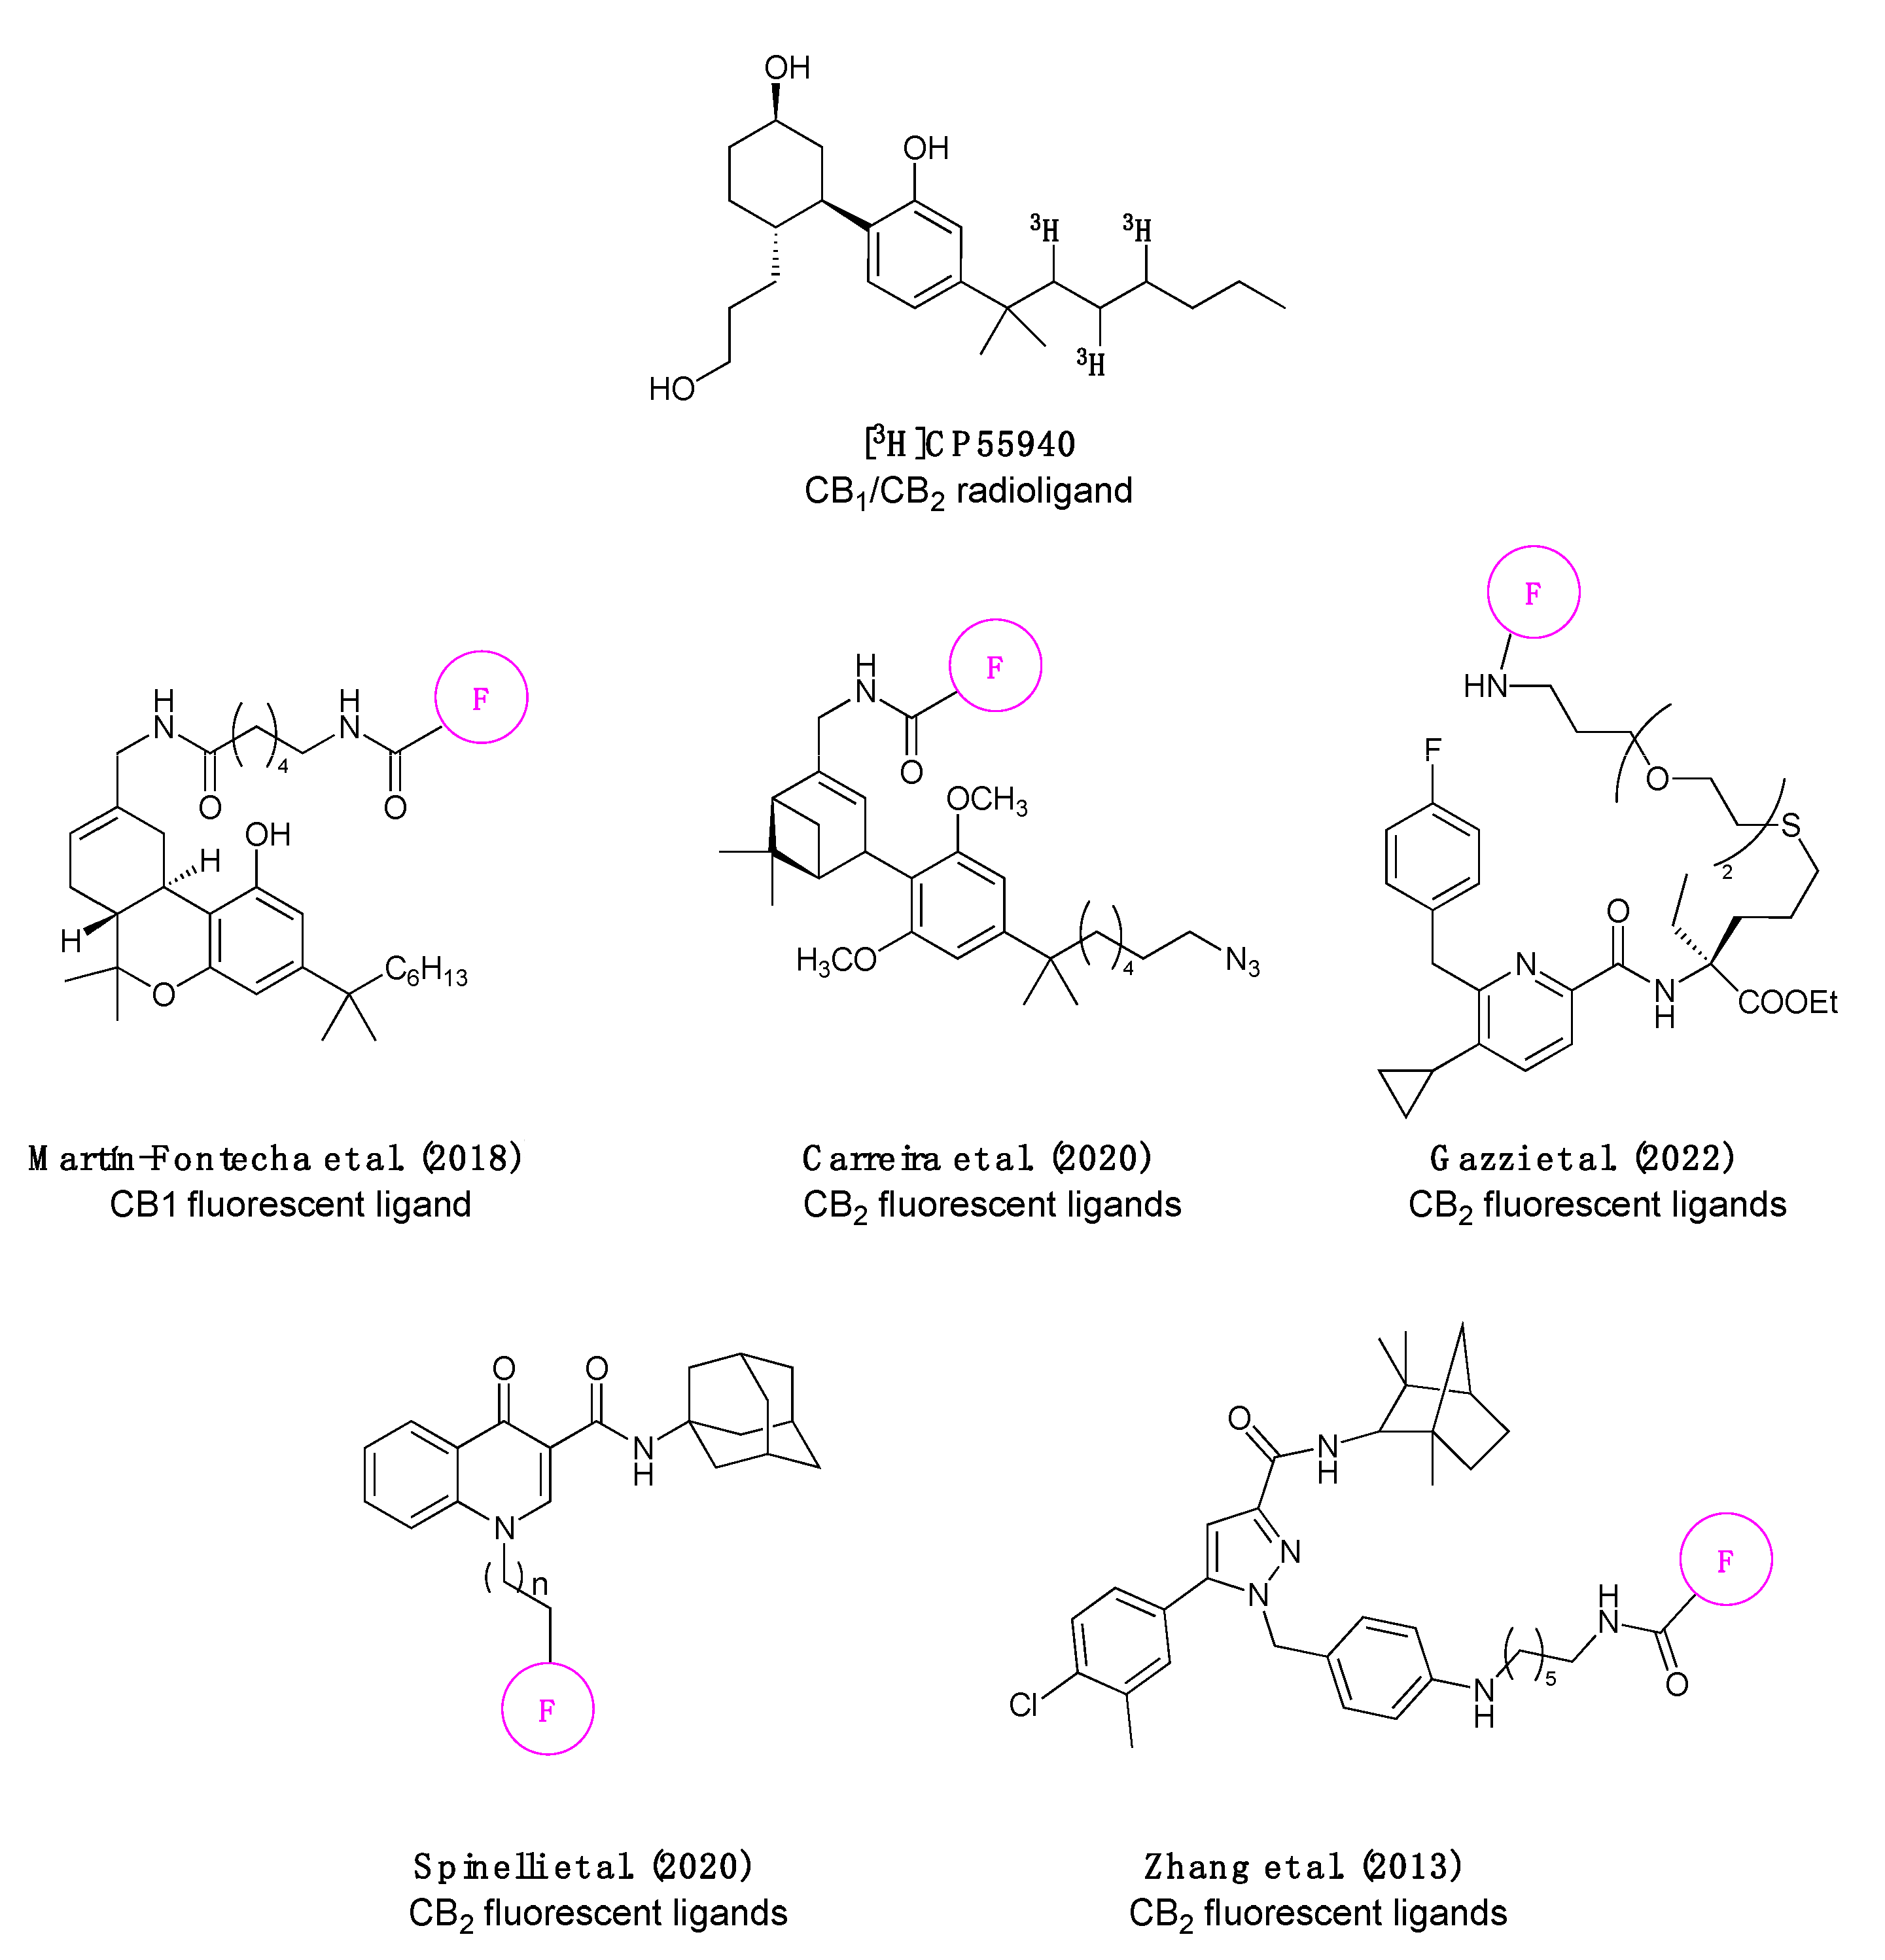
- Martín-Fontecha, M.; Angelina, A.; Rückert, B.; Rueda-Zubiaurre, A.; Martín-Cruz, L.; Van De Veen, W.; Akdis, M.; Ortega-Gutiérrez, S.; López-Rodríguez, M.L.; Akdis, C.A.; et al. A Fluorescent Probe to Unravel Functional Features of Cannabinoid Receptor CB1 in Human Blood and Tonsil Immune System Cells. Bioconjug. Chem. 2018, 29, 382–389. [Google Scholar] [CrossRef] [PubMed]
- Carreira, E.M.; Grether, U.; Sarott, R.C.; Westphal, M.V.; Pfaff, P.; Korn, C.; Sykes, D.A.; Gazzi, T.; Brennecke, B.; Atz, K.; et al. Development of High-Specificity Fluorescent Probes to Enable Cannabinoid Type 2 Receptor Studies in Living Cells. J. Am. Chem. Soc. 2020, 142, 16953–16964. [Google Scholar] [CrossRef]
- Gazzi, T.; Brennecke, B.; Atz, K.; Korn, C.; Sykes, D.; Forn-Cuni, G.; Pfaff, P.; Sarott, R.C.; Westphal, M.V.; Mostinski, Y.; et al. Detection of Cannabinoid Receptor Type 2 in Native Cells and Zebrafish with a Highly Potent, Cell-Permeable Fluorescent Probe. Chem. Sci. 2022, 13, 5539–5545. [Google Scholar] [CrossRef] [PubMed]
- Spinelli, F.; Giampietro, R.; Stefanachi, A.; Riganti, C.; Kopecka, J.; Abatematteo, F.S.; Leonetti, F.; Colabufo, N.A.; Mangiatordi, G.F.; Nicolotti, O.; et al. Design and Synthesis of Fluorescent Ligands for the Detection of Cannabinoid Type 2 Receptor (CB2R). Eur. J. Med. Chem. 2020, 188, 112037. [Google Scholar] [CrossRef] [PubMed]
- Zhang, S.; Shao, P.; Bai, M. In Vivo Type 2 Cannabinoid Receptor-Targeted Tumor Optical Imaging Using a near Infrared Fluorescent Probe. Bioconjug. Chem. 2013, 24, 1907–1916. [Google Scholar] [CrossRef] [PubMed]
- Cooper, A.G.; Oyagawa, C.R.M.; Manning, J.J.; Singh, S.; Hook, S.; Grimsey, N.L.; Glass, M.; Tyndall, J.D.A.; Vernall, A.J. Development of Selective, Fluorescent Cannabinoid Type 2 Receptor Ligands Based on a 1,8-Naphthyridin-2-(1: H)-One-3-Carboxamide Scaffold. Medchemcomm 2018, 9, 2055–2067. [Google Scholar] [CrossRef] [PubMed]
- Morrison, L.E. Time-Resolved Detection of Energy Transfer: Theory and Application to Immunoassays. Anal. Biochem. 1988, 174, 101–120. [Google Scholar] [CrossRef]
- Mathis, G. Probing Molecular Interactions with Homogeneous Techniques Based on Rare Earth Cryptates and Fluorescence Energy Transfer. Clin. Chem. 1995, 41, 1391–1397. [Google Scholar] [CrossRef]
- Selvin, P.R. Principles and Biophysical Applications of Lanthanide-Based Probes. Annu. Rev. Biophys. Biomol. Struct. 2002, 31, 275–302. [Google Scholar] [CrossRef] [PubMed]
- Barnoin, G.; Shaya, J.; Richert, L.; Le, H.N.; Vincent, S.; Guérineau, V.; Mély, Y.; Michel, B.Y.; Burger, A. Intermolecular Dark Resonance Energy Transfer (DRET): Upgrading Fluorogenic DNA Sensing. Nucleic Acids Res. 2021, 49, e72. [Google Scholar] [CrossRef] [PubMed]
- Degorce, F.; Card, A.; Soh, S.; Trinquet, E.; Knapik, G.P.; Xie, B. HTRF: A Technology Tailored for Drug Discovery—A Review of Theoreti- Cal Aspects and Recent Applications. Curr. Chem. Genom. 2009, 3, 22–32. [Google Scholar] [CrossRef]
- Payne, N.C.; Kalyakina, A.S.; Singh, K.; Tye, M.A.; Mazitschek, R. Bright and Stable Luminescent Probes for Target Engagement Profiling in Live Cells. Nat. Chem. Biol. 2021, 17, 1168–1177. [Google Scholar] [CrossRef]
- Keppler, A.; Gendreizig, S.; Gronemeyer, T.; Pick, H.; Vogel, H.; Johnsson, K. A General Method for the Covalent Labeling of Fusion Proteins with Small Molecules in Vivo. Nat. Biotechnol. 2003, 21, 86–89. [Google Scholar] [CrossRef]
- Gronemeyer, T.; Chidley, C.; Juillerat, A.; Heinis, C.; Johnsson, K. Directed Evolution of O6-Alkylguanine-DNA Alkyltransferase for Applications in Protein Labeling. Protein Eng. Des. Sel. 2006, 19, 309–316. [Google Scholar] [CrossRef]
- Maurel, D.; Comps-Agrar, L.; Brock, C.; Rives, M.L.; Bourrier, E.; Ayoub, M.A.; Bazin, H.; Tinel, N.; Durroux, T.; Prézeau, L.; et al. Cell-Surface Protein-Protein Interaction Analysis with Time-Resolved FRET and Snap-Tag Technologies: Application to GPCR Oligomerization. Nat. Methods 2008, 5, 561–567. [Google Scholar] [CrossRef] [PubMed]
- Zwier, J.M.; Roux, T.; Cottet, M.; Durroux, T.; Douzon, S.; Bdioui, S.; Gregor, N.; Bourrier, E.; Oueslati, N.; Nicolas, L.; et al. A Fluorescent Ligand-Binding Alternative Using Tag-Lite Technology. J. Biomol. Screen. 2010, 15, 1248–1259. [Google Scholar] [CrossRef]
- Fulp, A.; Zhang, Y.; Bortoff, K.; Seltzman, H.; Snyder, R.; Wiethe, R.; Amato, G.; Maitra, R. Bioorganic and Medicinal Chemistry Pyrazole Antagonists of the CB1 Receptor with Reduced Brain Penetration. Bioorg Med. Chem. 2016, 24, 1063–1070. [Google Scholar] [CrossRef]
- Schoeder, C.T.; Hess, C.; Madea, B.; Meiler, J.; Müller, C.E. Pharmacological Evaluation of New Constituents of “Spice”: Synthetic Cannabinoids Based on Indole, Indazole, Benzimidazole and Carbazole Scaffolds. Forensic Toxicol. 2018, 36, 385–403. [Google Scholar] [CrossRef]
- Stern, E.; Muccioli, G.G.; Millet, R.; Goossens, J.-F.; Farce, A.; Chavatte, P.; Poupaert, J.H.; Lambert, D.M.; Depreux, P.; Hénichart, J.-P. Novel 4-Oxo-1,4-Dihydroquinoline-3-Carboxamide Derivatives as New CB2 Cannabinoid Receptors Agonists: Synthesis, Pharmacological Properties and Molecular Modeling. J. Med. Chem. 2006, 49, 70–79. [Google Scholar] [CrossRef]
- Francisco, M.E.Y.; Seltzman, H.H.; Gilliam, A.F.; Mitchell, R.A.; Rider, S.L.; Pertwee, R.G.; Stevenson, L.A.; Thomas, B.F. Synthesis and Structure-Activity Relationships of Amide and Hydrazide Analogues of the Cannabinoid CB1 Receptor Antagonist N-(Piperidinyl)-5-(4-Chlorophenyl)-1-(2,4-Dichlorophenyl)-4-Methyl-1H-Pyrazole-3-Carboxamide (SR141716). J. Med. Chem. 2002, 45, 2708–2719. [Google Scholar] [CrossRef]
- Banister, S.D.; Longworth, M.; Kevin, R.; Sachdev, S.; Santiago, M.; Stuart, J.; Mack, J.B.C.; Glass, M.; McGregor, I.S.; Connor, M.; et al. Pharmacology of Valinate and Tert-Leucinate Synthetic Cannabinoids 5F-AMBICA, 5F-AMB, 5F-ADB, AMB-FUBINACA, MDMB-FUBINACA, MDMB-CHMICA, and Their Analogues. ACS Chem. Neurosci. 2016, 7, 1241–1254. [Google Scholar] [CrossRef] [PubMed]
- Banister, S.D.; Moir, M.; Stuart, J.; Kevin, R.C.; Wood, K.E.; Longworth, M.; Wilkinson, S.M.; Beinat, C.; Buchanan, A.S.; Glass, M.; et al. Pharmacology of Indole and Indazole Synthetic Cannabinoid Designer Drugs AB-FUBINACA, ADB-FUBINACA, AB-PINACA, ADB-PINACA, 5F-AB-PINACA, 5F-ADB-PINACA, ADBICA, and 5F-ADBICA. ACS Chem. Neurosci. 2015, 6, 1546–1559. [Google Scholar] [CrossRef]
- Navarro, G.; Cordomí, A.; Brugarolas, M.; Moreno, E.; Aguinaga, D.; Pérez-Benito, L.; Ferre, S.; Cortés, A.; Casadó, V.; Mallol, J.; et al. Cross-Communication between Gi and Gs in a G-Protein-Coupled Receptor Heterotetramer Guided by a Receptor C-Terminal Domain. BMC Biol. 2018, 16, 24. [Google Scholar] [CrossRef] [PubMed]
- Reddy, V.; Grogan, D.; Ahluwalia, M.; Salles, É.L.; Ahluwalia, P.; Khodadadi, H.; Alverson, K.; Nguyen, A.; Raju, S.P.; Gaur, P.; et al. Targeting the Endocannabinoid System: A Predictive, Preventive, and Personalized Medicine-Directed Approach to the Management of Brain Pathologies. EPMA J. 2020, 11, 217–250. [Google Scholar] [CrossRef] [PubMed]
- Pisanti, S.; Picardi, P.; D’Alessandro, A.; Laezza, C.; Bifulco, M. The Endocannabinoid Signaling System in Cancer. Trends Pharmacol. Sci. 2013, 34, 273–282. [Google Scholar] [CrossRef] [PubMed]
- National Center for Biotechnology Information. PubChem Compound Summary for CID 16078, Dronabinol. Available online: https://pubchem.ncbi.nlm.nih.gov/compound/dronabinol (accessed on 4 July 2022).
- National Center for Biotechnology Information. PubChem Compound Summary for CID 5284592, Nabilone. Available online: https://pubchem.ncbi.nlm.nih.gov/compound/nabilone (accessed on 4 July 2022).
- National Center for Biotechnology Information. PubChem Compound Summary for CID 44148067, Sativex. Available online: https://pubchem.ncbi.nlm.nih.gov/compound/sativex (accessed on 4 July 2022).


| pKi 1 | pKd 2 | |||
|---|---|---|---|---|
| CB1 3 | CB2 4 | CB1 5 | CB2 6 | |
| CELT-335 | 7.34 ± 0.11 | 8.13 ± 0.09 | 7.37 ± 0.06 | 7.62 ± 0.04 |
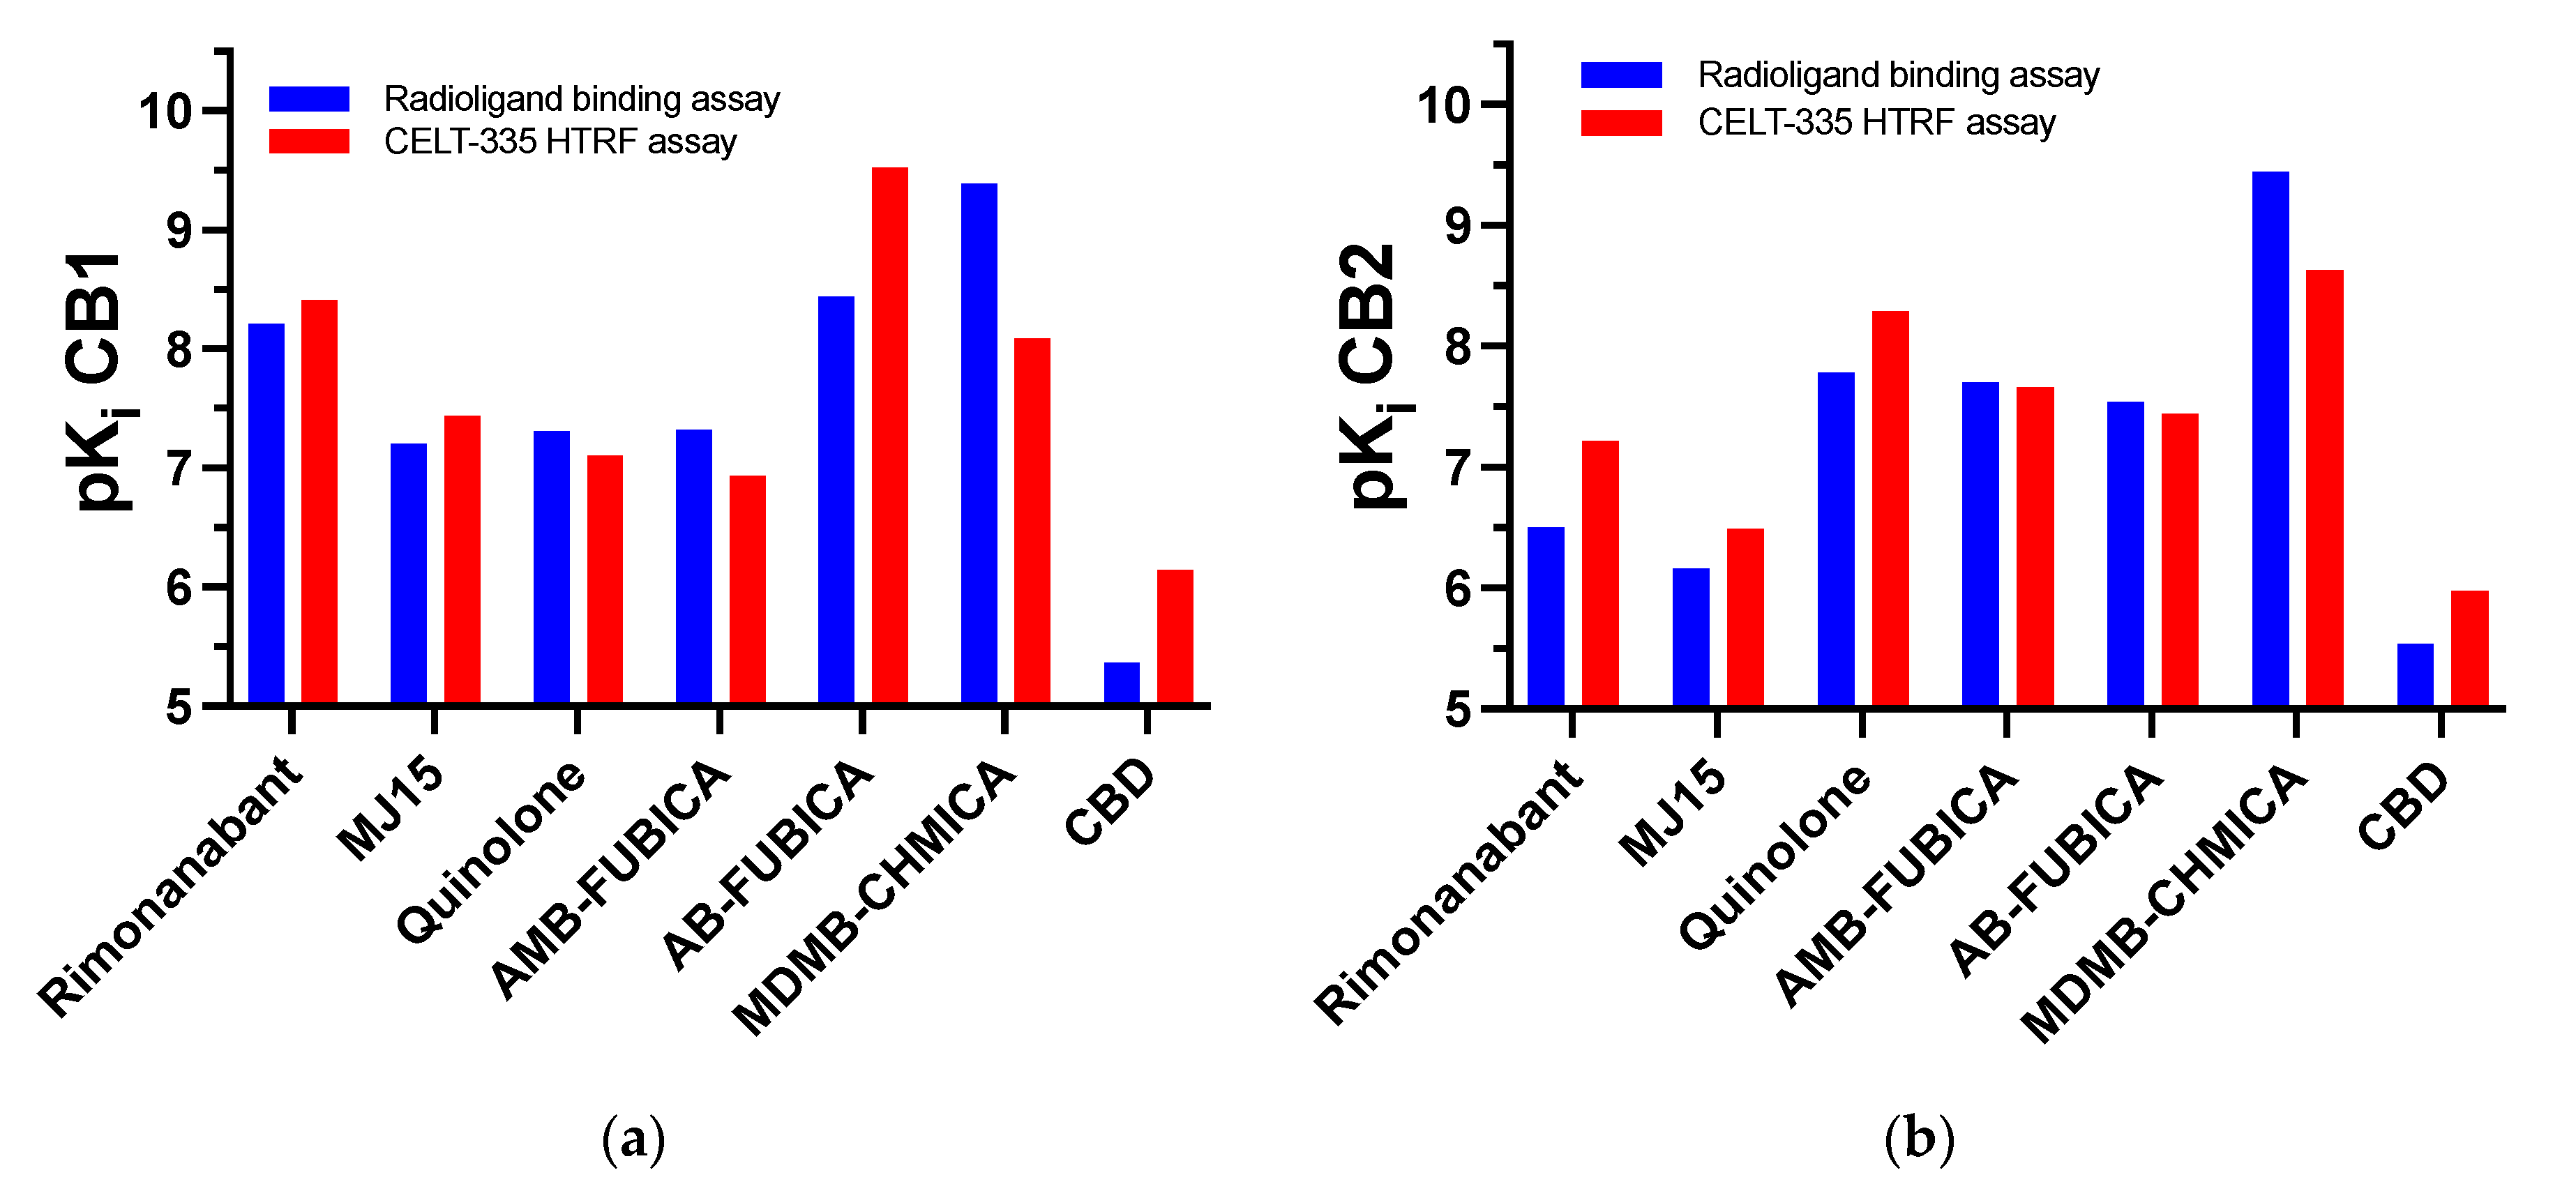
| Compound | Functional Activity | pKi CB1 | |
|---|---|---|---|
| Radioligand Binding | Tag-Lite® Binding (CELT-335) | ||
| Rimonabant | CB1 Antagonist | 8.21 [30] | 8.41 ± 0.07 |
| MJ15 | CB1 Antagonist | 7.20 ± 0.12 | 7.44 ± 0.08 |
| Adamantyl-quinolone | CB1/CB2 agonist | 7.31 ± 0.09 | 7.10 ± 0.08 |
| AMB-FUBICA | CB1/CB2 agonist | 7.32 ± 0.07 | 6.93 ± 0.13 |
| AB-FUBICA | CB1/CB2 agonist | 8.44 ± 0.11 | 9.52 ± 0.09 |
| MDMB-CHMICA | CB1/CB2 agonist | 9.38 [31] | 8.09 ± 0.11 |
| CBD | CB1/CB2 Antagonist | 5.37 [29] | 6.15 ± 0.13 |
| Compound | Functional Activity | pKi CB2 | |
|---|---|---|---|
| Radioligand Binding | Tag-Lite® Binding (CELT-335) | ||
| Rimonabant | CB1 Antagonist | 6.50 [30] | 7.22 ± 0.06 |
| MJ15 | CB1 Antagonist | 6.16 ± 0.07 | 6.49 ± 0.12 |
| Adamantyl-quinolone | CB1/CB2 agonist | 7.78 [32] | 8.29 ± 0.11 |
| AMB-FUBICA | CB1/CB2 agonist | 7.70 ± 0.08 | 7.66 ± 0.13 |
| AB-FUBICA | CB1/CB2 agonist | 7.54 ± 0.07 | 7.44 ± 0.11 |
| MDMB-CHMICA | CB1/CB2 agonist | 9.45 [30] | 8.63 ± 0.15 |
| CBD | CB1/CB2 Antagonist | 5.54 [30] | 5.98 ± 0.08 |
Disclaimer/Publisher’s Note: The statements, opinions and data contained in all publications are solely those of the individual author(s) and contributor(s) and not of MDPI and/or the editor(s). MDPI and/or the editor(s) disclaim responsibility for any injury to people or property resulting from any ideas, methods, instructions or products referred to in the content. |
© 2023 by the authors. Licensee MDPI, Basel, Switzerland. This article is an open access article distributed under the terms and conditions of the Creative Commons Attribution (CC BY) license (https://creativecommons.org/licenses/by/4.0/).
Share and Cite
Navarro, G.; Sotelo, E.; Raïch, I.; Loza, M.I.; Brea, J.; Majellaro, M. A Robust and Efficient FRET-Based Assay for Cannabinoid Receptor Ligands Discovery. Molecules 2023, 28, 8107. https://doi.org/10.3390/molecules28248107
Navarro G, Sotelo E, Raïch I, Loza MI, Brea J, Majellaro M. A Robust and Efficient FRET-Based Assay for Cannabinoid Receptor Ligands Discovery. Molecules. 2023; 28(24):8107. https://doi.org/10.3390/molecules28248107
Chicago/Turabian StyleNavarro, Gemma, Eddy Sotelo, Iu Raïch, María Isabel Loza, Jose Brea, and Maria Majellaro. 2023. "A Robust and Efficient FRET-Based Assay for Cannabinoid Receptor Ligands Discovery" Molecules 28, no. 24: 8107. https://doi.org/10.3390/molecules28248107
APA StyleNavarro, G., Sotelo, E., Raïch, I., Loza, M. I., Brea, J., & Majellaro, M. (2023). A Robust and Efficient FRET-Based Assay for Cannabinoid Receptor Ligands Discovery. Molecules, 28(24), 8107. https://doi.org/10.3390/molecules28248107