
Fatty Acid-Binding Proteins Identification during the Evolution of Metabolic Syndrome: A Raman Spectroscopy-Based Approach


 ,
, 
Abstract
:1. Introduction
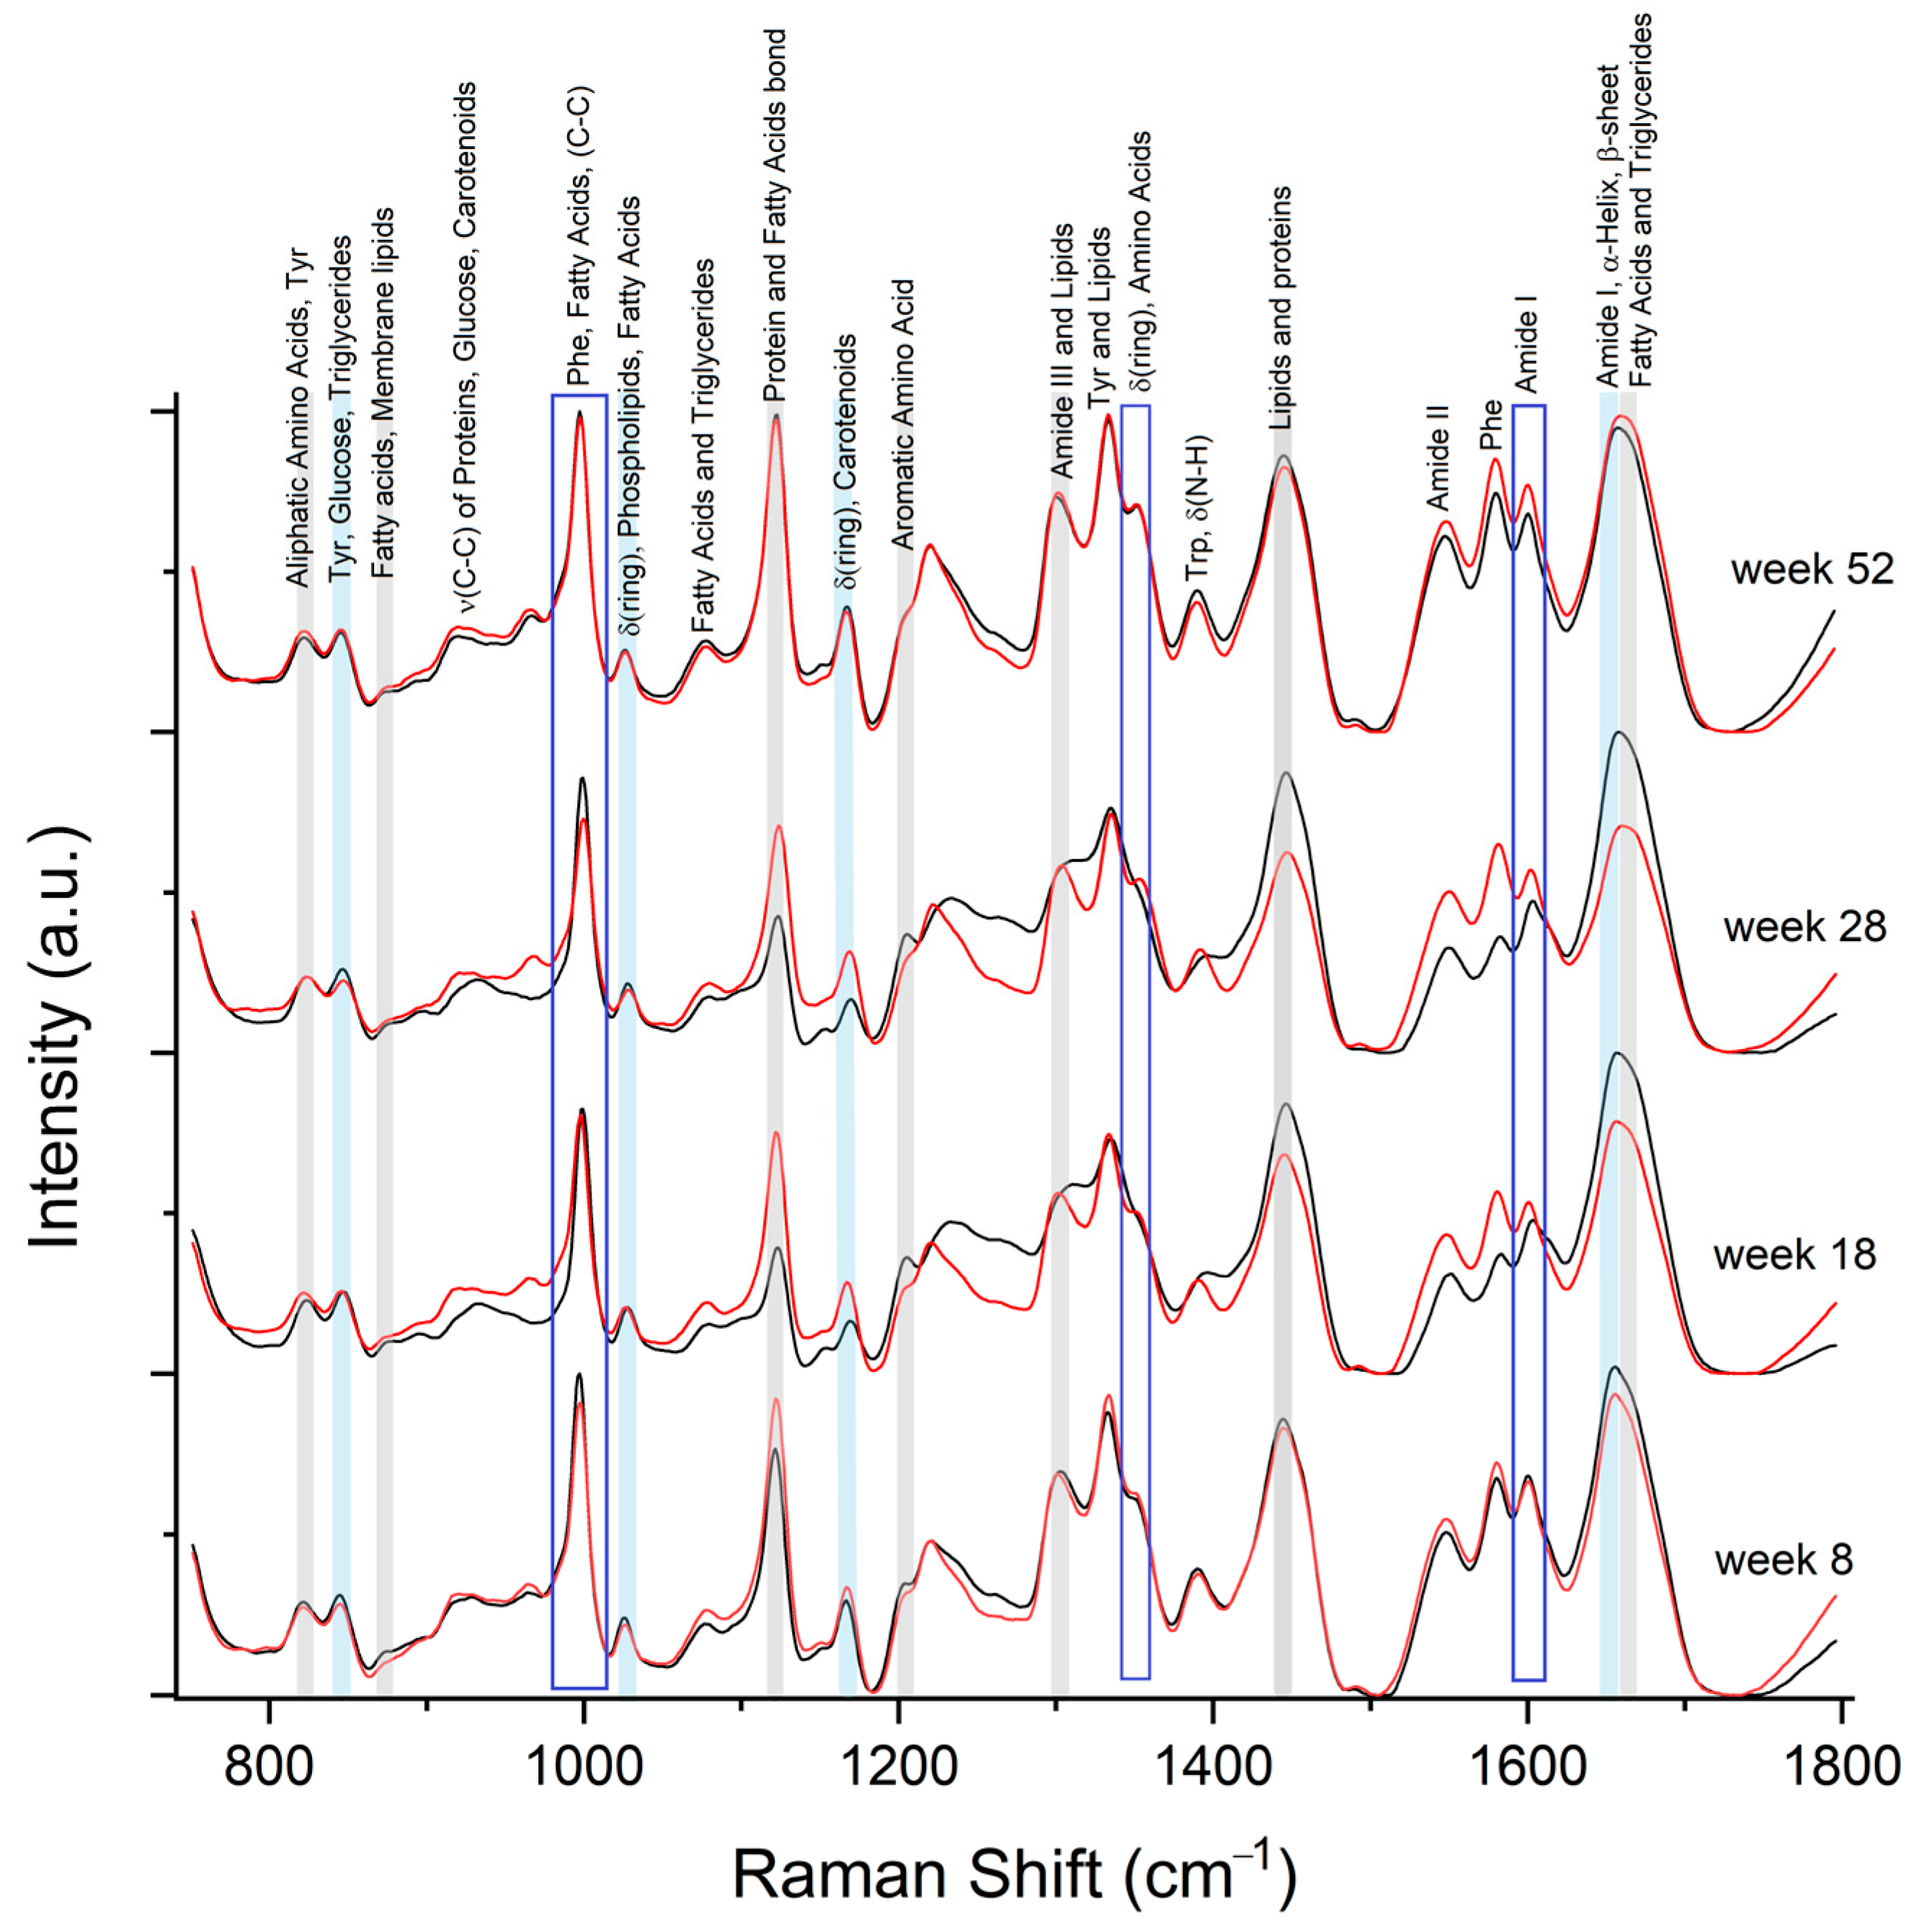
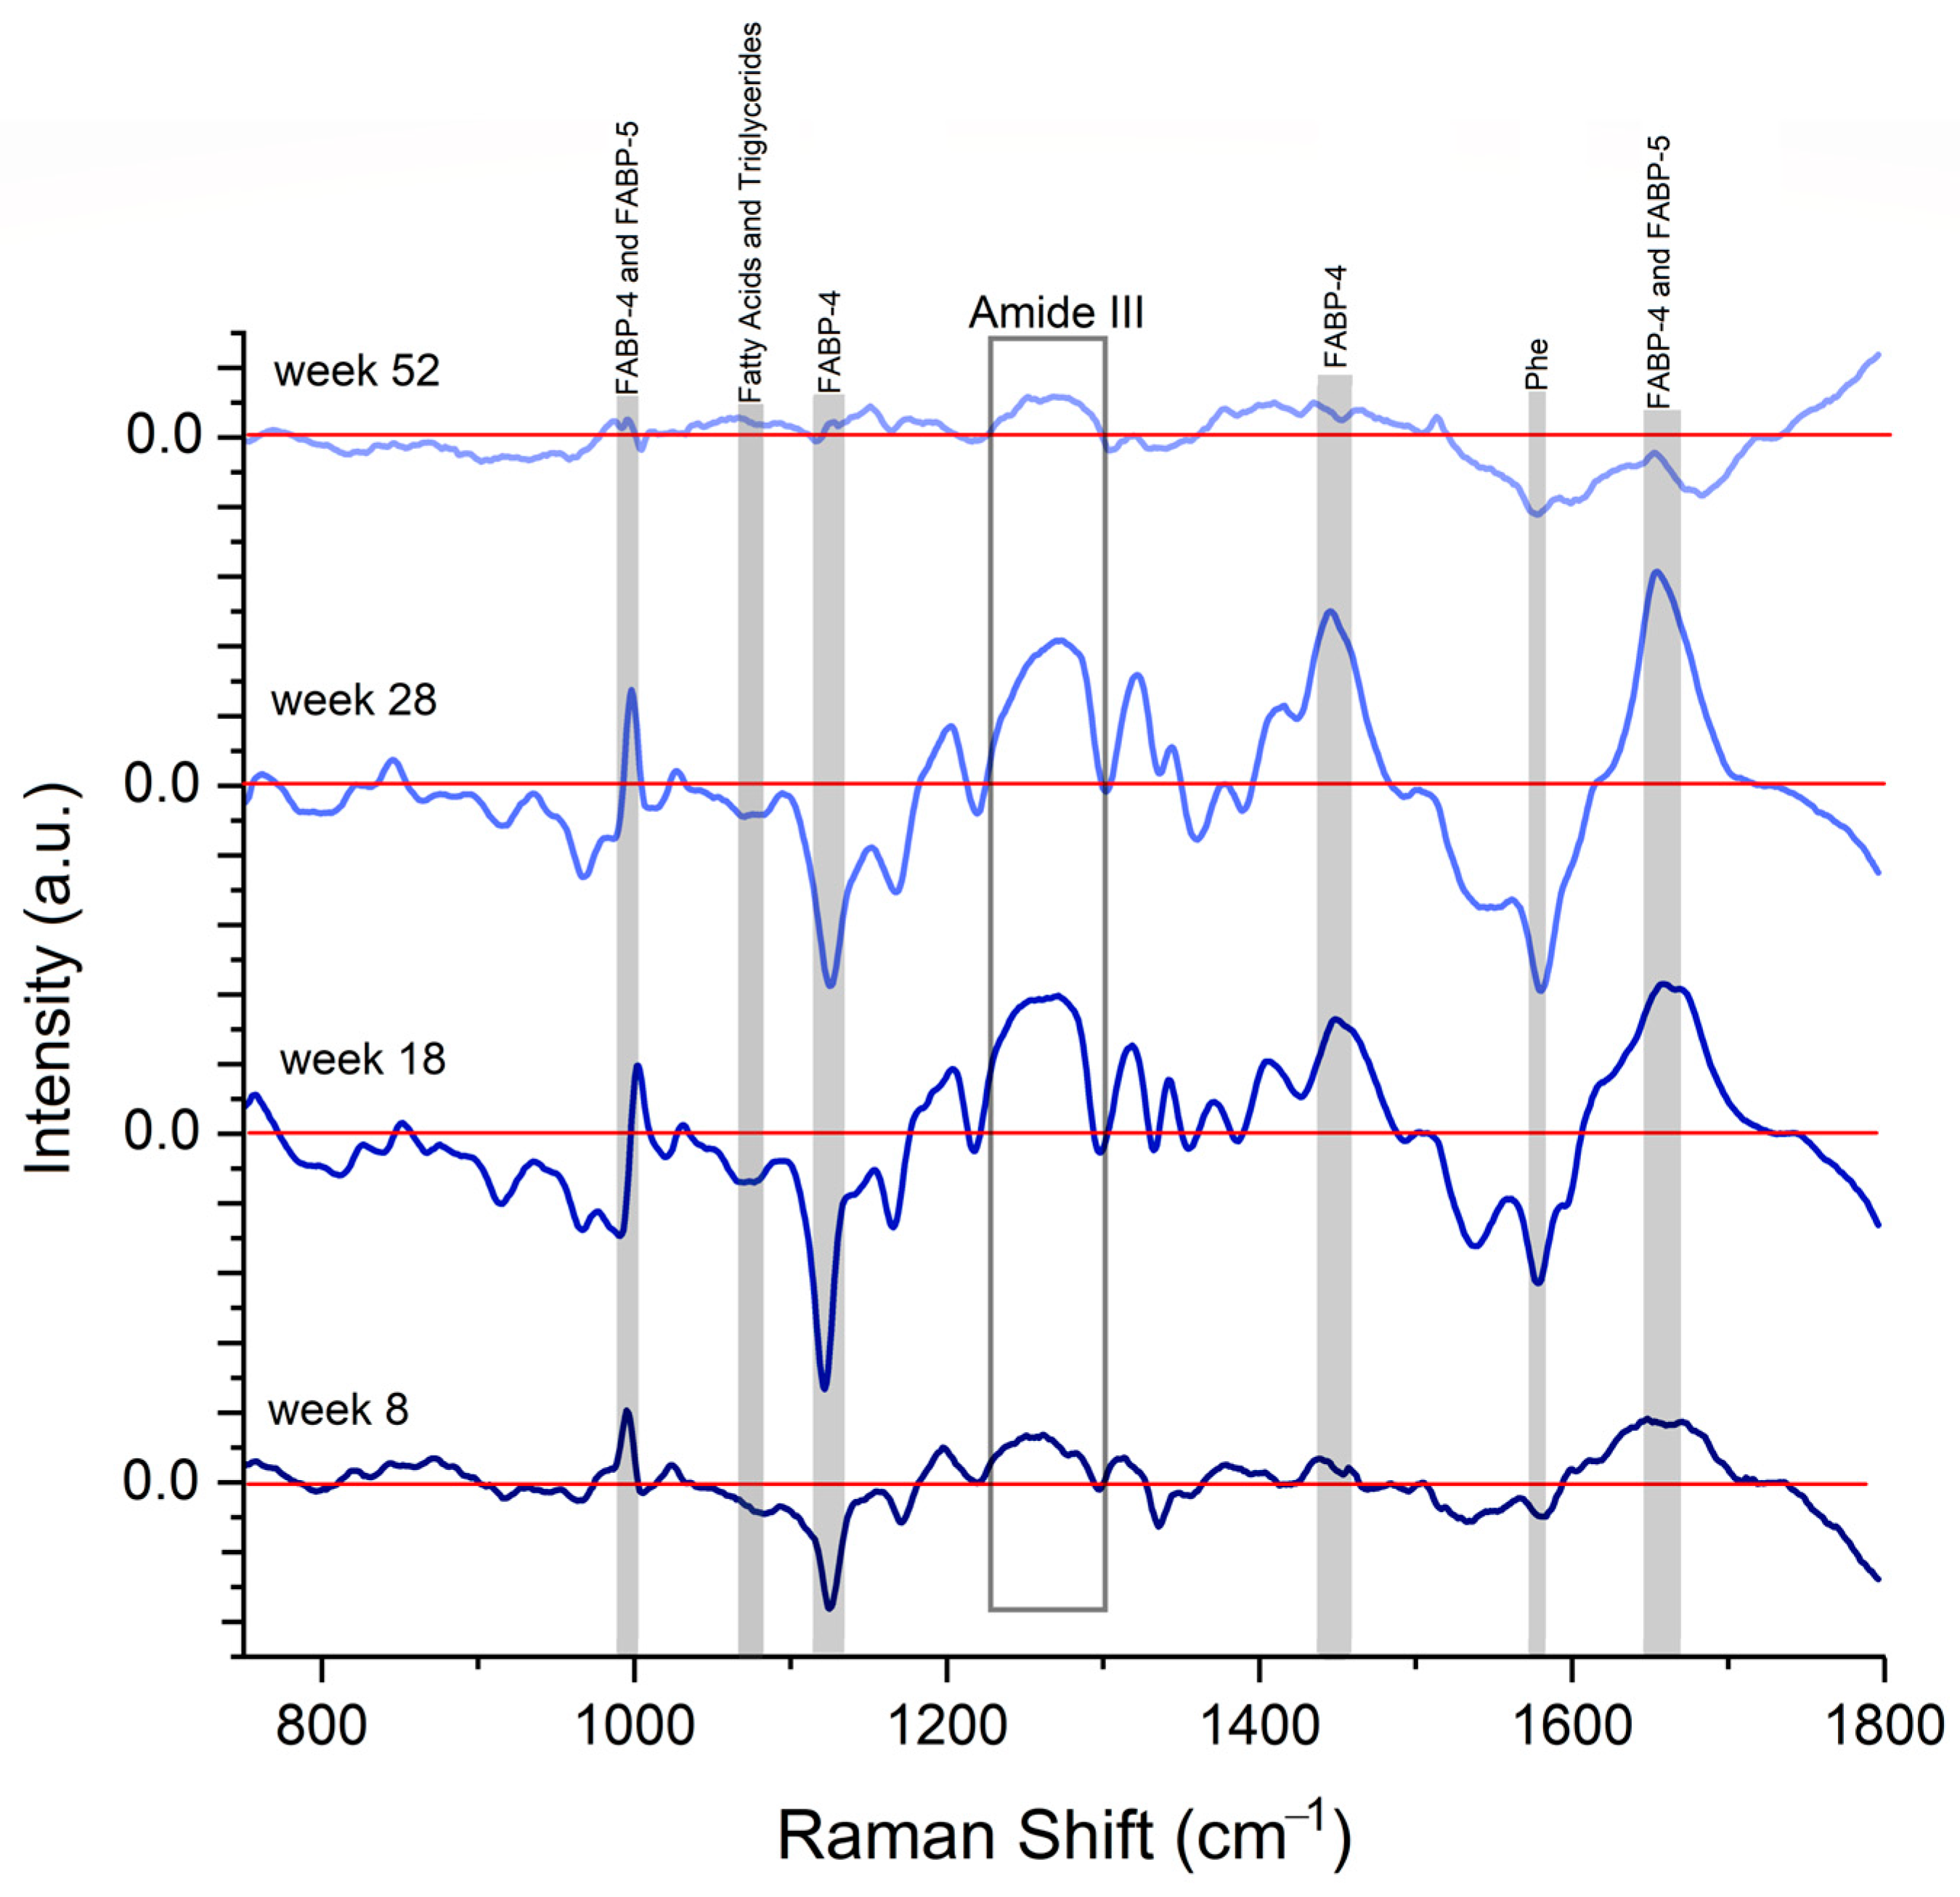
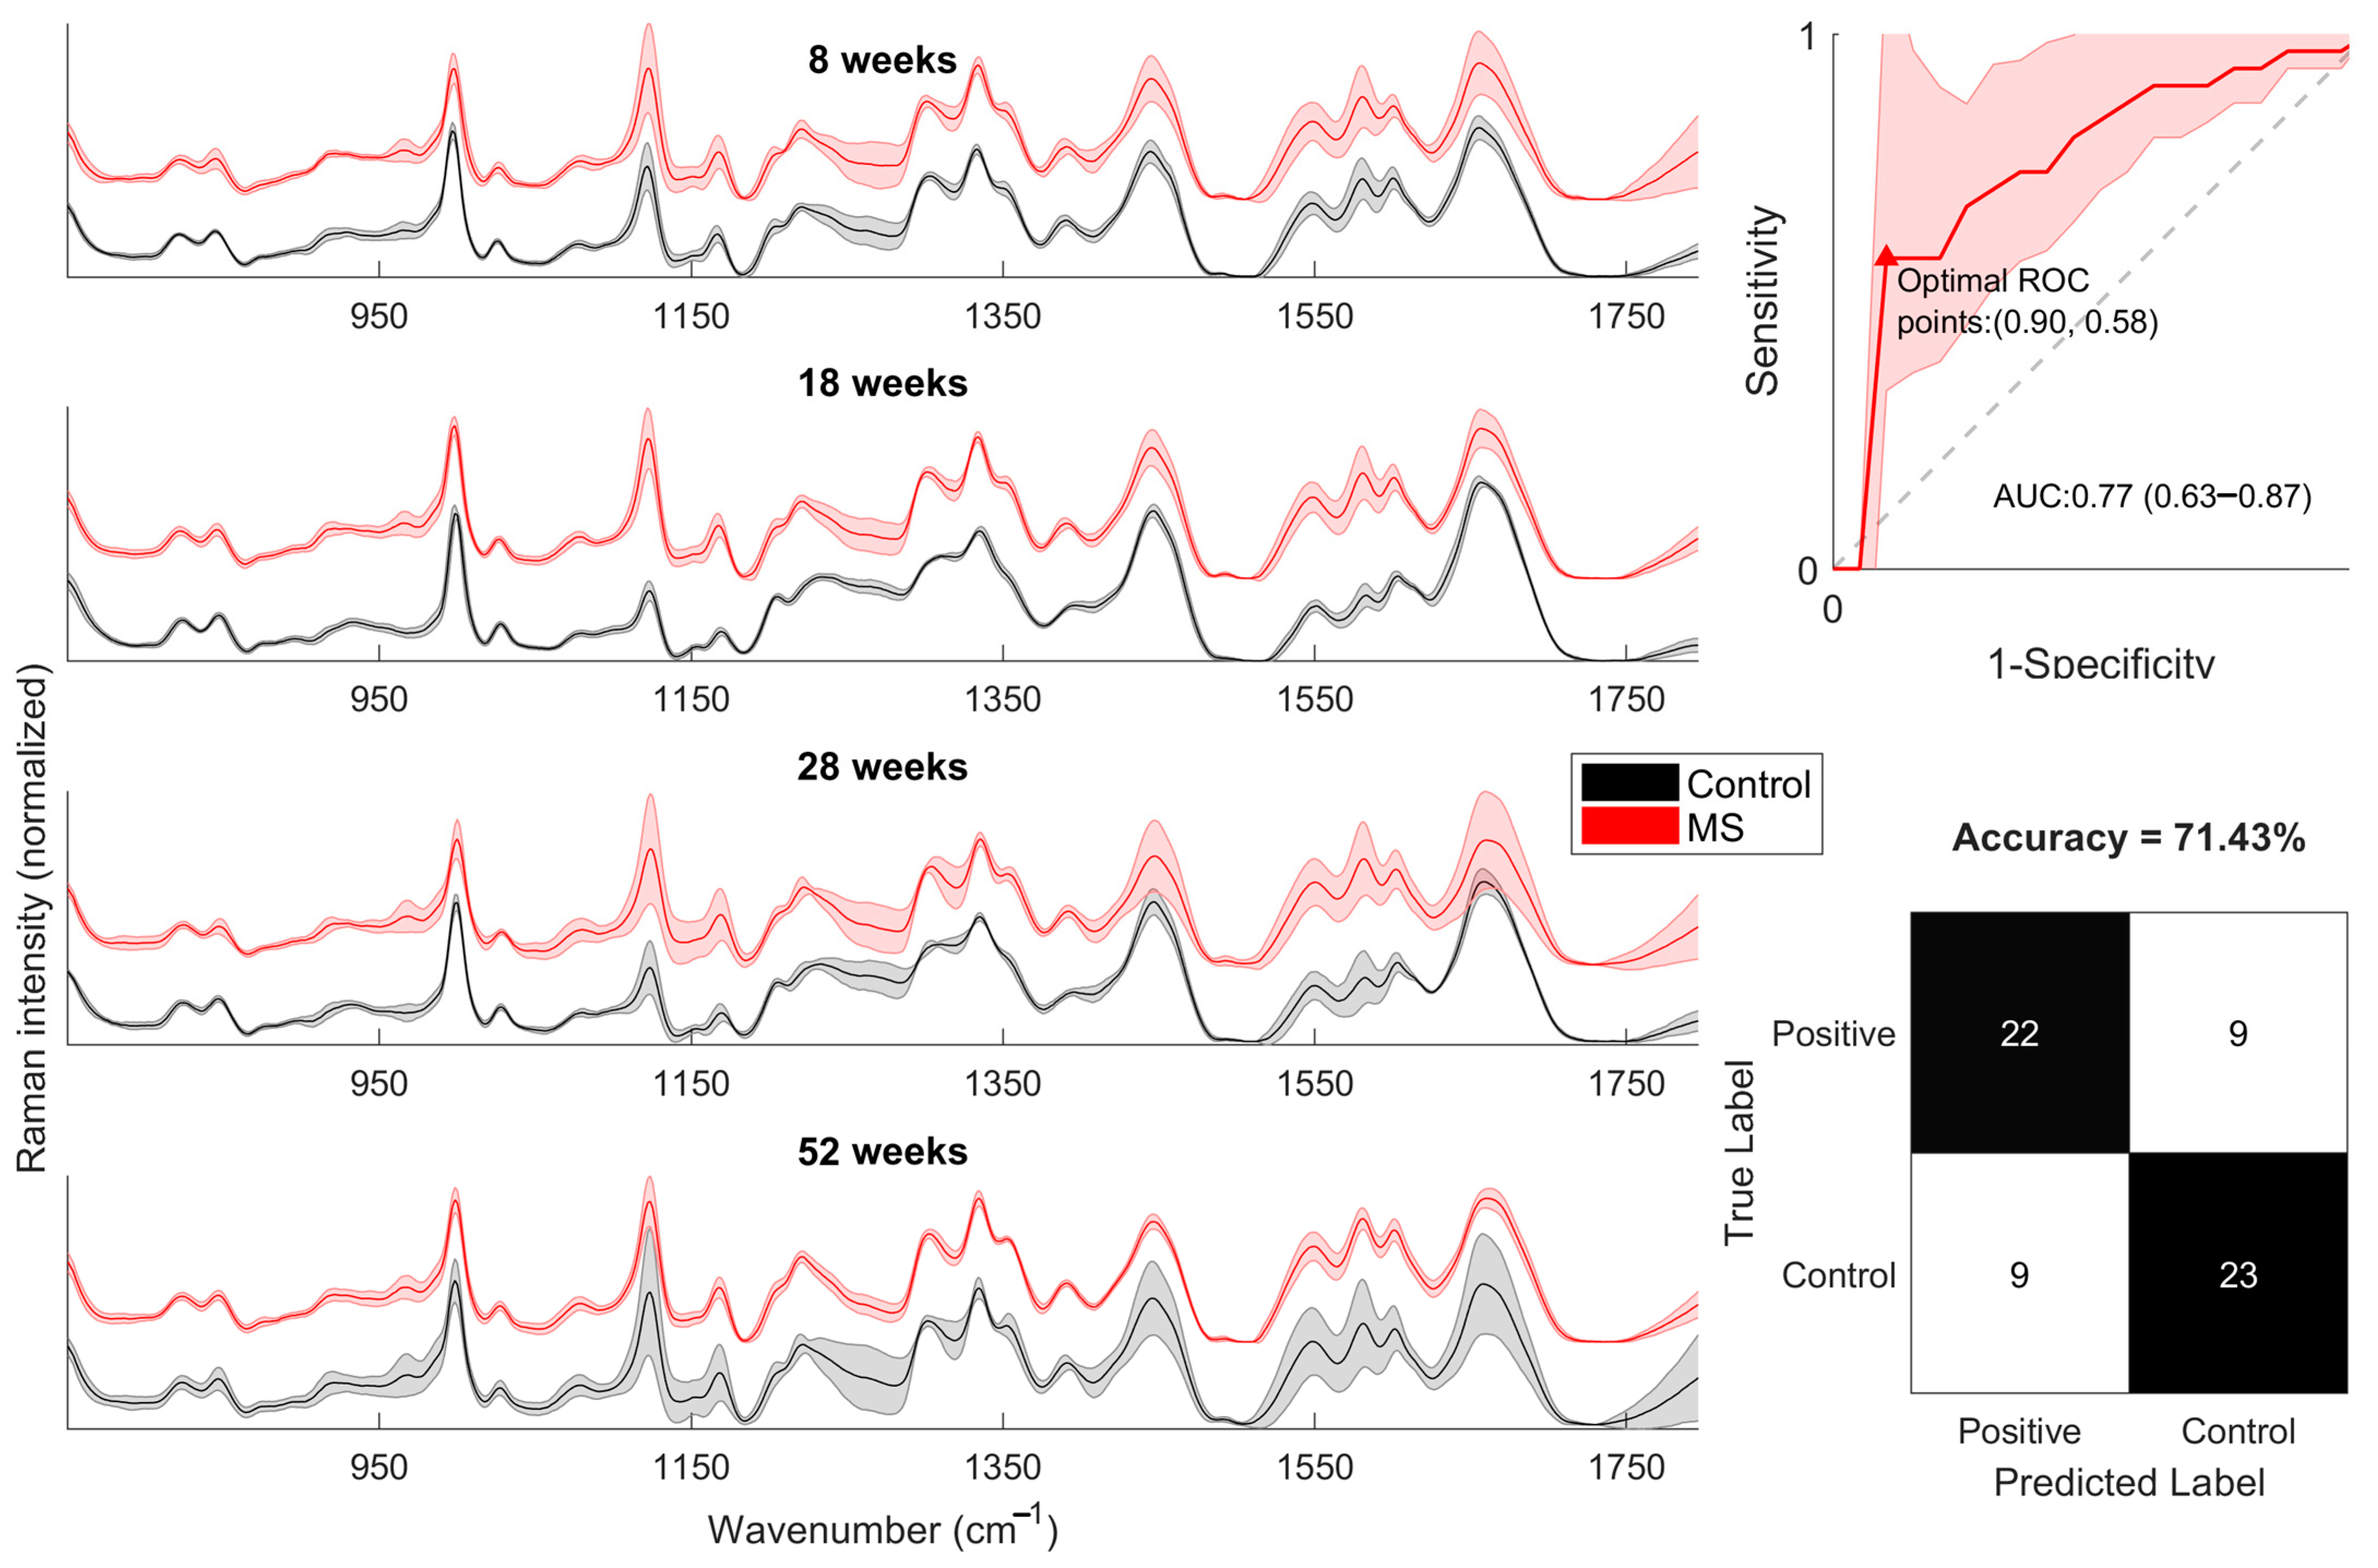
2. Results
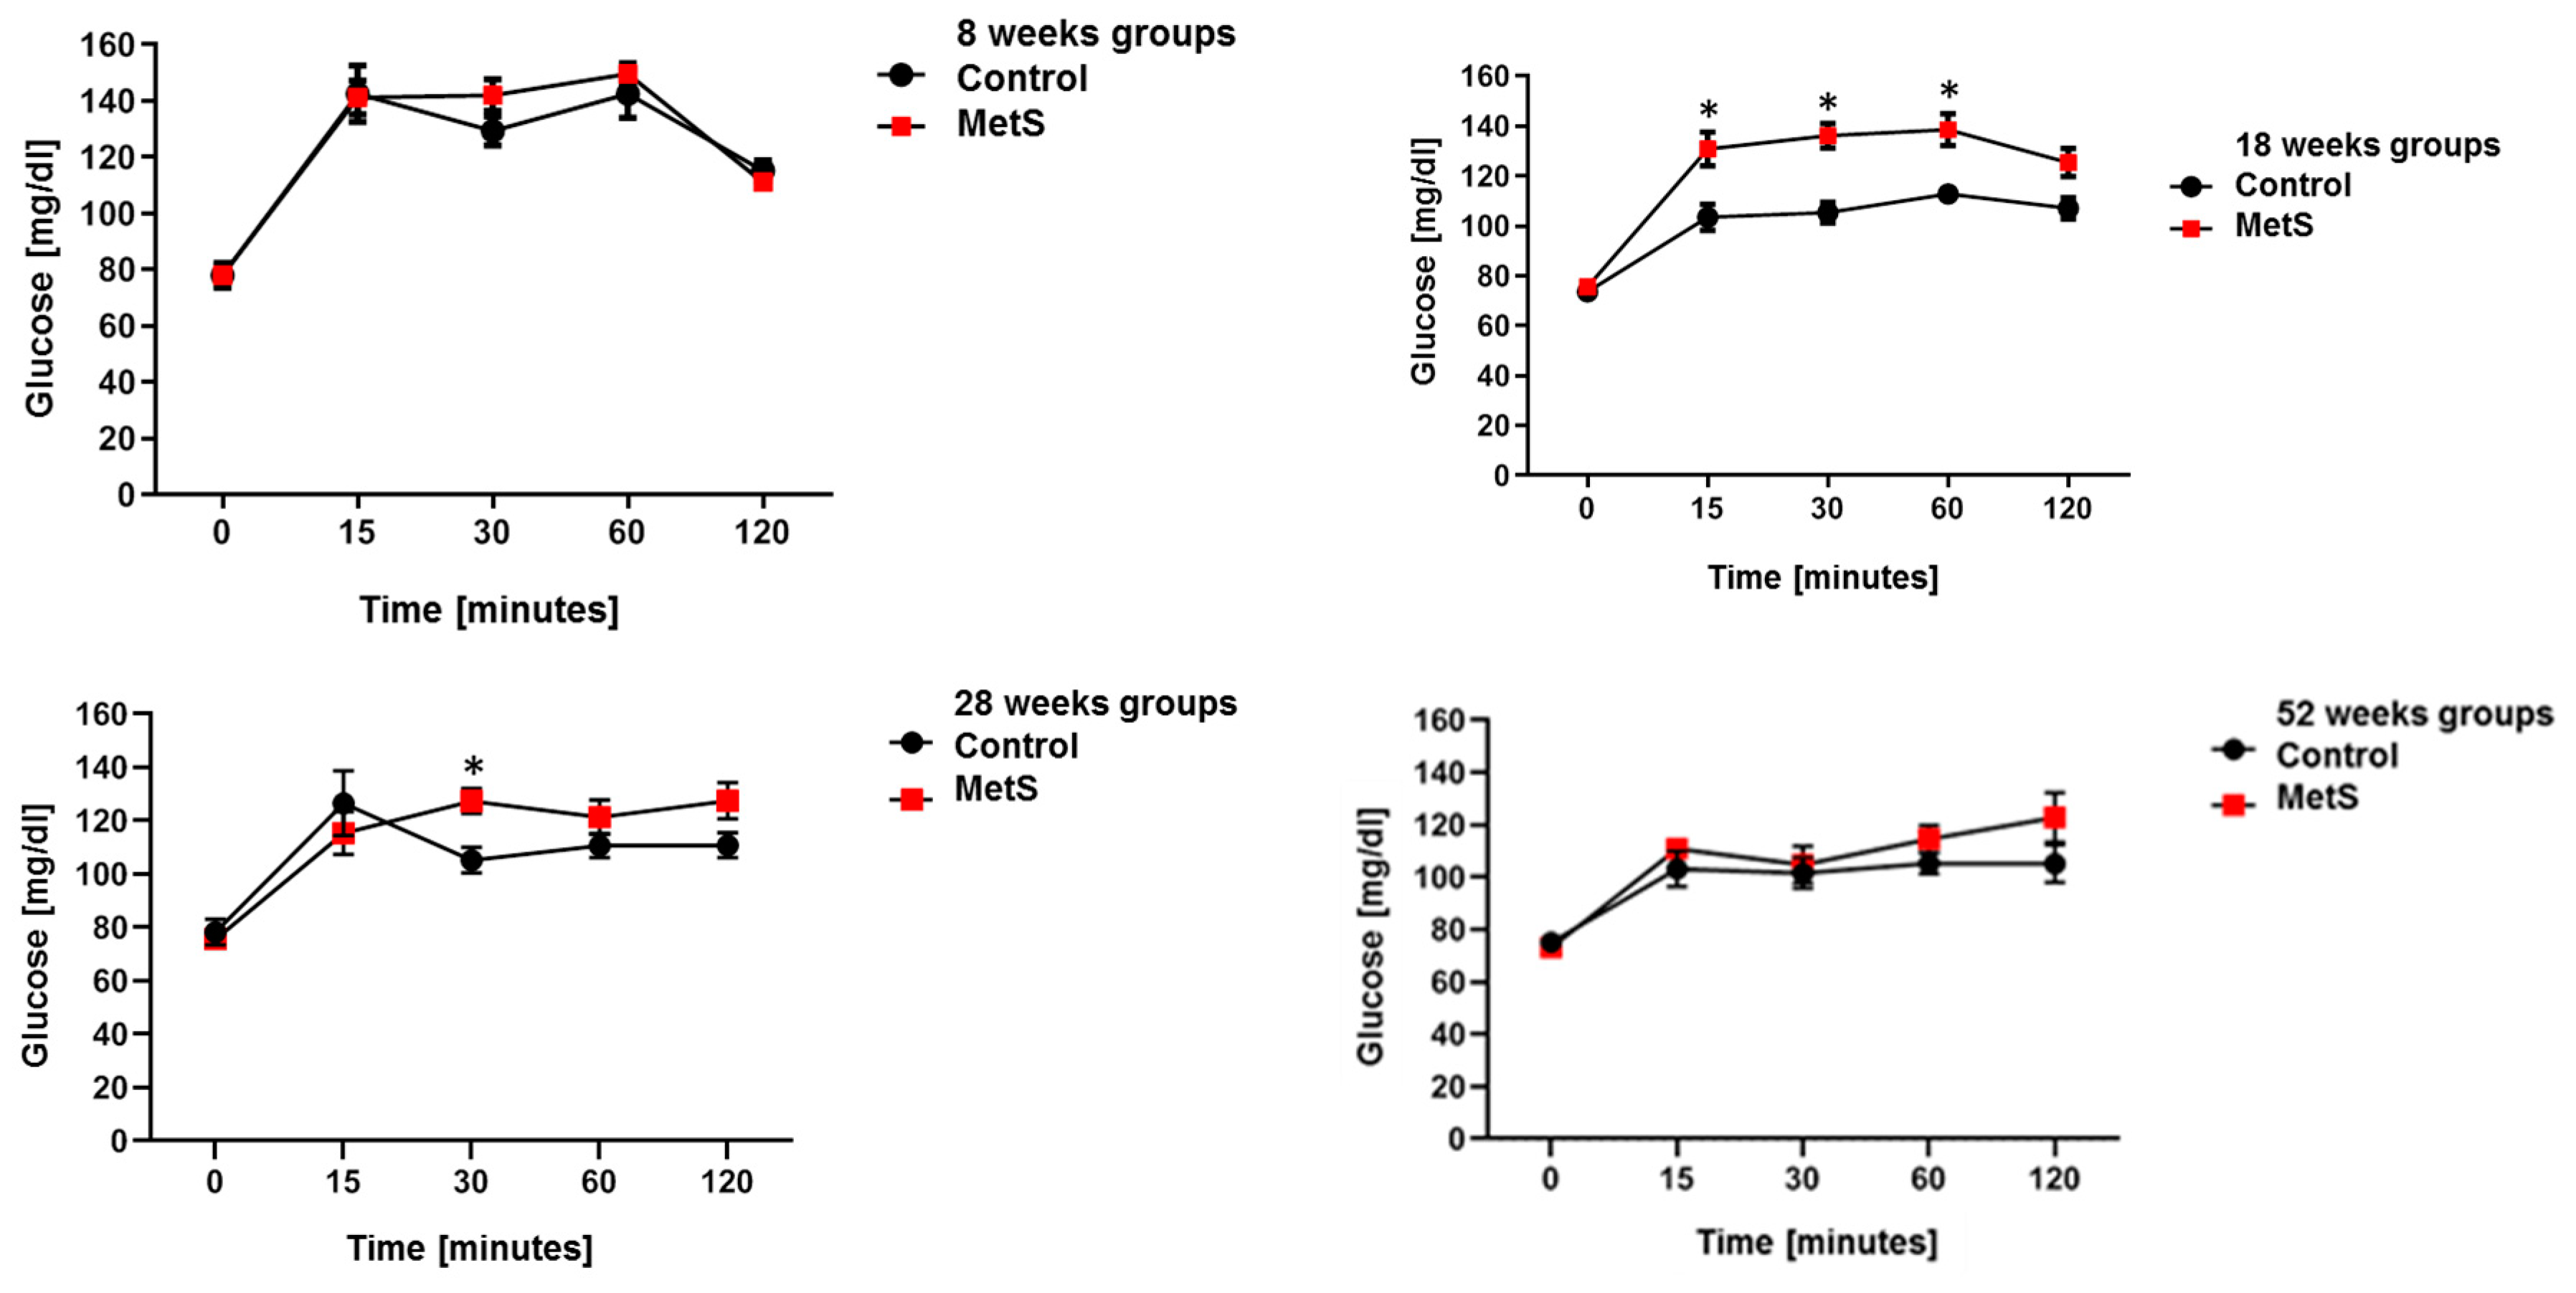
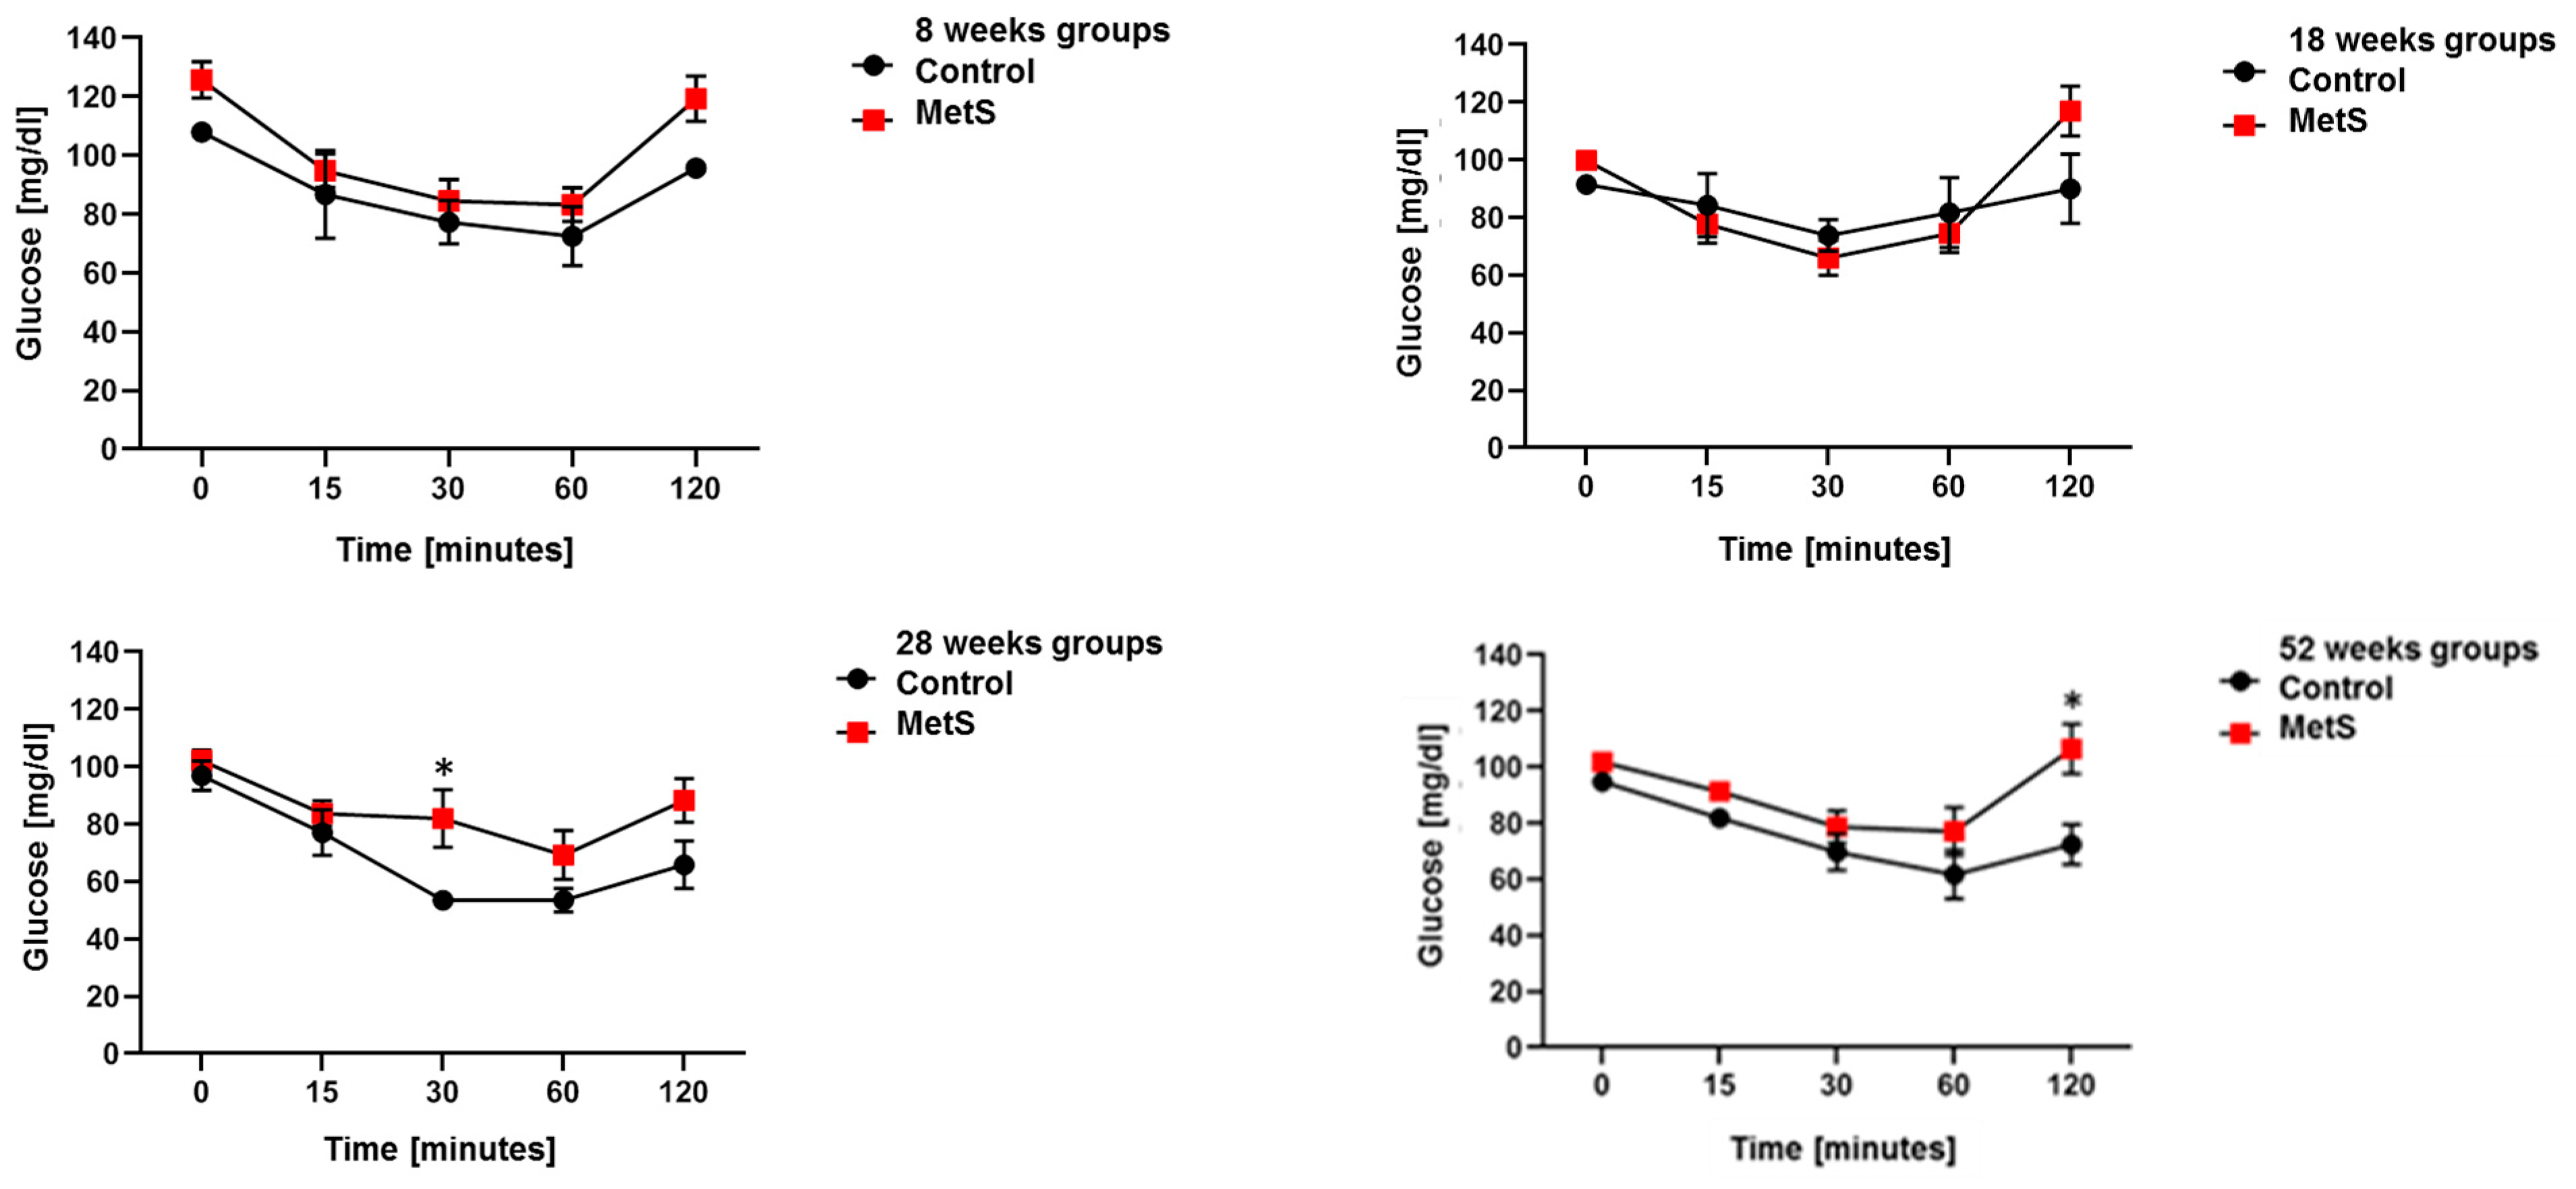
2.1. Animal Model of MetS
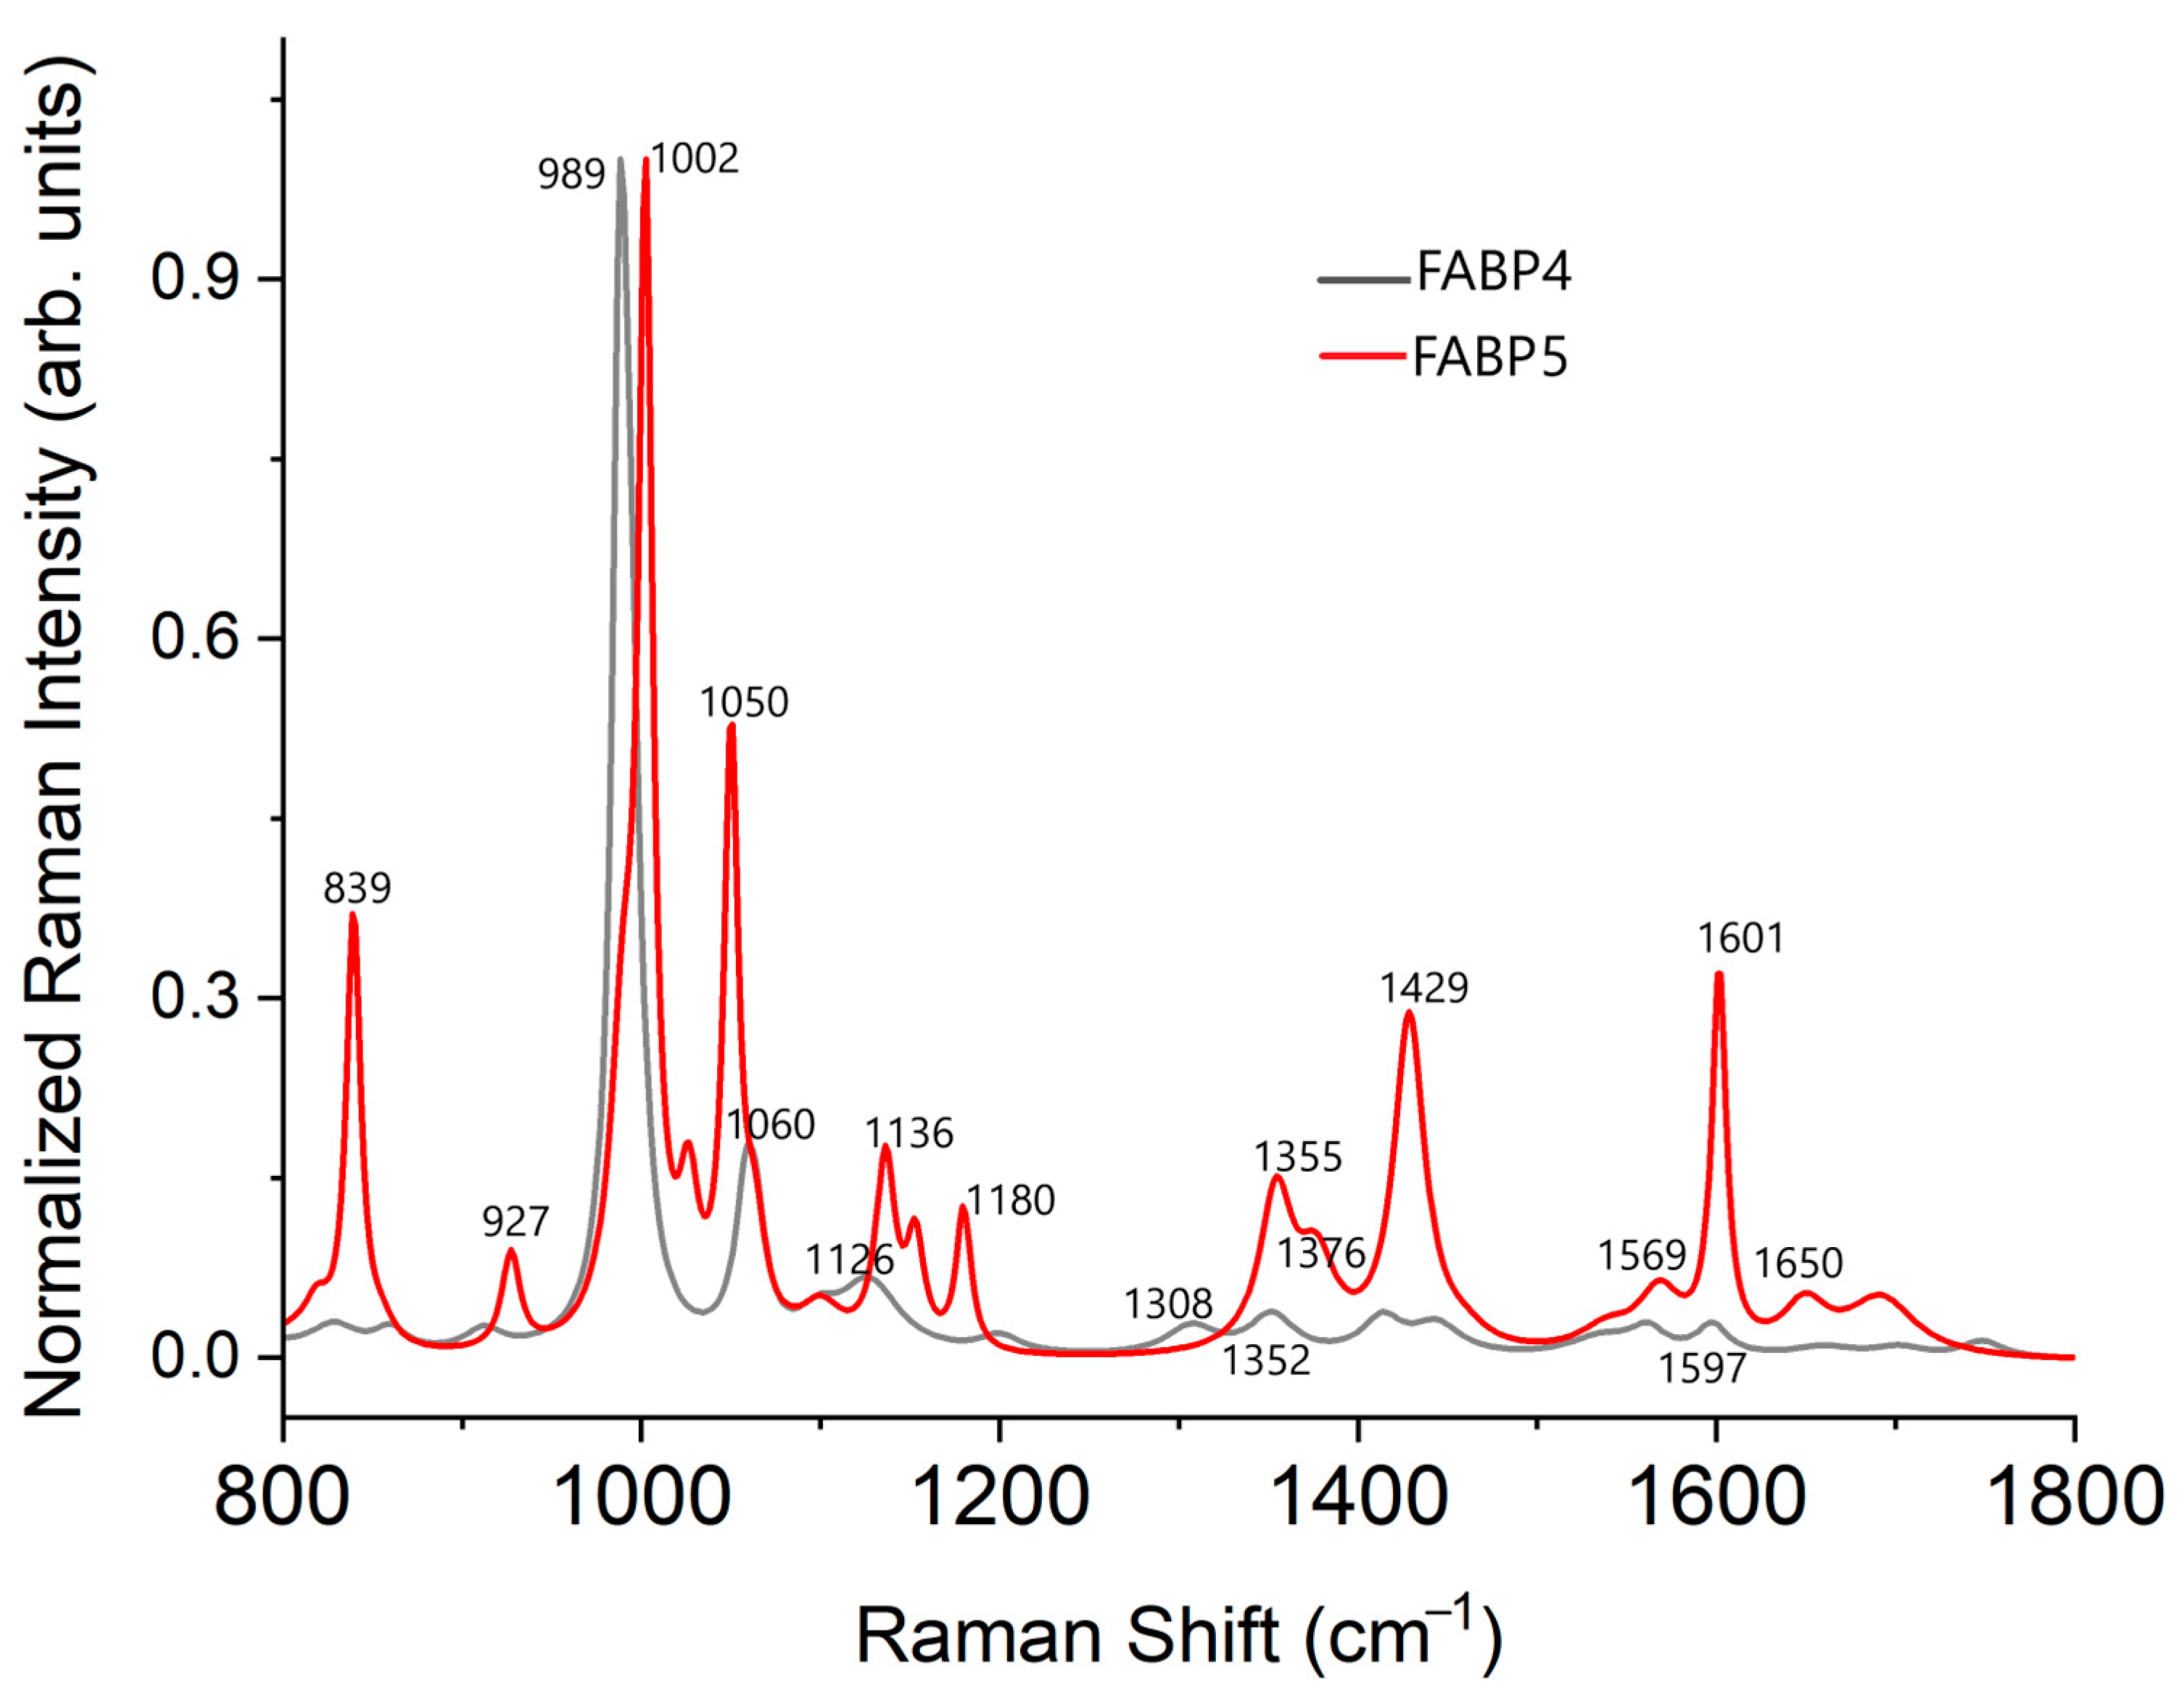
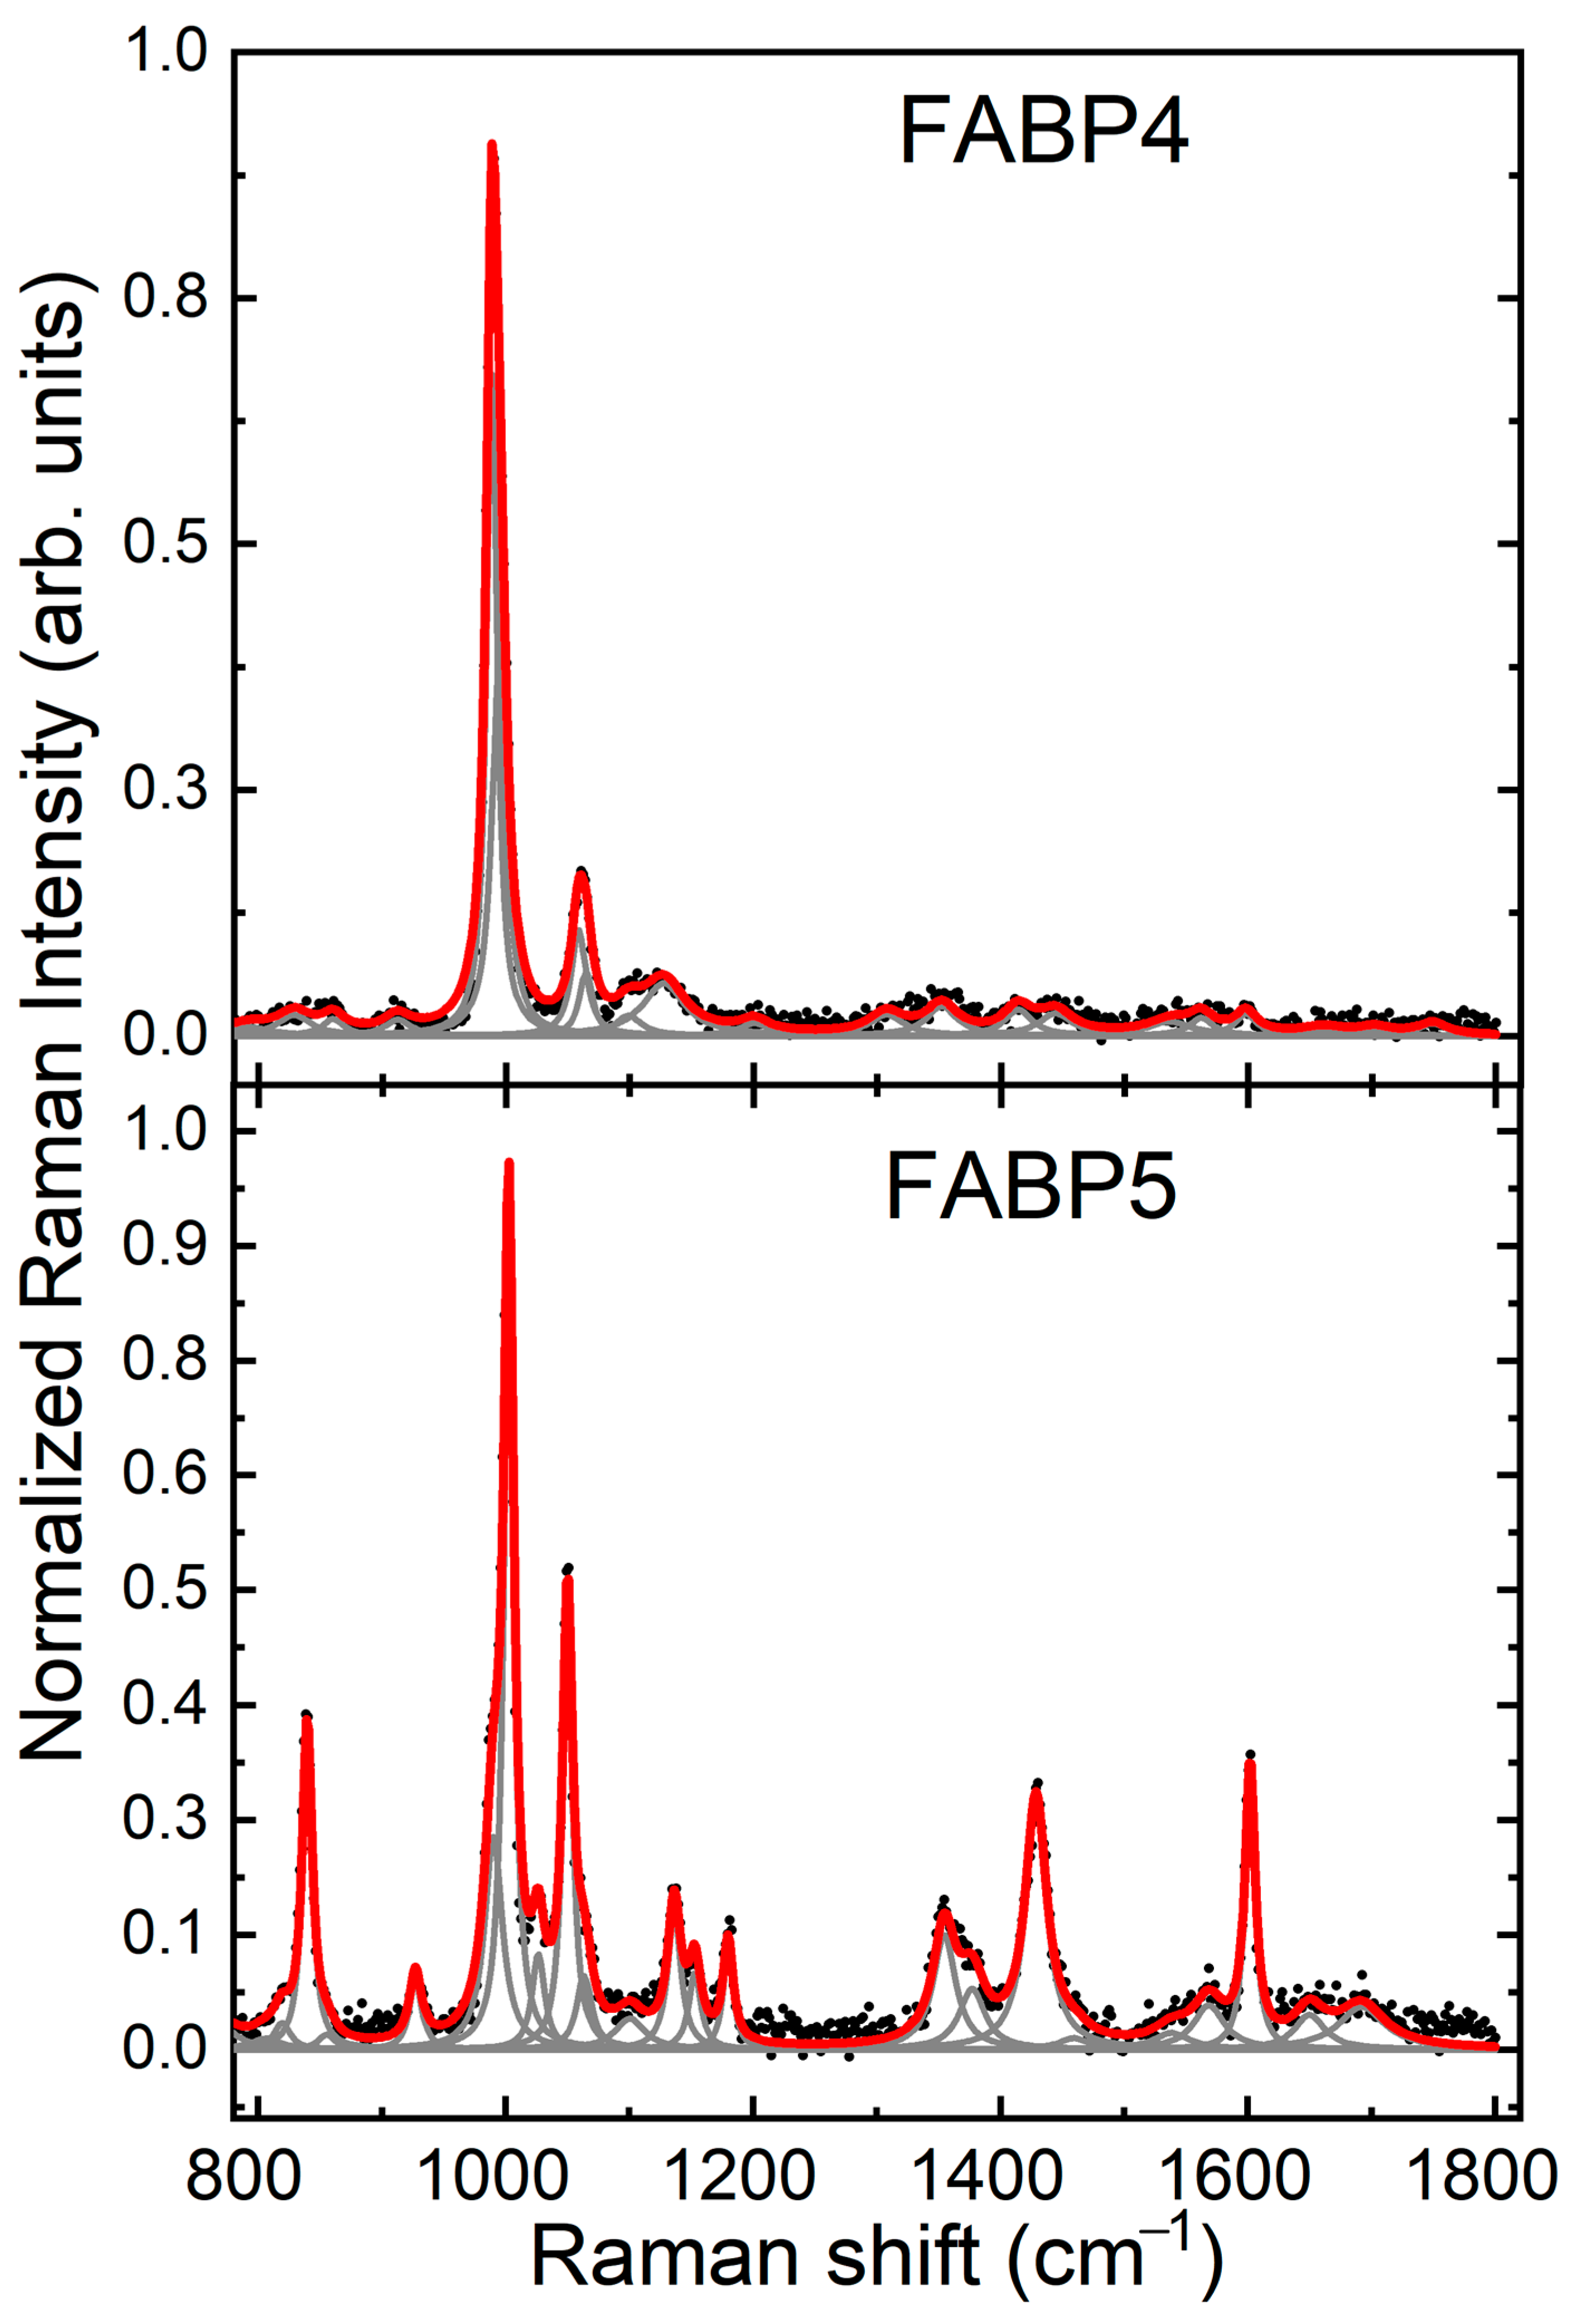
2.2. Raman Spectrum FABP4 and FABP5 In Vitro Analysis

| FABP4 | FWHM | FABP5 | FWHM | Vibration Mode | Amino Acid | ||
|---|---|---|---|---|---|---|---|
| 449 | vw | 37.7 | Cys; δ(backbone) | Cys and Met | |||
| 457 | m | 26.7 | δ(C-C-C-C); ν(S-S) | Phe, Cys, and Met | |||
| 533 | vw | 39.4 | 528 | vw | 21 | δ(C-C=C); δ(ring); ν(S-S) | Phe, Cys, and Met |
| 612 | w | 9.7 | δ(O-C=O) | Phe | |||
| 627 | w | 26.1 | 631 | sh | 26.2 | Symmetric ring breathing | Phe |
| 678 | vw | 29.2 | 674 | w | 8.3 | ν(C-S) | Cys and Met |
| 707 | vw | 34.2 | 713 | vw | 18.5 | ν(C-S) | Cys and Met |
| 766 | vw | 33.2 | ν(C-C); ζ(CH3) | Met | |||
| 819 | sh | 16.2 | ν(C-C) | Tyr and His | |||
| 828 | vw | 33.6 | ω(CO2); τ(CO2) | Aliphatic amino acids, Tyr | |||
| 839 | m | 9.6 | ring breathing | Tyr | |||
| 860 | vw | 22.3 | 855 | vw | 17.6 | ω(C-H); τ(C-H) | His, Arg |
| 912 | vw | 26.5 | ν(C-C-N) | Asp and Glu | |||
| 927 | vw | 11.8 | δ(C-C); ν(C-C) | Phe | |||
| 988 | vs | 10.3 | 990 | sh | 17.6 | C-C | Arg and Lys |
| 1002 | vs | 9.6 | δ(ring) | Phe | |||
| 1026 | w | 12.6 | δ(ring) | Phe | |||
| 1050 | s | 9.6 | His | ||||
| 1060 | 14.6 | His | |||||
| 1064 | sh | 13 | 1063 | sh | 14.4 | C-C, ν(C-N), δ(ring), NH3 | Arg and Lys |
| 1099 | vw | 25.8 | 1100 | vw | 30.0 | ζ(CH2), ν(C-N), ζ(CH3)a, N-C-H, | His, Pro, Met, and Cys |
| 1127 | w | 41.8 | ω(NH3+) | Asp and Glu | |||
| 1136 | w | 12.8 | τ(CH2); ν(CN); ν(CCH); δ(COH); ν(CC)a; ω(NH3); τ(CH3); ν(C-C) | Gly, Phe, Tyr, Trp, His, Gly, Lys, Leu, and Iso | |||
| 1153 | w | 11.9 | δ(C-H) | Tyr, Trp, and Phe rings | |||
| 1180 | w | 9.6 | δ(COH), ν(CC), δ(CH3), τ(NH3) | Tyr and Leu | |||
| 1200 | vw | 29.5 | symmetric stretching | Aromatic amino acids | |||
| 1307 | vw | 34.8 | ν(C-N); ν(N-H); δ(backbone) | Amide III | |||
| 1352 | w | 30.9 | 1355 | w | 22.5 | ν(C-C); δ(CCH); ω(CH2); δ(CH); δ(rings) | Arg, Lys, Leu, and Trp |
| 1377 | vw | 25.7 | Trp | ||||
| 1414 | vw | 27.5 | ν(CH3); δ(CH3); δ(CH2) | Lys, Aliphatic amino acids | |||
| 1429 | m | 20.9 | ν(NH2); ν(COO-); δ(CH2) | Asp, Glu, and Trp | |||
| 1444 | vw | 33.9 | δ(CH3)a; δ(CH2); δ(CH3); δ(COO-); ν(C-C) | Met, Leu, Trp, Gly, Leu, and His | |||
| 1459 | vw | 31.2 | β(CH3)a | Leu | |||
| 1536 | vw | 42.6 | 1538 | vw | 36.6 | ν(C-N); β(N-H) | |
| 1562 | vw | 24.4 | 1568 | vw | 30.5 | Trp | |
| 1598 | vw | 21.8 | 1601 | m | 9.6 | ν(COO-)a; ω(OH2); ν(C-O) | Phe and Ala |
| 1650 | vw | 30.3 | ν(C=O); δ(NH3) | Amide I, α-Helix, and β-sheet | |||
| 1660 | vw | 42.3 | |||||
| 1702 | vw | 34.6 | 1692 | vw | 46.6 | ν(C=O); σ(NH3) | |
| 1749 | vw | 29.6 | |||||
2.3. Identification of FABP4 Spectral Features
2.4. Identification of FABP5 Spectral Features
2.5. Spectral Differences Related to FABP4 and 5 in Serum
2.6. PCA-SVM
3. Discussion
4. Material and Methods
4.1. Animals and Experimental Design
4.2. Blood Pressure Measurement
4.3. Oral Glucose Tolerance Test (OGTT) and Insulin Tolerance Test (ITT)
4.4. Serum and Tissue Collection
4.5. Serum ELISA Assay for FABP4 and FABP5
4.6. Raman Spectra of FABP4 and FABP5
4.7. Raman Spectra Serum
4.8. Statistical Analysis
4.9. Data Preprocessing
4.10. PCA-SVM Model
5. Conclusions
Author Contributions
Funding
Institutional Review Board Statement
Informed Consent Statement
Data Availability Statement
Acknowledgments
Conflicts of Interest
References
- Saklayen, M.G. The global epidemic of the metabolic syndrome. Curr. Hypertens. Rep. 2018, 20, 1–8. [Google Scholar] [CrossRef] [PubMed]
- Rodríguez-Calvo, R.; Girona, J.; Rodríguez, M.; Samino, S.; Barroso, E.; de Gonzalo-Calvo, D.; Guaita-Esteruelas, S.; Heras, M.; van der Meer, R.W.; Lamb, H.J.; et al. Fatty acid binding protein 4 (FABP4) as a potential biomarker reflecting myocardial lipid storage in type 2 diabetes. Metabolism 2019, 96, 12–21. [Google Scholar] [CrossRef] [PubMed]
- Unger, R.H.; Clark, G.O.; Scherer, P.E.; Orci, L. Lipid homeostasis, lipotoxicity and the metabolic syndrome. Biochim. Biophys. Acta (BBA)-Mol. Cell Biol. Lipids 2010, 1801, 209–214. [Google Scholar] [CrossRef]
- Gormez, S.; Erdim, R.; Akan, G.; Caynak, B.; Duran, C.; Gunay, D.; Sozer, V.; Atalar, F. Relationships between visceral/subcutaneous adipose tissue FABP4 expression and coronary atherosclerosis in patients with metabolic syndrome. Cardiovasc. Pathol. 2020, 46, 107192. [Google Scholar] [CrossRef]
- Gillilan, R.E.; Ayers, S.D.; Noy, N. Structural basis for activation of fatty acid-binding protein 4. J. Mol. Biol. 2007, 372, 1246–1260. [Google Scholar] [CrossRef] [PubMed]
- Furuhashi, M.; Hotamisligil, G.S. Fatty acid-binding proteins: Role in metabolic diseases and potential as drug targets. Nat. Rev. Drug Discov. 2008, 7, 489–503. [Google Scholar] [CrossRef] [PubMed]
- Ishimura, S.; Furuhashi, M.; Watanabe, Y.; Hoshina, K.; Fuseya, T.; Mita, T.; Okazaki, Y.; Koyama, M.; Tanaka, M.; Akasaka, H.; et al. Circulating levels of fatty acid-binding protein family and metabolic phenotype in the general population. PLoS ONE 2013, 8, e81318. [Google Scholar] [CrossRef]
- Furuhashi, M.; Saitoh, S.; Shimamoto, K.; Miura, T. Fatty acid-binding protein 4 (FABP4): Pathophysiological insights and potent clinical biomarker of metabolic and cardiovascular diseases. Clin. Med. Insights Cardiol. 2014, 8, CMC-S17067. [Google Scholar] [CrossRef]
- Mita, T.; Furuhashi, M.; Hiramitsu, S.; Ishii, J.; Hoshina, K.; Ishimura, S.; Fuseya, T.; Watanabe, Y.; Tanaka, M.; Ohno, K.; et al. FABP4 is secreted from adipocytes by adenyl cyclase-PKA-and guanylyl cyclase-PKG-dependent lipolytic mechanisms. Obesity 2015, 23, 359–367. [Google Scholar] [CrossRef]
- Furuhashi, M.; Ogura, M.; Matsumoto, M.; Yuda, S.; Muranaka, A.; Kawamukai, M.; Omori, A.; Tanaka, M.; Moniwa, N.; Ohnishi, H.; et al. Serum FABP5 concentration is a potential biomarker for residual risk of atherosclerosis in relation to cholesterol efflux from macrophages. Sci. Rep. 2017, 7, 217. [Google Scholar] [CrossRef]
- Kralisch, S.; Ebert, T.; Lossner, U.; Jessnitzer, B.; Stumvoll, M.; Fasshauer, M. Adipocyte fatty acid-binding protein is released from adipocytes by a non-conventional mechanism. Int. J. Obes. 2014, 38, 1251–1254. [Google Scholar] [CrossRef] [PubMed]
- Ertunc, M.E.; Sikkeland, J.; Fenaroli, F.; Griffiths, G.; Daniels, M.P.; Cao, H.; Saatcioglu, F.; Hotamisligil, G.S. Secretion of fatty acid binding protein aP2 from adipocytes through a nonclassical pathway in response to adipocyte lipase activity. J. Lipid Res. 2015, 56, 423–434. [Google Scholar] [CrossRef] [PubMed]
- Saito, N.; Furuhashi, M.; Koyama, M.; Higashiura, Y.; Akasaka, H.; Tanaka, M.; Moniwa, N.; Ohnishi, H.; Saitoh, S.; Ura, N.; et al. Elevated circulating FABP4 concentration predicts cardiovascular death in a general population: A 12-year prospective study. Sci. Rep. 2021, 11, 4008. [Google Scholar] [CrossRef] [PubMed]
- Xu, A.; Tso, A.W.; Cheung, B.M.; Wang, Y.; Wat, N.M.; Fong, C.H.; Yeung, D.C.; Janus, E.D.; Sham, P.C.; Lam, K.S. Circulating adipocyte–fatty acid binding protein levels predict the development of the metabolic syndrome: A 5-year prospective study. Circulation 2007, 115, 1537–1543. [Google Scholar] [CrossRef]
- Tso, A.W.; Xu, A.; Sham, P.C.; Wat, N.M.; Wang, Y.; Fong, C.H.; Cheung, B.M.; Janus, E.D.; Lam, K.S. Serum adipocyte fatty acid–binding protein as a new biomarker predicting the development of type 2 diabetes: A 10-year prospective study in a Chinese cohort. Diabetes Care 2007, 30, 2667–2672. [Google Scholar] [CrossRef]
- Chow, W.S.; Tso, A.W.K.; Xu, A.; Yuen, M.M.A.; Fong, C.H.Y.; Lam, T.H.; Lo, S.V.; Tse, H.F.; Woo, Y.C.; Yeung, C.Y.; et al. Elevated circulating adipocyte-fatty acid binding protein levels predict incident cardiovascular events in a community-based cohort: A 12-year prospective study. J. Am. Heart Assoc. 2013, 2, e004176. [Google Scholar] [CrossRef]
- Li, J.-C.; Wu, D.-A.; Hou, J.-S.; Subeq, Y.-M.; Chen, H.-D.; Hsu, B.-G. High serum adipocyte fatty acid binding protein is associated with metabolic syndrome in patients with type 2 diabetes. J. Diabetes Res. 2016, 2016, 8380279. [Google Scholar] [CrossRef]
- Furuhashi, M.; Sakuma, I.; Morimoto, T.; Higashiura, Y.; Sakai, A.; Matsumoto, M.; Sakuma, M.; Shimabukuro, M.; Nomiyama, T.; Arasaki, O.; et al. Independent and distinct associations of FABP4 and FABP5 with metabolic parameters in type 2 diabetes mellitus. Front. Endocrinol. 2020, 11, 575557. [Google Scholar] [CrossRef]
- Furuhashi, M.; Yuda, S.; Muranaka, A.; Kawamukai, M.; Matsumoto, M.; Tanaka, M.; Moniwa, N.; Ohnishi, H.; Saitoh, S.; Shimamoto, K.; et al. Circulating fatty acid-binding protein 4 concentration predicts the progression of carotid atherosclerosis in a general population without medication. Circ. J. 2018, 82, 1121–1129. [Google Scholar] [CrossRef]
- Furuhashi, M.; Ishimura, S.; Ota, H.; Hayashi, M.; Nishitani, T.; Tanaka, M.; Yoshida, H.; Shimamoto, K.; Hotamisligil, G.S.; Miura, T. Serum fatty acid-binding protein 4 is a predictor of cardiovascular events in end-stage renal disease. PLoS ONE 2011, 6, e27356. [Google Scholar] [CrossRef]
- Obokata, M.; Iso, T.; Ohyama, Y.; Sunaga, H.; Kawaguchi, T.; Matsui, H.; Iizuka, T.; Fukuda, N.; Takamatsu, H.; Koitabashi, N.; et al. Early increase in serum fatty acid binding protein 4 levels in patients with acute myocardial infarction. Eur. Heart J. Acute Cardiovasc. Care 2018, 7, 561–569. [Google Scholar] [CrossRef] [PubMed]
- Uysal, K.T.; Scheja, L.; Wiesbrock, S.M.; Bonner-Weir, S.; Hotamisligil, G.S. Improved glucose and lipid metabolism in genetically obese mice lacking aP2. Endocrinology 2000, 141, 3388–3396. [Google Scholar] [CrossRef] [PubMed]
- Makowski, L.; Boord, J.B.; Maeda, K.; Babaev, V.R.; Uysal, K.T.; Morgan, M.A.; Parker, R.A.; Suttles, J.; Fazio, S.; Hotamisligil, G.S.; et al. Lack of macrophage fatty-acid–binding protein aP2 protects mice deficient in apolipoprotein E against atherosclerosis. Nat. Med. 2001, 7, 699–705. [Google Scholar] [CrossRef] [PubMed]
- Chung, J.Y.; Ain, Q.U.; Song, Y.; Yong, S.B.; Kim, Y.H. Targeted delivery of CRISPR interference system against Fabp4 to white adipocytes ameliorates obesity, inflammation, hepatic steatosis, and insulin resistance. Genome Res. 2019, 29, 1442–1452. [Google Scholar] [CrossRef]
- Yao, F.; Jiang, D.-D.; Guo, W.-H.; Guo, L.-S.; Gao, M.-M.; Bai, Y.; Wang, X.; Zhang, L.-S. FABP4 inhibitor attenuates inflammation and endoplasmic reticulum stress of islet in leptin receptor knockout rats. Eur. Rev. Med. Pharmacol. Sci. 2020, 24, 12808–12820. [Google Scholar]
- Butler, H.J.; Ashton, L.; Bird, B.; Cinque, G.; Curtis, K.; Dorney, J.; Esmonde-White, K.; Fullwood, N.J.; Gardner, B.; Martin-Hirsch, P.L.; et al. Using Raman spectroscopy to characterize biological materials. Nat. Protoc. 2016, 11, 664–687. [Google Scholar] [CrossRef]
- Ellis, D.I.; Goodacre, R. Metabolic fingerprinting in disease diagnosis: Biomedical applications of infrared and Raman spectroscopy. Analyst 2006, 131, 875–885. [Google Scholar] [CrossRef]
- Ramírez-Elías, M.G.; González, F.J. Raman Spectroscopy for In Vivo Medical Diagnosis. In Raman Spectroscopy; IntechOpen: London, UK, 2018; p. 293. [Google Scholar]
- Donjuán-Loredo, G.; Espinosa-Tanguma, R.; Ramírez-Elías, M. Characterization of fatty acid binding protein 4 (FABP4) using Raman spectroscopy. In Optical Tomography and Spectroscopy; Optica Publishing Group: Washington, DC, USA, 2020; p. JW3A-18. [Google Scholar]
- Smith, B.M.; Ways, J.; Deraedt, S.; Langenderfer, K.; Nestor, A.; Lee, S.; Welch, M.; Khuder, S.; Cicila, G.; Allison, D. P203: Determination of a non-invasive model for predicting obesity in rats by discriminant function analysis. J. Surg. Res. 2007, 137, 314. [Google Scholar] [CrossRef]
- Flack, J.M.; Adekola, B. Blood pressure and the new ACC/AHA hypertension guidelines. Trends Cardiovasc. Med. 2020, 30, 160–164. [Google Scholar] [CrossRef]
- Petersmann, A.; Müller-Wieland, D.; Müller, U.A.; Landgraf, R.; Nauck, M.; Freckmann, G.; Heinemann, L.; Schleicher, E. Definition, classification and diagnosis of diabetes mellitus. Exp. Clin. Endocrinol. Diabetes 2019, 127 (Supp. S1), S1–S7. [Google Scholar] [CrossRef]
- Andreadou, I.; Schulz, R.; Badimon, L.; Adameová, A.; Kleinbongard, P.; Lecour, S.; Nikolaou, P.; Falcão-Pires, I.; Vilahur, G.; Woudberg, N.; et al. Hyperlipidaemia and cardioprotection: Animal models for translational studies. Br. J. Pharmacol. 2020, 177, 5287–5311. [Google Scholar] [CrossRef] [PubMed]
- Sjöberg, B.; Foley, S.; Cardey, B.; Enescu, M. An experimental and theoretical study of the amino acid side chain Raman bands in proteins. Spectrochim. Acta Part A Mol. Biomol. Spectrosc. 2014, 128, 300–311. [Google Scholar] [CrossRef] [PubMed]
- Jenkins, A.L.; Larsen, R.A.; Williams, T.B. Characterization of amino acids using Raman spectroscopy. Spectrochim. Acta Part A Mol. Biomol. Spectrosc. 2015, 61, 1585–1594. [Google Scholar] [CrossRef]
- Zhu, G.; Zhu, X.; Fan, Q.; Wan, X. Raman spectra of amino acids and their aqueous solutions. Spectrochim. Acta Part A Mol. Biomol. Spectrosc. 2015, 78, 1187–1195. [Google Scholar] [CrossRef]
- De Gelder, J.; De Gussem, K.; Vandenabeele, P.; Moens, L. Reference database of Raman spectra of biological molecules. J. Raman Spectrosc. Int. J. Orig. Work. All Asp. Raman Spectrosc. Incl. High. Order Process. Brillouin Rayleigh Scatt. 2007, 38, 1133–1147. [Google Scholar] [CrossRef]
- Tuma, R. Raman spectroscopy of proteins: From peptides to large assemblies. J. Raman Spectrosc. Int. J. Orig. Work. All Asp. Raman Spectrosc. Incl. High. Order Process. Brillouin Rayleigh Scatt. 2005, 36, 307–319. [Google Scholar] [CrossRef]
- Czamara, K.; Majzner, K.; Pacia, M.Z.; Kochan, K.; Kaczor, A.; Baranska, M. Raman spectroscopy of lipids: A review. J. Raman Spectrosc. 2015, 46, 4–20. [Google Scholar] [CrossRef]
- Giansante, S.; Giana, H.E.; Fernandes, A.B.; Silveira, L., Jr. Analytical performance of Raman spectroscopy in assaying biochemical components in human serum. Lasers Med. Sci. 2002, 37, 287–298. [Google Scholar] [CrossRef]
- Panchal, S.K.; Brown, L. Rodent models for metabolic syndrome research. J. Biomed. Biotechnol. 2010, 2011, 351982. [Google Scholar] [CrossRef]
- Katsiki, N.; Athyros, V.G.; Karagiannis, A.; Mikhailidis, D.P. Characteristics other than the diagnostic criteria associated with metabolic syndrome: An overview. Curr. Vasc. Pharmacol. 2014, 12, 627–641. [Google Scholar] [CrossRef]
- Shrestha, S.; Sunaga, H.; Hanaoka, H.; Yamaguchi, A.; Kuwahara, S.; Umbarawan, Y.; Nakajima, K.; Machida, T.; Murakami, M.; Saito, A.; et al. Circulating FABP4 is eliminated by the kidney via glomerular filtration followed by megalin-mediated reabsorption. Sci. Rep. 2018, 8, 16451. [Google Scholar] [CrossRef] [PubMed]
- Tanaka, M.; Furuhashi, M.; Okazaki, Y.; Mita, T.; Fuseya, T.; Ohno, K.; Ishimura, S.; Yoshida, H.; Miura, T. Ectopic expression of fatty acid-binding protein 4 in the glomerulus is associated with proteinuria and renal dysfunction. Nephron Clin. Pract. 2014, 128, 345–351. [Google Scholar] [CrossRef]
- Yan, F.; Liu, X.; Zhang, S.; Su, J.; Zhang, Q.; Chen, J. Electrostatic interaction-mediated conformational changes of adipocyte fatty acid binding protein probed by molecular dynamics simulation. J. Biomol. Struct. Dyn. 2019, 37, 3583–3595. [Google Scholar] [CrossRef] [PubMed]
- León-Bejarano, F.; Méndez, M.O.; Ramírez-Elías, M.G.; Alba, A. Improved Vancouver Raman Algorithm Based on Empirical Mode Decomposition for Denoising Biological Samples. Appl. Spectrosc. 2019, 73, 1436–1450. [Google Scholar] [CrossRef] [PubMed]

| Clinical Parameters | Measure |
|---|---|
| Central obesity; abdominal circumference | Men ≥ 90 cm, women ≥ 80 cm |
| Triglycerides | ≥150 mg/dL |
| HDL cholesterol | Men ≤ 40 mg/dL, women ≤ 50 mg/dL |
| Hypertension | ≥130/85 mmHg |
| Fast hyperglycemic | ≥110 mg/dL |
| 8 Weeks | 18 Weeks | 28 Weeks | 52 Weeks | |||||
|---|---|---|---|---|---|---|---|---|
| Parameter | Control | MetS | Control | MetS | Control | MetS | Control | MetS |
| % Fat | 3.9 ± 0.2 | 5.2 ± 0.3 | 3.8 ± 0.4 | 7.9 ± 0.8 * | 5.3 ± 0.9 | 9.1 ± 1.1 * | 6 ± 0.4 | 11.2 ± 1.4 * |
| Total body fat (g) | 14.5 ± 1.3 | 14.6 ± 2 | 17.2 ± 2.2 | 36.4 ± 5.7 * | 27.8 ± 5.6 | 49.3 ± 8 * | 35.5 ± 3.8 | 90.1 ± 15.6 * |
| Lee index | 0.290 ± 0.002 | 0.284 ± 0.003 | 0.296 ± 0.004 | 0.300 ± 0.004 | 0.317 ± 0.004 | 0.311 ± 0.004 | 0.305 ± 0.003 | 0.323 ± 0.008 |
| Abdominal circumference (cm) | 18.3 ± 0.6 | 15.9 ± 0.6 | 19.2 ± 0.6 | 20.9 ± 0.9 | 21.2 ± 0.5 | 23 ± 0.8 | 23.2 ± 0.7 | 26 ± 1.5 |
| Systolic blood pressure (mmHg) | 97 ± 6.8 | 122.9 ± 5.1 * | 87.9 ± 18.2 | 132.9 ± 30 * | 107 ± 5.4 | 142.8 ± 4.7 * | 102 ± 4.7 | 132 ± 9.3 * |
| Diastolic blood pressure (mmHg) | 65.1 ± 4.7 | 84.2 ± 3.8 * | 61.9 ± 13.2 | 84.8 ± 19.9 * | 64.6 ± 5 | 90.4 ± 4.6 * | 72.8 ± 3.8 | 86 ± 7.4 |
| Mean blood pressure (mmHg) | 75.4 ± 5.4 | 96.8 ± 4.2 * | 70.3 ± 9.8 | 100.6 ± 23.1 * | 78.6 ± 4.6 | 108.3 ± 4.6 * | 82.3 ± 3.7 | 101 ± 7.9 * |
| Fast Glucose (mg/dL) | 108 ± 2.7 | 125.7 ± 6.2 * | 91.5 ± 2.1 | 99.7 ± 2.1 | 92.2 ± 4.4 | 108 ± 3.2 * | 96.3 ± 2.2 | 104.2 ± 2 * |
| Total Cholesterol (mg/dL) | 53.1 ± 5.4 | 69.5 ± 8.6 * | 49.1 ± 3.8 | 59.6 ± 6.4 * | 53.8 ± 4.5 | 56.7 ± 5.2 | 76.6 ± 10.1 | 105.3 ± 13.6 * |
| Tryglicerides (mg/dL) | 79.1 ± 6.9 | 57.4 ± 5.7 * | 60.4 ± 12.9 | 82.9 ± 8.4 * | 48.8 ± 6.2 | 73.2 ± 11.2 * | 134.1 ± 21 | 273.4 ± 63.7 * |
| HDL Cholesterol (mg/dL) | 23.1 ± 2 | 25.5 ± 2.3 | 17.9 ± 2.6 | 19.4 ± 2.7 | 22.2 ± 3.1 | 15.5 ± 3.5 | 32.4 ± 5.4 | 21 ± 4.6 |
| FABP 4 ng/mL | 24.6 ± 2 | 36 ± 2.2 * | 26.3 ± 2.3 | 31.8 ± 1.1 | 22.6 ± 2.3 | 29 ± 0.8 | 29.6 ± 2.5 | 37.4 ± 2 * |
| FABP 5 ng/mL | 1.9 ± 0.5 | 3.4 ± 0.9 | 1.9 ± 0.8 | 2.8 ± 1.6 | 2.3 ± 0.5 | 6.1 ± 0.8 * | 1.9 ± 0.8 | 5.5 ± 0.9 * |
Disclaimer/Publisher’s Note: The statements, opinions and data contained in all publications are solely those of the individual author(s) and contributor(s) and not of MDPI and/or the editor(s). MDPI and/or the editor(s) disclaim responsibility for any injury to people or property resulting from any ideas, methods, instructions or products referred to in the content. |
© 2023 by the authors. Licensee MDPI, Basel, Switzerland. This article is an open access article distributed under the terms and conditions of the Creative Commons Attribution (CC BY) license (https://creativecommons.org/licenses/by/4.0/).
Share and Cite
Donjuán-Loredo, G.; Espinosa-Tanguma, R.; Guevara, E.; Rodríguez-Aranda, M.d.C.; León-Bejarano, F.; Hernández-Vidales, K.; Ramírez-Elías, M. Fatty Acid-Binding Proteins Identification during the Evolution of Metabolic Syndrome: A Raman Spectroscopy-Based Approach. Molecules 2023, 28, 7472. https://doi.org/10.3390/molecules28227472
Donjuán-Loredo G, Espinosa-Tanguma R, Guevara E, Rodríguez-Aranda MdC, León-Bejarano F, Hernández-Vidales K, Ramírez-Elías M. Fatty Acid-Binding Proteins Identification during the Evolution of Metabolic Syndrome: A Raman Spectroscopy-Based Approach. Molecules. 2023; 28(22):7472. https://doi.org/10.3390/molecules28227472
Chicago/Turabian StyleDonjuán-Loredo, Guadalupe, Ricardo Espinosa-Tanguma, Edgar Guevara, María del Carmen Rodríguez-Aranda, Fabiola León-Bejarano, Karen Hernández-Vidales, and Miguel Ramírez-Elías. 2023. "Fatty Acid-Binding Proteins Identification during the Evolution of Metabolic Syndrome: A Raman Spectroscopy-Based Approach" Molecules 28, no. 22: 7472. https://doi.org/10.3390/molecules28227472
APA StyleDonjuán-Loredo, G., Espinosa-Tanguma, R., Guevara, E., Rodríguez-Aranda, M. d. C., León-Bejarano, F., Hernández-Vidales, K., & Ramírez-Elías, M. (2023). Fatty Acid-Binding Proteins Identification during the Evolution of Metabolic Syndrome: A Raman Spectroscopy-Based Approach. Molecules, 28(22), 7472. https://doi.org/10.3390/molecules28227472