Article

Modulating the Luminescence, Photosensitizing Properties, and Mitochondria-Targeting Ability of D-π-A-Structured Dihydrodibenzo[a,c]phenazines

1
Key Laboratory for Advanced Materials, Feringa Nobel Prize Scientist Joint Research Center, Frontiers Science Center for Materiobiology and Dynamic Chemistry, Joint International Research Laboratory for Precision Chemistry and Molecular Engineering, Institute of Fine Chemicals, School of Chemistry and Molecular Engineering, East China University of Science & Technology, 130 Meilong Road, Shanghai 200237, China
2
Clinical Research Center, Beijing Children’s Hospital, Capital Medical University, National Center for Children’s Health, Beijing 100045, China
*
Authors to whom correspondence should be addressed.
Molecules 2023, 28(17), 6392; https://doi.org/10.3390/molecules28176392
Submission received: 1 August 2023 / Revised: 29 August 2023 / Accepted: 30 August 2023 / Published: 1 September 2023
(This article belongs to the Special Issue Aggregation-Induced Emission: From Fundamental to Application)

Abstract

:
Herein, pyridinium and 4-vinylpyridinium groups are introduced into the VIE-active N,N′-disubstituted-dihydrodibenzo[a,c]phenazines (DPAC) framework to afford a series of D-π-A-structured dihydrodibenzo[a,c]phenazines in consideration of the aggregation-benefited performance of the DPAC module and the potential mitochondria-targeting capability of the resultant pyridinium-decorated DPACs (DPAC-PyPF6 and DPAC-D-PyPF6). To modulate the properties and elucidate the structure–property relationship, the corresponding pyridinyl/4-vinylpyridinyl-substituted DPACs, i.e., DPAC-Py and DPAC-D-Py, are designed and studied as controls. It is found that the strong intramolecular charge transfer (ICT) effect enables the effective separation of the highest occupied molecular orbital (HOMO) and the lowest unoccupied molecular orbital (LUMO) of DPAC-PyPF6 and DPAC-D-PyPF6, which is conducive to the generation of ROS. By adjusting the electron-accepting group and the π-bridge, the excitation, absorption, luminescence, photosensitizing properties as well as the mitochondria-targeting ability can be finely tuned. Both DPAC-PyPF6 and DPAC-D-PyPF6 display large Stokes shifts (70–222 nm), solvent-dependent absorptions and emissions, aggregation-induced emission (AIE), red fluorescence in the aggregated state (λem = 600–650 nm), aggregation-promoted photosensitizing ability with the relative singlet-oxygen quantum yields higher than 1.10, and a mitochondria-targeting ability with the Pearson coefficients larger than 0.85. DPAC-D-PyPF6 shows absorption maximum at a longer wavelength, slightly redder fluorescence and better photosensitivity as compared to DPAC-PyPF6, which consequently leads to the higher photocytotoxicity under the irradiation of white light as a result of the larger π-conjugation.

Graphical Abstract

1. Introduction

Photodynamic therapy (PDT), as an emerging method for the treatment of cancer and bacteria, has attracted much attention due to its low invasiveness, toxicity, and drug resistance [1,2,3,4,5,6,7,8,9,10,11], among which, image-guided PDT is attracting increasing attention for its potential in the theranostics. It has been recognized that exploring high-performance luminescent photosensitizers is very important to the development of image-guided therapy. It is reported that as compared to the traditional photosensitizers [12,13,14,15,16,17,18,19], the photosensitizers with aggregation-induced emission (AIE) not only usually have efficient aggregated-state luminescence but also possess the aggregation-boosted generation of ROS. As such, AIE-active photosensitizers have emerged as a new type of fluorescent photosensitizers [10,11,20,21,22,23,24]. Nevertheless, at present, the types of AIE photosensitizers still need to be expanded.
A class of phenazine derivatives with unique multiple emission properties has been developed since 2015. Specifically, such N,N′-disubstituted-dihydrodibenzo[a,c]phenazines emit intense blue light in the constrained state, while relatively moderate orange-red fluorescence is emitted in the unconfined state [25,26,27,28,29,30,31,32]. As can be seen from the molecular structure, blue light is the intrinsic emission of dihydrodibenzo[a,c]phenazines, because the saddle-shaped configuration of the phenazine ring gives rise to the limited π-conjugation. When molecularly dispersed, the dihydrodibenzo[a,c]phenazines could undergo vigorous intramolecular vibrations and rotations. The active intramolecular motions partially consume the excited-state energy which accounts for the not very efficient emission of dihydrodibenzo[a,c]phenazines in the unconstrained state. In addition, the intramolecular vibrations of the central phenazine ring render the conformation changing from bent to planar, which leads to the elongation of the π-conjugation and the resultant abnormal orange-red emission. A series of theoretical calculations and experiments have been carried out to prove that the emergence of the orange-red emission is induced by the intramolecular bent-to-planar vibrations. Therefore, such a phenomenon was named vibration-induced emission (VIE) [25]. Thus, it is known that, in the dihydrodibenzo[a,c]phenazine system, VIE and AIE compatibly coexist. As a result of the structural-flexibility, these dihydrodibenzo[a,c]phenazines usually show environment-sensitive fluorescence, which can be continuously tuned from orange-red to blue light as the intramolecular motions restrict and vice versa, as a result of the collective effects of VIE and AIE. Such unique photophysical properties make DPAC derivatives a class of excellent ratiometric fluorescent probes with large Stokes shifts [33,34,35,36,37,38,39,40,41,42,43,44,45,46,47,48]. Based on this, these VIE+AIE systems have been widely used in many fields [33,34,35,36,37,38,39,40,41,42,43,44,45,46,47,48]. For example, DPAC-based fluorogens have been used for the detection or recognition of chemical species such as metal cations [33,34], dicarboxylate dianions [35,36], and glucose [37], explored for the sensing of physical parameters such as temperature [38,39], viscosity [40] and moisture [41], and real-time monitoring of the specific processes such as gelation [42], self-assembly [43], and microphase separation [44]. Noteworthily, the DPAC derivatives have also been developed recently for biological applications [45,46,47,48], such as the ratiometric detection and blocking of influenza viruses [46,47], and the in vivo three-photon fluorescence imaging [48]. Undoubtedly, the VIE plus AIE feature endows the dihydrodibenzo[a,c]phenazines with great charm to be tailored as functional materials.
At the same time, it has been reported that cancer cells are richer in mitochondria compared to normal cells [49]. Therefore, fluorescent photosensitizers with mitochondria-targeting abilities have attracted much attention, because they can ensure the specificity and effectiveness of the photosensitizers in the imaging and therapy of cancer [50,51]. A number of cationic AIEgens have so far been reported to possess mitochondria-specificity. Fluorophores functionalized with pyridinium group(s) have attracted numerous attentions in organelle-specific imaging [52,53,54,55,56], due to the easy introduction of pyridinium units and the positive charge of pyridinium which promotes the probes to target the negatively charged organelle such as mitochondria via electrostatic interactions. Moreover, as reported, the construction of D-π-A architecture would bring about many benefits [57,58,59,60], such as strong ICT effect, large Stokes shift, which is vital to the imaging applications [61,62,63,64], long-wavelength emission, environmental sensitivity, tunable photophysical properties, and even photosensitizing properties, etc. (Scheme 1). Based on the D-π-A structure, a large number of functional materials for applications in fields including probes, organic solar cells, and non-linear optics have been explored. Herein, we intend to introduce positively charged pyridinium unit into the DPAC framework featured with both AIE and VIE characteristics, in the hope of obtaining a D-π-A-structured fluorescent molecular system with efficient red light in the aggregated state, aggregation-promoted photosensitizing ability, and mitochondria-targeting ability. We designed and synthesized pyridinium-modified DPAC derivatives DPAC-PyPF6 and DPAC-D-PyPF6, comparatively studied their photophysical properties and then elaborated their structure–activity relationship with DPAC-Py and DPAC-D-Py as the control compounds. The theoretical and experimental results show that the ICT originated from the D-π-A structure contributes to the separation of HOMO and LUMO, promoting intersystem crossing (ISC), and thus facilitating the photosensitization. DPAC-PyPF6 and DPAC-D-PyPF6 both showed large Stokes shifts greater than 200 nm, solvent-dependent absorption and emission, AIE characteristics, efficient aggregated-state red fluorescence, aggregation-boosted photosensitization and mitochondria-specificity which demonstrated their potential for biomedical applications (Scheme 2).

2. Results and Discussion

2.1. Rational Design and Facile Synthesis of the DPAC Derivatives

In DPAC-PyPF6 and DPAC-D-PyPF6, the DPAC framework is supposed to function as the AIE plus VIE unit. The introduction of the pyridinium group is for one thing to form D-π-A structure which can enhance the ICT effect, promote the ISC process, reduce the ΔEST and therefore enhance the efficiency of ROS generation, and for another to afford the cationic DPAC derivatives and further achieve the mitochondria-targeting capability. In the meantime, the absorption, emission, photosensitizing ability, and mitochondria-specificity is envisaged to be tuned by the structural modulation. DPAC-PyPF6, DPAC-D-PyPF6, and their corresponding control compounds DPAC-Py and DPAC-D-Py were facilely synthesized (Scheme S1). The critical intermediate compound DPAC-Br is synthesized referring to the previous literature [65]. DPAC-Py was obtained through the Suzuki coupling reaction between DPAC-Br and the 4-pyridylboronic acid, while the DPAC-D-Py was produced via the Heck reaction of DPAC-Br and the 4-vinylpyridine. Finally, DPAC-PyPF6 and DPAC-D-PyPF6 were obtained after the salification of the pyridine group in DPAC-Py and DPAC-D-Py, respectively. These compounds were fully characterized by 1H NMR, 13C NMR, and high-resolution mass spectrometry (HRMS) (Figures S1–S12).

2.2. Single-Crystal Structures of the DPAC Derivatives

The single crystals of DPAC-Py and DPAC-PyPF6 have been successfully obtained by slowly diffusing hexane into the tetrahydrofuran (THF) solutions of DPAC-Py and DPAC-PyPF6, respectively. The detailed structure parameters of these single crystals are summarized in Figures S13 and S14, and Table S1. Similar to the parent structure, namely the DPAC core, the single-crystal structures of DPAC-Py and DPAC-PyPF6 suggest that they are both saddle-shaped, and the dihedral angles of the central phenazine ring are 140.48° and 141.05°, respectively (Figures S13 and S14). The torsion angels of DPAC-Py are −39.04°, 19.94° and −24.91°, while those of DPAC-PyPF6 are −31.60°, 40.49° and −32.93°, manifesting that they all adopt highly twisted conformations. The greatly distorted conformation can help to avoid the formation of π–π stacking, which can result in efficient emission in the confined states. As suggested by the single-crystal-structure of DPAC-Py, there are four molecules in one unit crystal cell, and multiple intramolecular C–H···π interactions (3.140–3.594 Å), intermolecular C–H···N interactions (3.541 Å and 3.586 Å), and C–H···π interactions (2.692–3.581 Å) between the adjacent molecules. Likewise, in the single-crystal-structure of DPAC-PyPF6, there are eight molecules in one unit cell, and the multiple intramolecular C–H···π interactions (3.049–3.570 Å), intermolecular C–H···π interactions (2.698–3.513 Å) and C–H···F interactions (2.395–2.688 Å) can be seen, but no obvious π–π stacking can be observed.

2.3. Photophysical Properties of the DPAC Derivatives

2.3.1. Solvatochromic Effect

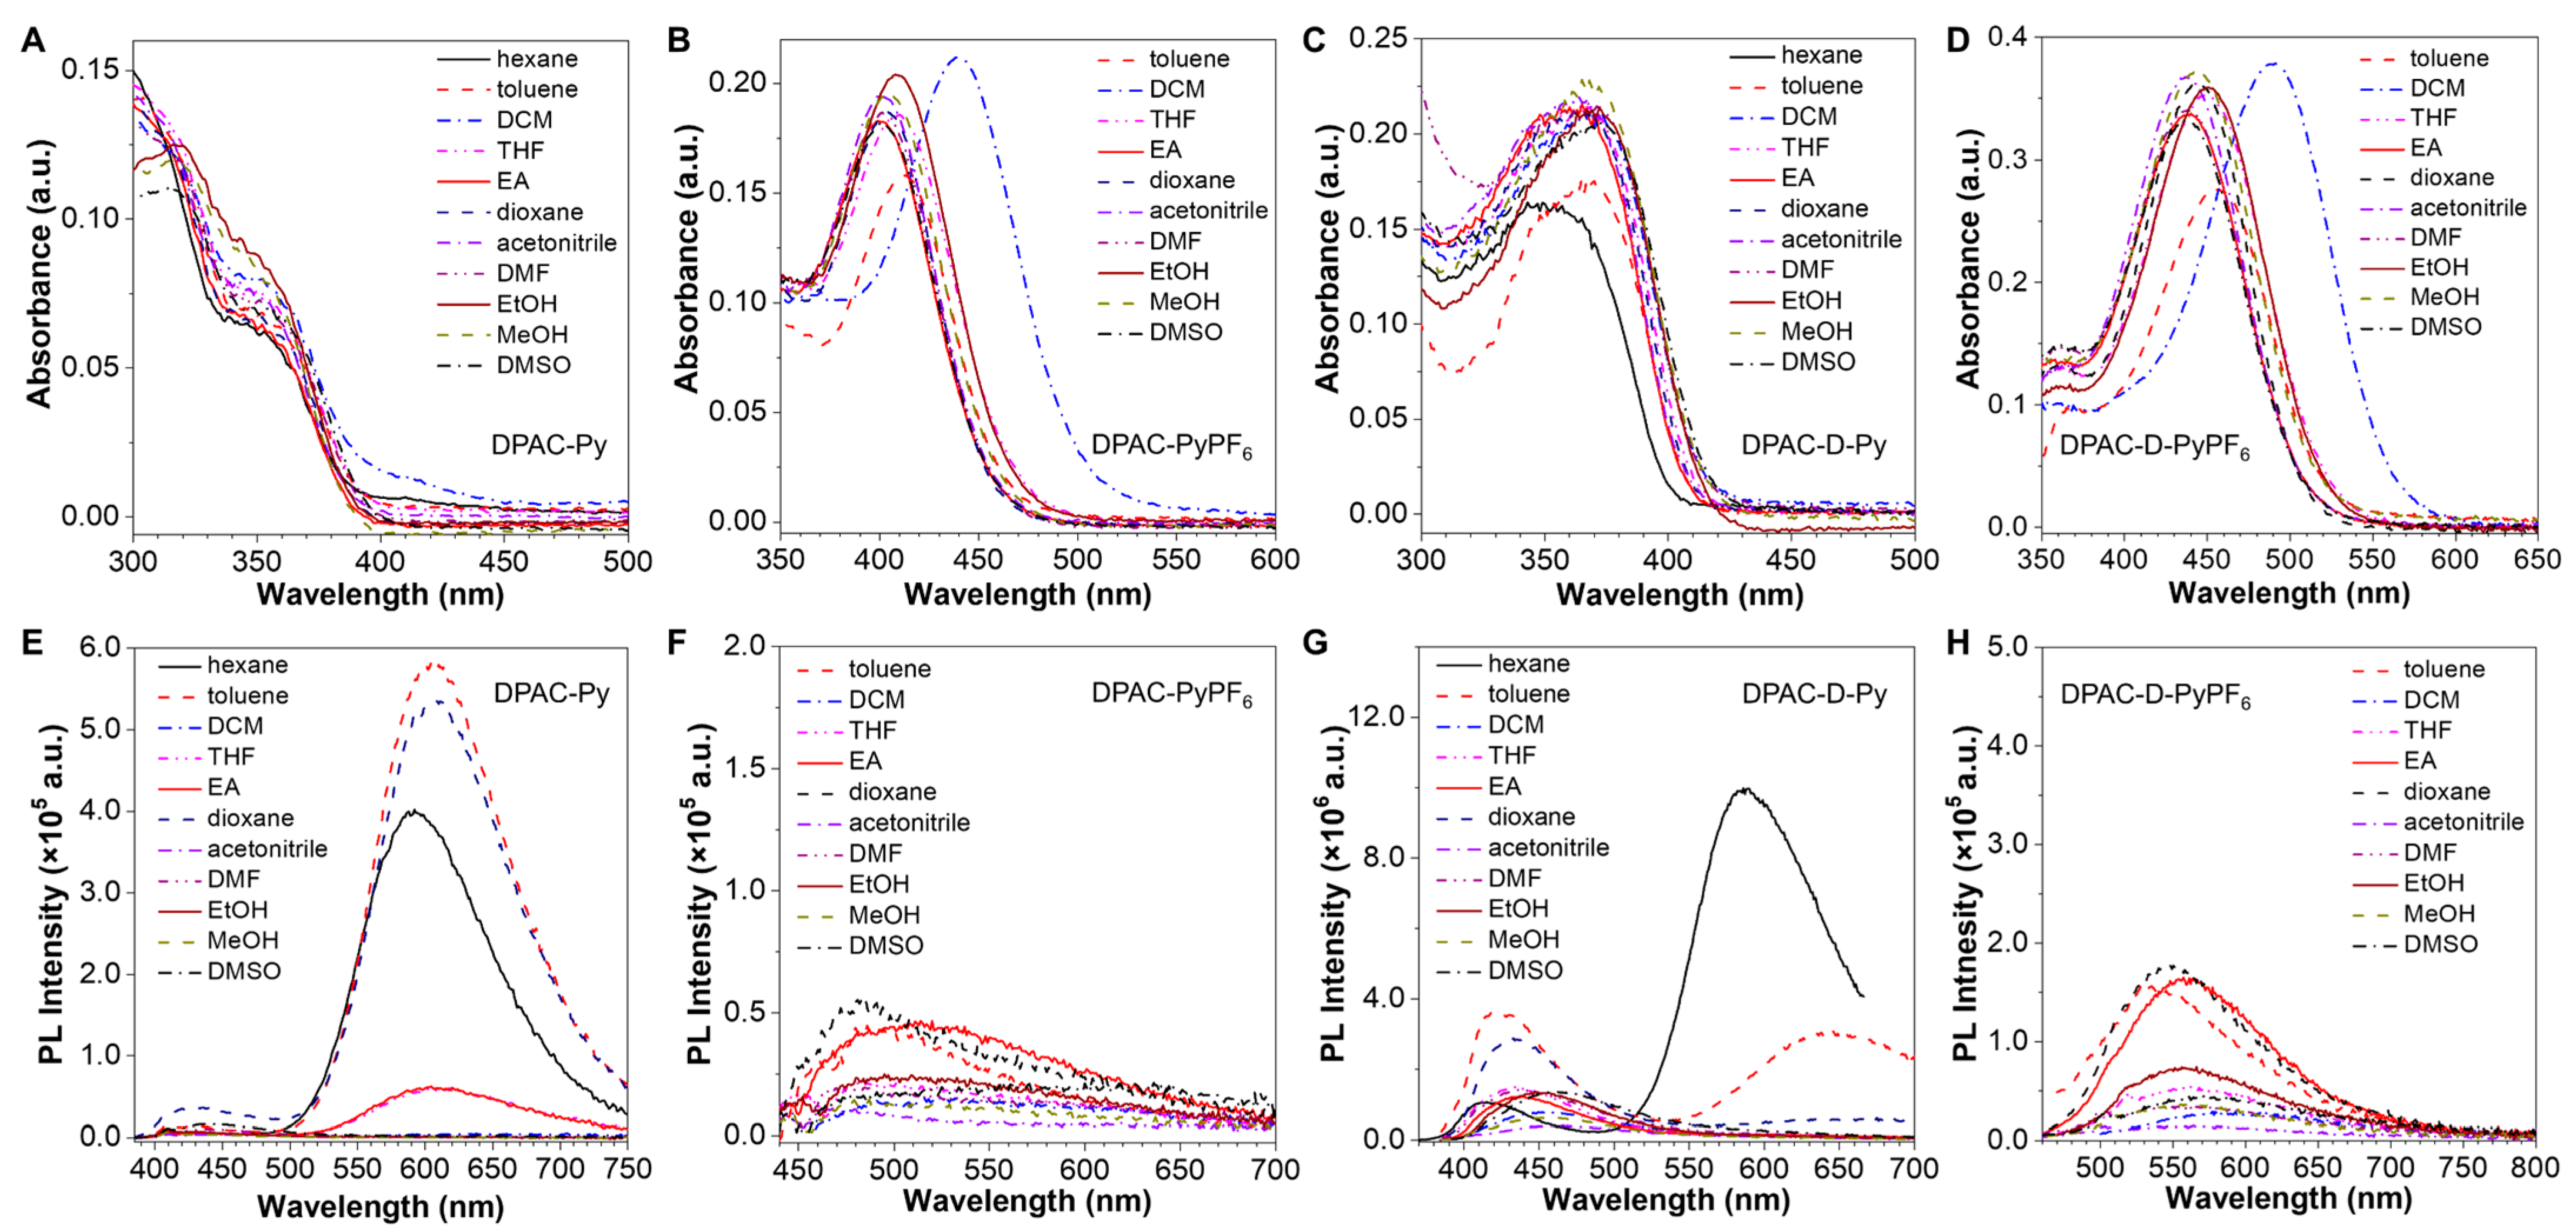
In the light of the D-A structures of these DPAC derivatives, especially DPAC-PyPF6 and DPAC-D-PyPF6, we firstly tested their solvatochromic effect. The absorption maxima of DPAC-Py in different solvents are around 365 nm (Figure 1A), which are consistent with the absorption maximum of DPAC. However, the absorption maxima (λabss) of DPAC-PyPF6 in different solvents are longer than 390 nm, suggestive of an obvious bathochromic shift after the salification. As the solvent polarity increases, the λabs red shifts from 398 nm (in ethyl acetate (EA)) to 409 nm (in ethanol (EtOH)). It might be because there is an ICT process between the electron-rich DPAC group and the electron-withdrawing pyridinium group, resulting in the significant bathochromic shift in the λabs with the increasing polarity of solvent (Figure 1B). With the introduction of the vinyl group, the absorption maxima of DPAC-D-Py in different solvents are around 375 nm, which are obviously bathochromic compared to those of DPAC-Py. It is because the vinyl group increases the overall length of π-conjugation (Figure 1C). Similarly, the λabs of DPAC-D-PyPF6 is red-shifted as compared to that of DPAC-PyPF6, and the λabss of DPAC-D-PyPF6 in different solvents are longer than 430 nm. Clearly, after the salification, the λabss of DPAC-D-PyPF6 are also bathochromic as compared to those of DPAC-D-Py. With the increase of solvent polarity, the λabs of DPAC-D-PyPF6 red-shifts from 438 nm (in EA) to 450 nm (in EtOH), which is might also due to the ICT effect (Figure 1D).
DPAC-Py exhibits red fluorescence in solvents with low polarity (λem ≈ 610 nm) and orange-red fluorescence in the dispersed state (λem = 590–600 nm), which is consistent with the VIE characteristics of the parent DPAC. However, the fluorescence emissions are much weaker in solvents with high polarity as compared to those in the solvents with low polarity, which might be due to the quenching of fluorescence by the ICT effect (Figure 1E). The fluorescence emissions of DPAC-PyPF6 in different solvents are very weak. This is possibly because the low-polarity solvent has poor solubility to DPAC-PyPF6, which leads to the severe inner-filter effect. As for the situation in high-polarity solvents, the fluorescence quenching is probably due to the strong ICT effect (Figure 1F). DPAC-D-Py exhibits dual emissions, i.e., orange-red and blue fluorescence, in hexane, toluene, and DCM (Figure 1G). It might be because the intramolecular vibrations of the phenazine unit are partially hindered, which leads to the appearance of blue fluorescence. Such a result suggests the more rigid conformation of DPAC-D-Py as compared to DPAC-Py. Meanwhile, DPAC-D-Py merely shows blue but weak fluorescence in other solvents, which might be due to the fluorescence quenching originating from the ICT effect. Like DPAC-PyPF6, DPAC-D-PyPF6 shows weak fluorescence emission in different solvents (Figure 1H), which might also be ascribed to the intense ICT effect.

2.3.2. AIE/VIE Properties

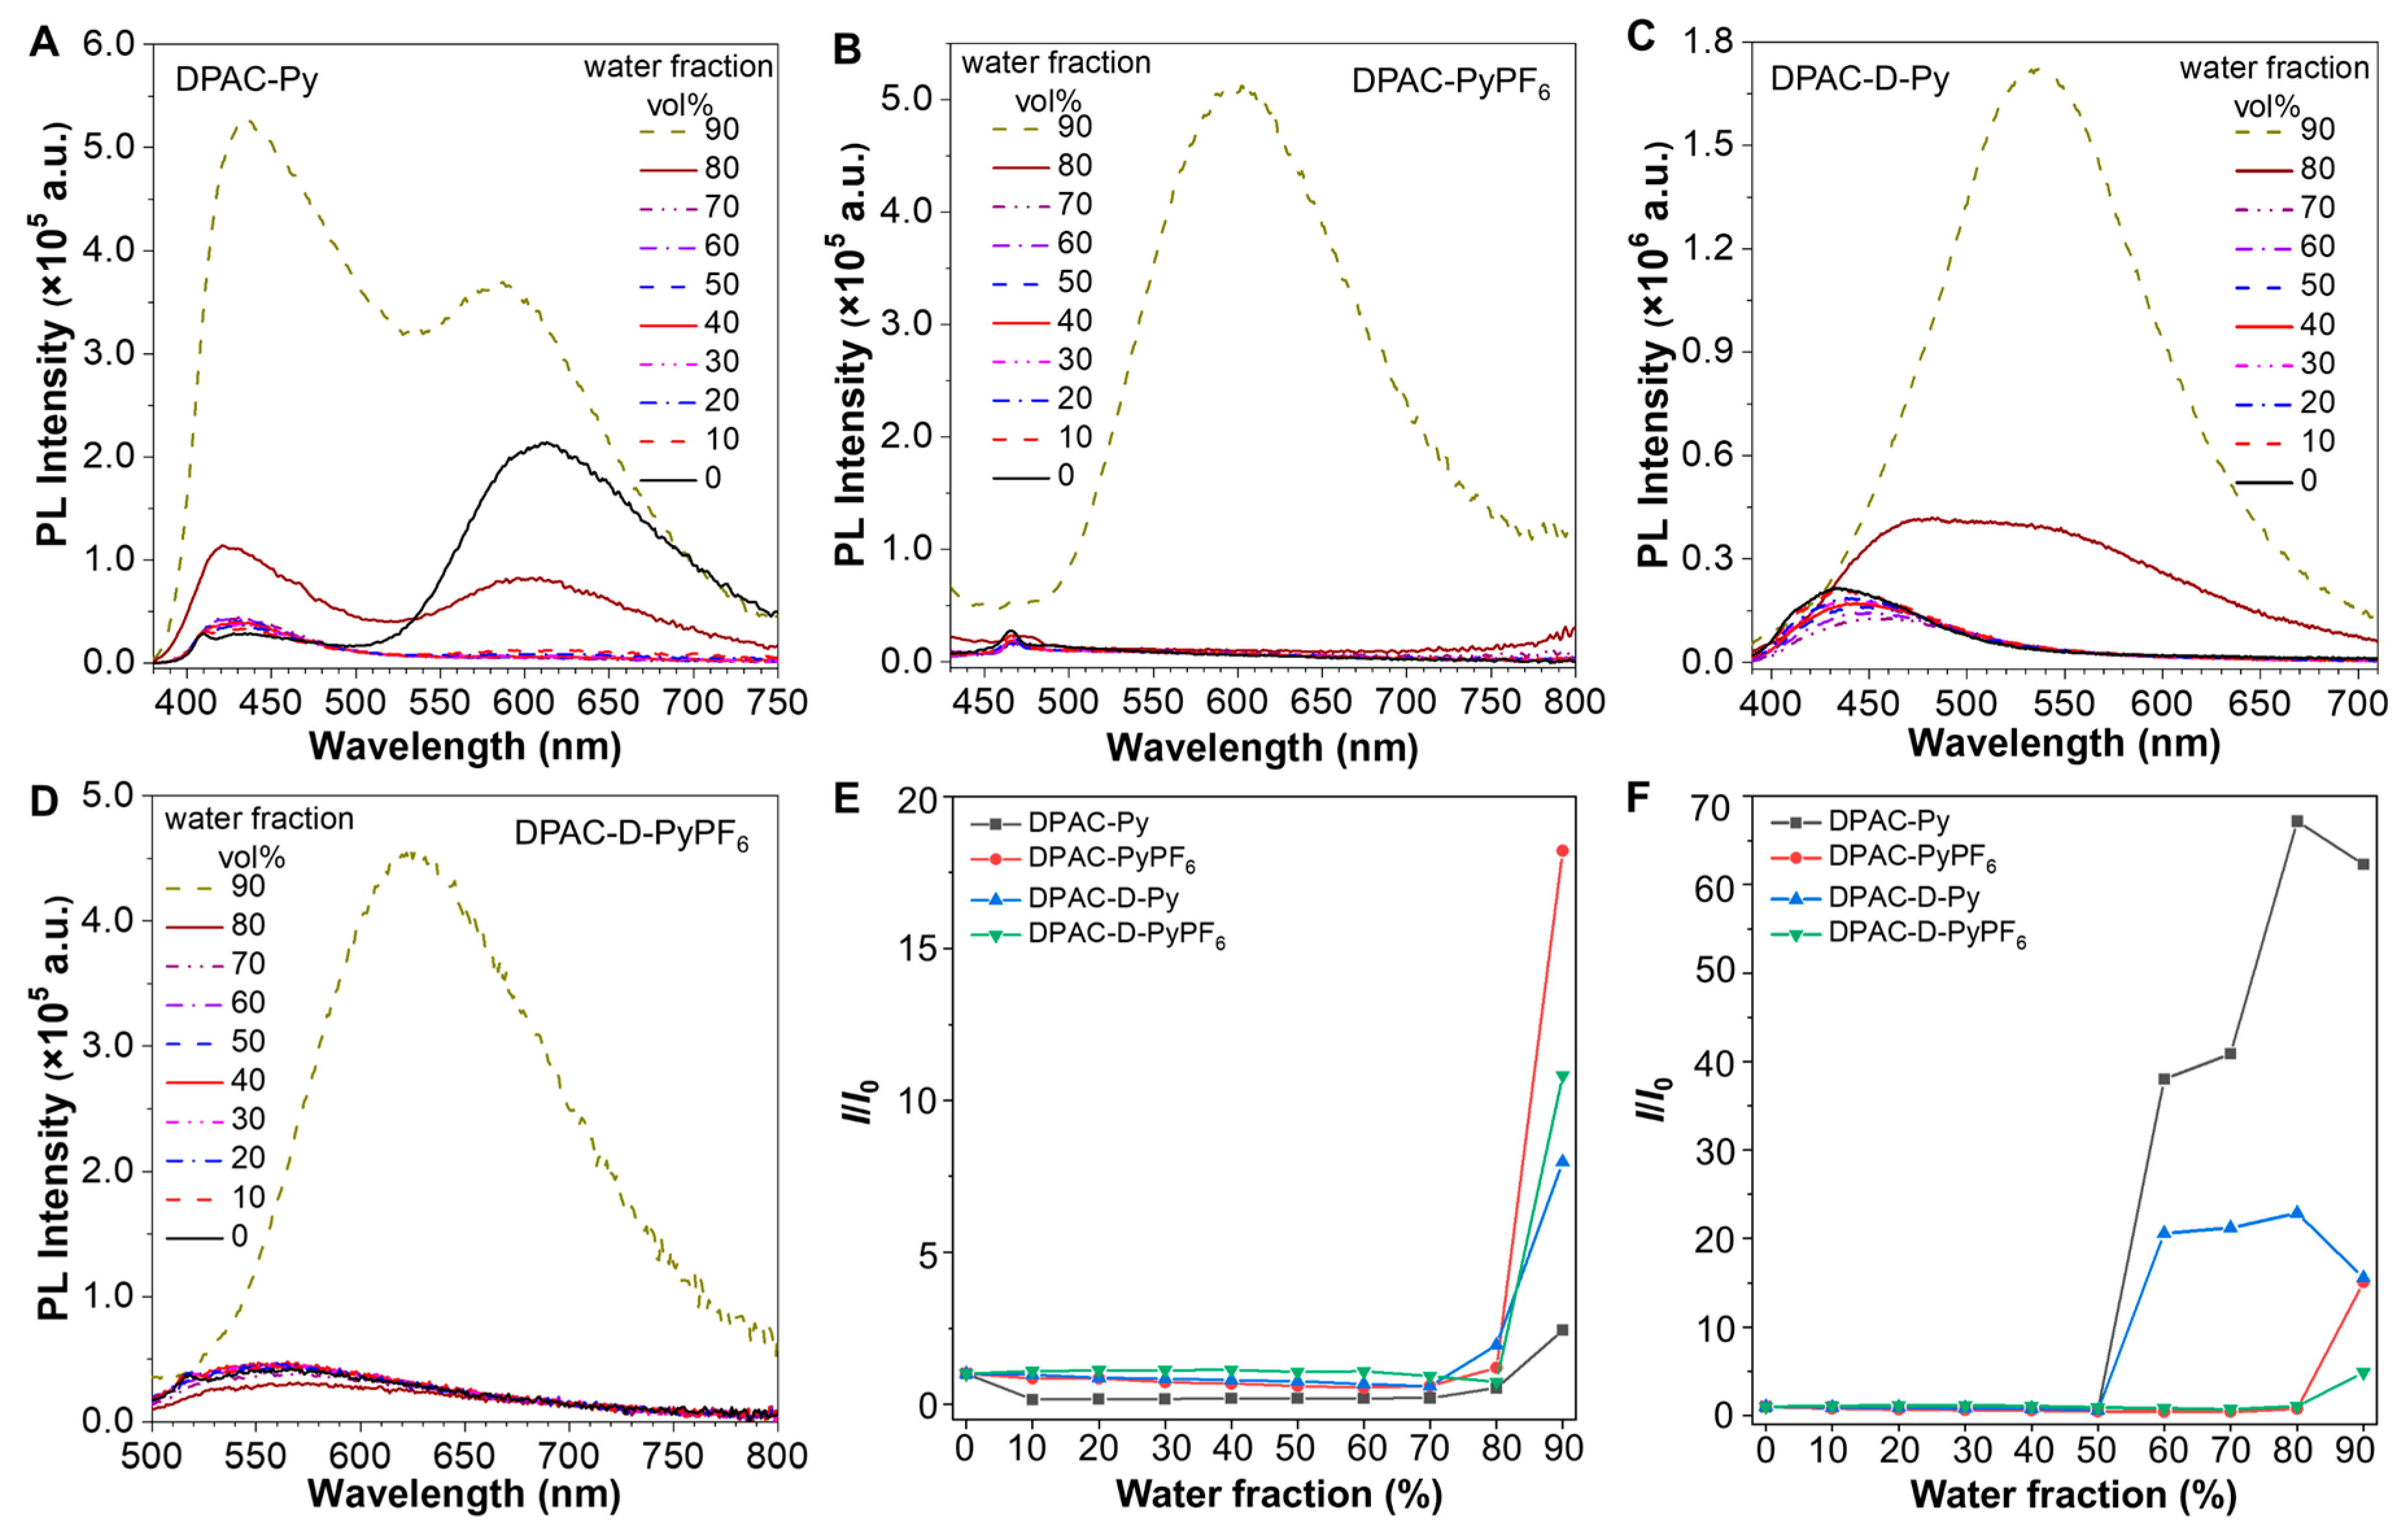
As discussed above, DPAC is a protype VIE fluorophore and moreover its structure follows the restrictions of the intramolecular motions (RIM) principle, thus we tested the AIE/VIE performance of these four DPAC derivatives. We first investigated their fluorescence behaviors in the classical binary solvent system used for the evaluation of AIE behaviors, i.e., tetrahydrofuran (THF)/water. DPAC-Py exhibits dual emissions in THF before water is added (Figure 2A). After the addition of increasing amounts of water (<80 vol%), the red fluorescence emission disappears first. It might be because the water addition causes the increase in solvent polarity which quenches the red light. When the water content reaches 80 vol%, the orange-red emission reappears again and increases with the blue emission simultaneously. Further enhancement of these dual emissions is achieved when the water content is 90 vol%. The fluorescence enhancement when the water content arrives at 80 vol% might be due to the aggregation which restricts the intramolecular motions and activates the AIE process. DPAC-PyPF6 exhibits extremely weak emission in the blue light region THF, but intense orange-red emission in the THF/water mixture when the water content is up to 90% (Figure 2B), suggesting the remarkable AIE effect. Similarly, DPAC-D-Py and DPAC-D-PyPF6 merely emit weak blue fluorescence in the THF solution. On the contrary, when the water fraction is 80 vol%, DPAC-D-Py exhibits moderate greenish-blue emission while strong green light when the water fraction (fw) reaches 90 vol% (Figure 2C). Analogue to DPAC-PyPF6, DPAC-D-PyPF6 is quite weakly blue-emissive in THF but displays very intense red emission at 90 vol% of water content (Figure 2D). As revealed by the plots of I/I0 versus fw depicted in Figure 2E, these four DPAC derivatives are all AIE-active (Figure 2E). The results of the corresponding UV-Vis absorption spectra (Figure S15), dynamic light scattering (DLS, Figure S16) and transmission electron microscope (TEM, Figure S17) further prove the formation of aggregates and the AIE properties (Table 1).
To further demonstrate the AIE properties considering the further bioapplications, their fluorescent behaviors were investigated in the mixtures of DMSO/water with different water fractions. In the DMSO solution, all these DPAC derivatives are very weakly fluorescent. In the DMSO/water system, DPAC-Py exhibits blue fluorescence peaked at 474 nm with the water content increasing from 60 vol% to 80 vol% (Figure S18A). The emission of DPAC-Py at 90 vol% is slightly weaker than that at 80 vol% which might be due to the inner filter effect. As for DPAC-PyPF6, it shows an intense orange-red emission with the peak at 603 nm only when the water fraction reached 90 vol% (Figure S18B). When the water content is no more than 80 vol%, the fluorescence of DPAC-PyPF6 is also quenched due to the ICT, while when the water content is 90%, DPAC-PyPF6 aggregates and the orange-red emission is greatly enhanced. As the water content arrives at 60 vol%, an intense green emission (λem = 517 nm) of DPAC-D-Py emerges and gets slightly enhanced when the water fraction further increases to 70 vol% and then to 80 vol% (Figure S18C). It might be because of the inner filter effect. The fluorescence at 90 vol% becomes lower than 60 vol%. Similar to DPAC-PyPF6, DPAC-D-PyPF6 almost displays no emission until the water content reaches 90 vol% (Figure S18D), with the fluorescence maximum at 634 nm. As such, the AIE characteristics of these four DPAC derivatives are further reflected by the plots shown in Figure 2F. It can be seen that the high polarities of the DMSO and DMSO/water mixtures exert a remarkable quenching effect on the VIE band of the DPAC moiety. The emission maximum increases from DPAC-Py to DPAC-D-Py to DPAC-PyPF6 and then to DPAC-D-PyPF6, as a result of the elongation of the π-conjugation and the enhancement of the ICT effect.
To exclude the effect of water, we switched the binary solvent system from aqueous solutions to the THF/hexane mixtures (Figure S19). DPAC-Py and DPAC-PyPF6 were used as models for this measurement. The THF solution of DPAC-Py displays weak dual emissions, showing typical VIE effect. With the addition of hexane, DPAC-Py is always dual-emissive, and the orange-red emission at 600 nm increases gradually (Figure S19A). It might be because DPAC-Py is well-dissolved in hexane and the low polarity of hexane inhibits the emission quenching of the VIE band. As for DPAC-PyPF6, the case in THF/hexane system is similar to those in THF/water and DMSO/water. It shows almost no emission in the THF/hexane mixture with the hexane fraction lower than 80 vol%, and intensively emits when the hexane fraction reaches 80 vol% (Figure S19B). It is clear that DPAC-PyPF6 is insoluble in hexane. Due to the strong ICT effect, the emission of DPAC-PyPF6 is very weak in the solution state, while the large amount of hexane added caused aggregation of DPAC-PyPF6 and the AIE effect was shown. Moreover, possible binary good/poor solvent systems including nonpolar, polar aprotic, and polar protic solvents were also applied to systematically investigate the photophysical behaviors of DPAC-Py and DPAC-PyPF6 (Figures S20–S23). The results further prove the AIE feature and the polarity sensitivity of the VIE band of the DPAC moiety.

2.3.3. Solid-State Emission Behaviors

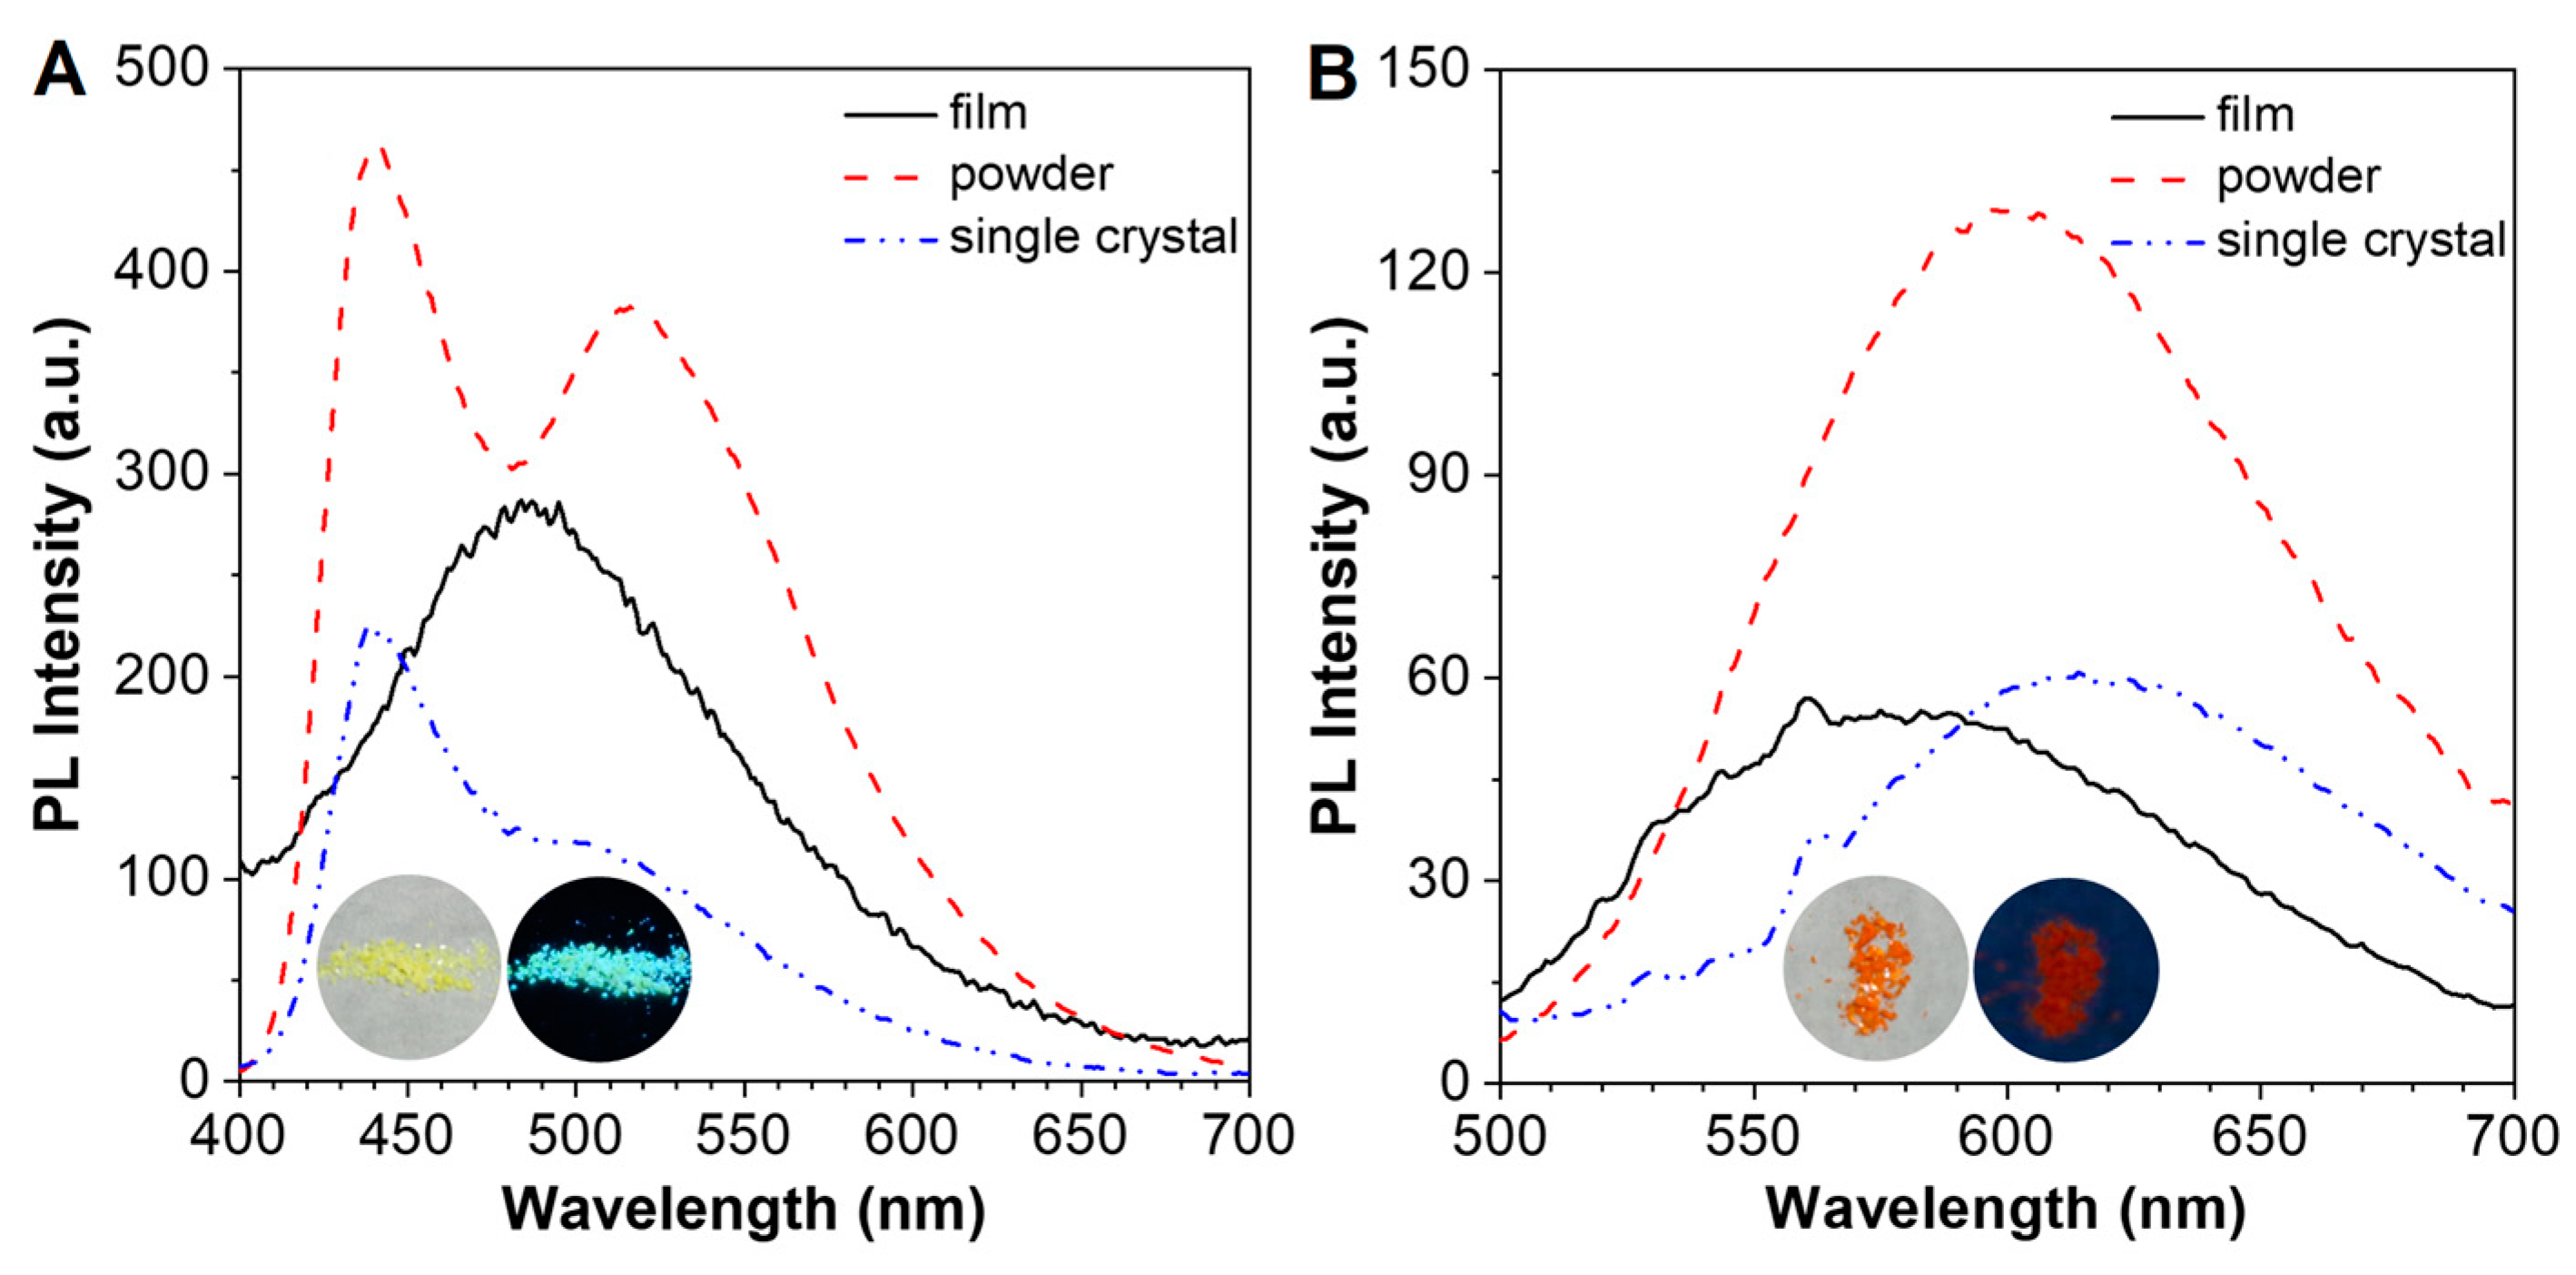
Subsequently, we tested the solid-state excitation (Figure S24), absorption (Figure S25), and emission properties (Figure 3A) of these four molecules. The powder of DPAC-Py exhibits a remarkable dual-emission with the blue light (@442 nm) slightly stronger than the green light (@516 nm). The single crystal of DPAC-Py also shows dual-emission, but the blue fluorescence (440 nm) is overwhelmingly more intense than the green light (497 nm). In the thin film state, DAPC-Py fluorescent green light peaked at 490 nm. The differences of the excitation, absorption, and emissions of DPAC-Py at different states are supposed to be associated with the packing mode and compactness. In other words, the more compact the molecular packing, the bluer the light. The DPAC-Py molecules in the single crystal are more compactly packed as compared to those in the powder and film state and hence the corresponding emission is bluer. Moreover, the powders might contain multiple phases, while the film is more homogeneous and hence displays a broad emission band. As for DPAC-PyPF6, both the powder and the single crystal mainly exhibit a single red-fluorescence band situated at 602 and 615 nm, respectively (Figure 3B), which is consistent with that of the aggregated state discussed above. The film of DPAC-PyPF6 is orange fluorescent with the emission maximum at 585 nm (Figure 3B). The red-shift in the emission maximum of the single crystal and powder of DPAC-PyPF6 as compared to its film might be due to the more compact molecular packing which facilitates the intermolecular interaction. The film of DPAC-D-Py is greenish-yellow emissive with multiple shoulder peaks, reflecting the various conformations of DPAC-D-Py in the film state (Figure 3C). The emission maximum of the powders of DPAC-D-Py is at 537 nm and consistent with that of the aggregated state which was mentioned above (Figure 3C). The emission of DPAC-D-PyPF6 in the film state is very weak due to its strong ICT effect and relatively loose packing. In contrast, the powder-state emission of DPAC-D-PyPF6 is peaked at 631 nm and much stronger than that of the film, which agrees with that of the aggregated state discussed above (Figure 3D). The images of these four compounds at different states taken under daylight and UV light are consistent with the spectral results (Figure 3E and the insets of Figure 3A,B).

2.4. Electrochemical Properties and the ICT Effect of the DPAC Derivatives

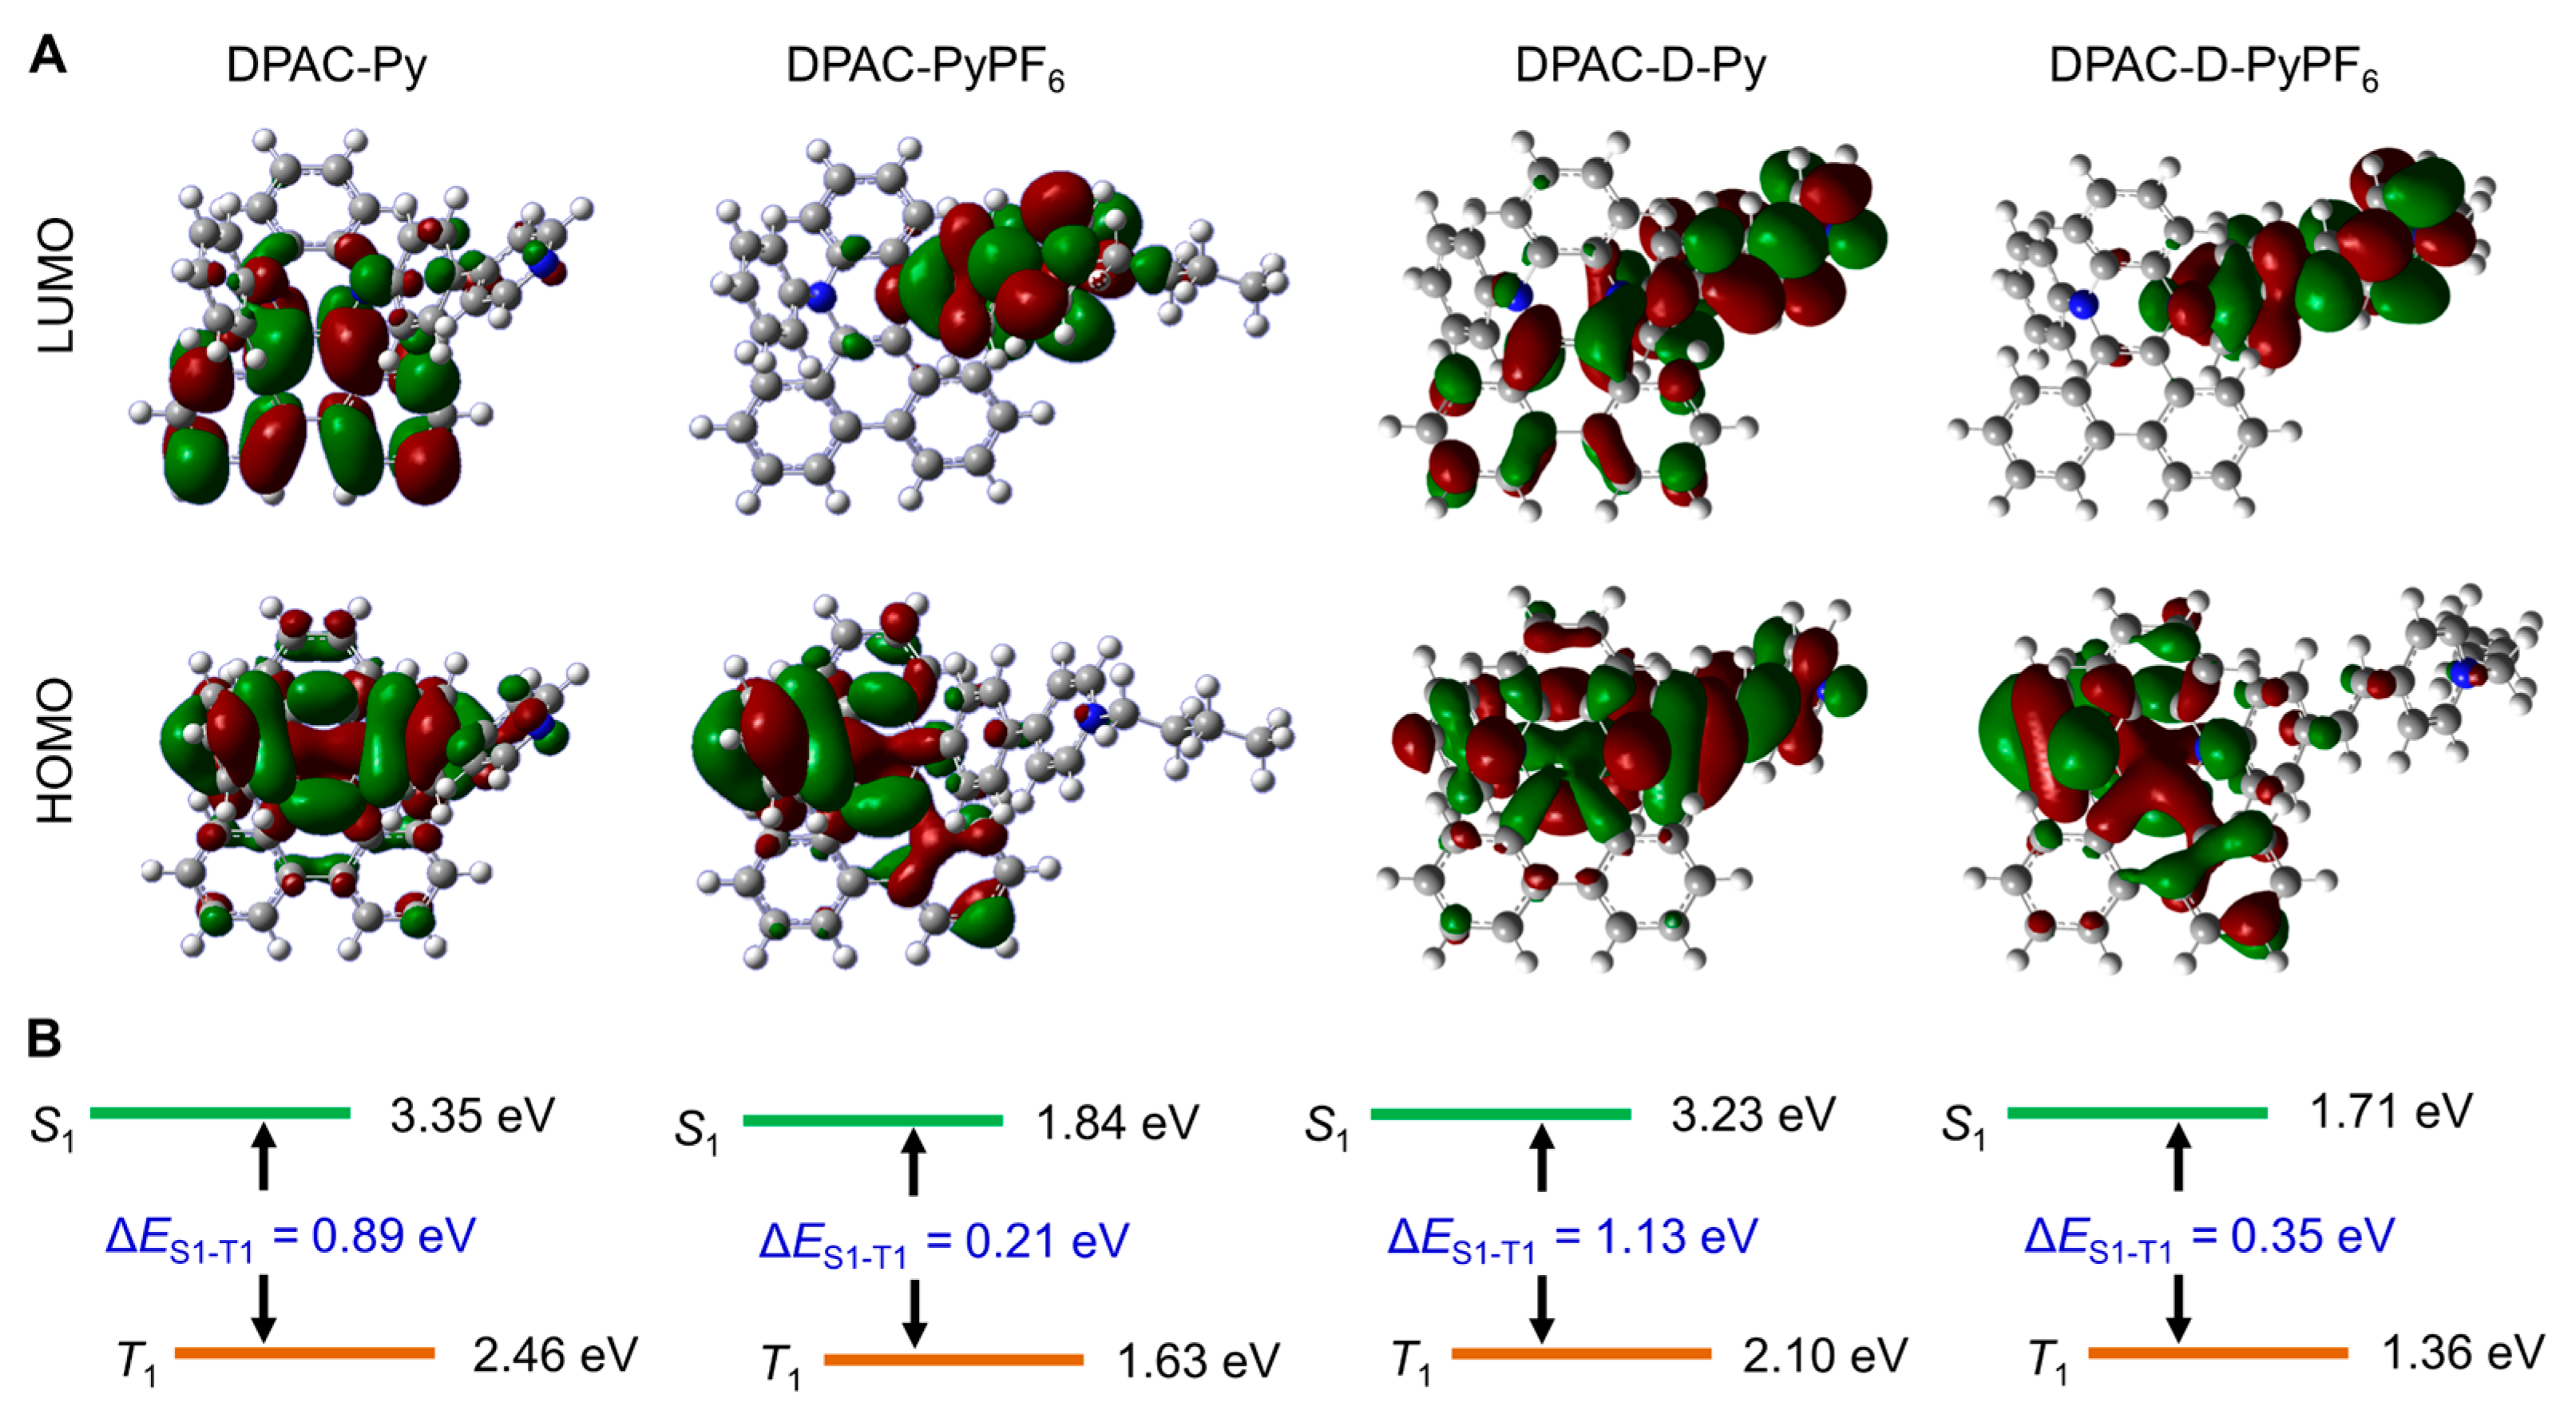
To fully understand the structure–property relationship of these compounds, the HOMOs and LUMOs of these four compounds were investigated by cyclic voltammetry and the TD-DFT calculations (Figure S26 and Figure 4), with the corresponding results summarized in Table 2. The HOMO energy levels of DPAC-Py, DPAC-PyPF6, DPAC-D-Py, and DPAC-D-PyPF6 determined by the cyclic voltammetry are around −5.00 eV, while the optical band gaps (Eg) were calculated to be 3.09, 2.46, 2.96 and 2.30 eV, respectively. The Egs estimated with the equation of hc/λ are 3.72, 3.18, 3.55, and 2.90 eV, while the ones calculated via TD-DFT method are 3.83, 2.08, 3.52, and 1.90 eV for DPAC-Py, DPAC-PyPF6, DPAC-D-Py, and DPAC-D-PyPF6, respectively. Obviously, the change of pyridinyl to the pyridinium group narrows the energy gap between HOMO and LUMO. Moreover, the vinyl group in the DPAC-D-Py and DPAC-D-PyPF6 results in the elongation of the π-conjugation as compared to DPAC-Py and DPAC-PyPF6, and hence gives rise to the decrease in Eg.
The electron clouds of the HOMO of DPAC-Py are mainly distributed on the diphenyl-substituted phenazine unit, and those of the LUMO are mainly situated on the phenanthrene ring, exhibiting a “vertical” intramolecular charge transfer (Figure 4A). The HOMO of DPAC-PyPF6 is mainly distributed on the benzene ring, phenazine group, and part of the phenanthrene ring, and the LUMO is mainly distributed on the other benzene ring linked to the phenazine and the pyridinium group, displaying a “horizontal” ICT. Moreover, both the HOMO and LUMO show obvious charge separation, indicating the strong D-A effect in DPAC-PyPF6. The electron clouds of the HOMO of DPAC-D-Py are mainly distributed on the central diphenyl-decorated six-membered heterocycle and the 4-vinylpyridine group, while the electron clouds of the LUMO is mainly dispersed on the phenanthrene ring and the 4-vinylpyridine group. It is clear that both the ground state and the excited state of DPAC-D-Py have charge separation, and moreover, when excited, the charges transfer “vertically” from the diphenyl-substituted phenazine group to the phenanthrene ring. It is similar to the case of DPAC-Py. Analogous to the other three DPAC derivatives, DPAC-D-PyPF6 also has a remarkable charge transfer, both at the ground state and the excited state. The HOMO of DPAC-D-PyPF6 is mainly contributed by the benzene ring, the six-membered heterocyclic ring and part of the phenanthrene ring, while the LUMO is mainly distributed on the other benzene group and 4-vinylpyridinium group. It thus can be seen that quite similar to that of DPAC-PyPF6, there is a dramatic “horizontal” ICT in DPAC-D-PyPF6. The HOMO and LUMO energy levels were also calculated based on the single crystal structures of DPAC-Py and DPAC-PyPF6 and the results are in good agreement with those obtained from the optimized structures (Figure S27). It is worth mentioning that the energy gap between S1 and T1EST) of DPAC-Py, DPAC-PyPF6, DPAC-D-Py, and DPAC-D-PyPF6 is 0.89, 0.21, 1.13, and 0.35 eV (Figure 4B), respectively, agreeing well with the above discussions. The electrochemical measurements and the DFT calculations have provided good explanations of the photophysical properties.

2.5. ROS-Generating and Mitochondria-Targeting Abilities of the DPAC Derivatives

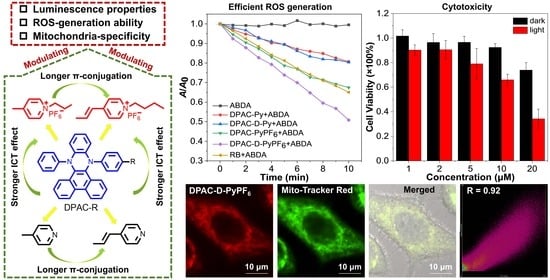
It is known that the remarkable ICT effect and the relatively small ΔEST values (Figure 4B) usually imply the ability to generate reactive oxygen species (ROS). In view of this, we used 9,10-anthracene-bis(methylene) dimalonic acid (ABDA) as the 1O2 indicator to test the ROS-generating ability of these four DPAC derivatives (Figure 5A–C and Figures S28–S30). When the DPAC derivatives are irradiated with white light, the absorbance of ABDA at 378 nm decreases dramatically, suggesting the generation of 1O2. Compared with the commercial photosensitizer, Rose Bengal (RB), it can be seen that the photosensitizing capability of DPAC-D-PyPF6 is better than that of RB, while the photosensitizing abilities of DPAC-Py, DPAC-D-Py, and DPAC-PyPF6 are worse than that of RB. The good photosensitizing properties of DPAC-D-PyPF6 can be ascribed to the change from pyridine to pyridinium and the introduction of the vinyl group. For one thing, the salification of the pyridine group enhanced the ICT effect and thus promoted the ISC, which is conducive to the ROS production. For another, the vinyl group elongated the π-conjugation length. Due to the strongest ICT and longest π-conjugation, DPAC-D-PyPF6 has the longest absorption wavelength, causing it to have the best absorbing ability of white light among all of these four DPAC derivatives. Subsequently, we tested the ROS-producing ability of DPAC-PyPF6 and DPAC-D-PyPF6 under different aggregated states (Figure 5B,C, Figures S29 and S30). With the increase in water content, their ability to generate ROS was gradually enhanced, indicating that aggregation was conducive to the generation of ROS. The aggregated-state singlet-oxygen quantum yields of DPAC-PyPF6 and DPAC-D-PyPF6 are measured to be 1.27 and 1.18, respectively (Figures S31 and S32), with RB as the reference. Such data further verified the superior photosensitizing capability of DPAC-PyPF6 and DPAC-D-PyPF6 over RB.
Considering the positive charge, large Stokes shift, and good photophysical properties of the pyridinium-furnished DPAC derivatives, we assessed their ability to target mitochondria. MitoTracker Green (MTG) and MitoTracker Red (MTR) were selected as the commercial mitochondria indicators for DPAC-PyPF6 and DPAC-D-PyPF6, respectively (Figure 5D,E andFigure S33). When co-incubated with HeLa cells, DPAC-PyPF6 and DPAC-D-PyPF6 show excellent ability to target mitochondria, with the Pearson coefficient of 0.86 and 0.92, respectively.

2.6. Cytotoxicity of the DPAC Derivatives

Before the evaluation of the cytotoxicity of DPAC-PyPF6 and DPAC-D-PyPF6, we first explored their optimal time taken up by the cells (Figures S34 and S35). After co-incubating the probes with HeLa cells for different times (0.5 h, 1 h, 1.5 h, 2 h, 2.5 h, 3 h), the optimal cellular time taken of DPAC-PyPF6 and DPAC-D-PyPF6 was determined to be 2 h, as indicated by the CLSM results. Subsequently, HeLa cells were incubated with different concentrations of DPAC-PyPF6 and DPAC-D-PyPF6 to assess the cytotoxicity of these two DPAC derivatives (Figure 6). Under the irradiation of white light, the cell survival rate decreases with the increase in the concentration of DPAC-PyPF6 and DPAC-D-PyPF6. It is worth noting that the dark cytotoxicity of these two compounds, especially DPAC-PyPF6 is unignorable. The photocytotoxicity of DPAC-D-PyPF6 is higher as compared to that of DPAC-PyPF6. It is because, as shown in Figure 5A, DPAC-D-PyPF6 has higher ROS generation capability than DPAC-PyPF6. Moreover, the longer absorption wavelength and better absorption of white light of DPAC-D-PyPF6 also contribute to the photocytotoxicity. Pitifully, although the ROS-generation efficiency of DPAC-PyPF6 and DPAC-D-PyPF6 is quite high, their photocytotoxicity is not satisfactory enough. It might be because of the relatively poor cell-penetration ability of white light, or due to the relatively short absorption wavelengths and the inefficient absorption of the white light of DPAC-PyPF6 and DPAC-D-PyPF6. Nevertheless, combing their mitochondrial-targeting ability, dark cytotoxicity and photocytotoxicity, both DPAC-PyPF6 and DPAC-D-PyPF6 have a potential to be used as image-guided dual-therapeutic agents which show the chemotherapy and photodynamic therapy effect.

3. Materials and Methods

3.1. Chemicals and Instruments

All reagents and chemicals used in this work were purchased from commercial suppliers and used without further purification. DPAC-Br was prepared following the previously reported procedures [65]. Mitotracker® Green FM and Mitotracker® Red FM were purchased from Beyotime Biological Company (Shanghai, China). The 1H NMR and 13C NMR spectra were measured by Bruker AM-400 spectrometer (Bruker Technology GmbH, Karlsruhe, Baden-Württemberg, Germany), with 0.03% tetramethylsilane (TMS) as the internal reference and CDCl3 or DMSO-d6 as the solvent. The high-resolution mass spectrometry (HRMS) data were obtained by Waters LCT premier XE spectrometer (Waters Co., Ltd., Milford, MA, USA) and Xevo G2 TOF MS (Waters Co., Ltd., Milford, MA, USA). The UV-Vis absorption spectra were measured by an Agilent Cary 60 UV-Vis spectrometer (Agilent Technologies, Santa Clara, CA, USA), using 1 cm quartz cells. The photoluminescence spectra except the AIE properties evaluation were recorded in 1 cm quartz cells on a fluorescence spectrophotometer (Agilent Cary Eclipse (Agilent Technologies, Santa Clara, CA, USA) or Horiba Fluoromax 4 (HORIBA Scientific, Piscataway, NJ, USA)). The solid-state absorbance spectra were recorded on Shimadzu UV-2600 (Shimadzu, Kyoto, Japan). The AIE measurements were conducted using 1 cm quartz cells on Shimadzu RF-6000 (Shimadzu, Kyoto, Japan). The absolute fluorescence quantum yields were determined on Horiba Fluoromax-4 (HORIBA Scientific, Piscataway, NJ, USA). Dynamic light scatting (DLS) experiments were performed on Zetasizer Nano ZSE (Marvin Panalytical Ltd., Worcestershire, UK). Transmission electron microscopy (TEM) images were obtained by a JEM-1400 biological transmission electron microscope (JEOL Ltd., Tokyo, Japan). The cell imaging experiments were conducted on a Nikon A1R confocal laser scanning microscope (CLSM) (Nikon Corporation of Japan, Tokyo, Japan). The X-ray crystallographic measurements of DPAC-Py and DPAC-PyPF6 were carried out on Bruker D8 Venture (Bruker Technology GmbH, Karlsruhe, Baden-Württemberg, Germany), with the MoKα (λ = 0.71073 Å) and CuKα (λ = 1.54178 Å) as radiation source for DPAC-Py and DPAC-PyPF6, respectively. The results were further analyzed with SHELXL-2013 (Simens (Bruker), Göttingen, Germany).

3.2. Synthesis

The synthetic procedures of DPAC-Py are as follows. The mixture of DPAC-Br (500 mg, 0.976 mmol), pyridine-4-boronic acid (360 mg, 2.929 mmol), K2CO3 (1.935 g, 14.000 mmol), tetrakis(triphenylphosphine)palladium (56 mg, 0.0485 mmol), tetrahydrofuran (THF, 28 mL), and water (7 mL) were put into a two-necked round-bottomed flask. The mixture was kept refluxing with vigorous stirring for 12 h under an atmosphere of nitrogen. After cooling down, the mixed solution was extracted three times with dichloromethane (DCM) and water to obtain a black oily substance. The crude product was purified through column chromatography on silica gels (petroleum ether (PE)/ethyl acetate (EA) = 4/1, v/v) to afford a light green solid (yield: 250 mg, 50.1%). 1H NMR (400 MHz, CDCl3) δ 8.76 (dd, J = 8.3, 3.4 Hz, 2H), 8.51 (s, 2H), 8.11 (d, J = 8.2 Hz, 2H), 7.84–7.73 (m, 2H), 7.68 (td, J = 8.1, 1.2 Hz, 2H), 7.62–7.51 (m, 2H), 7.43–7.29 (m, 6H), 7.08–6.97 (m, 6H), 6.82–6.74 (m, 1H). 13C NMR (100 MHz, CDCl3) δ 149.91, 148.62, 147.92, 147.46, 145.24, 144.15, 138.73, 137.58, 130.20, 130.03, 129.63, 129.45, 129.32, 129.00, 127.77, 127.57, 127.47, 127.30, 127.22, 126.94, 126.85, 126.02, 125.56, 124.88, 124.53, 123.33, 123.23, 121.47, 120.83, 117.11, 116.20. HRMS (ESI-TOF, m/z): [M]+ calcd. for C37H25N3: 512.2127; found: 512.2121.
The synthetic procedures of DPAC-PyPF6 are as follows. The mixture of DPAC-Py (100 mg, 0.196 mmol), 1-iodobutane (1.78 mL (2.848 g), 15.650 mmol) and THF (3 mL) was put into a two-necked round-bottomed flask. The mixture was kept refluxing with vigorous stirring for 4 h under an atmosphere of nitrogen. Yellow solids were precipitated in the solution. After cooling down, the mixture was filtered and washed with THF for several times to collect the yellow solids. The mixture of yellow solids, saturated KPF6 solution (3 mL), and dimethyl sulfoxide (DMSO, 10 mL) were put into another flask. The mixture was kept at 100 °C with vigorous stirring for 2 h under the atmosphere of nitrogen. After cooling down, a large amount of water was added to the flask, and orange-red solids were precipitated out. The mixture was filtered and washed several times with water to collect the orange-red solids (yield: 80 mg, 57.3%). 1H NMR (400 MHz, DMSO-d6) δ 9.00 (dd, J = 8.2, 5.5 Hz, 2H), 8.90 (d, J = 7.0 Hz, 2H), 8.28 (d, J = 7.0 Hz, 2H), 8.09–7.93 (m, 4H), 7.88 (d, J = 9.1 Hz, 2H), 7.83–7.60 (m, 4H), 7.58–7.46 (m, 2H), 7.14–7.01 (m, 6H), 6.84 (dt, J = 8.2, 2.0 Hz, 1H), 4.47 (t, J = 7.3 Hz, 2H), 1.93–1.73 (m, 2H), 1.37–1.16 (m, 2H), 0.90 (t, J = 7.4 Hz, 3H). 13C NMR (100 MHz, DMSO-d6) δ 153.47, 149.93, 146.56, 144.28, 144.08, 142.21, 137.83, 135.77, 129.78, 129.36, 129.29, 129.10, 128.01, 127.77, 127.66, 127.54, 127.42, 127.21, 127.13, 126.68, 125.79, 124.58, 124.05, 123.93, 123.83, 123.44, 122.56, 121.87, 117.34, 115.40, 59.17, 32.44, 18.69, 13.28. HRMS (ESI-TOF, m/z): [M–PF6]+ calcd. for C41H34N3+: 568.2753; found: 568.2768.
The synthetic procedures of DPAC-D-Py are as follows [65]. The mixture of DPAC-Br (500 mg, 0.976 mmol), 4-vinylpyridine (0.21 mL (0.210 g), 1.950 mmol), K2CO3 (163 mg, 1.175 mmol), palladium acetate (22 mg, 0.098 mmol), and DMF (40 mL) were put into a two-necked round-bottomed flask. The mixture was kept refluxing with vigorous stirring for 24 h under an atmosphere of nitrogen. After cooling down and the removal of N,N′-dimethylformamide (DMF) under reduced pressure, the mixed solution was extracted three times with DCM and water to obtain a black oily substance. The crude product was purified through column chromatography on silica gels (PE/EA = 2/1, v/v) to afford a yellow solid (yield: 303 mg, 57.8%). 1H NMR (400 MHz, DMSO-d6) δ 8.96 (d, J = 8.2 Hz, 2H), 8.47 (d, J = 5.7 Hz, 2H), 8.02–7.89 (m, 4H), 7.78–7.68 (m, 2H), 7.63 (dd, J = 16.0, 8.1 Hz, 2H), 7.49–7.40 (m, 4H), 7.35 (dd, J = 12.6, 7.9 Hz, 3H), 7.13–6.90 (m, 7H), 6.82 (t, J = 7.0 Hz, 1H). 13C NMR (100 MHz, CDCl3) δ 149.30, 148.09, 147.35, 145.73, 145.06, 144.03, 138.53, 137.46, 133.32, 130.02, 129.86, 129.32, 129.17, 128.86, 128.33, 127.87, 127.57, 127.44, 127.10, 126.73, 125.83, 125.40, 124.71, 124.41, 123.12, 122.82, 121.31, 120.64, 116.92, 115.84. HRMS (NSI–TOF, m/z): [M]+ calcd. for C39H28N3: 538.2278; found: 538.2263.
The synthetic procedures of DPAC-D-PyPF6 are as follows. The mixture of DPAC-D-Py (100 mg, 0.1861 mmol), 1-iodobutane (1.69 mL (2.704 g), 14.694 mmol), and THF (3 mL) were put into a two-necked round-bottomed flask. The mixture was kept refluxing with vigorous stirring for 4 h under an atmosphere of nitrogen. Yellow solids were precipitated out in the solution. After cooling down, the solution was filtered and washed with THF for several times to collect the orange-red solids. The mixture of orange-red solids, saturated KPF6 solution (3 mL), and DMSO (10 mL) were put into another flask. The mixture was kept at 100 °C with vigorous stirring for 2 h under an atmosphere of nitrogen. After cooling down, a large amount of water was added to the flask, and red solids were precipitated out. The mixture was filtered and washed several times with water to collect red solids (yield: 65 mg, 47.2%). 1H NMR (400 MHz, DMSO-d6) δ 8.99 (d, J = 6.9 Hz, 2H), 8.83 (d, J = 6.3 Hz, 2H), 8.09 (d, J = 6.4 Hz, 2H), 7.98 (d, J = 8.0 Hz, 4H), 7.89–7.57 (m, 5H), 7.47 (d, J = 8.3 Hz, 4H), 7.19 (d, J = 16.1 Hz, 1H), 7.06 (dt, J = 17.5, 8.5 Hz, 6H), 6.84 (t, J = 6.7 Hz, 1H), 4.43 (t, J = 7.2 Hz, 2H), 1.93–1.76 (m, 2H), 1.28 (dd, J = 14.6, 7.2 Hz, 2H), 0.91 (t, J = 7.3 Hz, 3H). 13C NMR (100 MHz, DMSO-d6) δ 153.08, 148.62, 146.78, 144.30, 143.85, 142.80, 140.61, 137.69, 136.22, 129.69, 129.43, 129.38, 129.03, 128.11, 127.95, 127.53, 127.46, 127.38, 127.25, 127.12, 126.38, 125.78, 123.92, 123.82, 123.76, 123.55, 123.13, 121.74, 120.25, 117.27, 115.62, 59.22, 32.42, 18.75, 13.29. HRMS (ESI-TOF, m/z): [M–PF6]+ calcd. for C43H36N3+: 594.2909; found: 594.2907.

3.3. Density Functional Theory (DFT) Calculations

The optimized geometries and the energy levels of the DPAC derivatives were obtained with the density functional theory (DFT) method and a B3LYP/6-31+G* basis set using the Gaussian 09 package. The theoretical calculations based on the single-crystal structures of DPAC-Py and DPAC-PyPF6 were implemented with a RB3LYP/6-31G(d) basis set using the Gaussian 09 package [66].

3.4. Cyclic Voltammetry Experiments

The cyclic voltammetry experiments were conducted on a CH Instruments Model 1200B (CH Instruments, Inc., Austin, TX, USA) electrochemical workstation using a conventional three-electrode configuration. The glassy carbon, Pt wire, and calomel in the saturated KCl solution were applied as a working electrode, counter electrode, and reference electrode, respectively. The redox potentials were measured in the THF solution containing 1.0 mM of the DPAC derivative and 0.1 M tetra-n-butylammonium hexafluorophosphate (TBAPF6) as the supporting electrolyte. The cyclic voltammetry grams were recorded at a scanning rate of 0.1 V/s after deoxygenizing the solution with nitrogen.

3.5. Reactive Oxygen Species (ROS) Detection in Solution

The 9,10-Anthracenediyl-bis(methylene)-dimalonic acid (ABDA, 50 μM) and a DPAC derivative (10 μM) were added into 10 mL of DMSO/water (v/v = 1/99) mixture. Upon irradiation with white light for different time periods, the absorption spectra of ABDA were measured. The relative absorption intensity (A/A0) at 378 nm versus irradiation time was then recorded. Besides, the ROS-generating capability of Rose Bengal (RB) which is used as the control was tested under the same experimental conditions. Here, ABDA works as a singlet oxygen indicator.
Similarly, ABDA (50 μM) and a DPAC derivative (10 μM) were added into 10 mL of DMSO/water mixtures with different water fractions to evaluate the photosensitizing ability of the DPAC derivatives in the DMSO/water mixtures with different water fractions. Upon irradiation with white light for different time periods, the absorption spectra of ABDA were measured. The relative absorption intensity (A/A0) at 378 nm versus irradiation time was then recorded.

3.6. Singlet-Oxygen Quantum Yield Measurement

In order to eliminate the inner filter effect, the maximum absorbance needs to be around 0.2 a.u. The measurements were carried out under white-light irradiation (10 mW/cm2) in DMSO/water (v/v) = 1/99. Singlet oxygen quantum yields of these AIEgens were calculated by the equation: ΦAIEgen = ΦRB·KAIEgen·ARB/(KRB·AAIEgen). where KAIEgen and KRB represent the decomposition rate constants of ABDA in the presence of AIEgen and RB, respectively. AAIEgen and ARB represent the light absorbance of AIEgen and RB, respectively, which are determined by the integrated areas of the corresponding absorption bands in the wavelength range of 400–800 nm. ΦRB is the 1O2 quantum yield of RB, which is 0.75 in water.

3.7. Cell Culture and Fluorescence Imaging

HeLa cells were cultured at 37 °C in DMEM supplemented with 10% fetal bovine serum and 1% penicillin-streptomycin in humidified environment with 5% CO2. Cells were seeded on confocal cuvettes and allowed to adhere for 12 h. For cellular uptake experiments, cells were incubated with DPAC-PyPF6 or DPAC-D-PyPF6 (5 μM or 10 μM) for different times (0.5 h, 1 h, 1.5 h, 2 h, 2.5 h, 3 h). After being washed with PBS (2 mL × 2 times), cell imaging was carried out by a laser confocal scanning microscope. DPAC-PyPF6: λex = 404 nm, λem = 570–620 nm; DPAC-D-PyPF6: λex = 404 nm, λem = 570–620 nm.
For the colocalization experiments, cells were incubated with 5 μM DPAC-PyPF6 for 30 min. After being washed with PBS (1 mL × 2 times), cells were incubated with MitoTracker® Green FM (250 nM) for 30 min. Finally, cell imaging was carried out by laser confocal scanning microscope after being washed with PBS (1 mL × 2 times). MitoTracker® Green FM: λex = 488 nm, λem = 500–550 nm; DPAC-PyPF6: λex = 404 nm, λem = 570–620 nm. Cells were incubated with DPAC-D-PyPF6 (5 μM) for 30 min. After being washed with PBS (1 mL × 2 times), cells were incubated with MitoTracker® Red FM (250 nM) for 30 min. Finally, cell imaging was carried out on a confocal laser scanning microscope after being washed with PBS (1 mL × 2 times). MitoTracker® Red FM: λex = 561 nm, λem = 570–620 nm; DPAC-D-PyPF6: λex = 404 nm, λem = 650–700 nm.

3.8. Cytotoxicity Assay

Approximately 104 of HeLa cells were added into each hole of the 96-well plate, and after 12 h incubation, DPAC-PyPF6 or DPAC-D-PyPF6 of different concentrations (0, 1, 2, 5, 10, 20 μM) were added and incubated for another 2 h. After being exposed to white light (72 mW/cm2) for 0.5 h, these cells were further incubated in the dark for 4 h. At the same time, for the dark-cytotoxicity evaluation, the cells in 96-well plates were treated with different concentrations (0, 1, 2, 5, 10, 20 μM) of DPAC-PyPF6 or DPAC-D-PyPF6 and incubated for 4 h under dark conditions. CCK-8 was then added, and the cells were incubated for another 2 h. The absorbance value was measured at 450 nm by a microplate reader.

4. Conclusions

In summary, novel fluorescent photosensitizers have been developed based on the typical VIE system. These photosensitizers are constructed with the N,N′-disubstituted-dihydrodibenzo[a,c]phenazines (DPAC) as the skeleton. The pyridine, 4-vinylpyridinyl, pyridinium, and 4-vinylpyridinium groups were introduced onto the DPAC core to tune the ICT effect and π-conjugation length. As a result, the D-π-A-structured DPAC derivatives, namely DPAC-Py, DPAC-D-Py, DPAC-PyPF6 and DPAC-D-PyPF6, were obtained, and the luminescence, photosensitizing, and mitochondrial-targeting ability were finely modulated. As revealed by the systematic experimental investigation and theoretical calculations, when compared to DPAC-Py and DPAC-D-Py, DPAC-PyPF6 has stronger ICT effect while DPAC-D-PyPF6 has both stronger ICT effect and longer π-conjugation. Consequently, DPAC-PyPF6 and DPAC-D-PyPF6 show AIE properties and red fluorescence with large Stokes shifts in the aggregated states, which is different from the VIE phenomenon of the DPAC parent. The cationic DPAC derivatives, i.e., DPAC-PyPF6 and DPAC-D-PyPF6, are mitochondria-specific with Pearson coefficients of up to 0.86 and 0.92. DPAC-PyPF6 displayed a satisfactory ROS generation efficiency and DPAC-D-PyPF6 enjoyed ROS-generating ability higher than the other three DPAC derivatives and even higher than that of the commercial photosensitizer Rose Bengal. Moreover, DPAC-PyPF6 and DPAC-D-PyPF6 show distinct photocytotoxicity and dark cytotoxicity which endows them with the potential to be applied in the mitochondria-targeting and image-guided dual therapy. Thus, this work not only provides a new type of AIE-active photosensitizers but also expands the application scope of DPAC systems to the field of theranostics.

Supplementary Materials

The following supporting information can be downloaded at: https://www.mdpi.com/article/10.3390/molecules28176392/s1. Scheme S1: The synthetic route to the DPAC derivatives; Figures S1–S12: the spectra of the characterization of the DPAC derivatives; Figures S13 and S14: The crystal structure analysis of DPAC-Py and DPAC-PyPF6; Table S1: Crystal data and details of collection and refinement for DPAC-Py and DPAC-PyPF6; Figures S15–S17: The UV-Vis spectra, DLS, and TEM analysis of the DPAC derivatives in the THF/water mixtures with different water fractions; Figure S18: The fluorescence spectra of the DPAC derivatives in the DMSO/water mixtures with different fws; Figures S19–S23: The fluorescence spectra of the DPAC derivatives in the THF/hexane mixtures with different hexane fractions (fhs) or in the DCM/hexane mixtures with different fhs or in the MeOH/water mixtures with different fws or in the MeOH/toluene mixtures with different fTs or in the DMSO/toluene mixtures with different fTs; Figure S24: The solid-state excitation spectra of the DPAC derivatives; Figure S25: The solid-state absorption spectra of the DPAC derivatives; Figure S26: Cyclic voltammograms of the DPAC derivatives; Figure S27: The HOMOs and LUMOs of DPAC-Py and DPAC-PyPF6 calculated by DFT simulation based on the single-crystal structures; Figure S28: Absorption spectra of ABDA in the presence or absence of the photosensitizers at different irradiation time; Figures S29 and S30: Absorption spectra of DPAC-PyPF6 or DPAC-D-PyPF6 with ABDA in the mixtures of DMSO/water with different water fractions under white-light irradiation for different time; Figures S31 and S32: The measurement of the singlet-oxygen quantum yield; Figure S33: Evaluation of the mitochondria-targeting ability of DPAC-PyPF6 or DPAC-D-PyPF6; Figures S34 and S35: The CLSM of DPAC-PyPF6 or DPAC-D-PyPF6 incubated with HeLa cells at 5 μM or 10 μM for different time.

Author Contributions

Conceptualization, J.M. and D.M.; methodology, J.M., Z.Z. and X.Z.; software, X.Z.; validation, J.M. and Q.W.; investigation, Z.Z. and Q.W.; resources, J.M. and Z.Z.; data curation, J.M., Z.Z. and X.Z.; writing—original draft preparation, Z.Z.; writing—review and editing, J.M. and D.M.; visualization, J.M. and Z.Z.; supervision, J.M.; project administration, J.M. and D.M.; funding acquisition, J.M. and D.M. All authors have read and agreed to the published version of the manuscript.

Funding

This research was funded by the National Natural Science Foundation of China (21788102, 22275055, 21875064, 81903545, 21790361), Shanghai Science and Technology Commission Basic Project Shanghai Natural Science Foundation (21ZR1417600), Shanghai Municipal Science and Technology Major Project (2018SHZDZX03), Program of Introducing Talents of Discipline to Universities (B16017), Shanghai Science and Technology Committee (17520750100), Beijing New-Star Plan of Science and Technology (Z201100006820009), and the Fundamental Research Funds for the Central Universities.

Data Availability Statement

The data presented in this work are available in the paper. The CCDC 2285517 and 2285518 contain supplementary crystallographic data for this paper. These data can be obtained free of charge via http://www.ccdc.cam.ac.uk/conts/retrieving.html (accessed on 29 July 2023) (or from the Cambridge Crystallographic Data Centre, 12, Union Road, Cambridge CB2 1EZ, UK; Fax: +44-1223-336033).

Acknowledgments

The authors thank the Research Center of Analysis and Test of East China University of Science and Technology for the help on the characterization.

Conflicts of Interest

The authors declare no conflict of interest.

Sample Availability

Samples of the compounds DPAC-Py, DPAC-D-Py, DPAC-PyPF6, DPAC-D-PyPF6 are available from the authors.

References

  1. Zhang, Z.; Kang, M.; Tan, H.; Song, N.; Li, M.; Xiao, P.; Yan, D.; Zhang, L.; Wang, D.; Tang, B.Z. The fast-growing field of photo-driven theranostics based on aggregation-induced emission. Chem. Soc. Rev. 2022, 51, 1983–2030. [Google Scholar] [CrossRef] [PubMed]
  2. Chen, H.; Li, S.; Wu, M.; Kenry, Huang, Z.; Lee, C.-S.; Liu, B. Membrane-anchoring photosensitizer with aggregation-induced emission characteristics for combating multidrug-resistant bacteria. Angew. Chem. Int. Ed. 2020, 59, 632–636. [Google Scholar] [CrossRef]
  3. Zhai, W.; Zhang, Y.; Liu, M.; Zhang, H.; Zhang, J.; Li, C. Universal scaffold for an activatable photosensitizer with completely inhibited photosensitivity. Angew. Chem. Int. Ed. 2019, 58, 16601–16609. [Google Scholar] [CrossRef] [PubMed]
  4. Liu, Z.; Wang, Q.; Qiu, W.; Lyu, Y.; Zhu, Z.; Zhao, X.; Zhu, W.-H. AIE-active luminogens as highly efficient free-radical ROS photogenerator for image-guided photodynamic therapy. Chem. Sci. 2022, 13, 3599–3608. [Google Scholar] [CrossRef]
  5. Liu, S.; Wang, B.; Yu, Y.; Liu, Y.; Zhuang, Z.; Zhao, Z.; Feng, G.; Qin, A.; Tang, B.Z. Cationization-enhanced type I and type II ROS generation for photodynamic treatment of drug-resistant bacteria. ACS Nano 2022, 16, 9130–9141. [Google Scholar] [CrossRef]
  6. Qin, Y.; Chen, X.; Gui, Y.; Wang, H.; Tang, B.Z.; Wang, D. Self-assembled metallacage with second near-infrared aggregation-induced emission for enhanced multimodal theranostics. J. Am. Chem. Soc. 2022, 144, 12825–12833. [Google Scholar] [CrossRef]
  7. Yan, S.; Sun, P.; Niu, N.; Zhang, Z.; Xu, W.; Zhao, S.; Wang, L.; Wang, D.; Tang, B.Z. Surfactant-inspired coassembly strategy to integrate aggregation-induced emission photosensitizer with organosilica nanoparticles for efficient theranostics. Adv. Funct. Mater. 2022, 32, 2200503. [Google Scholar] [CrossRef]
  8. Liu, X.; Li, W.; Wen, Y.; Su, L.; Zhang, X. Aggregation-induced emission (AIE)-Based nanocomposites for intracellular biological process monitoring and photodynamic therapy. Biomaterials 2022, 287, 121603. [Google Scholar]
  9. Tian, M.; Chen, W.; Wu, Y.; An, J.; Hong, G.; Chen, M.; Song, F.; Zheng, W.-H.; Peng, X. Liposome-based nanoencapsulation of a mitochondria-stapling photosensitizer for efficient photodynamic therapy. ACS Appl. Mater. Interfaces 2022, 14, 12050–12058. [Google Scholar] [CrossRef]
  10. Zhang, S.; Yang, W.; Lu, X.; Zhang, X.; Pan, Z.; Qu, D.-H.; Mei, D.; Mei, J.; Tian, H. Near-infrared AIEgens with high singlet-oxygen yields for mitochondria-specific imaging and antitumor photodynamic therapy. Chem. Sci. 2023, 14, 7076–7085. [Google Scholar] [CrossRef]
  11. Xu, F.-Z.; Zhu, T.; Han, H.-H.; Zou, J.-W.; Zhang, Y.; Li, J.; James, T.; He, X.-P.; Wang, C.-Y. Molecularly engineered AIEgens with enhanced quantum and singlet-oxygen yield for mitochondria-targeted imaging and photodynamic therapy. Chem. Sci. 2022, 13, 9373–9380. [Google Scholar] [CrossRef] [PubMed]
  12. Tian, J.; Huang, B.; Nawaz, M.; Zhang, W.; Apfel, U.; Zhang, W.; Cao, R. Recent advances of multi-dimensional porphyrin-based functional materials in photodynamic therapy. Coord. Chem. Rev. 2020, 420, 213410. [Google Scholar] [CrossRef]
  13. Zhang, H.; Li, Q.; Qi, X.; Li, Y.; Ma, H.; Grinholc, M.; Nakonieczna, J.; Yu, B.; Wang, X.; Zhang, L. Iron-blocking antibacterial therapy with cationic heme-mimetic gallium porphyrin photosensitizer for combating antibiotic resistance and enhancing photodynamic antibacterial activity. Chem. Eng. J. 2023, 451, 138261. [Google Scholar] [CrossRef]
  14. Teng, K.-X.; Chen, W.-K.; Niu, L.-Y.; Fang, W.-H.; Cui, G.; Yang, Q.-Z. BODIPY-based photodynamic agents for exclusively generating superoxide radical over singlet oxygen. Angew. Chem. Int. Ed. 2021, 60, 19912–19920. [Google Scholar] [CrossRef] [PubMed]
  15. Li, C.; Sun, T.; Li, X.; Xie, Z. Heavy-atom-free nanoparticles based on boron dipyrromethene derivatives for combined photothermal and photodynamic cancer therapy. ACS Appl. Nano Mater. 2022, 5, 18691–18696. [Google Scholar]
  16. Lv, Z.; Wei, H.; Li, Q.; Su, X.; Liu, S.; Zhang, K.; Lv, W.; Zhao, Q.; Li, X.; Huang, W. Achieving efficient photodynamic therapy under both normoxia and hypoxia using cyclometalated Ru(II) photosensitizer through type I photochemical process. Chem. Sci. 2018, 9, 502–512. [Google Scholar] [CrossRef]
  17. Dai, J.; Duan, C.; Huang, Y.; Lou, X.; Xia, F.; Wang, S. Aggregation-induced emission luminogens for RONS sensing. J. Mater. Chem. B 2020, 8, 3357–3370. [Google Scholar] [CrossRef]
  18. Lovell, J.F.; Liu, T.W.B.; Chen, J.; Zheng, G. Activatable photosensitizers for imaging and therapy. Chem. Rev. 2010, 110, 2839–2857. [Google Scholar] [CrossRef]
  19. Lovell, J.F.; Jin, C.S.; Jin, E.H.; Kim, C.; Rubinstein, J.L.; Chan, W.C.W.; Cao, W.; Wang, L.V.; Zhang, G. Porphysome nanovesicles generated by porphyrin bilayers for use as multimodal biophotonic contrast agents. Nat. Mater. 2011, 10, 324–332. [Google Scholar] [CrossRef]
  20. Wang, Y.; Zhong, Y.; Zhang, X.; Qu, D.-H.; Mei, D.; Mei, J. Facile construction of AIE-active pyridinyl-diphenylacrylonitrile derivatives with optical properties finely modulated by D–A regulation. Mater. Chem. Front. 2022, 6, 2103–2113. [Google Scholar] [CrossRef]
  21. He, X.; Yang, Y.; Guo, Y.; Lu, S.; Du, Y.; Li, J.-J.; Zhang, X.; Leung, N.L.C.; Zhao, Z.; Niu, G.; et al. Phage-guided targeting, discriminative imaging, and synergistic killing of bacteria by AIE bioconjugates. J. Am. Chem. Soc. 2020, 142, 3959–3969. [Google Scholar] [CrossRef]
  22. Niu, N.; Yu, Y.; Zhang, Z.; Kang, M.; Wang, L.; Zhao, Z.; Wang, D.; Tang, B.Z. A cell membrane-targeting AIE photosensitizer as a necroptosis inducer for boosting cancer theranostics. Chem. Sci. 2022, 13, 5929–5937. [Google Scholar] [CrossRef] [PubMed]
  23. Yu, Y.; Liu, Y.; Chen, Y.; Chen, J.; Feng, G.; Tang, B.Z. Cationic AIE-active photosensitizers for highly efficient photodynamic eradication of drug-resistant bacteria. Mater. Chem. Front. 2023, 7, 96–105. [Google Scholar] [CrossRef]
  24. Liu, P.; Ren, F.; Son, S.; Ji, M.S.; Li, P.; Cai, Z.; Shi, J.; Liu, Y.; Dong, Y.; Kim, J.S. Mitochondrial targeted AIEgen phototheranostics for bypassing immune barrier via encumbering mitochondria functions. Biomaterials 2022, 283, 121409. [Google Scholar] [CrossRef]
  25. Zhang, Z.; Wu, Y.-S.; Tang, K.-C.; Chen, C.-L.; Ho, J.-W.; Su, J.; Tian, H.; Chou, P.-T. Excited-state conformational/electronic responses of saddle-shaped N,N′-disubstituted-dihydrodibenzo[a,c]phenazines: Wide-tuning emission from red to deep blue and white light combination. J. Am. Chem. Soc. 2015, 137, 8509–8520. [Google Scholar] [CrossRef] [PubMed]
  26. Chen, W.; Chen, C.-L.; Zhang, Z.; Chen, Y.-A.; Chao, W.-C.; Su, J.; Tian, H.; Chou, P.-T. Snapshotting the excited-state planarization of chemically locked N,N′-disubstituted dihydrodibenzo[a,c]phenazines. J. Am. Chem. Soc. 2017, 139, 1636–1644. [Google Scholar] [CrossRef]
  27. Zhang, Z.; Chen, C.-L.; Chen, Y.-A.; Wei, Y.-C.; Su, J.; Tian, H.; Chou, P.-T. Tuning the conformation and color of conjugated polyheterocyclic skeletons by installing ortho-methyl groups. Angew. Chem. Int. Ed. 2018, 57, 9880–9884. [Google Scholar] [CrossRef]
  28. Zhang, Z.; Song, W.; Su, J.; Tian, H. Vibration-induced emission (VIE) of N,N′-disubstituted-dihydribenzo[a,c]phenazines: Fundamental understanding and emerging applications. Adv. Funct. Mater. 2020, 30, 1902803. [Google Scholar] [CrossRef]
  29. Sun, G.; Wei, Y.; Zhang, Z.; Lin, J.; Liu, Z.; Chen, W.; Su, J.; Chou, P.-T.; Tian, H. Diversified excited-state relaxation pathways of donor-linker-acceptor dyads controlled by a bent-to-planar motion of the donor. Angew. Chem. Int. Ed. 2020, 59, 18611–18618. [Google Scholar] [CrossRef] [PubMed]
  30. Zhang, Z.; Sun, G.; Chen, W.; Su, J.; Tian, H. The endeavor of vibration-induced emission (VIE) for dynamic emissions. Chem. Sci. 2020, 11, 7525–7537. [Google Scholar] [CrossRef]
  31. Jin, X.; Li, S.; Guo, L.; Hua, J.; Qu, D.-H.; Su, J.; Zhang, Z.; Tian, H. Interplay of steric effects and aromaticity reversals to expand the structural/electronic responses of dihydrophenazines. J. Am. Chem. Soc. 2022, 144, 4883–4896. [Google Scholar] [CrossRef]
  32. Zong, Z.; Zhang, Q.; Qiu, S.; Wang, Q.; Zhao, C.; Zhao, C.; Tian, H.; Qu, D.-H. Dynamic timing control over multicolor molecular emission by temporal chemical locking. Angew. Chem. Int. Ed. 2022, 61, e202116414. [Google Scholar] [CrossRef] [PubMed]
  33. Zhou, H.; Mei, J.; Chen, Y.-A.; Chen, C.-L.; Chen, W.; Zhang, Z.; Su, J.; Chou, P.-T.; Tian, H. Phenazine-based ratiometric Hg2+ probes with well-resolved dual emissions: A new sensing mechanism by vibration-induced emission (VIE). Small 2016, 12, 6542–6546. [Google Scholar] [CrossRef]
  34. Li, Y.; Liu, Y.; Zhou, H.; Chen, W.; Mei, J.; Su, J. Ratiometric Hg2+/Ag+ probes with orange red-white-blue fluorescence response constructed by integrating vibration-induced emission with an aggregation-induced emission motif. Chem.-Eur. J. 2017, 23, 9280–9287. [Google Scholar] [CrossRef]
  35. Zhou, Z.; Chen, D.-G.; Saha, M.L.; Wang, H.; Li, X.; Chou, P.-T.; Stang, P.J. Designed conformation and fluorescence properties of self-assembled phenazine-cored platinum(II) metallacycles. J. Am. Chem. Soc. 2019, 141, 5535–5543. [Google Scholar] [CrossRef]
  36. Chen, W.; Guo, C.; He, Q.; Chi, X.; Lynch, V.M.; Zhang, Z.; Su, J.; Tian, H.; Sessler, J.L. Molecular cursor caliper: A fluorescent sensor for dicarboxylate dianions. J. Am. Chem. Soc. 2019, 141, 14798–14806. [Google Scholar] [CrossRef]
  37. Ramos-Soriano, J.; Benitez-Benitez, S.J.; Davis, A.P.; Galan, M.C. A vibration-induced-emission-based fluorescent chemosensor for the selective and visual recognition of glucose. Angew. Chem. Int. Ed. 2021, 60, 16880–16884. [Google Scholar] [CrossRef]
  38. Liu, H.; Song, W.; Chen, X.; Mei, J.; Zhang, Z.; Su, J. Temperature-responsive molecular liquids based on dihydrophenazines for dynamic multicolor-fluorescent anti-counterfeiting and encryption. Mater. Chem. Front. 2021, 5, 2294–2302. [Google Scholar] [CrossRef]
  39. Song, W.; Ye, W.; Shi, L.; Huang, J.; Zhang, Z.; Mei, J.; Su, J.; Tian, H. Smart molecular butterfly: An ultra-sensitive and range-tunable ratiometric thermometer based on dihydrophenazines. Mater. Horiz. 2020, 7, 615–623. [Google Scholar] [CrossRef]
  40. Wang, H.; Li, Y.; Zhang, Y.; Mei, J.; Su, J. A new strategy for achieving single-molecular white-light emission: Using vibration-induced emission (VIE) plus aggregation-induced emission (AIE) mechanisms as a two-pronged approach. Chem. Commun. 2019, 55, 1879–1882. [Google Scholar] [CrossRef]
  41. Sun, G.; Pan, J.; Wu, Y.; Liu, Y.; Chen, W.; Zhang, Z.; Su, J. Supramolecular assembly-driven color-tuning and white-light emission based on crown-ether-functionalized dihydrophenazine. ACS Appl. Mater. Interfaces 2020, 12, 10875–10882. [Google Scholar] [CrossRef]
  42. Sun, G.; Zhou, H.; Liu, Y.; Li, Y.; Zhang, Z.; Mei, J.; Su, J. Ratiometric indicator based on vibration-induced emission for in situ and real-time monitoring of gelation processes. ACS Appl. Mater. Interfaces 2018, 10, 20205–20212. [Google Scholar] [CrossRef]
  43. Huang, Z.; Jiang, T.; Wang, J.; Ma, X.; Tian, H. Real-time visual monitoring of kinetically controlled self-assembly. Angew. Chem. Int. Ed. 2021, 60, 2855–2860. [Google Scholar] [CrossRef]
  44. Zhang, Y.; Li, Y.; Wang, H.; Zhang, Z.; Feng, Y.; Tian, Q.; Li, N.; Mei, J.; Su, J.; Tian, H. Measuring the microphase separation scale of polyurethanes with a vibration-induced emission-based ratiometric “fluorescent ruler”. ACS Appl. Mater. Interfaces 2019, 11, 39351–39358. [Google Scholar] [CrossRef] [PubMed]
  45. Humeniuk, H.V.; Rosspeintner, A.; Licari, G.; Kilin, V.; Bonacina, L.; Vauthey, E.; Sakai, N.; Matile, S. White-fluorescent dual-emission mechanosensitive membrane probes that function by bending rather than twisting. Angew. Chem. Int. Ed. 2018, 57, 10559–10563. [Google Scholar] [CrossRef]
  46. Dou, W.-T.; Qin, Z.-Y.; Li, J.; Zhou, D.-M.; He, X.-P. Self-assembled sialyllactosyl probes with aggregation-enhanced properties for ratiometric detection and blocking of influenza viruses. Sci. Bull. 2019, 64, 1902–1909. [Google Scholar] [CrossRef] [PubMed]
  47. Dou, W.-T.; Wang, X.; Liu, T.; Zhao, S.; Liu, J.-J.; Yan, Y.; Li, J.; Zhang, C.-Y.; Sedgwick, A.C.; Tian, H.; et al. A homogeneous high-throughput array for the detection and discrimination of influenza A viruses. Chem 2022, 8, 1750–1761. [Google Scholar] [CrossRef]
  48. Li, S.; He, M.; Jin, X.; Geng, W.; Li, C.; Li, X.; Zhang, Z.; Qian, J.; Hua, J. Extending the Stokes shifts of donor-acceptor fluorophores by regulating the donor configuration for in vivo three-photon fluorescence imaging. Chem. Mater. 2022, 34, 5999–6008. [Google Scholar] [CrossRef]
  49. Jeena, M.T.; Kim, S.; Jin, S.; Ryu, J.-H. Recent Progress in Mitochondria-Targeted Drug and Drug-Free Agents for Cancer Therapy. Cancers 2020, 12, 4. [Google Scholar] [CrossRef] [PubMed]
  50. Zhang, T.; Liu, Z.; Tang, W.; Zhu, D.; Lyu, M.; Lam, J.W.Y.; Huang, Q.; Tang, B.Z. Mitochondria-targeting type I AIE photosensitizer combined with H2S therapy: Uninterrupted hydroxyl radical generation for enhancing tumor therapy. Nano Today 2022, 46, 101620. [Google Scholar] [CrossRef]
  51. Li, H.; Kim, H.; Zhang, C.; Zeng, S.; Chen, Q.; Jia, L.; Wang, J.; Peng, X.; Yoon, J. Mitochondria-targeted smart AIEgens: Imaging and therapeutics. Coord. Chem. Rev. 2022, 473, 214818. [Google Scholar] [CrossRef]
  52. Abeywickrama, C.S.; Wijesinghe, K.J.; Plescia, C.B.; Fisher, L.S.; Goodson III, T.; Stahelin, R.V.; Pang, Y. A pyrene-based two-photon excitable fluorescent probe to visualize nuclei in live cells. Photochem. Photobiol. Sci. 2020, 19, 1152–1159. [Google Scholar] [CrossRef]
  53. Kumar, V.; Naik, V.G.; Das, A.; Bal, S.B.; Biswas, M.; Kumar, N.; Ganguly, A.; Chatterjee, A.; Banerjee, M. Synthesis of a series of ethylene glycol modified water-soluble tetrameric TPE-amphiphiles with pyridinium polar heads: Towards applications as light-up bioprobes in protein and DNA assay, and wash-free imaging of bacteria. Tetrahedron 2019, 75, 3722–3732. [Google Scholar] [CrossRef]
  54. Reo, Y.J.; Sarkar, S.; Dai, M.; Yang, Y.J.; Ahn, K.H. Structurally compact, blue−green−red fluorescence trackers for the outer cell membrane: Zwitterionic (naphthylvinyl)pyridinium dyes. ACS Appl. Bio Mater. 2021, 4, 2089–2096. [Google Scholar] [CrossRef] [PubMed]
  55. Zhang, Y.; Wang, L.; Rao, Q.; Bu, Y.; Xu, T.; Zhu, X.; Zhang, J.; Tian, Y.; Zhou, H. Tuning the hydrophobicity of pyridinium-based probes to realize the mitochondria-targeted photodynamic therapy and mitophagy tracking. Sensor Actuat. B-Chem. 2020, 321, 128460. [Google Scholar] [CrossRef]
  56. Munan, S.; Ali, M.; Yadav, R.; Mapa, K.; Samanta, A. PET- and ICT-based ratiometric probe: An unusual phenomenon of morpholine-conjugated fluorophore for mitochondrial pH mapping during mitophagy. Anal. Chem. 2022, 94, 11633–11642. [Google Scholar] [CrossRef]
  57. Jadhav, M.M.; Patil, D.; Sekar, N. Highly Stoke shifted near infrared (NIR) emitting donor-pi-acceptor chromophore: Synthesis and combined experimental and computational studies of photophysical properties. J. Photochem. Photobio. A Chem. 2018, 363, 13–22. [Google Scholar] [CrossRef]
  58. Panahi, F.; Mahmoodi, A.; Ghodrati, S.; Eshghi, F. A novel donor–pi–acceptor halochromic 2,6-distyrylnaphthalene chromophore: Synthesis, photophysical properties and DFT studies. RSC Adv. 2021, 11, 168–176. [Google Scholar] [CrossRef]
  59. Abeywickrama, C.S. Large Stokes shift benzothiazolium cyanine dyes with improved intramolecular charge transfer (ICT) for cell imaging applications. Chem. Commun. 2022, 58, 9855–9869. [Google Scholar] [CrossRef]
  60. Dai, L.; Zhang, Q.; Ma, Q.; Lin, W. Emerging near infrared fluorophore: Dicyanoisophorone-based small-molecule fluorescent probes with large stokes shifts for bioimaging. Coord. Chem. Rev. 2023, 489, 215193. [Google Scholar] [CrossRef]
  61. Chan, N.N.M.Y.; Idris, A.; Abidin, Z.H.Z.; Tajuddin, H.A.; Abdullah, Z. White light employing luminescent engineered large (mega) Stokes shift molecules: A review. RSC Adv. 2021, 11, 13409–13445. [Google Scholar] [CrossRef] [PubMed]
  62. Petrucci, A.N.; Cousins, M.E.; Liptak, M.D. Beyond “mega”: Origin of the “giga” Stokes shift for Triazolopyridiniums. J. Phys. Chem. B 2022, 126, 6997–7005. [Google Scholar] [CrossRef] [PubMed]
  63. Abeywickrama, C.S.; Li, Y.; Ramanah, A.; Owitipana, D.N.; Wijesinghe, K.J.; Pang, Y. Albumin-induced large fluorescence turn ON in 4-(diphenylamino)benzothiazolium dyes for clinical applications in protein detection. Sensor Actuat. B-Chem. 2022, 368, 132199. [Google Scholar] [CrossRef]
  64. Chan, N.N.M.Y.; Idris, A.; Abidin, Z.H.Z.; Tajuddin, H.A.; Abdullah, Z. Intramolecular charge transfer-induced solvatochromism and large Stokes shifts of furocoumarins. Mater. Chem. Phys. 2022, 276, 125406. [Google Scholar] [CrossRef]
  65. Zhou, H.; Sun, L.; Chen, W.; Tian, G.; Chen, Y.; Li, Y.; Su, J. Phenazine-based colorimetric and fluorometric probes for rapid recognizing of Hg2+ with high sensitivity and selectivity. Tetrahedron 2016, 72, 2300–2305. [Google Scholar] [CrossRef]
  66. Frisch, M.J.; Trucks, G.W.; Schlegel, H.B.; Scuseria, G.E.; Robb, M.A.; Cheeseman, J.R.; Scalmani, G.; Barone, V.; Mennucci, B.; Petersson, G.A.; et al. Gaussian 09, Revision A02; Gaussian, Inc.: Wallingford, CT, USA, 2009. [Google Scholar]
Scheme 1. The main characteristics and application areas of D-π-A-structured molecular systems.
Molecules 28 06392 sch001
Scheme 2. (A) Structures of the pyridinium-DPAC adducts DPAC-PyPF6 and DPAC-D-PyPF6, and their corresponding control compounds DPAC-Py and DPAC-D-Py. (B) Schematic illustration of the mechanism of the ROS generation of these DPAC derivatives under light irradiation, where diagrams (i,ii) represent the excited-state photophysical processes of DPAC-Py/DPAC-D-Py and DPAC-PyPF6/DPAC-D-PyPF6, respectively.
Molecules 28 06392 sch002
Figure 1. The UV-Vis and fluorescence spectra of (A,E) DPAC-Py, (B,F) DPAC-PyPF6, (C,G) DPAC-D-Py and (D,H) DPAC-D-PyPF6 in different solvents, c = 10 μM.
Molecules 28 06392 g001
Figure 2. The fluorescence spectra of (A) DPAC-Py, (B) DPAC-PyPF6, (C) DPAC-D-Py and (D) DPAC-D-PyPF6 in the THF/water mixtures with different fws at room temperature, c = 10 μM, λex,A = 365 nm, λex,B = 409 nm, λex,C = 367 nm, λex,D = 450 nm. The corresponding plots of the emission enhancement (I/I0) versus fws in the (E) THF/water, and (F) DMSO/water mixtures, respectively.
Molecules 28 06392 g002
Figure 3. The FL spectra of (A) DPAC-Py and (B) DPAC-PyPF6 as film, powder, and single crystal, (C) DPAC-D-Py and (D) DPAC-D-PyPF6 as film and powder, λex,A = 365 nm, λex,B = 401 nm, λex,C = 370 nm, λex,D = 450 nm. Insets: The photographs of the single crystals of DPAC-Py and DPAC-PyPF6 taken under daylight (left) and UV illumination (right). (E) The photographs of DPAC-Py, DPAC-PyPF6, DPAC-D-Py, and DPAC-D-PyPF6 in the powder and film states taken under daylight and UV light.
Molecules 28 06392 g003aMolecules 28 06392 g003b
Figure 4. (A) HOMO and LUMO and (B) the singlet (S1)-, triplet (T1)-state energy levels, and the energy gap between S1 and T1EST) of DPAC-Py, DPAC-PyPF6, DPAC-D-Py, and DPAC-D-PyPF6, respectively, obtained from the DFT calculations.
Molecules 28 06392 g004
Figure 5. (A) The decomposition rates of ABDA only and when ABDA (50 mM) coexists with DPAC-Py, DPAC-D-Py, DPAC-PyPF6, DPAC-D-PyPF6 (10 mM) or Rose Bengal (10 mM) in the aqueous solution (containing 1% DMSO) under white-light irradiation (10 mW/cm2). Rates of ABDA decomposition when the ABDA (50 mM) coexists with (B) DPAC-PyPF6 (10 mM) or (C) DPAC-D-PyPF6 (10 mM) in the DMSO/water mixtures with different water fractions under white-light irradiation (10 mW/cm2). A0 and A are the absorbance of ABDA at 378 nm before and after white-light irradiation, respectively. The mitochondria-targeting ability of (D) DPAC-PyPF6 and (E) DPAC-D-PyPF6 in HeLa cells. λex,DPAC-PyPF6 = 404 nm, λem,DPAC-PyPF6 = 570–620 nm, λex,MTG = 488 nm, λem,MTG = 500–549 nm. λex,DPAC-D-PyPF6 = 404 nm, λem,DPAC-D-PyPF6 = 650–700 nm λex,MTR = 561 nm, λem,MTR = 570–620 nm. [probe] = 5 μM, [MitoTracker] = 250 nM, Scale bar: 10 μm.
Molecules 28 06392 g005
Figure 6. Viability of HeLa cells treated with different concentrations of (A) DPAC-PyPF6 or (B) DPAC-D-PyPF6 with and without white-light irradiation (72 mW/cm2) for 0.5 h and further incubated for 4 h in dark.
Molecules 28 06392 g006
Table 1. The photophysical properties of the DPAC derivatives.
DPAC-PyDPAC-PyPF6DPAC-D-PyDPAC-D-PyPF6
λex/nmfilm383449386/411455
powder387/411487387/425463
crystal386/414500//
λabs/nmsolution a351410367450
aggregate b365401384437
film363418378449
powder375416383469
crystal393410/530//
λem/nmsolution a425/610N.D.434N.D.
aggregate b435/587603535627
film490585435/493/520530/608
powder442/516602537631
crystal440/497615//
Δλ·c/nmaggregate b70/222202151190
ε·d/L·mol−1·cm−1aggregate b3.209 × 1042.343 × 1044.462 × 1042.665 × 104
ΦF/%solution a0.11000
aggregate b0.340.200.320.12
powder8.060.243.120.21
a Determined with THF solution (10−5 M). b THF/water mixture with a water fraction of 90% (10−5 M). N.D.: Not detected. Δλ = Stokes shift. c Δλ = λemλabs. d ε = A/(c·L), where A = absorbance, c = 10−5 M, L = 1 cm.
Table 2. The HOMO and LUMO levels, and the energy gaps of the DPAC derivatives.
Comp.Eg a/eVEg b/eVHOMO c/eVLUMO d/eVHOMO e/eVLUMO e/eVEg e/eV
DPAC-Py3.723.09−4.98−1.89−5.56−1.733.83
DPAC-PyPF63.182.46−4.97−2.51−7.56−5.482.08
DPAC-D-Py3.552.96−5.00−2.04−5.45−1.933.52
DPAC-D-PyPF62.902.30−4.97−2.67−7.41−5.511.90
a Estimated from the absorption spectra with the equation of E = hc/λ = (1303.98 nm/λ) eV. b Estimated from onset of the absorption spectra (Eg = 1241/λonset). c Obtained from the onset of the oxidation voltages and the equation: EHOMO = −e (Eonset,ox + 4.4 V). d Obtained from the equation: ELUMO = EHOMO + Eg. e Values obtained from DFT calculation. Comp. = Compound.
Disclaimer/Publisher’s Note: The statements, opinions and data contained in all publications are solely those of the individual author(s) and contributor(s) and not of MDPI and/or the editor(s). MDPI and/or the editor(s) disclaim responsibility for any injury to people or property resulting from any ideas, methods, instructions or products referred to in the content.