
Spectroscopic and Biological Properties of the 3-Imino-1,8-naphthalimide Derivatives as Fluorophores for Cellular Imaging


Abstract
:1. Introduction
2. Results and Discussion
2.1. Characteristics of 3-Imino-1,8-naphthalimide Derivatives
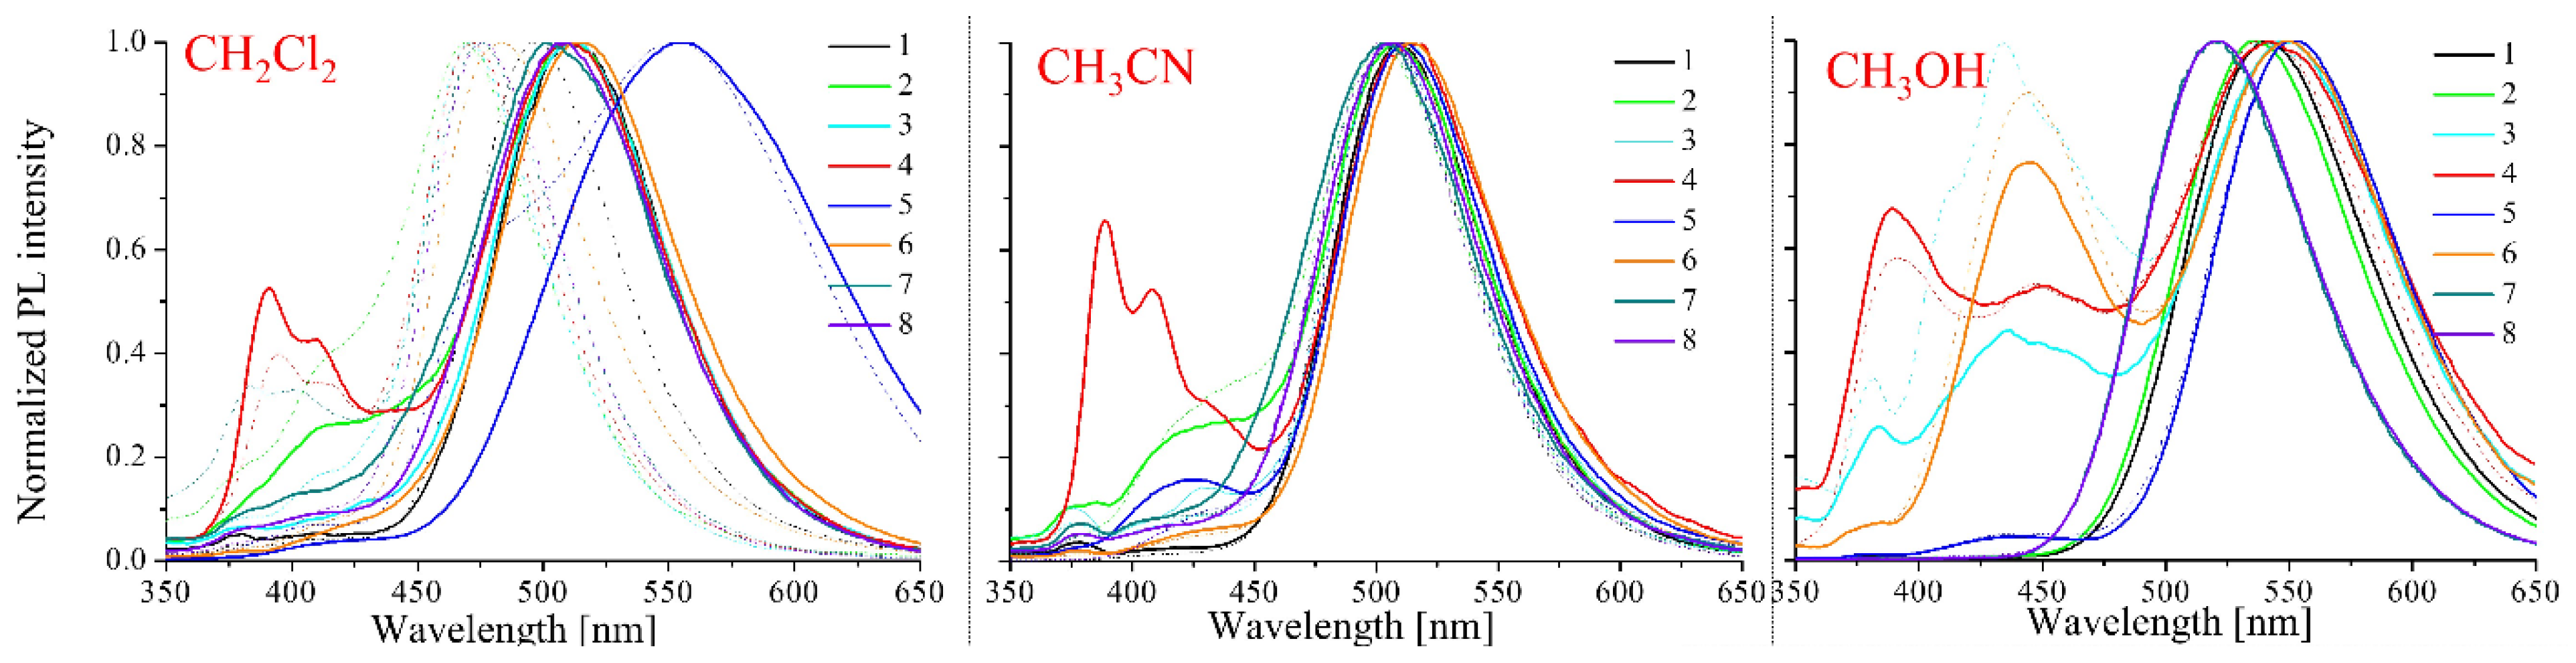
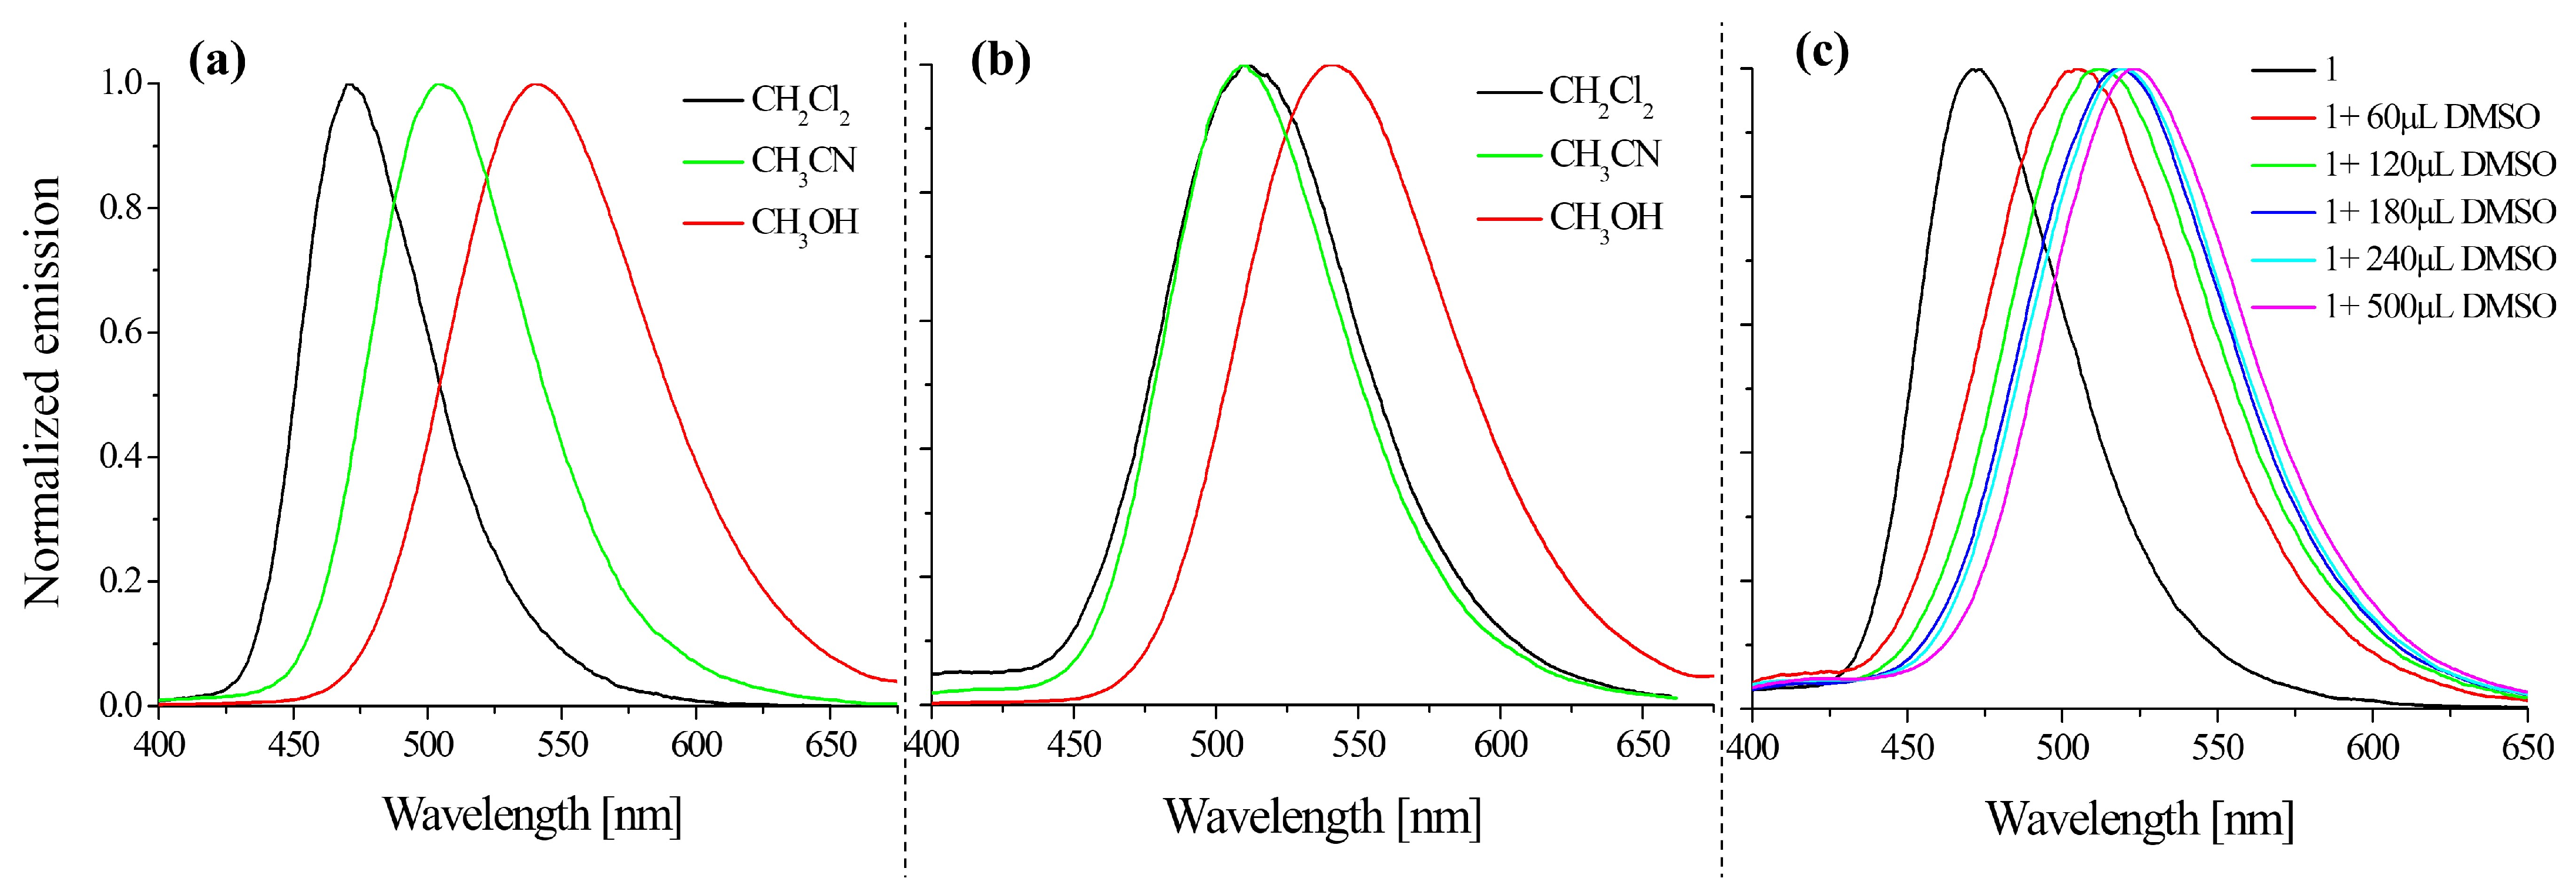
2.2. Optical Properties
2.2.1. Absorption and Emission Investigations
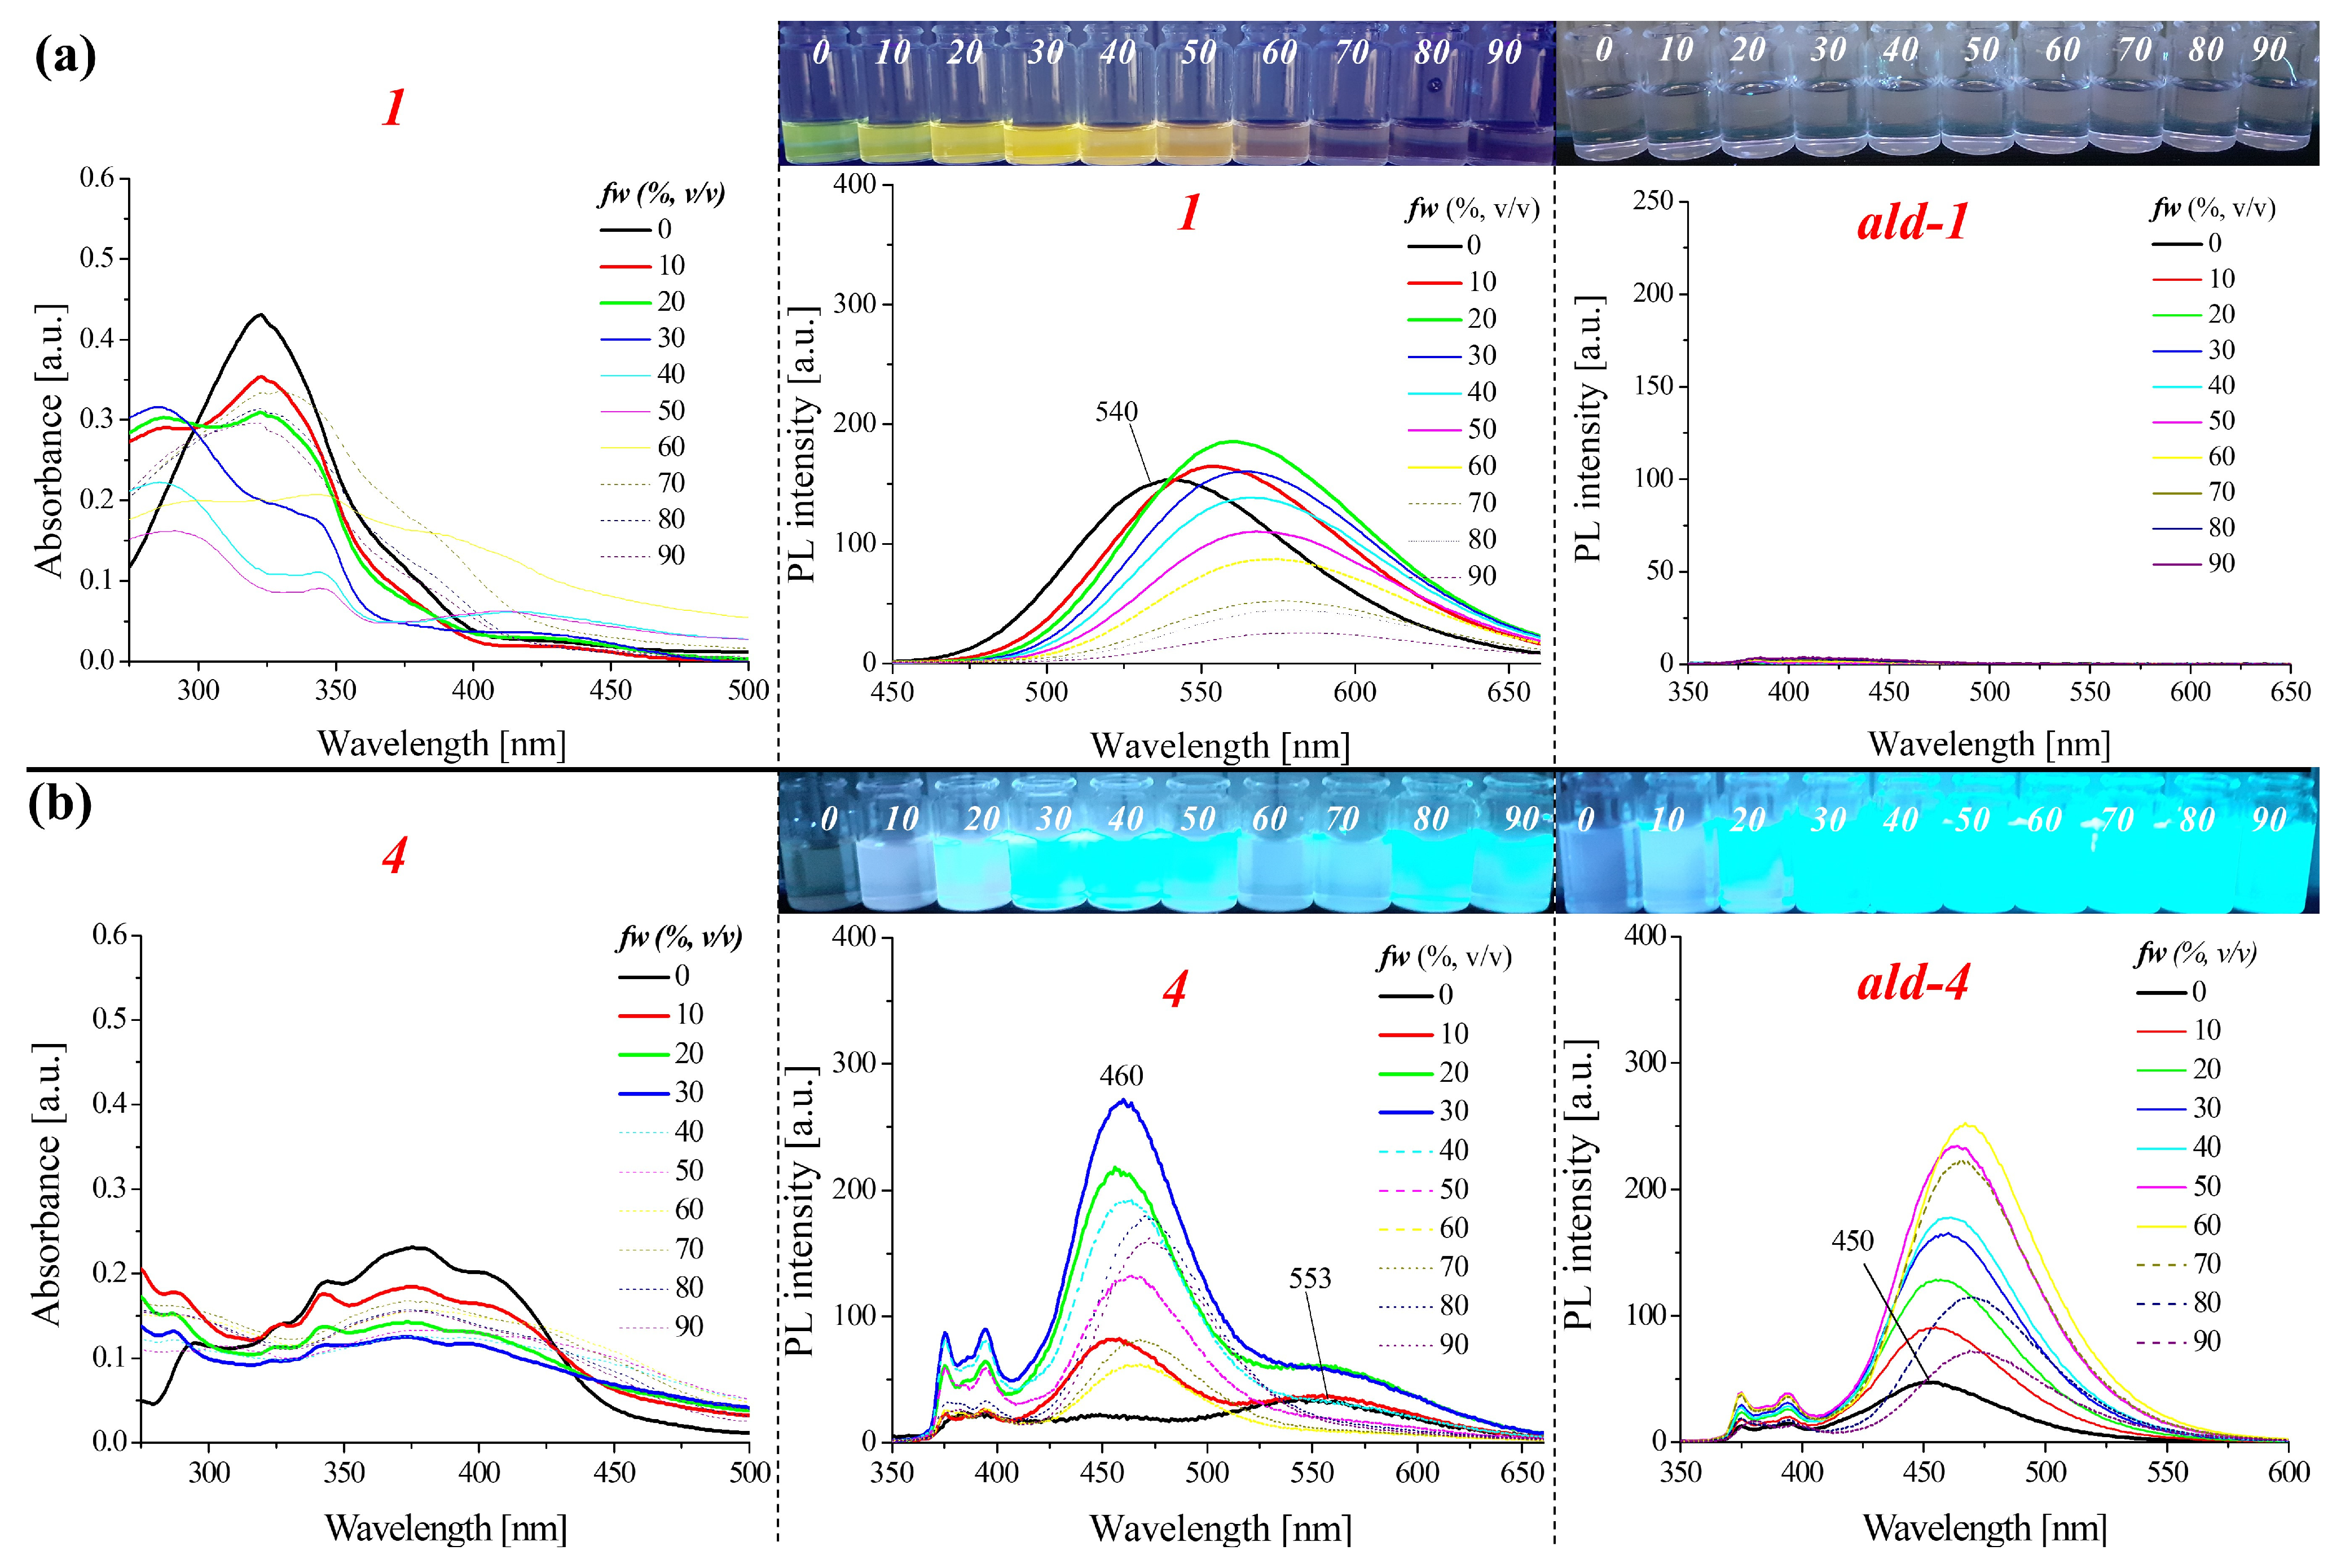
2.2.2. Optical Properties of the Aggregates
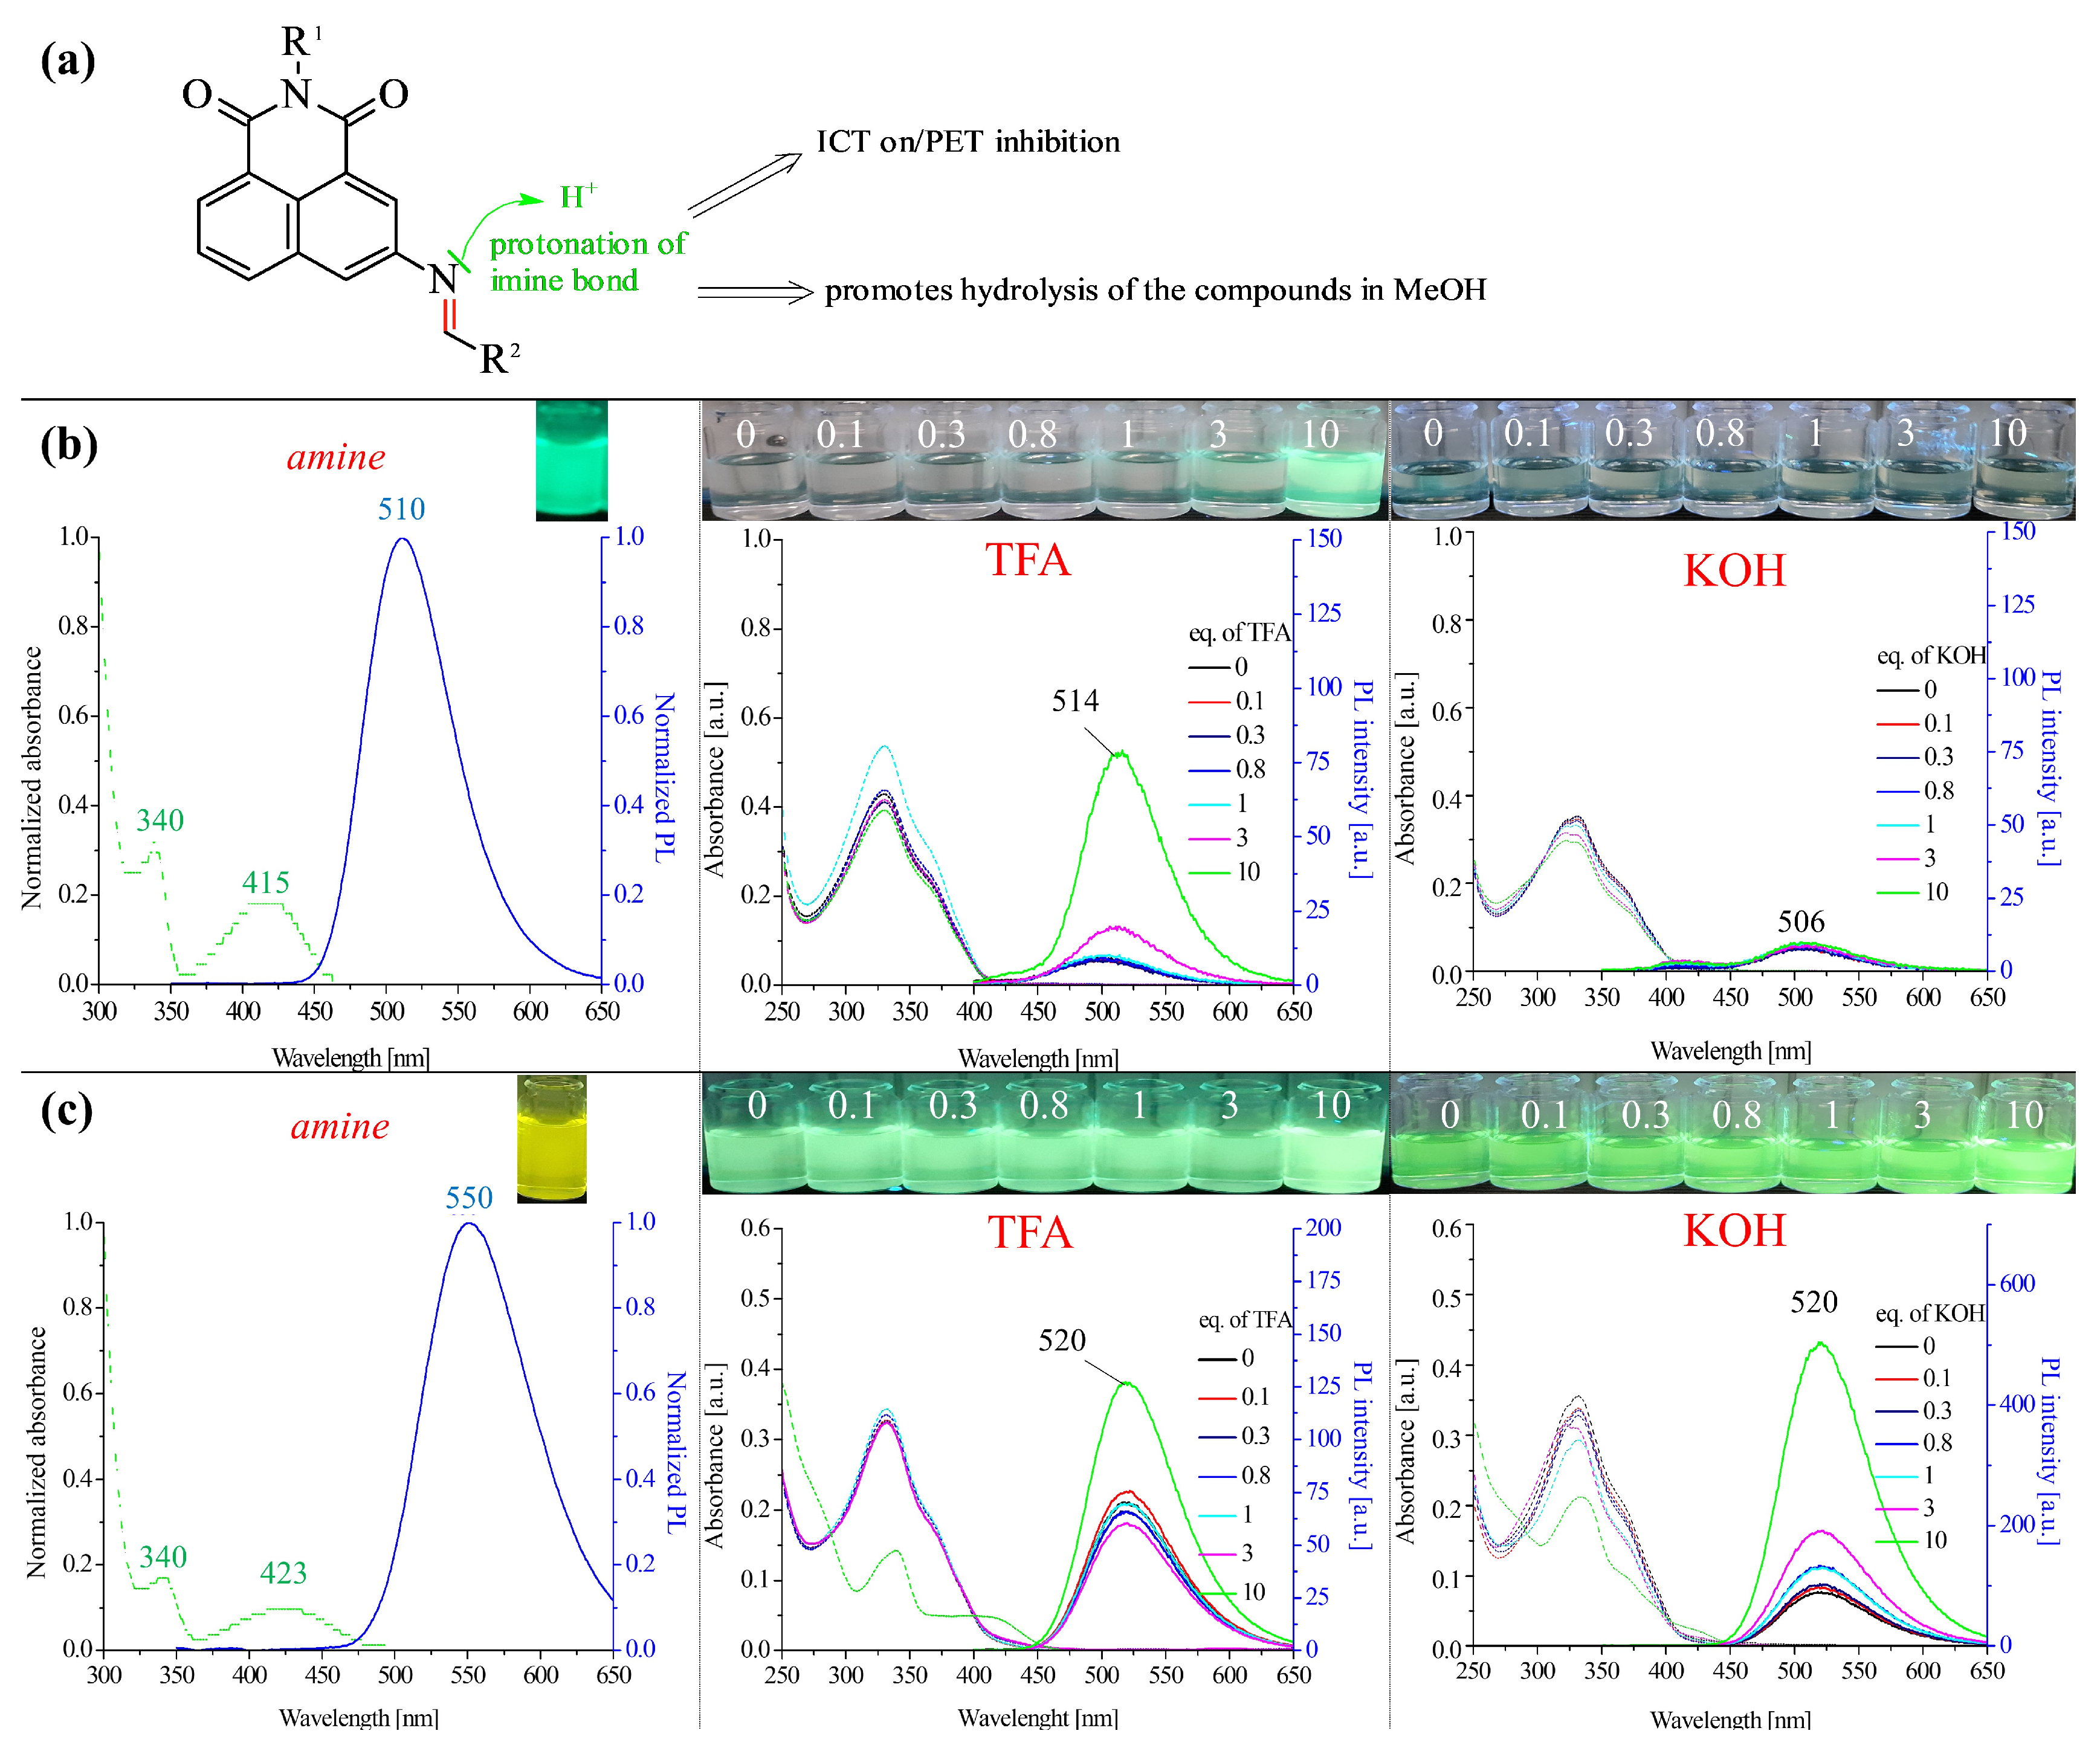
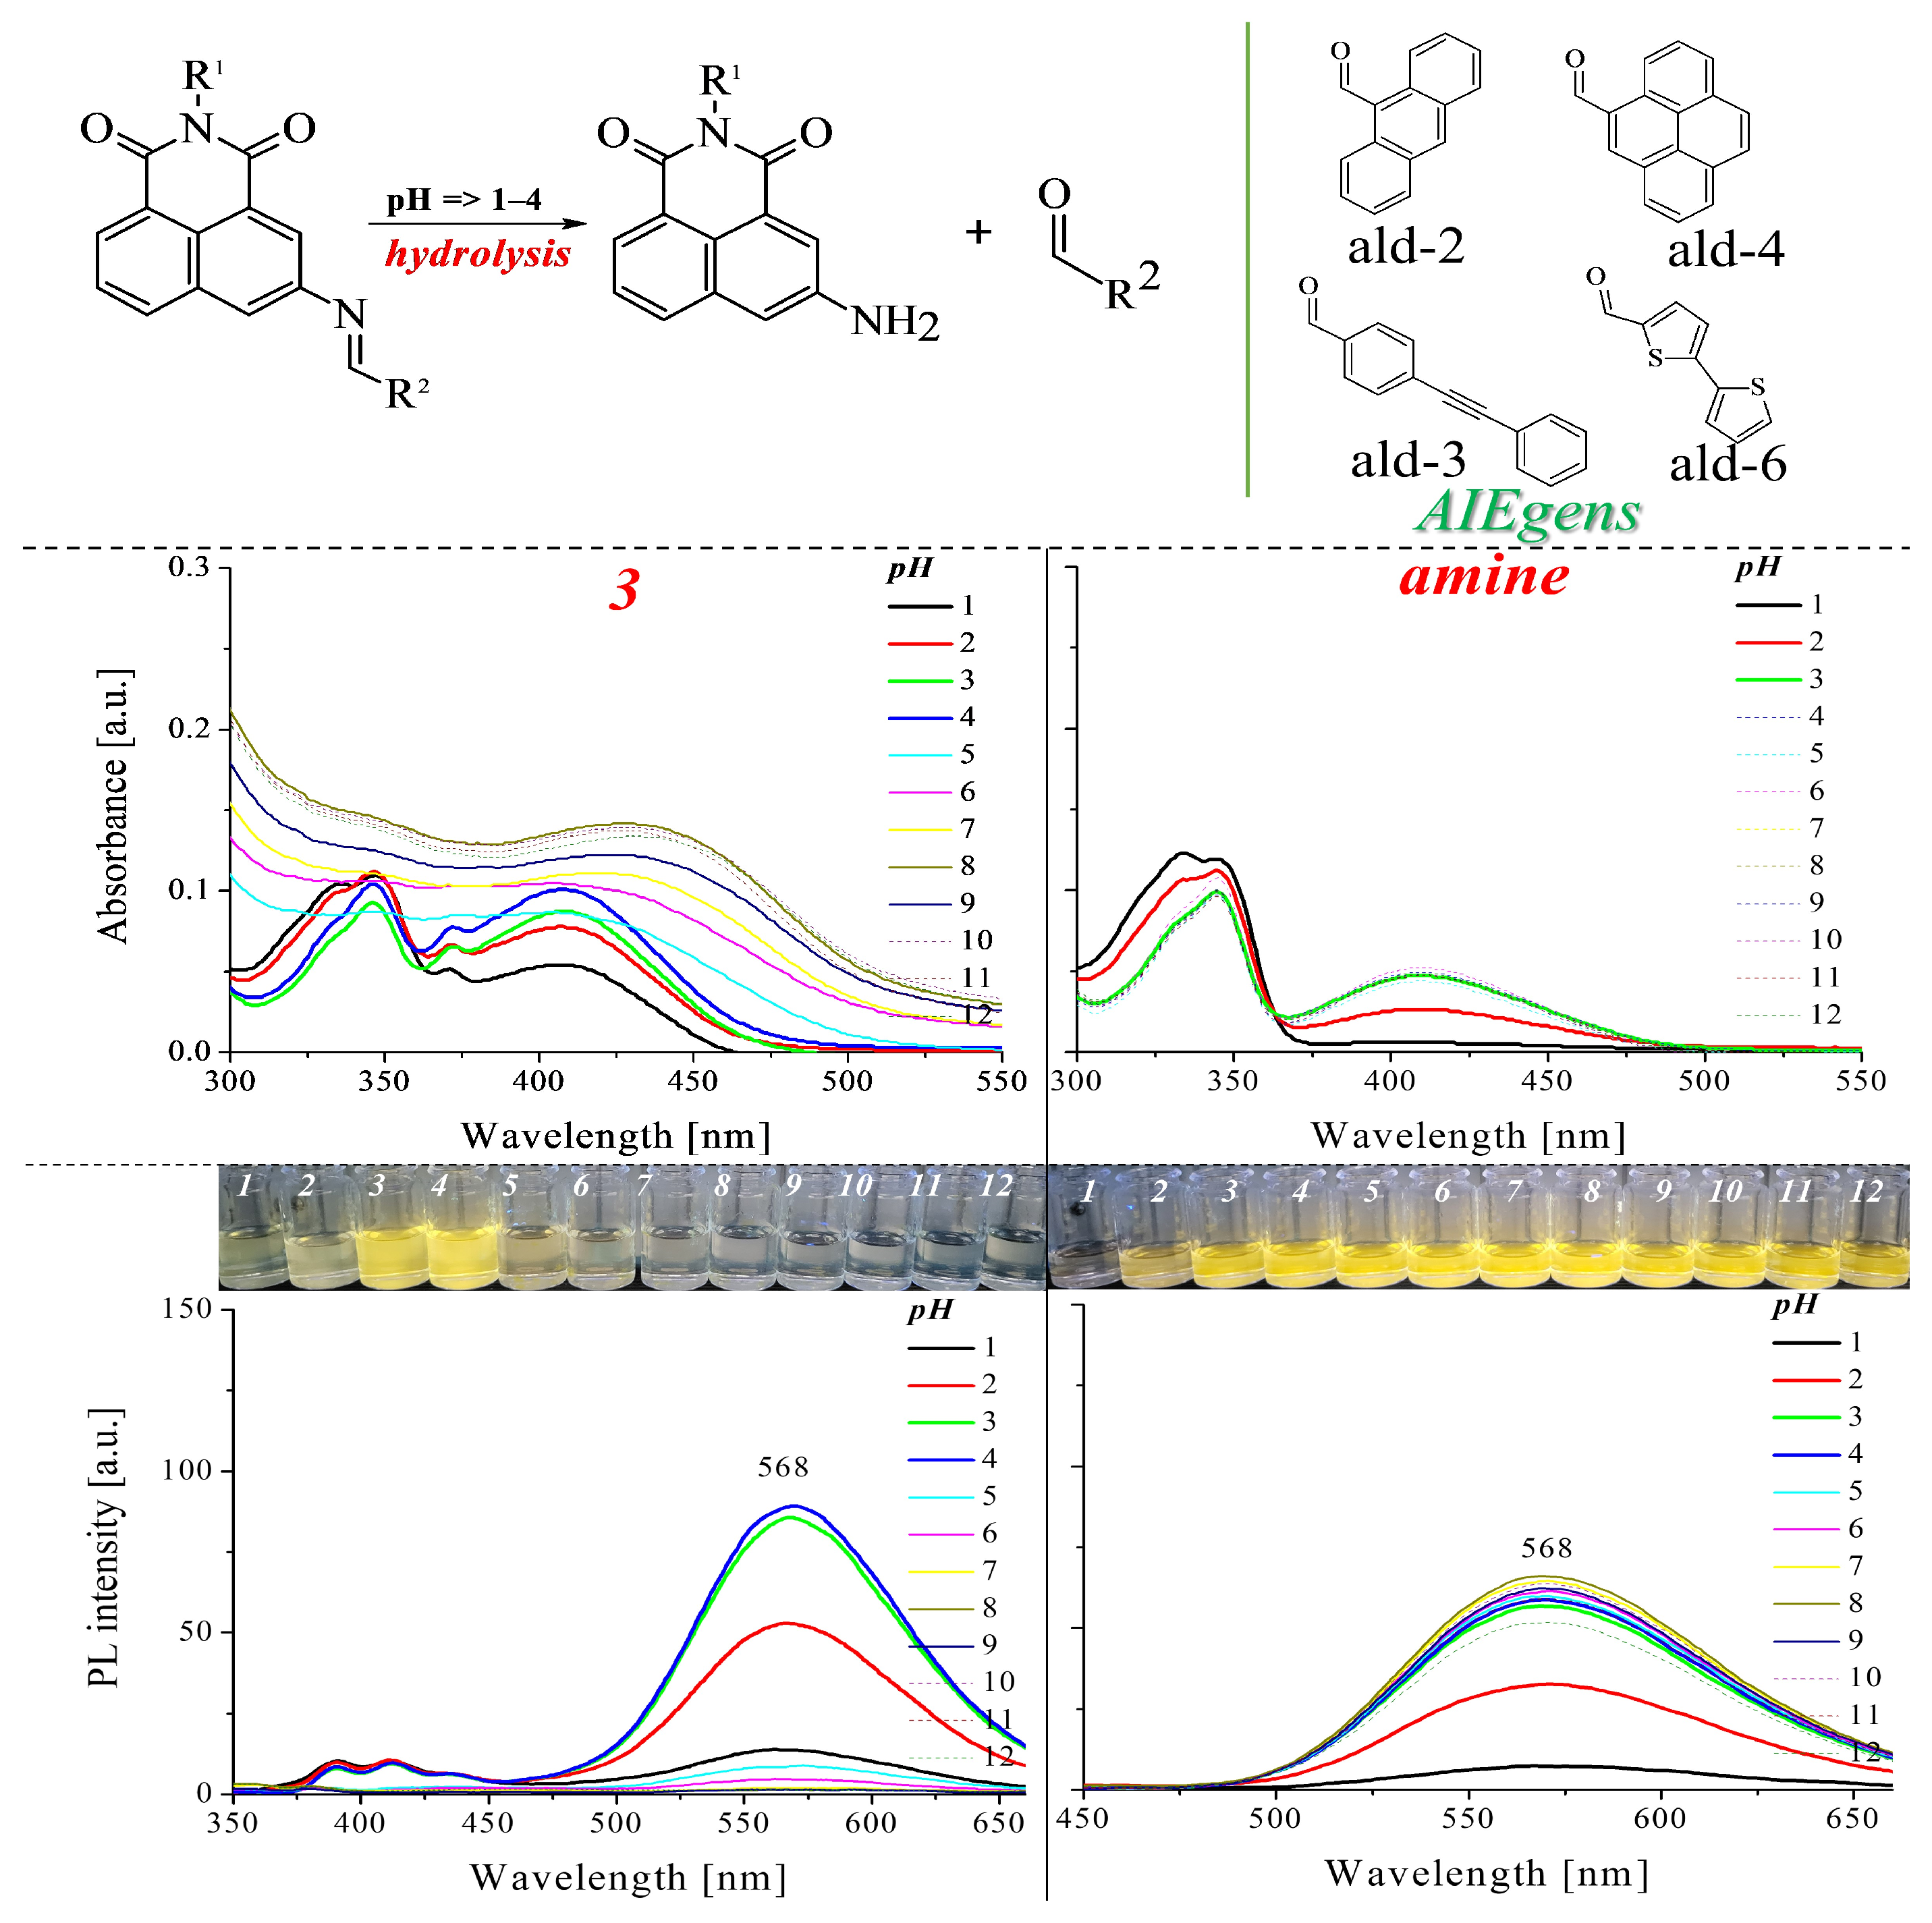
2.2.3. Protonation of the Imine Bond
2.2.4. Properties of Compounds at Different pHs
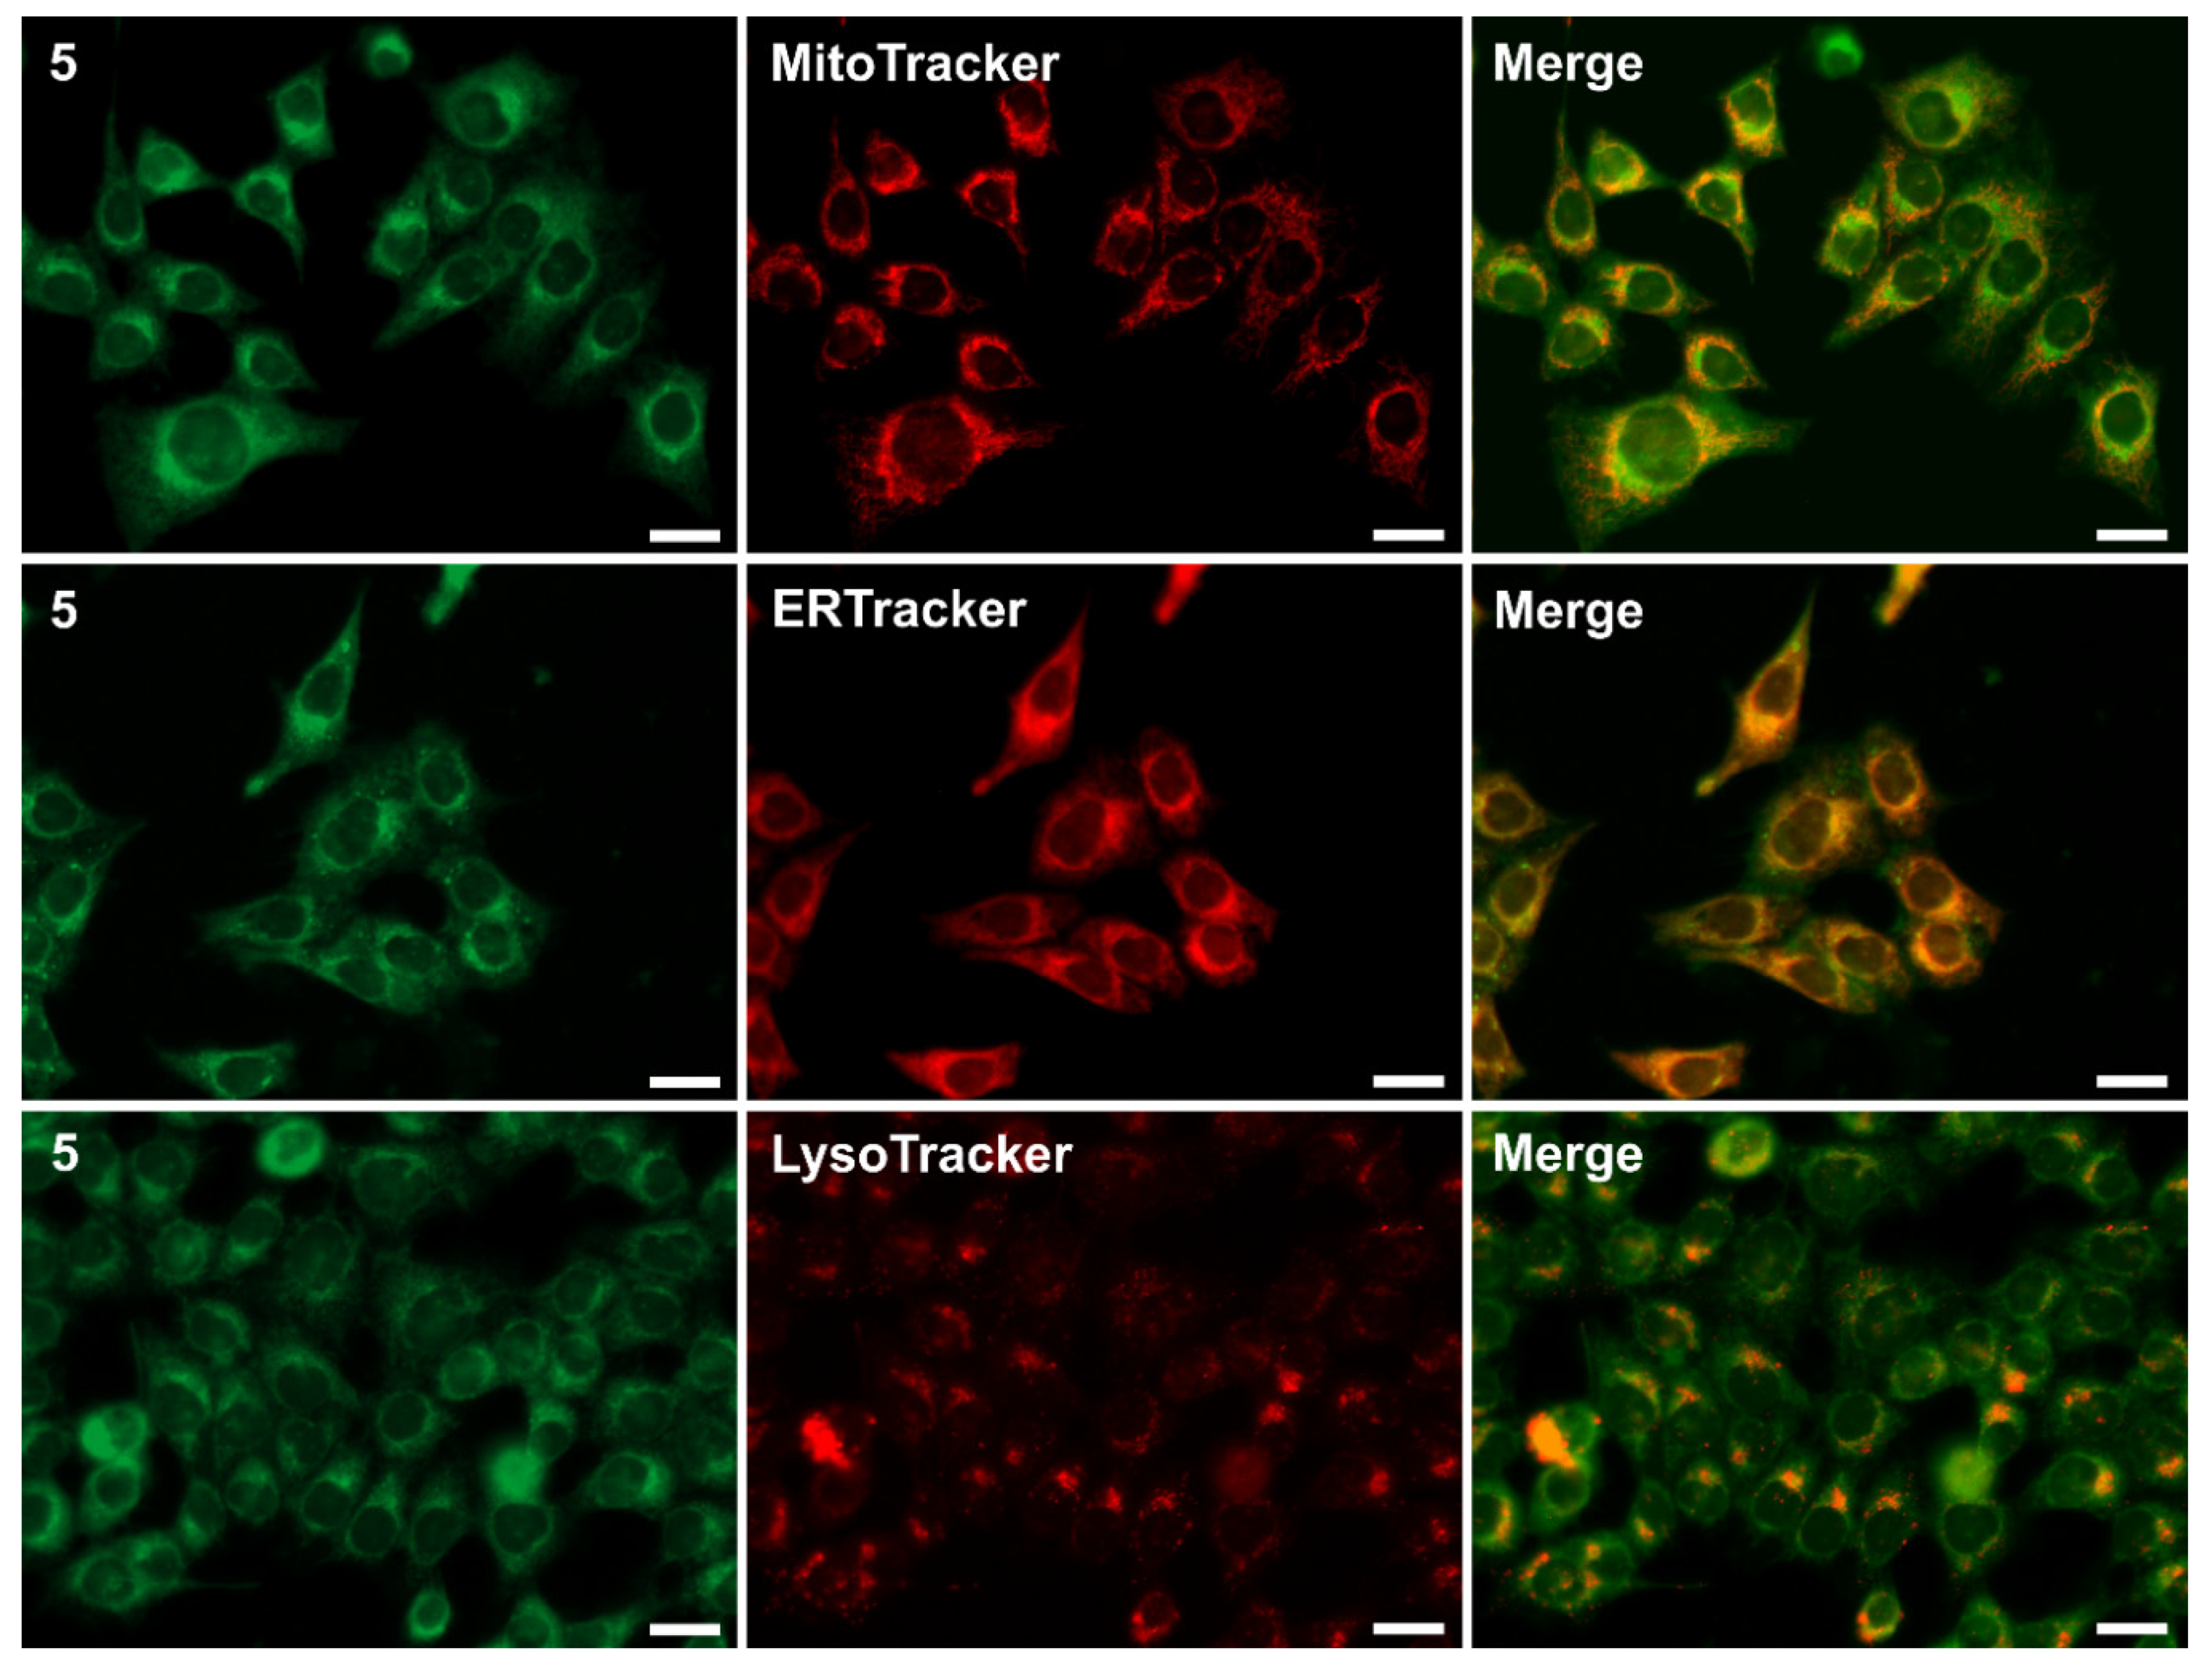
2.3. Biological Studies: Cytotoxicity and Cellular Imaging
3. Conclusions
Supplementary Materials
Author Contributions
Funding
Institutional Review Board Statement
Informed Consent Statement
Data Availability Statement
Conflicts of Interest
Sample Availability
References
- Kagatikar, S.; Sunil, D. A systematic review on 1,8-naphthalimide derivatives as emissive materials in organic light-emitting diodes. J. Mater. Sci. 2022, 57, 105–139. [Google Scholar] [CrossRef]
- Gudeika, D. A review of investigation on 4-substituted 1,8-naphthalimide derivatives. Synth. Met. 2020, 262, 16328. [Google Scholar] [CrossRef]
- Dong, H.Q.; Wei, T.B.; Ma, X.Q.; Yang, Q.Y.; Zhang, Y.F.; Sun, Y.J.; Shi, B.B.; Yao, H.; Zhang, Y.M.; Lin, Q. 1,8-Naphthalimide-based fluorescent chemosensors: Recent advances and perspectives. J. Mater. Chem. C 2020, 8, 13501–13529. [Google Scholar] [CrossRef]
- Tomczyk, M.D.; Walczak, K.Z. l,8-Naphthalimide based DNA intercalators and anticancer agents. A systematic review from 2007 to 2017. Eur. J. Med. Chem. 2018, 159, 393–422. [Google Scholar] [CrossRef] [PubMed]
- Yua, H.; Guo, Y.; Zhuc, W.; Havenerd, K.; Zheng, X. Recent advances in 1,8-naphthalimide-based small-molecule fluorescent probes for organelles imaging and tracking in living cells. Coord. Chem. Rev. 2021, 444, 214019. [Google Scholar] [CrossRef]
- Fu, Y.; Pang, X.X.; Wang, Z.Q.; Qu, H.T.; Ye, F. Synthesis and Fluorescent Property Study of Novel 1,8-Naphthalimide-Based Chemosensors. Molecules 2018, 23, 376. [Google Scholar] [CrossRef]
- Parkesh, R.; Lee, T.C.; Gunnlaugsson, T. Highly selective 4-amino-1,8-naphthalimide based fluorescent photoinduced electron transfer (PET) chemosensors for Zn(II) under physiological pH conditions. Org. Biomol. Chem. 2007, 5, 310–317. [Google Scholar] [CrossRef] [PubMed]
- Leslie, K.G.; Jacquemin, D.; New, E.J.; Jolliffe, K.A. Expanding the Breadth of 4-Amino-1,8-naphthalimide Photophysical Properties through Substitution of the Naphthalimide Core. Chem. Eur. J. 2018, 24, 5569–5573. [Google Scholar] [CrossRef] [PubMed]
- Kusano, S.; Nakamura, S.; Izumi, M.; Hagihara, S. Development of 1,8-naphthalimide dyes for rapid imaging of subcellular compartments in plants. Chem. Comm. 2022, 58, 1685–1688. [Google Scholar] [CrossRef] [PubMed]
- Liu, D.Y.; Qi, J.; Liu, X.Y.; He, H.R.; Chen, J.T.; Yanga, G.M. 4-Amino-1,8-naphthalimide-based fluorescent sensor with high selectivity and sensitivity for Zn2+ imaging in living cells. Inorg. Chem. Commun. 2014, 43, 173–178. [Google Scholar] [CrossRef]
- Banerjee, S.; Kitchen, J.A.; Gunnlaugsson, T.; Kelly, J.M. The effect of the 4-amino functionality on the photophysical and DNA binding properties of alkyl-pyridinium derived 1,8-naphthalimides. Org. Biomol. Chem. 2013, 11, 5642–5655. [Google Scholar] [CrossRef] [PubMed]
- Veale, E.B.; Frimannsson, D.O.; Lawler, M.; Gunnlaugsson, T. 4-Amino-1,8-naphthalimide-Based Troger’s Bases As High Affinity DNA Targeting Fluorescent Supramolecular Scaffolds. Org. Lett. 2009, 11, 4040–4043. [Google Scholar] [CrossRef]
- Adair, L.D.; Trinh, N.; Vérité, P.M.; Jacquemin, D.; Jolliffe, K.A.; New, E.J. Synthesis of Nitro-Aryl Functionalised 4-Amino-1,8-Naphthalimides and Their Evaluation as Fluorescent Hypoxia Sensors. Chem. Eur. J. 2020, 26, 10064–10071. [Google Scholar] [CrossRef] [PubMed]
- Fleming, C.L.; Ashton, T.D.; Pfeffer, F.M. Synthesis of 4-amino substituted 1,8-naphthalimide derivatives using palladium-mediated amination. Dyes Pigm. 2014, 109, 135–143. [Google Scholar] [CrossRef]
- Nicolescu, A.; Airinei, A.; Georgescu, E.; Georgescu, F.; Tigoianu, R.; Oancea, F.; Deleanu, C. Synthesis, photophysical properties and solvatochromic analysis of some naphthalene-1,8-dicarboxylic acid derivatives. J. Mol. Liq. 2020, 303, 112626. [Google Scholar] [CrossRef]
- Yadav, P.; Laddha, H.; Agarwal, M.; Gupta, R. Colorimetric assay of fluoride goes digital: On the spot testing of F− ions in water using smartphone’s digital imaging and test strip assay by a novel chromofluorogenic receptor based on 1,8-naphthalimide. J. Mol. Liq. 2021, 324, 114690. [Google Scholar] [CrossRef]
- Wang, Z.; Guo, X.; Jia, L.; Zhao, Z.; Yang, R.; Zhang, Y. Novel 4,4′-Binaphthalimidyl derivatives with carboxyalkyl side chains: Synthesis, Aggregation-induced emission, Hydrogel and Cell imaging. J. Mol. Liq. 2023, 381, 121796. [Google Scholar] [CrossRef]
- Wu, N.; Zhao, L.; Jiang, C.; Li, P.; Liu, Y.; Fu, Y.; Ye, F. A naked-eye visible colorimetric and fluorescent chemosensor for rapid detection of fluoride anions: Implication for toxic fluorine-containing pesticides detection. J. Mol. Liq. 2020, 302, 112549. [Google Scholar] [CrossRef]
- Shiraishi, Y.; Hayashi, N.; Nakahata, M.; Sakai, S.; Hirai, T. Naphthalimide–coumarin conjugate: Ratiometric fluorescent receptor for self-calibrating quantification of cyanide anions in cells. RSC Adv. 2017, 7, 32304–32309. [Google Scholar] [CrossRef]
- Yang, L.; Liu, Y.L.; Liu, C.G.; Fu, Y.; Ye, F. A naked-eye visible colorimetric and ratiometric chemosensor based on Schiff base for fluoride anion detection. J. Mol. Struct. 2021, 1236, 130343. [Google Scholar] [CrossRef]
- Kumar, G.; Singh, I.; Goel, R.; Paul, K.; Luxami, V. Dual-channel ratiometric recognition of Al3+ and F− ions through an ESIPT-ESICT signalling mechanism. Spectrochim. Acta A Mol. Biomol. 2021, 247, 119112. [Google Scholar] [CrossRef]
- Hearn, K.N.; Ashton, T.D.; Acharya, R.; Feng, Z.; Gueven, N.; Pfeffer, F.M. Direct Amidation to Access 3-Amido-1,8-Naphthalimides Including Fluorescent Scriptaid Analogues as HDAC Inhibitors. Cells 2021, 10, 1505. [Google Scholar] [CrossRef] [PubMed]
- Shiraishi, Y.; Nakatani, R.; Takagi, S.; Yamada, C.; Hirai, T. A Naphthalimide–Sulfonylhydrazine Conjugate as a Fluorescent Chemodosimeter for Hypochlorite. Chemosensors 2020, 8, 123. [Google Scholar] [CrossRef]
- Johnson, I.R.D.; Rudebeck, E.E.; Sweetman, M.J.; Sorvina, A.; Ashton, T.D.; Pfeffer, F.M.; Brooks, D.A.; Hickey, S.M. A 3,4-dimethoxy-1,8-naphthalimide for lipid droplet imaging in live and fixed cells. Sens. Actuators B Chem. 2022, 365, 131921. [Google Scholar] [CrossRef]
- Sharma, H.; Sidhu, J.S.; Hassen, W.M.; Singh, N.; Dubowski, J.J. Synthesis of a 3,4-Disubstituted 1,8-Naphthalimide-Based DNA Intercalator for Direct Imaging of Legionella pneumophila. ACS Omega 2019, 4, 5829–5838. [Google Scholar] [CrossRef]
- Kotowicz, S.; Korzec, M.; Siwy, M.; Golbac, S.; Malecki, J.G.; Janeczek, H.; Mackowski, S.; Bednarczyk, K.; Libera, M.; Schab-Balcerzaka, E. Novel 1,8-naphthalimides substituted at 3-C position: Synthesis and evaluation of thermal, electrochemical and luminescent properties. Dyes Pigm. 2018, 158, 65–78. [Google Scholar] [CrossRef]
- Korzec, M.; Kotowicz, S.; Rzycka-Korzec, R.; Schab-Balcerzak, E.; Małecki, J.G.; Czichy, M.; Łapkowski, M. Novel b-ketoenamines versus azomethines for organic electronics: Characterization of optical and electrochemical properties supported by theoretical studies. J. Mater. Sci. 2020, 55, 3812–3832. [Google Scholar] [CrossRef]
- Korzec, M.; Malarz, K.; Mrozek-Wilczkiewicz, A.; Rzycka-Korzec, R.; Schab-Balcerzak, E.; Polański, J. Live cell imaging by 3-imino-(2-phenol)-1,8-naphthalimides: The effect of ex vivo hydrolysis. Spectrochim. Acta A Mol. Biomol. 2020, 238, 118442. [Google Scholar] [CrossRef]
- Kotowicz, S.; Korzec, M.; Malarz, K.; Krystkowska, A.; Mrozek-Wilczkiewicz, A.; Golba, S.; Siwy, M.; Maćkowski, S.; Schab-Balcerzak, E. Luminescence and Electrochemical Activity of New Unsymmetrical 3-Imino-1,8-naphthalimide Derivatives. Materials 2021, 14, 5504. [Google Scholar] [CrossRef]
- Korzec, M.; Kotowicz, S.; Gawecki, R.; Malarz, K.; Mrozek-Wilczkiewicz, A.; Siwy, M.; Schab-Balcerzak, E.; Grzelak, J.; Maćkowski, S. 1,8-Naphthalimides 3-substituted with imine or β-ketoenamine unit evaluated as compounds for organic electronics and cell imaging. Dyes Pigm. 2021, 193, 109508. [Google Scholar] [CrossRef]
- Gao, Z.; Hao, Y.; Zheng, M.; Chen, Y. A fluorescent dye with large Stokes shift and high stability: Synthesis and application to live cell imaging. RSC Adv. 2017, 7, 7604–7609. [Google Scholar] [CrossRef]
- Leung, C.W.T.; Hong, Y.; Chen, S.; Zhao, E.; Lam, J.W.Y.; Tang, B.Z. A Photostable AIE Luminogen for Specific Mitochondrial Imaging and Tracking. J. Am. Chem. Soc. 2013, 135, 62–65. [Google Scholar] [CrossRef] [PubMed]
- Yongchao, Y.; Hao, F.; Jian, W.; Chuanrong, C.; Wang, Q.; Yourong, D.; Jianli, H. A photo-stable and reversible pH-responsive nano-agent based on the NIR phenazine dye for photoacoustic imaging-guided photothermal therapy. Chem. Commun. 2019, 55, 10940–10943. [Google Scholar]
- Chathura, S.A.; Kaveesha, J.W.; Robert, V.S.; Yi, P. Lysosome imaging in cancer cells by pyrene-benzothiazolium dyes: An alternative imaging approach for LAMP-1 expression based visualization methods to avoid background interference. Bioorg. Chem. 2019, 91, 103144. [Google Scholar]
- Li, B.; Zhao, M.; Feng, L.; Dou, C.; Ding, S.; Zhou, G.; Lu, L.; Zhang, H.; Chen, F.; Li, X.; et al. Organic NIR-II molecule with long blood half-life for in vivo dynamic vascular imaging. Nat. Commun. 2020, 11, 3102. [Google Scholar] [CrossRef]
- Kotowicz, S.; Korzec, M.; Małecki, J.G.; Siwy, M.; Maćkowski, S.; Schab-Balcerzak, E. Six New Unsymmetrical Imino-1,8-naphthalimide Derivatives Substituted at 3-C position–Photophysical Investigations. Materials 2022, 15, 7043. [Google Scholar] [CrossRef] [PubMed]
- Bains, G.K.; Kim, S.H.; Sorin, E.J.; Narayanaswami, V. The Extent of Pyrene Excimer Fluorescence Emission Is a Reflector of Distance and Flexibility: Analysis of the Segment Linking the LDL Receptor-Binding and Tetramerization Domains of Apolipoprotein E3. Biochemistry 2012, 31, 6207–6219. [Google Scholar] [CrossRef] [PubMed]
- Bains, G.; Patel, A.B.; Narayanaswami, V. Pyrene: A Probe to Study Protein Conformation and Conformational Changes. Molecules 2011, 16, 7909–7935. [Google Scholar] [CrossRef]
- Zhao, C.; Cai, X.; Ma, Z.; Shi, J.; Xu, L.; Wang, H. Excimer formation from particially overlapped anthracene dimer based on saddle-shaped cyclooctatetrathiophene as spacer. J. Photochem. Photobiol. A Chem. 2018, 355, 318–325. [Google Scholar] [CrossRef]
- Cao, J.; Wu, H.; Zheng, Y.; Nie, F.; Li, M.; Zou, C. Hydrogen-bonding study of photoexcited 4-nitro-1,8-naphthalimide in hydrogen-donating solvents. Open Phys. 2016, 14, 621–627. [Google Scholar] [CrossRef]
- Wang, X.; Wang, Z.; Feng, H.; Lin, C.; Shi, H.; An, Z.; Su, Z.M.; Liang, F.S. Activating room-temperature phosphorescence of 1,8-naphthalimide by doping into aromatic dicarboxylic acids. Chem. Commun. 2022, 58, 3641. [Google Scholar] [CrossRef] [PubMed]
- Gopikrishna, P.; Meher, N.; Iyer, P.K. Functional 1,8-Naphthalimide AIE/AIEEgens: Recent Advances and Prospects. ACS Appl. Mater. Interfaces 2018, 10, 12081–12111. [Google Scholar] [CrossRef] [PubMed]
- Chatterjee, A.; Chatterjee, J.; Sappati, S.; Sheikh, T.; Umesh, R.M.; Ambhore, M.D.; Lahiri, M.; Hazra, P. Emergence of Aggregation Induced Emission (AIE), Room-Temperature Phosphorescence (RTP), and Multistimuli Response from a Single Organic Luminogen by Directed Structural Modification. J. Phys. Chem. B 2021, 125, 12832–12846. [Google Scholar] [CrossRef] [PubMed]
- Pramanik, B.; Das, D. Aggregation-Induced Emission or Hydrolysis by Water? The Case of Schiff Bases in Aqueous Organic Solvents. J. Phys. Chem. 2018, 122, 3655–3661. [Google Scholar] [CrossRef]
- Senkała, S.; Małecki, J.G.; Vasylieva, M.; Łabuz, A.; Nosek, K.; Piwowarczyk, K.; Czyż, J.; Schab-Balcerzak, E.; Janeczek, H.; Korzec, M. Hydrolysis of Schiff bases with phenyl-ethynyl-phenyl system: The importance for biological and physicochemical studies. J. Photochem. Photobiol. B Biol. 2020, 212, 112020. [Google Scholar] [CrossRef]
- Jia, X.; Yang, Y.; Xu, Y.; Qian, X. Naphthalimides for labeling and sensing applications. Pure Appl. Chem. 2014, 86, 1237–1246. [Google Scholar] [CrossRef]
- Georgiev, N.I.; Bakov, V.V.; Bojinov, V.B. Photoinduced Electron Transfer and Aggregation-Induced Emission in 1,8-Naphthalimide Probes as a Platform for Detection of Acid/Base Vapors. Photonics 2022, 9, 994. [Google Scholar] [CrossRef]
- Hwang, T.G.; Han, G.R.; Lee, J.M.; Lee, J.W.; Kim, H.M.; Hwang, D.; Kim, S.K.; Kim, J.P. Fluorescence Quenching of 4,4′-Dimethoxytriphenylamine-Substituted Diketopyrrolopyrrole via Intramolecular Photoinduced Electron Transfer. Phys. Chem. C 2019, 39, 24263–24274. [Google Scholar] [CrossRef]
- Bolte, S.; Cordelières, F.P. A guided tour into subcellular colocalization analysis in light microscopy. J. Microsc. 2006, 224, 213–232. [Google Scholar] [CrossRef]


| Medium | dis. in: | Code | λmax (ε × 104) | λem | Stokes Shift | Φ | Code | λmax (ε × 104) | λem | Stokes Shift | Φ |
|---|---|---|---|---|---|---|---|---|---|---|---|
| [nm] | [nm] | [nm] | [%] | [nm] | [nm] | [nm] | [%] | ||||
| CH2Cl2 | solvent | 1 | 3244.62, 372sh | 470 | 146 | - | 2 | 3347.21, 374sh | 470 | 136 | - |
| CHCl3 a | 3302.87, 372sh | 470 | 140 | 1.65 | 3354.01, 372sh | 470 | 135 | 0.1 | |||
| DMSO a | 3254.8, 372sh | 509 | 184 | 0.97 | 3356.76, 372sh | 511 | 176 | 0.16 | |||
| CH3CN | solvent | 3205.74, 373sh | 504 | 184 | - | 33014.85, 372sh | 508 | 178 | - | ||
| CHCl3 a | 3304,5, 373sh | 504 | 174 | - | 3305.16, 370sh | 501 | 171 | - | |||
| DMSO a | 3204,5, 372sh | 509 | 189 | - | 3306.52, 370sh | 508 | 178 | - | |||
| CH3OH | solvent | 3245.65, 374sh | 540 | 216 | - | 3338.13, 430sh | 538 | 205 | - | ||
| CHCl3 a | 3242.9, 371sh | 540 | 216 | 4.7 | 3334.13, 427sh | 538 | 205 | 4.95 | |||
| DMSO a | 3253.6, 370sh | 540 | 215 | 5.25 | 3325.40, 427sh | 538 | 206 | 4.94 | |||
| CH2Cl2 | solvent | 3 | 3351.22, 4111.48 | 473 | 62 | - | 4 | 3804.43, 4064.01 | 472 | 66 | - |
| CHCl3 a | 3211.01, 4151.26 | 473 | 58 | 1.9 | 3792.14, 4091.92 | 472 | 63 | 0.47 | |||
| DMSO a | 3371.55, 4101.88 | 511 | 101 | 0.28 | 3793.49, 4083.18 | 520 | 112 | 0.96 | |||
| CH3CN | solvent | 3372.06, 4062.39 | 505 | 99 | - | - | - | - | - | ||
| CHCl3 a | 3361.37, 4061.59 | 505 | 99 | - | 3752.93, 4032.51 | 512 | 109 | - | |||
| DMSO a | 3351.54, 4071.75 | 507 | 100 | - | 3763.72, 4053.12 | 512 | 107 | - | |||
| CH3OH | solvent | - | - | - | - | - | - | - | - | ||
| CHCl3 a | 3381.75, 4101.59 | 537 | 127 | 3.92 | 3422.32, 3752.39, 4072.05 | 548 | 141 | 0.15 | |||
| DMSO a | 3301.75, 4101.94 | 537 | 127 | 0.36 | 3442.12, 3762.26, 4081.94 | 553 | 145 | 0.19 | |||
| CH2Cl2 | solvent | 5 | 3506.78 | 470, 553 | 120 | - | 6 | 3504.29, 3844.85 | 475 | 91 | - |
| CHCl3 a | 3482.26 | 480, 553 | 132 | 10.83 | 3502.25, 3822.57 | 484 | 102 | 1.26 | |||
| DMSO a | 3503.97 | 557 | 207 | 11.32 | 3503.11, 3843.43 | 514 | 130 | 0.39 | |||
| CH3CN | solvent | 3483.37 | 507 | 159 | - | 3504.68, 3775.13 | 510 | 133 | - | ||
| CHCl3 a | 3472.72 | 507 | 160 | - | 3473.28, 3803.53 | 510 | 130 | - | |||
| DMSO a | 3474.23 | 511 | 164 | - | 3473.31, 3803.56 | 514 | 134 | - | |||
| CH3OH | solvent | 3474.27 | 550 | 203 | - | - | - | - | - | ||
| CHCl3 a | 3472.43 | 545 | 198 | 2.37 | 3503.04, 3773.27 | 443, 550 | 66 | 1.35 | |||
| DMSO a | 3463.17 | 550 | 204 | 3.69 | 3503.14, 3773.43 | 440, 550 | 63 | 1.34 | |||
| CH2Cl2 | solvent | 7 | 3335.77, 375sh | 473 | 140 | - | 8 | 3334.90, 374sh | 476 | 143 | - |
| CHCl3 a | 3332.67, 375sh | 474 | 141 | 0.15 | 3324.42, 375sh | 475 | 143 | 0.91 | |||
| DMSO a | 3333.66, 375sh | 504 | 171 | 0.27 | 3334.08, 375sh | 508 | 175 | 0.76 | |||
| CH3CN | solvent | 3296.20, 368sh | 503 | 174 | - | 3306.50, 370sh | 502 | 172 | - | ||
| CHCl3 a | 3322.99, 369sh | 504 | 172 | - | 3305.40, 370sh | 502 | 172 | - | |||
| DMSO a | 3313.59, 369sh | 504 | 173 | - | 3304.21, 370sh | 506 | 176 | - | |||
| CH3OH | solvent | - | - | - | - | - | - | - | - | ||
| CHCl3 a | 3322.66, 375sh | 520 | 188 | 17.64 | 3324.64, 375sh | 520 | 188 | 19.24 | |||
| DMSO a | 3312.99, 375sh | 520 | 189 | 12.34 | 3323.34, 375sh | 520 | 188 | 15.38 |
| Code | Antiproliferative Activity–IC50 [µM] | ||||
|---|---|---|---|---|---|
| LogP * | HCT 116 | MCF-7 | U-251 | NHDF | |
| 1 | 6.17 ± 0.91 | >25 | >25 | >25 | >25 |
| 2 | 7.08 ± 0.94 | >25 | >25 | >25 | >25 |
| 3 | 6.98 ± 0.90 | 22.27 ± 2.12 | 21.31 ± 1.64 | >25 | >25 |
| 4 | 7.13 ± 0.93 | >25 | >25 | >25 | >25 |
| 5 | 4.03 ± 0.92 | >25 | >25 | >25 | >25 |
| 6 | 5.39 ± 0.96 | >25 | >25 | >25 | >25 |
| 7 | 5.70 ± 0.96 | 20.31 ± 2.36 | 17.90 ± 1.36 | >25 | >25 |
| 8 | 5.29 ± 1.00 | 24.23 ± 3.26 | >25 | >25 | >25 |
| Code | Pearson’s Coefficient | ||
|---|---|---|---|
| Mitochondria | Endoplasmic Reticulum | Lysosomes | |
| 5 | 0.852 | 0.943 | 0.776 |
Disclaimer/Publisher’s Note: The statements, opinions and data contained in all publications are solely those of the individual author(s) and contributor(s) and not of MDPI and/or the editor(s). MDPI and/or the editor(s) disclaim responsibility for any injury to people or property resulting from any ideas, methods, instructions or products referred to in the content. |
© 2023 by the authors. Licensee MDPI, Basel, Switzerland. This article is an open access article distributed under the terms and conditions of the Creative Commons Attribution (CC BY) license (https://creativecommons.org/licenses/by/4.0/).
Share and Cite
Korzec, M.; Kotowicz, S.; Malarz, K.; Mrozek-Wilczkiewicz, A. Spectroscopic and Biological Properties of the 3-Imino-1,8-naphthalimide Derivatives as Fluorophores for Cellular Imaging. Molecules 2023, 28, 6255. https://doi.org/10.3390/molecules28176255
Korzec M, Kotowicz S, Malarz K, Mrozek-Wilczkiewicz A. Spectroscopic and Biological Properties of the 3-Imino-1,8-naphthalimide Derivatives as Fluorophores for Cellular Imaging. Molecules. 2023; 28(17):6255. https://doi.org/10.3390/molecules28176255
Chicago/Turabian StyleKorzec, Mateusz, Sonia Kotowicz, Katarzyna Malarz, and Anna Mrozek-Wilczkiewicz. 2023. "Spectroscopic and Biological Properties of the 3-Imino-1,8-naphthalimide Derivatives as Fluorophores for Cellular Imaging" Molecules 28, no. 17: 6255. https://doi.org/10.3390/molecules28176255
APA StyleKorzec, M., Kotowicz, S., Malarz, K., & Mrozek-Wilczkiewicz, A. (2023). Spectroscopic and Biological Properties of the 3-Imino-1,8-naphthalimide Derivatives as Fluorophores for Cellular Imaging. Molecules, 28(17), 6255. https://doi.org/10.3390/molecules28176255