Article

Evaluation of α-Glucosidase Inhibition and Antihyperglycemic Activity of Extracts Obtained from Leaves and Flowers of Rumex crispus L.

by
Dolores G. Aguila-Muñoz
1,*,
Fabiola E. Jiménez-Montejo
1,
Víctor E. López-López
1,
Aarón Mendieta-Moctezuma
1,
Jorge Rodríguez-Antolín
2,
Jorge Cornejo-Garrido
3 and
María C. Cruz-López
1,*
1
Centro de Investigación en Biotecnología Aplicada, Instituto Politécnico Nacional, Tlaxcala 90700, Mexico
2
Centro Tlaxcala de Biología de la Conducta, Universidad Autónoma de Tlaxcala, Tlaxcala 90070, Mexico
3
Laboratorio de Biología Celular y Productos Naturales, Escuela Nacional de Medicina y Homeopatía, Instituto Politécnico Nacional, Ciudad de México 07320, Mexico
*
Authors to whom correspondence should be addressed.
Molecules 2023, 28(15), 5760; https://doi.org/10.3390/molecules28155760
Submission received: 20 June 2023 / Revised: 24 July 2023 / Accepted: 27 July 2023 / Published: 30 July 2023

Abstract

:
Among antihyperglycemic drugs used for treating diabetes, α-glucosidase inhibitors generate the least adverse effects. This contribution aimed to evaluate the potential antidiabetic activity of Rumex crispus L. by testing its in vitro α-glucosidase inhibition and in vivo antihyperglycemic effects on rats with streptozotocin (STZ)-induced diabetes. Better inhibition of α-glucosidase was found with the methanol extract versus the n-hexane and dichloromethane extracts. The methanol extract of the flowers (RCFM) was more effective than that of the leaves (RCHM), with an IC50 of 7.3 ± 0.17 μg/mL for RCFM and 112.0 ± 1.23 μg/mL for RCHM. A bioactive fraction (F89s) also showed good α-glucosidase inhibition (IC50 = 3.8 ± 0.11 μg/mL). In a preliminary study, RCHM and RCFM at 150 mg/kg and F89s at 75 mg/kg after 30 days showed a significant effect on hyperglycemia, reducing glucose levels (82.2, 80.1, and 84.1%, respectively), and improved the lipid, renal, and hepatic profiles of the rats, comparable with the effects of metformin and acarbose. According to the results, the activity of R. crispus L. may be mediated by a diminished rate of disaccharide hydrolysis, associated with the inhibition of α-glucosidase. Thus, R. crispus L. holds promise for the development of auxiliary drugs to treat diabetes mellitus.

Graphical Abstract

1. Introduction

Diabetes, a chronic disease characterized by hyperglycemia, occurs due to insulin resistance or the lack of production of insulin. It is often associated with disorders related to the metabolism of fat, carbohydrates, and proteins [1]. Diabetic patients frequently suffer from complications caused by hyperglycemia, such as cardiovascular disorders, renal failure, neuropathy, lipid metabolism disorders, common infections, and cancer. The resulting decrease in the quality of life, in some cases leading to death [2,3], emphasizes the importance of controlling the blood glucose level of diabetic patients.
According to the International Diabetes Federation (IDF), the global prevalence of diabetes in 2019 was estimated at 9.3% of the world population (463 million people). It is projected to rise to 10.2% (578 million individuals) by 2030 and 10.9% (700 million subjects) by 2045 [4].
Drugs for controlling hyperglycemia have generally been associated with adverse effects, including the inhibition of liver regeneration, weight gain, osteoporosis, and increased cardiovascular episodes [5]. However, one therapeutic mechanism for the treatment of diabetes is considered to have null adverse effects because its activity is not involved in modulating complex biochemical processes but instead limited to the gut [6,7,8,9,10]. This mechanism, the inhibition of α-glucosidase, triggers a reduction in the digestion and absorption of dietary carbohydrates and in turn in the postprandial level of blood glucose and the demand for insulin. Especially interesting is the development of phytochemicals, mainly phenolic compounds capable of inhibiting α-amylase and α-glucosidase enzymes, as new antidiabetic agents [11,12,13].
Rumex L. (Polygonaceae) plants have been widely used to treat various diseases and ailments, including cancer and diabetes, due to their diversity of biologically active compounds. The roots, leaves, and fruit of Rumex crispus L. have been used in traditional medicine as a tonic, laxative, antipyretic, expectorant, antitussive, and vermicide, as well as for treating skin disorders, jaundice, gastrointestinal diseases, venereal diseases, diabetes, gonorrhea, and eye infections. In addition, the young leaves are eaten in soups and salads, and the seeds are used in baking cakes and as a coffee substitute [14,15,16,17]. Curiously, almost no information is available on the therapeutic potential of this plant as an antidiabetic agent. Hence, this study aimed to evaluate the effect of the leaves and flowers of R. crispus L. as an in vitro inhibitor of ⍺-glucosidase and an in vivo antihyperglycemic agent in rats with streptozotocin (STZ)-induced diabetes.

2. Results

2.1. Plant Material and Preparation of the Extracts

The yields (w/w) of the extraction were affected by both the plant organ being processed and the polarity of the solvent (Table 1). They were 0.75 to 0.95% for the extracts obtained with n-hexane (low polarity), 0.75 to 1.11% with dichloromethane (DCM; medium polarity), and 4.84 to 11.19% with methanol (high polarity). The methanol extract of the flowers (RCFM) afforded the highest yield, followed by the methanol extract of the leaves (RCHM).

2.2. Quantitative Phytochemical Analysis

The total phenolics, polyphenols, flavonoids, condensed tannins, sterols, saponins, and alkaloids of extracts of the leaves and flowers of R. crispus L. were quantified and are presented in Table 2. The content of total phenolics and polyphenols was considerably higher in RCHM and RCFM (260.76 ± 1.77 and 662.31 ± 4.51 mg EGA/g, and 108.65 ± 0.46 and 837.44 ± 7.50 mg ETA/g, respectively), while RCHD and RCFD recorded the highest concentration of flavonoids (190.57 ± 0.74 and 135.41 ± 0.60 mg EQ/g, respectively) and total sterols (329.82 ± 5.19 and 290.54 ± 1.15 mg EChol/g, respectively). The highest content of condensed tannins was recorded for RCHD and RCFM (122.02 ± 0.59 and 117.30 ± 0.59 mg EC/g, respectively). In addition, RCFD and RCFM exhibited the highest concentration of total saponins (374.44 ± 1.54 and 727.72 ± 2.72 mg ED/g, respectively). Quantitative estimation of the alkaloid content indicated that RCHH and RCFH had higher concentrations (2.13 ± 0.23 and 1.15 ± 0.28 mg EA/g, respectively).
In separating RCHM and RCFM from R. crispus L., organic solvents of ascending polarity were used to obtain fractions with less chemical complexity, increase the concentration of certain compounds, and improve the inhibitory effect. The inhibitory activity of the fractions and subfractions is detailed in Table 3.

2.3. α-Glucosidase Inhibition Provided by R. crispus L. and Its Fractions

RCHM and RCFM exhibited the best inhibitory activity of the extracts (Table 3), with IC50 values of 112.0 ± 1.23 and 7.3 ± 0.17 µg/mL, respectively. As can be appreciated, the solvent with high polarity (methanol) afforded extracts having more desirable properties than the solvents with low and medium polarity (n-hexane and DCM, respectively). Furthermore, RCFM exerted a greater inhibitory effect than RCHM, and both were more potent against α-glucosidase than acarbose (3698.0 ± 76.5 µg/mL).
Since the IC50 values of RCHM-FM and RCFM-FM (98.2 ± 0.78 and 4.4 ± 0.03 μg/mL) were lower than those of the crude extracts, their bioactive compounds are likely to have medium-to-high polarity. The IC50 values of RCFM-FM (3.89 ± 0.06 μg/mL) and F89s (3.8 ± 0.11 μg/mL) were similar, suggesting that these enriched fractions maintain the biological effect.
A Pearson correlation analysis was performed to investigate the relationship between the content of phenolic compounds and the α-glucosidase inhibitory activity of R. crispus L. The extracts showed a strong positive correlation between the phenolic and polyphenol content and the enzymatic activity, with an R value of 0.946 and 0.997, respectively (p < 0.05) (Table 4). These findings suggested that phenolic compounds may be involved and play an important role in the α-glucosidase inhibitory activity of the plant.

2.4. Preliminary Identification of Compounds in the Active Extracts of R. crispus L. by UHPLC-MS/MS

RCHM, RCFM, and F89s exhibited the most significant α-glucosidase inhibitory activity as compared to the other extracts. Hence, R. crispus L. methanolic extracts and its bioactive fraction were subjected to UHPLC-MS/MS analysis to identify the metabolites present in order to obtain better insight into the chemical constituents that could be contributing to the activity.
Several compounds from the classes of phenolic acid (gallic acid), flavan-3-ols (catechin, epicatechin), flavones (vitexin), flavonols (rutin, quercitrin, kaempferol), and anthraquinones (emodin) have been previously reported to be present in R. crispus L. [15,18,19]. In this study, 27 compounds were putatively identified (Table 5) based on their molecular ions in the full-scan mass spectra, retention time, fragmentation patterns, and mass error supported with databases, such as ChemSpider databases (http://www.chemspider.com/, accessed on 1 June 2023), the Natural Products Atlas (https://www.npatlas.org/, accessed on 1 June 2023), and the Waters Screening Library (UNIFI 1.8) (Waters Corporation, Milford, MA, USA). The base peak chromatogram is shown in Supplementary Material (Figures S1–S3).
Among the main metabolites of R. crispus L., we identified flavan-3-ols, flavonols, flavones, isoflavones, and proanthocyanidins. In the bioactive fraction F89s and in RCFM, the peaks with the highest relative abundance (%AR) corresponded to (-)-epicatechin-3-O-gallate (10.21 and 11.22%, respectively) and quercitrin (9.12 and 9.41%, respectively). In contrast, the extract with the least inhibitory activity (RCHM) registered quercitrin (21.06%) and quercetin-7-glucuronide (8.77% AR) as the main peaks, but (-)-epicatechin-3-O-gallate represented only 0.33% AR. Therefore, the abundance of these metabolites plays a key role in the α-glucosidase inhibitory activity, and it is suggested that these active compounds could be considered as standards that allow the quantification of phytochemical markers for the development of a phytopreparation of R. crispus L.

2.5. Effect of R. crispus L. on the Blood Glucose Level and Body Weight of Rats

The antidiabetic potential of R. crispus L. was assessed in an in vivo rat model of STZ-induced diabetes. In the groups of hyperglycemic rats treated with RCHM, RCFM, and F89s, the peripheral glucose level underwent a 57.46, 35.48, and 68.86% decrease, respectively, from the first day to the end of the 30-day treatment (Figure 1). Compared to the normoglycemic control, the glucose levels of the groups treated with R. crispus L. were not statistically different.
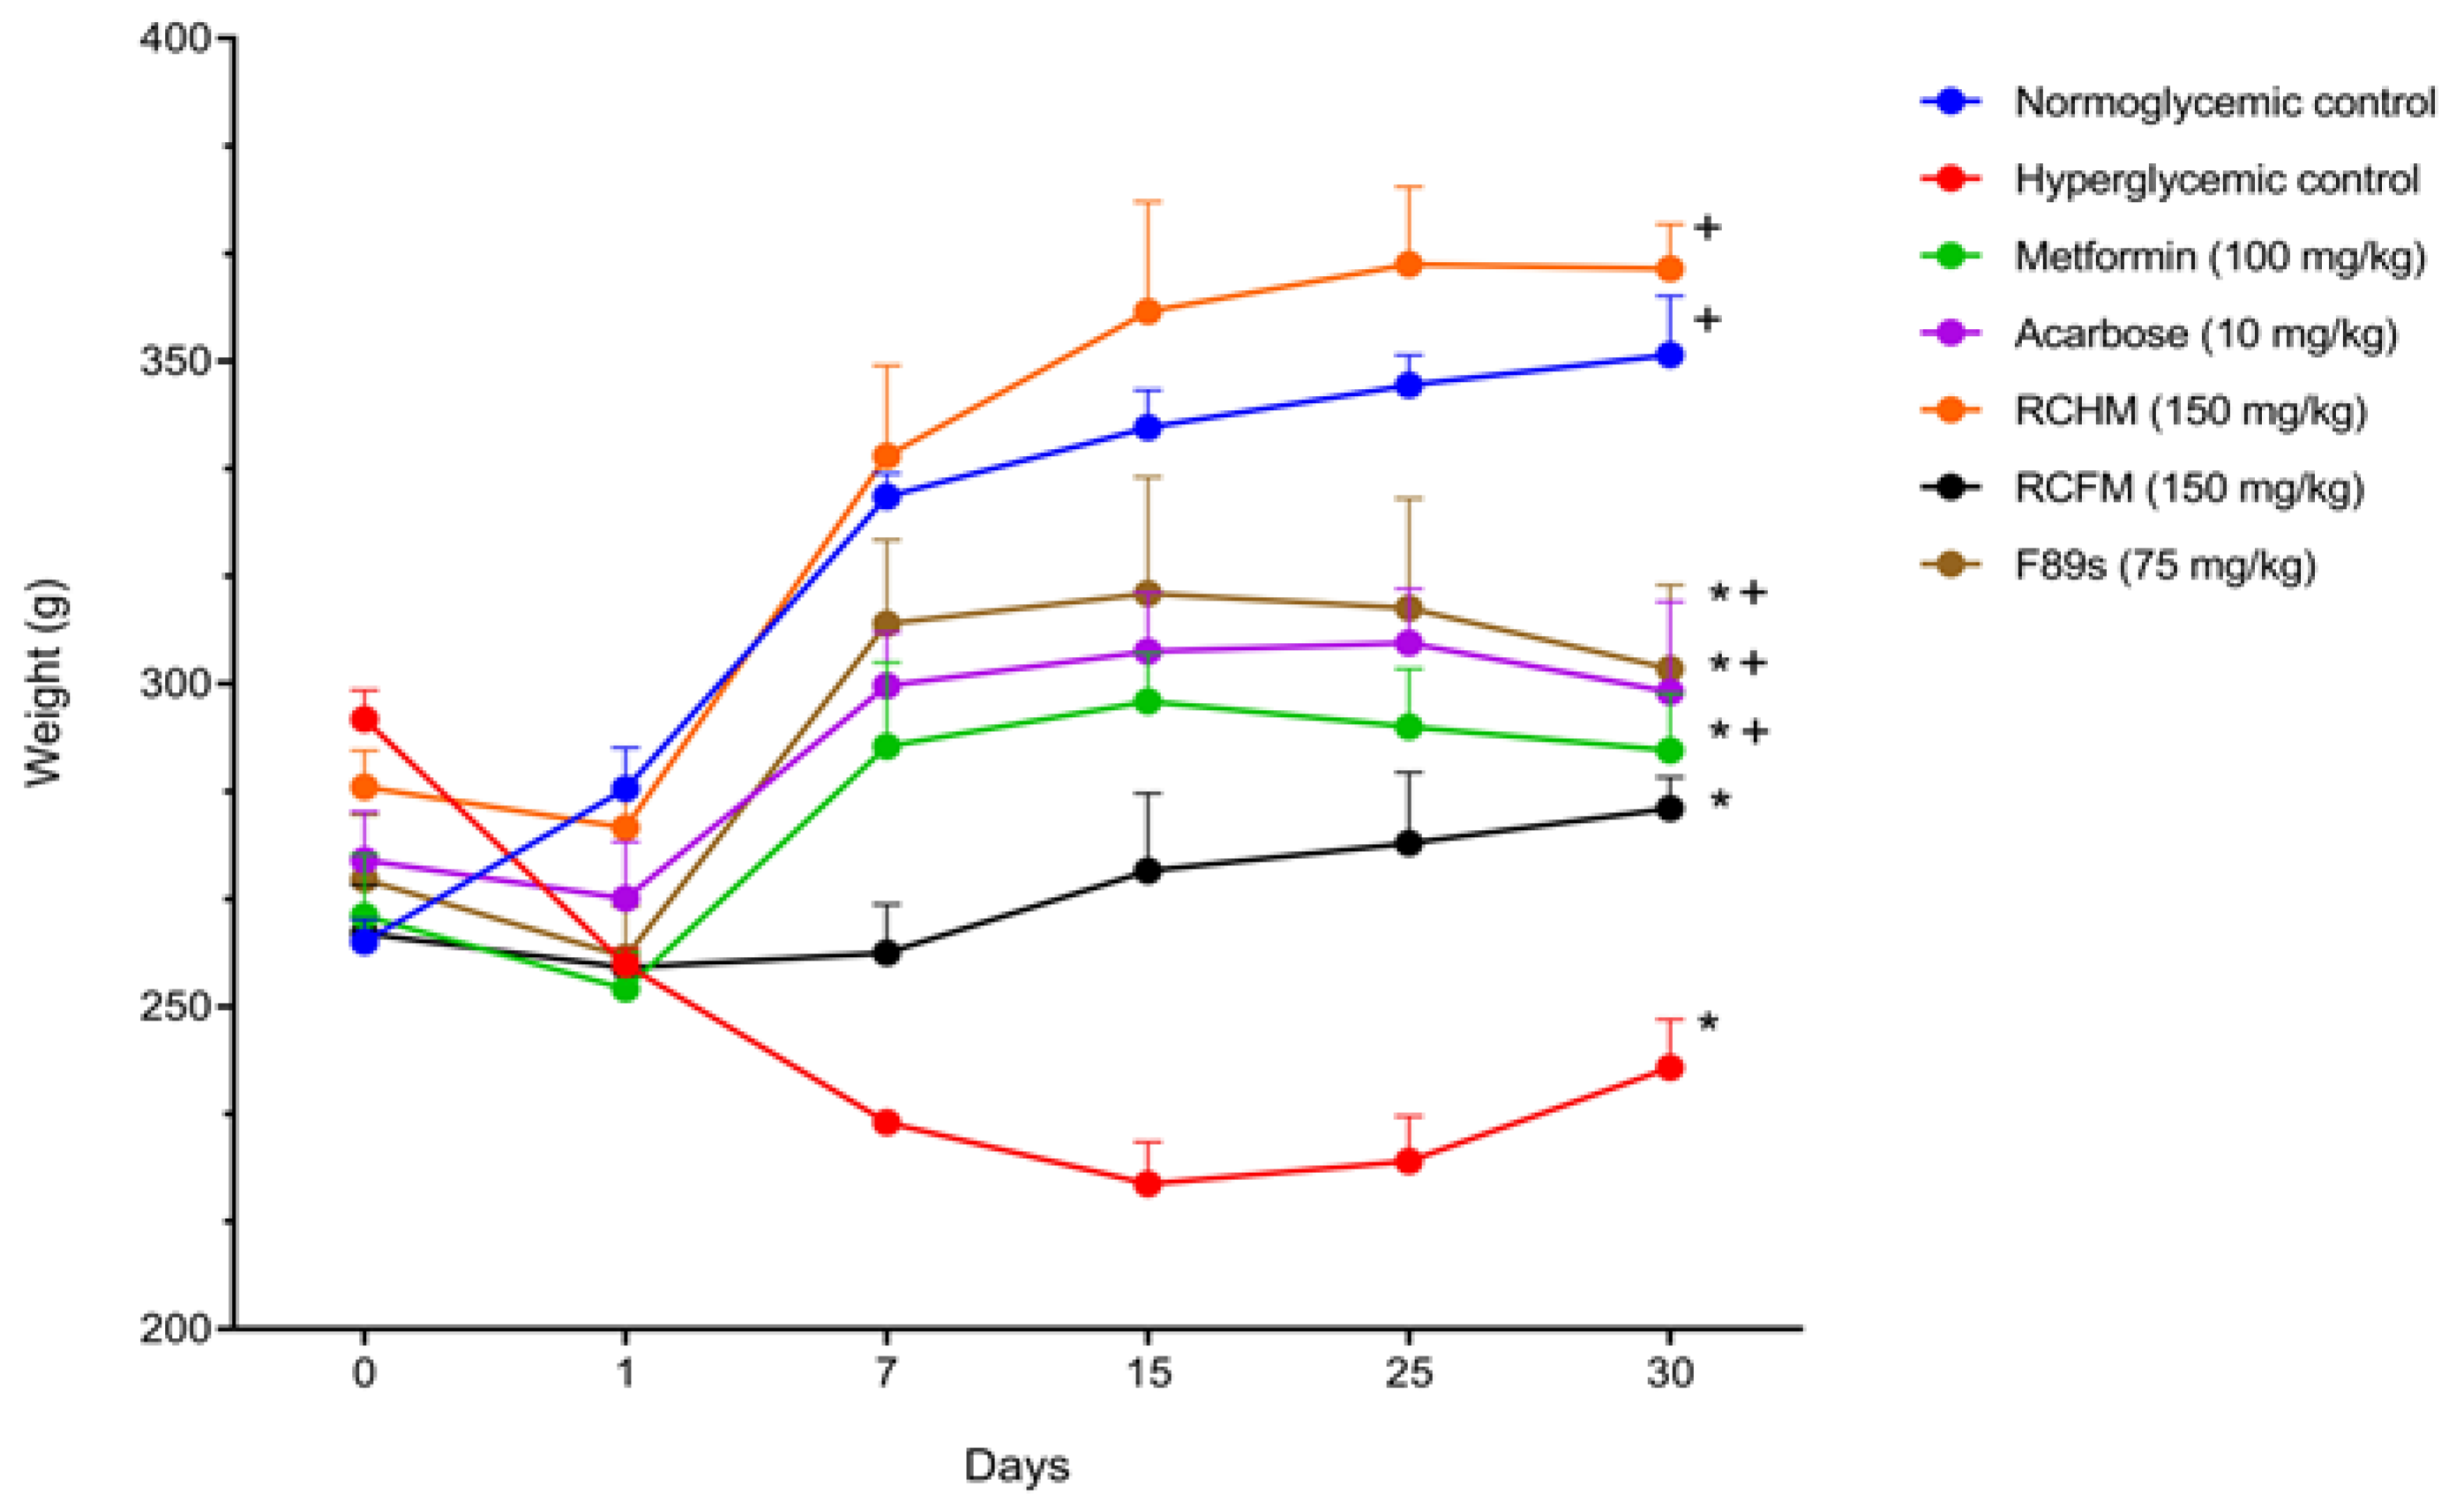
The changes in the body weight of the rats were recorded during the 30-day experiment (Figure 2). During the first day post-induction of diabetes, the affected animals showed a 6.2% weight loss, while the normoglycemic controls concomitantly underwent a 23.83% weight gain. However, body weight loss was controlled to the extent that hyperglycemia was diminished after treatment with R. crispus L. By the end of the treatment, there was a 31.27, 9.633, and 15.73% body weight gain in rats treated with RCHM, RCFM, and F89s, respectively, while groups treated with metformin and acarbose showed a body weight gain of 14.70 and 11.9%, respectively.

2.6. Effect of R. crispus L. on the Serum Glucose and Insulin Levels

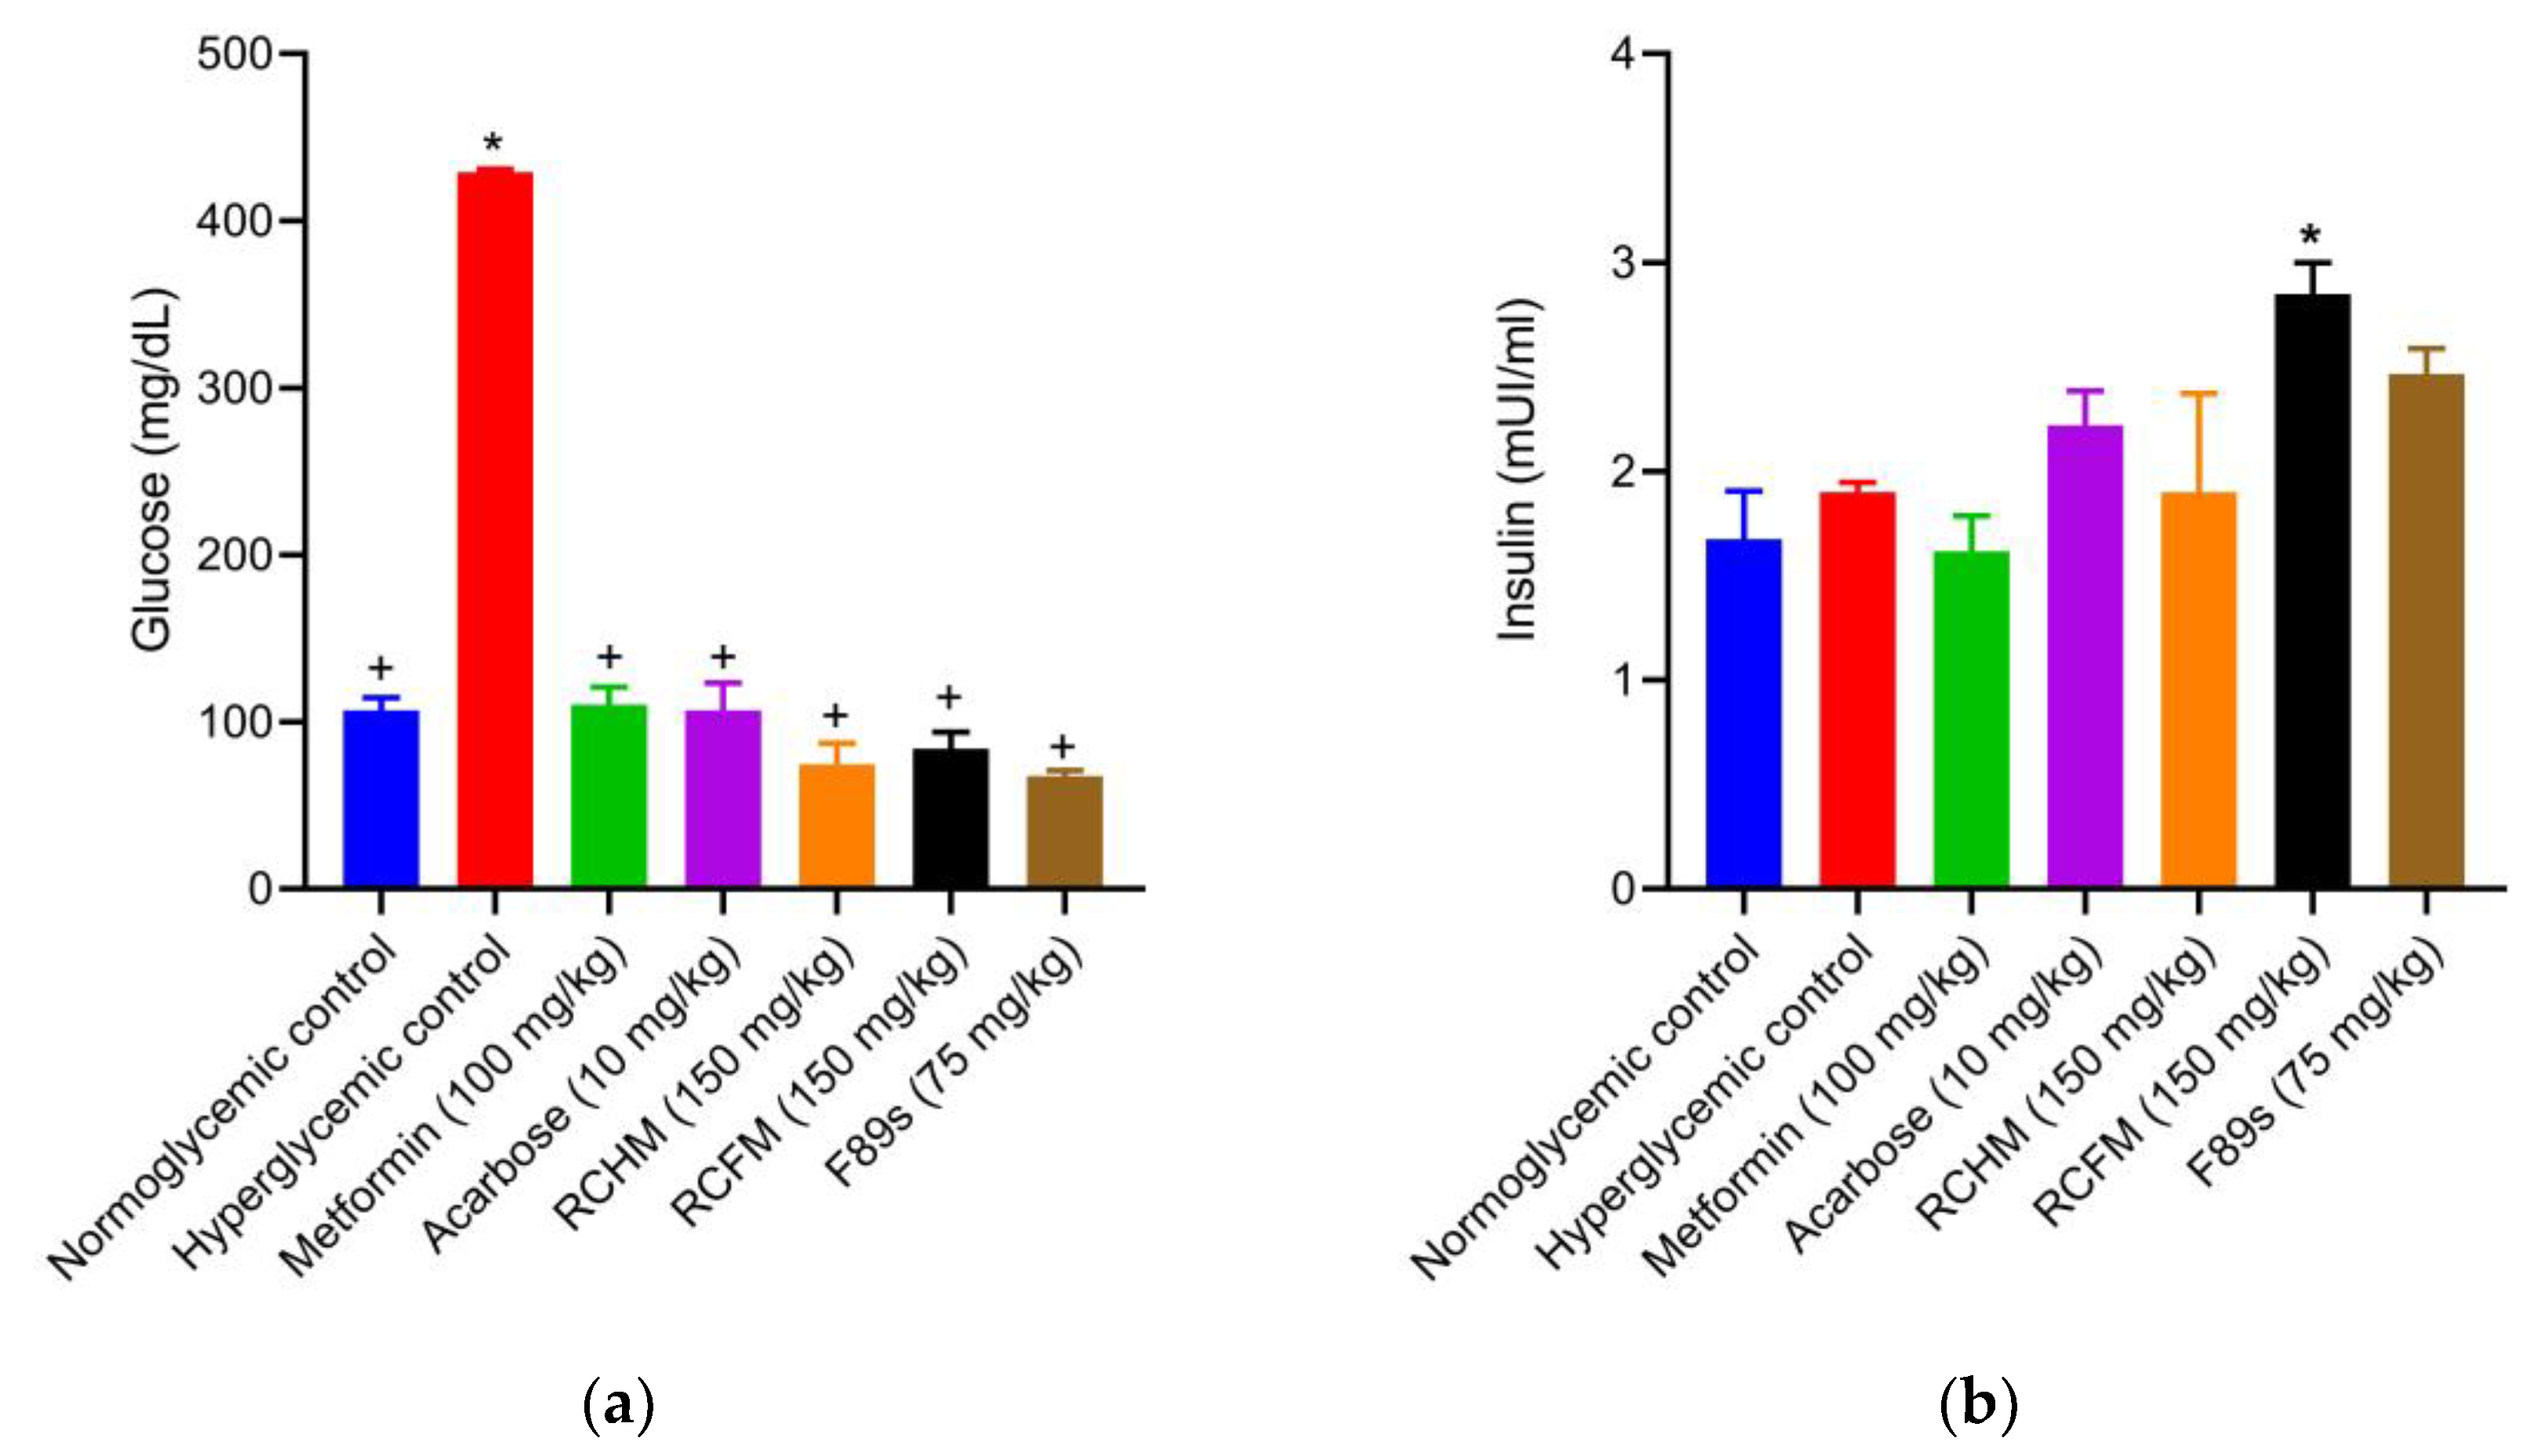
The serum glucose levels of rats treated for 30 days with RCHM, RCFM, and F89s decreased by 82.2, 80.1, and 84.1%, respectively, compared to the hyperglycemic controls (Figure 3a). In addition, no statistical difference existed between these groups and the normoglycemic, metformin, and acarbose groups. Compared to the hyperglycemic controls, there was a 50 and 29.8% increase in the insulin level of the groups treated with RCFM and F89s, respectively (Figure 3b). The latter two groups did not differ significantly from the normoglycemic or the acarbose group. The insulin level was 76.1% higher in the RCFM-treated animals than in the metformin group.

2.7. Effect of R. crispus L. on the Serum Lipid Profile

Hyperglycemic control rats showed a significant increase in the levels of TG, LDL, and VLDL and a significant decrease in TC and HDL levels compared to the corresponding values of the normoglycemic controls (Table 6). Compared to the hyperglycemic controls, the administration of RCHM, RCFM, and F89s reduced the levels of TC (by 18.9, 24.8, and 12.1%, respectively), TG (by 82.21, 82.29, and 82.38%, respectively), and VLDL (by 82.21, 82.29, and 82.38%, respectively). The concentration of HDL was significantly higher in the RCHM- and F89-treated groups (18.91 and 48.05%, respectively) but 15.88% lower in the RCFM-treated animals. LDL declined by 21.3% in the F89s-treated rats and increased by 5 and 1.2% in the RCHM and RCFM groups, respectively.
After inducing hyperglycemia with STZ, the atherogenic index (AI) of the affected rats increased significantly. Treatment with RCHM, RCFM, and F89s caused a 34.5, 14.3, and 42.1% reduction, respectively, in the AI (Table 5). The levels of AI did not differ significantly between the latter three groups and the metformin or the acarbose group.

2.8. Effect of R. crispus L. on the Hepatic Profile

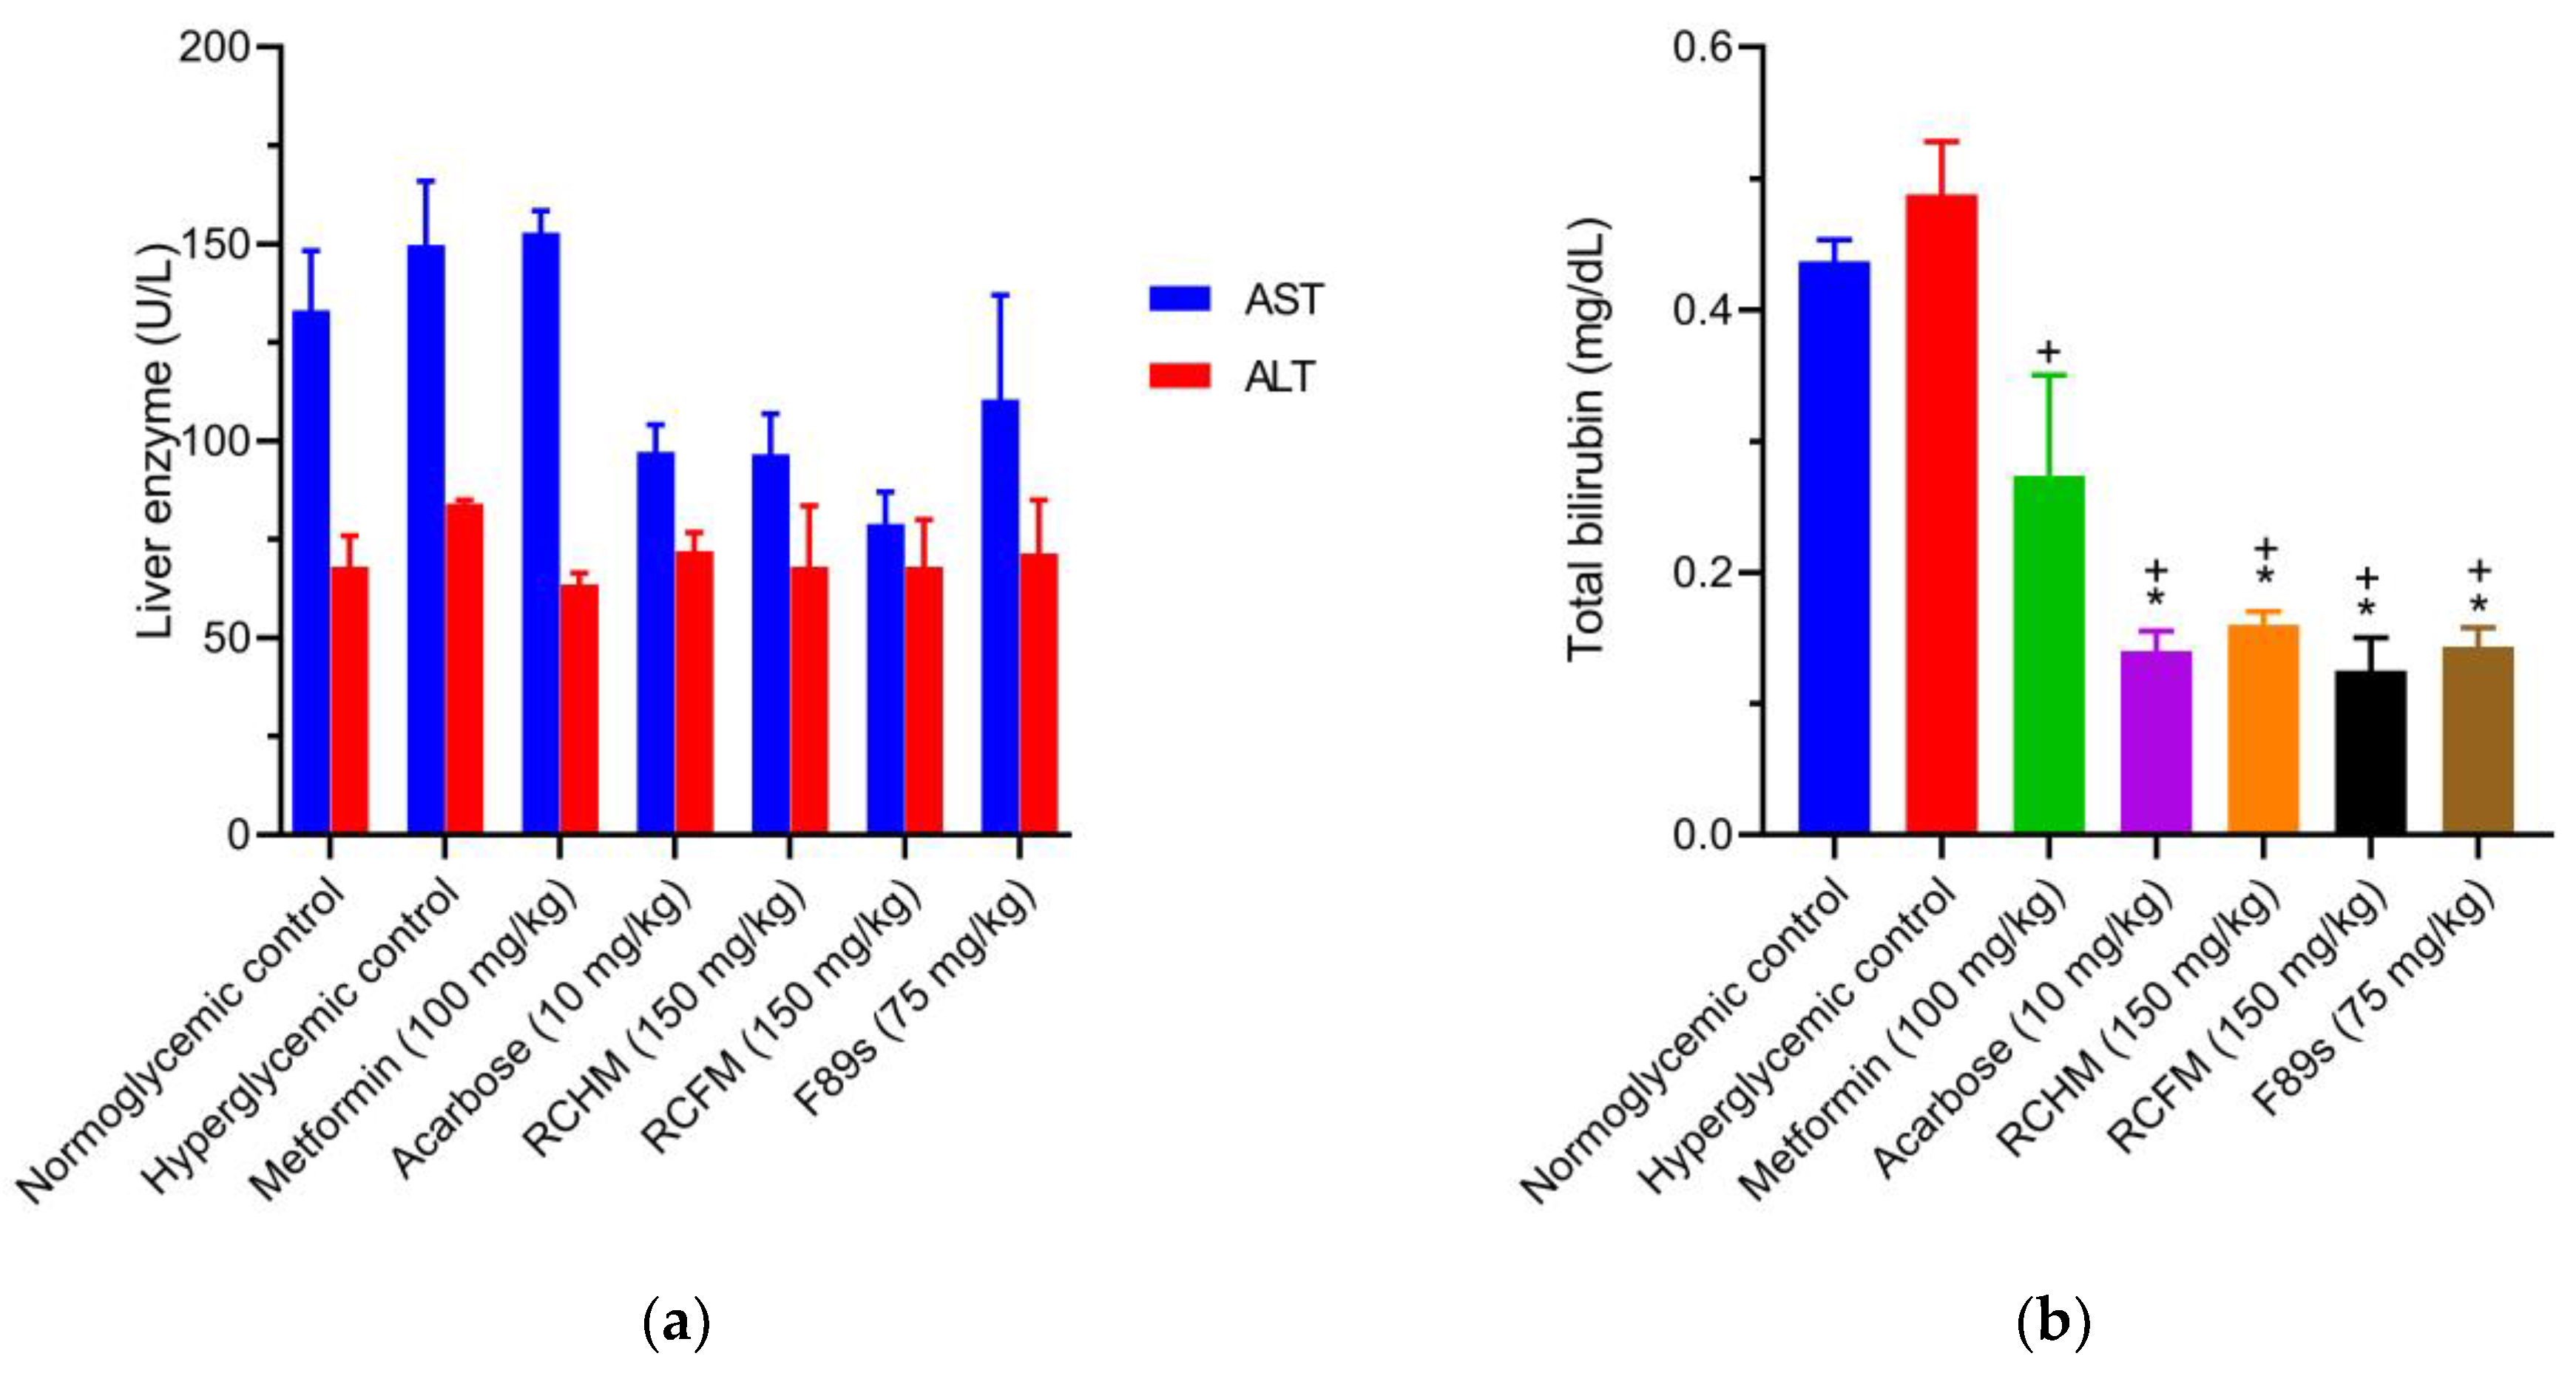
The levels of AST and ALT liver enzymes were elevated in the hyperglycemic controls compared to the normoglycemic controls. Taking the hyperglycemic controls as a reference, the administration of RCHM, RCFM, and F89s reduced the levels of AST (35.1, 47.2, and 26.2%, respectively) and ALT (16.5, 14.5, and 17%, respectively) (Figure 4a). In the metformin group, there was a 14.9% increment in the concentration of AST compared to the normoglycemic controls.
The levels of total bilirubin in the normoglycemic and hyperglycemic controls were 0.44 ± 0.02 and 0.49 ± 0.04 mg/dL, respectively. Compared to the hyperglycemic controls, treatment with RCHM, RCFM, and F89s decreased the concentration of bilirubin by 67.2, 74.4, and 70.6%, respectively (Figure 4b). The level of total bilirubin was not significantly different between the latter three groups and the metformin or the acarbose group.

2.9. Effect of R. crispus L. on the Renal Profile

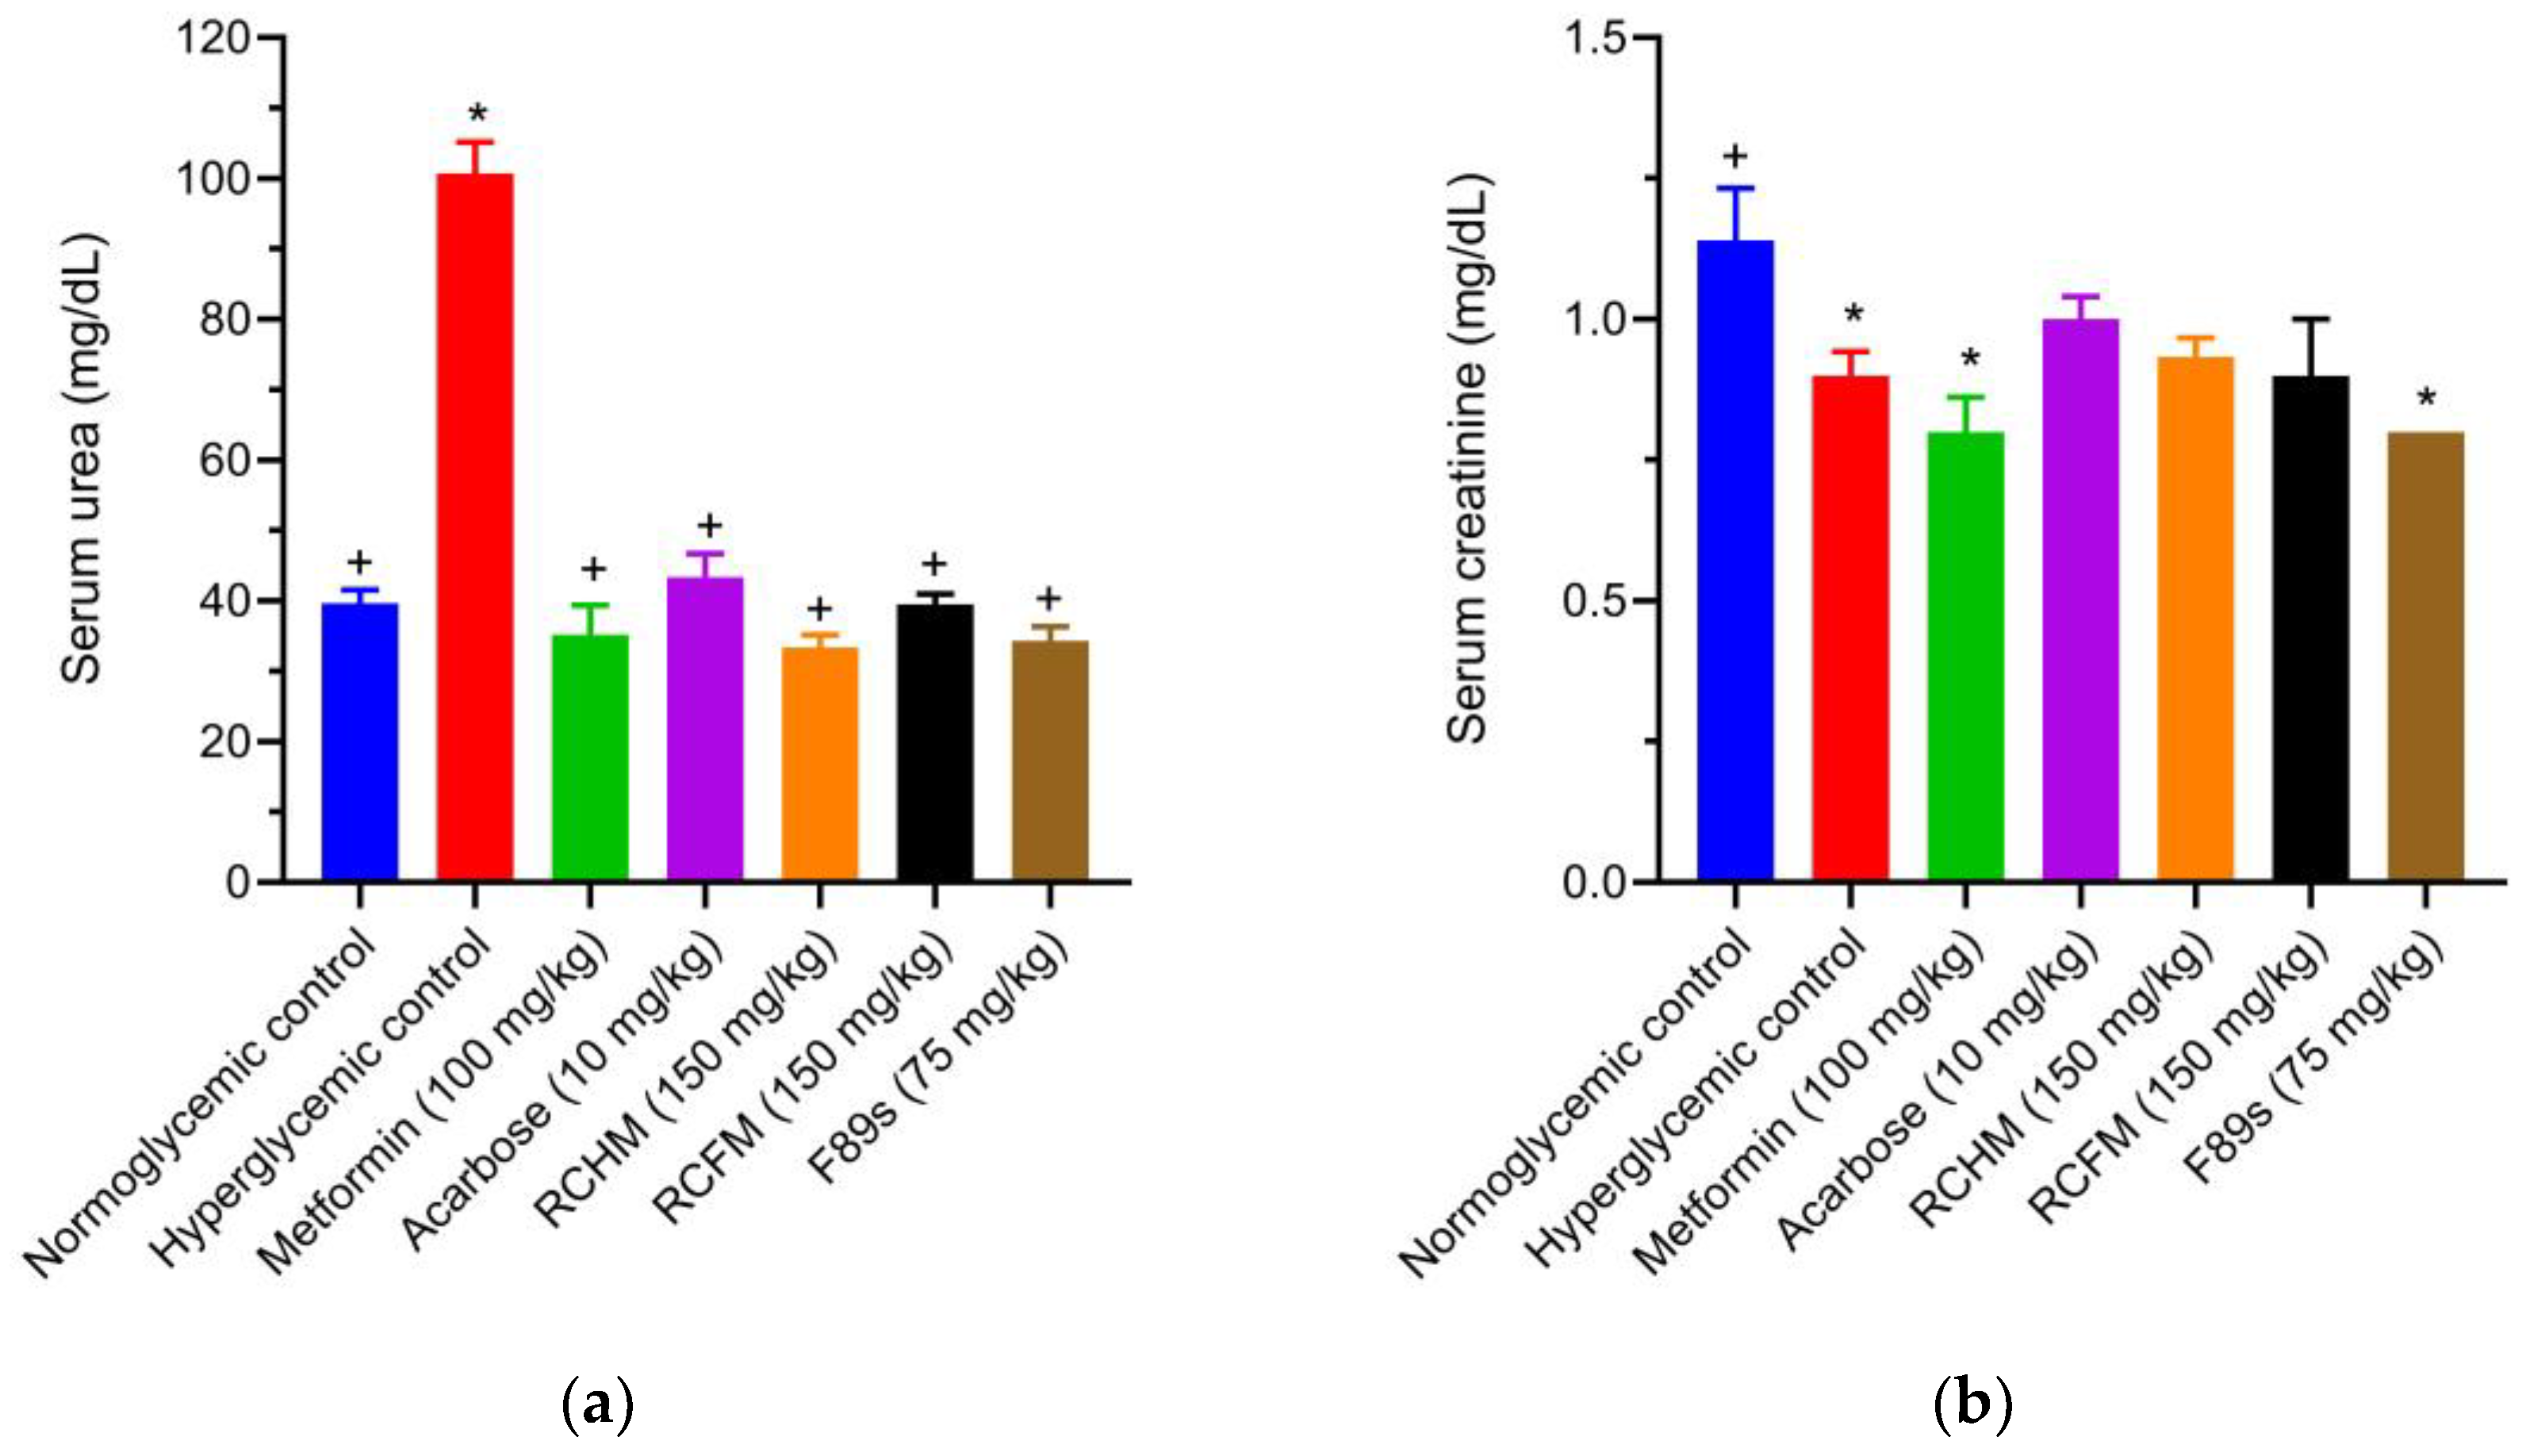
A higher serum urea level was found in the hyperglycemic versus normoglycemic control animals. Compared to the hyperglycemic controls, treatment with RCHM, RCFM, and F89s reduced this parameter by 66.9, 60.8, and 65.9%, respectively (Figure 5a). There was no notable difference in the urea level of the metformin-, acarbose-, and R. crispus L.-treated animals. Regarding the serum creatinine level, no significant differences existed between the normoglycemic and hyperglycemic controls (Figure 5b).

3. Discussion

The methanol extracts of the leaves and flowers of R. crispus L. were found to inhibit the α-glucosidase enzyme. In a preliminary study, these same extracts showed similar effects as metformin and acarbose in a rat model of STZ-induced hyperglycemia. The plant organ being processed and the solvent influenced the effect of the extracts, presumably by determining the secondary metabolites present.
Regarding the solvent, its polarity affects the extraction of chemical constituents and thus produces distinct bioactivity. The methanolic extracts provided a good inhibitory effect on α-glucosidase, while low inhibitory activity was displayed by the n-hexane and DCM extracts. In contrast, the yields were higher for the methanolic extracts of flowers (RCFM) than of leaves (RCHM), the latter of which had a lower IC50 value than that of acarbose. Although RCFM was the most active extract, its effect was not significantly different from that of RCFM-FM, RCFM-SA, and F89s. The fractionation may have favored the enrichment of the bioactive compounds in the fractions.
Considering the extraction method, it is inferred that the main chemical constituents of R. crispus L. are phenolic compounds, in agreement with previous studies reporting variation in the content of phenolic compounds in plant organs, in the following order (in both flowering and fruiting stages): generative part (flowers, seeds) > leaves > root > stem [31,32]. In addition, the quantitative analysis showed that R. crispus L. leaves and flowers had variable amounts of phytochemicals in the methanolic, dichloromethane, and hexane extracts. However, the highest content of total phenols and polyphenols was obtained in the methanolic extracts. Likewise, the extracts of medium polarity (RCHD and RCFD) presented a higher concentration of flavonoids and condensed tannins, which is in accordance with Idris et al. [33], who reported that the total methanolic extract of the leaves of R. crispus L. exhibits the highest content of phenolic compounds (103.54 ± 3.70 mg Eq gallic acid/g) and the acetone extract exhibits the highest content of flavonoids (526.23 ± 17.52 mg Eq quercetin/g), flavonols (558.25 ± 12.53 mg Eq quercetin/gE), and proanthocyanidins (300.77 ± 14.21 mg Eq catechin/gE). These results indicate that R. crispus L. is an important source of phenolic compounds.
The extracts showed a high correlation between the phenolic compounds and enzymatic activity, suggesting that the significant α-glucosidase inhibitory activity in polar extracts is attributable to the presence of phenolic compounds and flavonoids and their glycosides, such as (-)-epicatechin-3-O-gallate, quercitrin, and quercetin-7-glucuronide. Previously, the capacity of phenolic compounds, such as flavonoids from Morus atropurpurea, Scutellaria baicalensis, Morinda lucida, Momordica charantia, and Moringa oleifera, to act as α-glucosidase inhibitors has been documented in the literature [34,35,36,37].
Regarding the antidiabetic potential of the genus Rumex, the methanolic extracts from the leaves and flowers of R. maderensis and from the root of R. crispus L. are reported to inhibit carbohydrate- and lipid-metabolizing enzymes [38,39]. Phenolic compounds from R. scutatus, R. dentatus, and R. patientia lowered hyperglycemia and improved the glucose tolerance, insulin sensitivity, and even the lipid profile and the hepatoprotective effect in diabetic rats [40,41,42]. These improvements were presently observed after the administration of RCHM, RCFM, and F89s. Therefore, the antihyperglycemic action of R. crispus L. can be attributed to greater glucose absorption stemming from a higher level of insulin. Additionally, a better lipid profile resulted from a decrease in the levels of TC, TG, LDL, and VLDL and an increase in the level of HDL. Likewise, liver and kidney markers indicated a protective effect of R. crispus L.

4. Materials and Methods

4.1. Plant Material and Preparation of the Extracts

The leaves and flowers of the plant were collected in the State of Tlaxcala, Mexico (in 2017 and 2019, 19,232,715 and 98,257,153). Authentication was carried out by the Herbarium of the Benemérita Universidad Autónoma de Puebla (HBUAP, State of Puebla, Mexico, voucher number HUAP 0072233). The dried and pulverized plant material was extracted with consecutive maceration using n-hexane, DCM, and methanol in a 1:3 weight/volume ratio. The solvent was changed every 24 h for three days at room temperature. The resulting extracts were filtered and concentrated in a rotary evaporator at reduced pressure, then lyophilized, and stored at −4 °C.

4.2. Quantitative Phytochemical Analysis

The total phenol content was evaluated using the Folin–Ciocalteu method adapted to a 96-well microplate [43]. Briefly, 75 μL of the extract was added to 750 μL of solution A (50 mL of 2% Na2CO3, 1 mL of 1% CuSO4, and 1 mL of 2.7% KNaC4H4O6) and 150 μL of 0.5 N NaOH. After 10 min incubation at room temperature and 200 rpm, 75 μL of 1 N Folin–Ciocalteu reagent was added. The reaction mixture was incubated for 30 min at room temperature. Subsequently, absorbance was recorded at 750 nm in a microplate reader (Epoch BioTek® Instruments, Winooski, VE, USA). Gallic acid was used as a standard, and the total phenolic content was determined and reported as micrograms equivalent to gallic acid per gram of extract (mg EGA/g).
The total polyphenol content was determined using the Folin–Ciocalteu method adapted to a 96-well microplate [44]. The reaction mixture containing 400 μL of 1 M Na2CO3, 100 μL of the extract, and 500 μL of 2 N Folin–Ciocalteu reagent (1:9) was incubated for 20 min at room temperature. Afterward, absorbance was recorded at 765 nm in a microplate reader (Epoch BioTek®). Tannic acid was maintained as a standard, and the result was expressed as micrograms equivalent to tannic acid per gram of extract (mg ETA/g).
The total flavonoid content was determined using the colorimetric method with AlCl3 [45] adapted to a 96-well microplate. The reaction mixture consisted of 300 μL of 98% ethanol, 20 μL of 10% AlCl3, 20 μL of 1 M CH3COOK, 560 μL of distilled water, and 100 μL of the extract. The mixture was incubated for 30 min at room temperature, and then absorbance was measured at 415 nm in a microplate reader (Epoch BioTek®). Quercetin was used as a standard, and the total flavonoid content was expressed as micrograms equivalent to quercetin per gram of extract (mg EQ/g).
The condensed tannin content was estimated based on the method of vanillin/HCl [46]. The reaction mixture consisted of 2 mL of a solution (1:1) of 4% vanillin/8% HCl (methanol solution) added to 400 μL of the extract. The mixture was incubated in a water bath at 30 °C for 20 min, and afterward, absorbance was measured at 550 nm in a microplate reader (Epoch BioTek®). Catechin was used as a standard, and the condensed tannin content was expressed as micrograms equivalent to catechin per gram of extract (mg EC/g).
The total saponin content was evaluated following the standard procedure [47]. The reaction mixture with 0.25 mL of the extract, 0.25 mL of 8% vanillin, and 2.5 mL of 72% H2SO4 was placed in a 60 °C water bath for 10 min, allowed to cool, and then transferred to an ice bath for 4 min; finally, absorbance was measured at 544 nm in a UV spectrophotometer (Genesys 10S UV-Vis). Diosgenin was used as a standard, and the results were expressed as micrograms equivalent to diosgenin per gram of extract (mg ED/g).
The total sterol content was evaluated with the Liebermann–Bürchard method [48]. The reaction mixture with 100 μL of the extract and 1 mL of Liebermann–Bürchard reagent (10 mL of concentrated H2SO4, 60 mL of acetic anhydride in an ice bath, 30 mL of acetic acid, and 0.6 g of sodium sulfate anhydrous) was placed in a water bath at 35 °C for 10 min, and then absorbance was measured at 550 nm in a UV spectrophotometer (Genesys 10S UV-Vis). For the quantification of total sterols, cholesterol was used as a standard, and the results were expressed as micrograms equivalent to cholesterol per gram of extract (mg EChol/g).
The total alkaloid content was determined using the method based on the reaction of an alkaloid with bromocresol green (BCG), as described previously [49]. The extract was dissolved in 2N HCl and then filtered. Next, 1 mL of this solution was transferred to a separatory funnel and washed with 10 mL of chloroform (3 times). The pH of this solution was adjusted to neutral with 0.1 N NaOH. Subsequently, 5 mL of BCG solution and 5 mL of phosphate buffer were added to this solution. The mixture was shaken and complexed extracted with 1, 2, 3, and 4 mL of chloroform with vigorous stirring, and then the extract was collected in a 10 mL volumetric flask and diluted with chloroform. The absorbance of the complex in chloroform was measured at 470 nm in a UV spectrophotometer (Genesys 10S UV-Vis). For the quantification of total alkaloids, atropine was used as a standard, and the results were expressed as micrograms equivalent to atropine per gram of extract (mg EA/g).

4.3. Preparation of R. crispus L. Fractions

Fractionation was achieved using solid–liquid extraction with solvents of different polarities (DCM, acetone, and methanol). The distinct methanolic crude extracts were suspended in DCM, shaken to dissolve them completely in the solvent, and washed with methanol. The filtrate of the fractions was concentrated in a rotary evaporator at reduced pressure to obtain the DCM and methanol fractions, which were subsequently lyophilized for proper storage. The methanolic fractions were subjected to a second series of consecutive washings, as described for the fractionation procedure with the aforementioned solvents, to obtain fractions in acetone and methanol. The acetone fraction of the methanolic extract of flowers was separated using column chromatography packed with 70–230 silica gel (Merck, Darmstadt, Germany), with mixtures of ascending polarity of n-hexane, ethyl acetate, acetone, and methanol as the mobile phase. Based on the similarity of the thin-layer chromatography (TLC) profiles, the extract was classified into 19 subfractions. The F89s subfraction was obtained as a brown solid. The different dry fractions were transferred to separate vials and stored at −4 °C until needed.

4.4. α-Glucosidase Inhibitory Assay

The inhibition of α-glucosidase was tested using the chromogenic method previously reported by Salehi et al. [50], with some modifications. A mixture of 20 µL of α-glucosidase type I solution (0.5 units/mL in 0.1 M phosphate buffer (pH 6.9)) from S. cerevisiae (Cas 9001-42-7, batch # 0000093219, Sigma-Aldrich, St. Louis, MO, USA), 120 µL of 0.1 M phosphate buffer (pH 6.9), and 10 µL of the sample was incubated in 96-well plates at 37 °C for 15 min. After preincubation, the enzymatic reaction was started by adding 20 µL of 5 mM p-nitrophenyl-α-D-glucopyranoside (pNPG) solution in 0.1 M phosphate buffer (pH 6.9) (Cas 3767-28-0, batch # BCBW3619, Sigma-Aldrich) and incubated at 37 °C for another 15 min. The reaction was stopped by adding 80 µL of 0.2 M sodium carbonate solution, and then absorbance was recorded at 405 nm in a microplate reader (Epoch, BioTek®). The reaction system without any test sample was used as a control, and the system without α-glucosidase served as a blank to correct for background absorbance. The inhibitory activity of the sample on α-glucosidase was calculated with the following equation:
%   I n h i b i t i o n = 1 S a m p l e A b s o r b a n c e C o n t r o l A b s o r b a n c e × 100

4.5. Preliminary Identification of Phenolic Compounds Using UHPLC-MS/MS

An ACQUITY UPLC System (Waters Corporation, Milford, MA, USA) and a Xevo G2-XS QTof MS mass spectrometer (Waters Corporation, Milford, MA, USA) equipped with an Acquity BEH C18 column (2.1 mm, 100 mm, 1.7 μm) (Waters Corporation, Milford, MA, USA) were operated to identify the active extracts’ metabolites. The column temperature was maintained at 45.0 °C. The mobile phase consisted of acetonitrile (solvent A) and water (solvent B) (containing 0.05% formic acid) and was pumped at a flow rate of 0.5 mL/min. The gradient condition to equilibrate the column was: 0–2 min, 0–5% A; 2–5 min, 5–10% A; 5–8 min, 10–15% A; 8–12 min, 15–25% A; 12–15 min, 25–33% A; 15–18 min, 33–53% A; 18–20 min, 53–95% A; and 20–22 min, 95–5% A. The mass spectrometer, equipped with an electrospray source (ESI), was operated in negative ionization mode.
The MS parameters were as follows: capillary voltage, 2.5 kV; sample cone, 40 V; source temperature, 100 °C; desolvation temperature, 550 °C; cone gas flow rate, 50 L/h; and desolvation gas (N2) flow rate, 1000 L/h. MS spectra were acquired by full-range acquisition covering 100–1200 m/z. Dry extracts were re-dissolved (10 mg/mL) in water, followed by sonication and filtration (0.22 µm PTFE membrane filters), and injected (2 μL) into the chromatographic equipment.

4.6. Experimental Animals

Male Wistar rats weighing 250 ± 20 g were housed in standard cages, kept at a controlled room temperature (22 ± 2 °C) and humidity (55 ± 5%) in a 12/12 h light/dark cycle, and provided a standard diet and water ad libitum. All procedures were developed in accordance with the Mexican official guidelines for laboratory animals (NOM-062-ZOO-1999) [51] and ratified by the Bioethics Committee of the Escuela Nacional de Medicina y Homeopatía of the Instituto Politécnico Nacional (registration CB-001-2020).

4.7. Induction of Hyperglycemia in Rats

Hyperglycemia was induced in overnight-fasted (12 h) rats via a single intraperitoneal (i.p.) injection of 50 mg STZ/kg body weight in 0.1 M citrate buffer solution (pH 4.4). At 72 h post-injection, taken as day 1, blood glucose was measured with a glucometer (Accu-Chek® Active kit, Hoffman-La Roche Ltd., Mexico City, Mexico). Only the animals with blood glucose levels greater than 150 mg/dL were considered diabetic and included in the experiments [52].

4.8. Experimental Design

The rats were divided into seven groups (n = 6 per group): group I, the normoglycemic controls (water, 300 µL); group II, the hyperglycemic controls, being the vehicle-treated diabetic animals (DMSO:H2O (1:3), 300 µL); groups III and IV, diabetic animals administered metformin (100 mg/kg) and acarbose (10 mg/kg), respectively; and groups V, VI, and VII, diabetic rats administered RCHM and RCFM at 150 mg/kg and F89s at 75 mg/kg, respectively, in DMSO:H2O (1:3) via the intragastric route every 48 h for 30 days. Upon completion of the treatment period, the animals were fasted overnight, and then they were anesthetized with xylazine and ketamine to be sacrificed via cardiac puncture according to the corresponding Mexican official guideline (NOM-033-ZOO-1995) [53].

4.9. Measurement of Body Weight and the Level of Peripheral Glucose

The body weight and peripheral glucose (evaluated in blood taken from the distal tail portion) were recorded weekly for each animal during the 30-day experimental period.

4.10. Biochemical Profile

Blood samples were extracted via cardiac puncture. The serum obtained from the blood samples (without an anticoagulant) was processed in the automated biochemical analyzer AutoKem II KontroLab-Stat Fax to quantify the following biochemical parameters: urea, creatinine, total cholesterol (TC), triglycerides (TG), high-density lipoprotein (HDL), low-density lipoprotein (LDL), very low-density lipoprotein (VLDL), aspartate aminotransferase (AST), alanine aminotransferase (ALT), the atherogenic index (AI), total bilirubin, and insulin.

4.11. Statistical Analysis

Results were expressed as the mean ± SEM. Statistical differences, considered at p < 0.05, were examined with one-way analysis of variance (ANOVA), followed by a Bonferroni post hoc test using Prism GraphPad version 8.0. Correlations among the enzymatic activities were performed with Pearson’s correlation test using Minitab software (version 16, Minitab Inc., State College, PA, USA), where IC50 values were converted to 1/IC50 values to inverse the relationship between absorbance and activity.

5. Conclusions

Three extracts of R. crispus L., RCHM, RCFM, and F89s, served as good inhibitors of α-glucosidase, thus reducing the rate of disaccharide hydrolysis. In addition, they produced an antihyperglycemic effect in rats with STZ-induced hyperglycemia, showing comparable effects to metformin and possibly through a mechanism of action similar to that of acarbose. Hence, the potential of using R. crispus L. to develop auxiliary drugs for the treatment of diabetes mellitus merits further research.

Supplementary Materials

The following supporting information can be downloaded at https://www.mdpi.com/article/10.3390/molecules28155760/s1: Figure S1. Total ion chromatogram profile of RCHM; Figure S2. Total ion chromatogram profile of RCFM; Figure S3 Total ion chromatogram profile of F89s.

Author Contributions

Conceptualization and supervision, M.C.C.-L.; methodology, F.E.J.-M. and J.C.-G.; data curation and formal analysis, M.C.C.-L. and D.G.A.-M.; writing—original draft preparation, D.G.A.-M.; investigation, J.R.-A., A.M.-M. and V.E.L.-L. All authors contributed to the writing of the manuscript. All authors have read and agreed to the published version of the manuscript.

Funding

This research was funded by a SIP 20230132 project of the Secretaría de Investigación y Posgrado of the Instituto Politécnico Nacional. We thank CONACYT and the SIP-IPN for the scholarships (BEIFI) awarded.

Institutional Review Board Statement

The animal study protocol was approved by the Bioethics Committee of the Escuela Nacional de Medicina y Homeopatía of the Instituto Politécnico Nacional (registration CB-001-2020).

Informed Consent Statement

Not applicable.

Data Availability Statement

Not applicable.

Conflicts of Interest

The authors declare that there are no conflict of interest that could have influenced the work reported in this paper.

Sample Availability

Not applicable.

References

  1. de Paulo Farias, D.; de Araújo, F.F.; Neri-Numa, I.A.; Pastore, G.M. Antidiabetic Potential of Dietary Polyphenols: A Mechanistic Review. Food Res. Int. 2021, 145, 110383. [Google Scholar] [CrossRef] [PubMed]
  2. Proença, C.; Freitas, M.; Ribeiro, D.; Oliveira, E.F.T.; Sousa, J.L.C.; Tomé, S.M.; Ramos, M.J.; Silva, A.M.S.; Fernandes, P.A.; Fernandes, E. α-Glucosidase Inhibition by Flavonoids: An in Vitro and in Silico Structure–Activity Relationship Study. J. Enzyme Inhib. Med. Chem. 2017, 32, 1216–1228. [Google Scholar] [CrossRef] [Green Version]
  3. Hossain, U.; Das, A.K.; Ghosh, S.; Sil, P.C. An Overview on the Role of Bioactive α-Glucosidase Inhibitors in Ameliorating Diabetic Complications. Food Chem. Toxicol. 2020, 145, 111738. [Google Scholar] [CrossRef] [PubMed]
  4. Saeedi, P.; Petersohn, I.; Salpea, P.; Malanda, B.; Karuranga, S.; Unwin, N.; Colagiuri, S.; Guariguata, L.; Motala, A.A.; Ogurtsova, K.; et al. Global and Regional Diabetes Prevalence Estimates for 2019 and Projections for 2030 and 2045: Results from the International Diabetes Federation Diabetes Atlas, 9th Edition. Diabetes Res. Clin. Pract. 2019, 157, 107843. [Google Scholar] [CrossRef] [PubMed] [Green Version]
  5. Chinsembu, K.C. Diabetes Mellitus and Nature’s Pharmacy of Putative Antidiabetic Plants. J. Herb. Med. 2019, 15, 100230. [Google Scholar] [CrossRef]
  6. Choudhury, H.; Pandey, M.; Hua, C.K.; Mun, C.S.; Jing, J.K.; Kong, L.; Ern, L.Y.; Ashraf, N.A.; Kit, S.W.; Yee, T.S.; et al. An Update on Natural Compounds in the Remedy of Diabetes Mellitus: A Systematic Review. J. Tradit. Complement. Med. 2018, 8, 361–376. [Google Scholar] [CrossRef]
  7. Choudhari, V.P.; Gore, K.P.; Pawar, A.T. Antidiabetic, Antihyperlipidemic Activities and Herb–Drug Interaction of a Polyherbal Formulation in Streptozotocin Induced Diabetic Rats. J. Ayurveda Integr. Med. 2017, 8, 218–225. [Google Scholar] [CrossRef]
  8. Salehi, B.; Ata, A.; Anil Kumar, N.V.; Sharopov, F.; Ramírez-Alarcón, K.; Ruiz-Ortega, A.; Ayatollahi, S.A.; Fokou, P.V.T.; Kobarfard, F.; Zakaria, Z.A.; et al. Antidiabetic Potential of Medicinal Plants and Their Active Components. Biomolecules 2019, 9, 551. [Google Scholar] [CrossRef] [Green Version]
  9. Abbas, G.; Al Harrasi, A.; Hussain, H.; Hamaed, A.; Supuran, C.T. The Management of Diabetes Mellitus-Imperative Role of Natural Products against Dipeptidyl Peptidase-4, α-Glucosidase and Sodium-Dependent Glucose Co-Transporter 2 (SGLT2). Bioorg. Chem. 2019, 86, 305–315. [Google Scholar] [CrossRef]
  10. Papoutsis, K.; Zhang, J.; Bowyer, M.C.; Brunton, N.; Gibney, E.R.; Lyng, J. Fruit, Vegetables, and Mushrooms for the Preparation of Extracts with α-Amylase and α-Glucosidase Inhibition Properties: A Review. Food Chem. 2021, 338, 128119. [Google Scholar] [CrossRef]
  11. Vijaykrishnaraj, M.; Wang, K. Dietary Natural Products as a Potential Inhibitor towards Advanced Glycation End Products and Hyperglycemic Complications: A Phytotherapy Approaches. Biomed. Pharmacother. 2021, 144, 112336. [Google Scholar] [CrossRef]
  12. Wang, T.Y.; Li, Q.; Bi, K.S. Bioactive Flavonoids in Medicinal Plants: Structure, Activity and Biological Fate. Asian J. Pharm. Sci. 2018, 13, 12–23. [Google Scholar] [CrossRef]
  13. Yang, J.; Wang, X.; Zhang, C.; Ma, L.; Wei, T.; Zhao, Y.; Peng, X. Comparative Study of Inhibition Mechanisms of Structurally Different Flavonoid Compounds on α-Glucosidase and Synergistic Effect with Acarbose. Food Chem. 2021, 347, 129056. [Google Scholar] [CrossRef]
  14. Mishra, A.P.; Sharifi-Rad, M.; Shariati, M.A.; Mabkhot, Y.N.; Al-Showiman, S.S.; Rauf, A.; Salehi, B.; Župunski, M.; Sharifi-Rad, M.; Gusain, P.; et al. Bioactive Compounds and Health Benefits of Edible Rumex Species–A Review. Cell. Mol. Biol. 2018, 64, 27–34. [Google Scholar] [CrossRef]
  15. Shafiq, N.; Saleem, M.; Kousar, S.; Sahar, M.; Hussain, S.M.; Jabeen, F. Investigation of genus Rumex for their biologically active constituents. Res. J. Life Sci. Bioinforatics Pharm. Chem. Sci. 2017, 2, 148–165. [Google Scholar] [CrossRef]
  16. de Rzedowski, G.C.; Rzedowski, J. Flora Fanerogámica Del Valle de México, 1st ed.; Martínez, R.M.M., Ed.; Comisión Nacional para el Conocimiento y Uso de la Biodiversidad: Mexico City, Mexico, 2005; ISBN 978-607-7607-36-6. [Google Scholar]
  17. Pareek, A.; Kumar, A. Rumex crispus L.—A Plant of Traditional Value. Drug Discov. 2014, 9, 20–23. [Google Scholar]
  18. Li, J.J.; Li, Y.X.; Li, N.; Zhu, H.T.; Wang, D.; Zhang, Y.J. The Genus Rumex (Polygonaceae): An Ethnobotanical, Phytochemical and Pharmacological Review. Nat. Products Bioprospect. 2022, 12, 21. [Google Scholar] [CrossRef] [PubMed]
  19. Vasas, A.; Orbán-Gyapai, O.; Hohmann, J. The Genus Rumex: Review of Traditional Uses, Phytochemistry and Pharmacology. J. Ethnopharmacol. 2015, 175, 198–228. [Google Scholar] [CrossRef]
  20. Buzgaia, N.; Awin, T.; Elabbar, F.; Abdusalam, K.; Lee, S.Y.; Rukayadi, Y.; Abas, F.; Shaari, K. Antibacterial Activity of Arbutus Pavarii Pamp against Methicillin-Resistant Staphylococcus Aureus (MRSA) and UHPLC-MS/MS Profile of the Bioactive Fraction. Plants 2020, 9, 1539. [Google Scholar] [CrossRef]
  21. Xin, Z.; Ma, S.; Ren, D.; Liu, W.; Han, B.; Zhang, Y.; Xiao, J.; Yi, L.; Deng, B. UPLC-Orbitrap-MS/MS Combined with Chemometrics Establishes Variations in Chemical Components in Green Tea from Yunnan and Hunan Origins. Food Chem. 2018, 266, 534–544. [Google Scholar] [CrossRef] [PubMed]
  22. Sun, J.; Liang, F.; Bin, Y.; Li, P.; Duan, C. Screening Non-Colored Phenolics in Red Wines Using Liquid Chromatography/Ultraviolet and Mass Spectrometry/Mass Spectrometry Libraries. Molecules 2007, 12, 679–693. [Google Scholar] [CrossRef] [PubMed] [Green Version]
  23. Yang, D.; Zhao, J.; Liu, S.; Song, F.; Liu, Z. The Screening of Potential α-Glucosidase Inhibitors from the Polygonum Multiflorum Extract Using Ultrafiltration Combined with Liquid Chromatography-Tandem Mass Spectrometry. Anal. Methods 2014, 6, 3353–3359. [Google Scholar] [CrossRef]
  24. Wang, X.; Sun, W.; Sun, H.; Lv, H.; Wu, Z.; Wang, P.; Liu, L.; Cao, H. Analysis of the Constituents in the Rat Plasma after Oral Administration of Yin Chen Hao Tang by UPLC/Q-TOF-MS/MS. J. Pharm. Biomed. Anal. 2008, 46, 477–490. [Google Scholar] [CrossRef]
  25. Ferreres, F.; Grosso, C.; Gil-Izquierdo, A.; Valentão, P.; Azevedo, C.; Andrade, P.B. HPLC-DAD-ESI/MS n Analysis of Phenolic Compounds for Quality Control of Grindelia Robusta Nutt. and Bioactivities. J. Pharm. Biomed. Anal. 2014, 94, 163–172. [Google Scholar] [CrossRef] [PubMed]
  26. Abidi, J.; Ammar, S.; Ben Brahim, S.; Skalicka-Woźniak, K.; Ghrabi-Gammar, Z.; Bouaziz, M. Use of Ultra-High-Performance Liquid Chromatography Coupled with Quadrupole-Time-of-Flight Mass Spectrometry System as Valuable Tool for an Untargeted Metabolomic Profiling of Rumex tunetanus Flowers and Stems and Contribution to the Antioxidant Activity. J. Pharm. Biomed. Anal. 2019, 162, 66–81. [Google Scholar] [CrossRef]
  27. He, L.; Zhang, Z.; Lu, L.; Liu, Y.; Li, S.; Wang, J.; Song, Z.; Yan, Z.; Miao, J. Rapid Identification and Quantitative Analysis of the Chemical Constituents in Scutellaria indica L. by UHPLC-QTOF-MS and UHPLC-MS/MS. J. Pharm. Biomed. Anal. 2016, 117, 125–139. [Google Scholar] [CrossRef]
  28. Zolkeflee, N.K.Z.; Ramli, N.S.; Azlan, A.; Abas, F. In Vitro Anti-Diabetic Activities and UHPLC-ESI-MS/MS Profile of Muntingia Calabura Leaves Extract. Molecules 2022, 27, 287. [Google Scholar] [CrossRef]
  29. Francescato, L.N.; Debenedetti, S.L.; Schwanz, T.G.; Bassani, V.L.; Henriques, A.T. Identification of Phenolic Compounds in Equisetum Giganteum by LC–ESI-MS/MS and a New Approach to Total Flavonoid Quantification. Talanta 2013, 105, 192–203. [Google Scholar] [CrossRef] [Green Version]
  30. Farag, M.A.; Kabbash, E.M.; Mediani, A.; Döll, S.; Esatbeyoglu, T.; Afifi, S.M. Comparative Metabolite Fingerprinting of Four Different Cinnamon Species Analyzed via UPLC–MS and GC–MS and Chemometric Tools. Molecules 2022, 27, 2935. [Google Scholar] [CrossRef]
  31. Feduraev, P.V.; Chupakhina, G.; Maslennikov, P.; Tacenko, N.; Skrypnik, L. Variation in Phenolic Compounds Content and Antioxidant Activity of Different Plant Organs from Rumex crispus L. and Rumex obtusifolius L. at Different Growth Stages. Antioxidants 2019, 8, 237. [Google Scholar] [CrossRef] [Green Version]
  32. Feduraev, P.V.; Skrypnik, L.N.; Maslennikov, P.V.; Tchoupakhina, G.N.; Tacenko, N.A. The Accumulation Features of Phenolic Compounds in Some Species of Genus Rumex L. Khimiya Rastit. Syr’ya 2017, 3, 123–130. [Google Scholar] [CrossRef] [Green Version]
  33. Idris, O.A.; Wintola, O.A.; Afolayan, A.J. Phytochemical and Antioxidant Activities of Rumex crispus L. in Treatment of Gastrointestinal Helminths in Eastern Cape Province, South Africa. Asian Pac. J. Trop. Biomed. 2016, 6, 962–966. [Google Scholar] [CrossRef]
  34. Hong, H.C.; Li, S.L.; Zhang, X.Q.; Ye, W.C.; Zhang, Q.W. Flavonoids with α-Glucosidase Inhibitory Activities and Their Contents in the Leaves of Morus Atropurpurea. Chin. Med. 2013, 8, 19. [Google Scholar] [CrossRef] [PubMed] [Green Version]
  35. Li, K.; Yao, F.; Xue, Q.; Fan, H.; Yang, L.; Li, X.; Sun, L.; Liu, Y. Inhibitory Effects against α-Glucosidase and α-Amylase of the Flavonoids-Rich Extract from Scutellaria Baicalensis Shoots and Interpretation of Structure–Activity Relationship of Its Eight Flavonoids by a Refined Assign-Score Method. Chem. Cent. J. 2018, 12, 82. [Google Scholar] [CrossRef] [PubMed]
  36. Hamed, Y.S.; Abdin, M.; Rayan, A.M.; Saleem Akhtar, H.M.; Zeng, X. Synergistic Inhibition of Isolated Flavonoids from Moringa Oleifera Leaf on α-Glucosidase Activity. LWT 2021, 141, 111081. [Google Scholar] [CrossRef]
  37. Chokki, M.; Cudalbeanu, M.; Zongo, C.; Dah-Nouvlessounon, D.; Ghinea, I.O.; Furdui, B.; Raclea, R.; Savadogo, A.; Baba-Moussa, L.; Avamescu, S.M.; et al. Exploring Antioxidant and Enzymes (A-Amylase and B-Glucosidase) Inhibitory Activity of Morinda Lucida and Momordica Charantia Leaves from Benin. Foods 2020, 9, 434. [Google Scholar] [CrossRef] [Green Version]
  38. Spínola, V.; Llorent-Martínez, E.J.; Castilho, P.C. Inhibition of α-Amylase, α-Glucosidase and Pancreatic Lipase by Phenolic Compounds of Rumex maderensis (Madeira sorrel). Influence of Simulated Gastrointestinal Digestion on Hyperglycaemia-Related Damage Linked with Aldose Reductase Activity and Protein G. LWT Food Sci. Technol. 2020, 118, 108727. [Google Scholar] [CrossRef]
  39. Minh, T.N.; Van, T.M.; Andriana, Y.; Vinh, L.T.; Hau, D.V.; Duyen, D.H.; de Guzman-Gelani, C. Antioxidant, Xanthine Oxidase, α-Amylase and α-Glucosidase Inhibitory Activities of Bioactive Compounds from Rumex crispus L. Root. Molecules 2019, 24, 3899. [Google Scholar] [CrossRef] [Green Version]
  40. Savran, A.; Zengin, G.; Aktumsek, A.; Mocan, A.; Glamoćlija, J.; Ćirić, A.; Soković, M. Phenolic Compounds and Biological Effects of Edible: Rumex scutatus and Pseudosempervivum sempervivum: Potential Sources of Natural Agents with Health Benefits. Food Funct. 2016, 7, 3252–3262. [Google Scholar] [CrossRef] [PubMed]
  41. Elsayed, R.H.; Kamel, E.M.; Mahmoud, A.M.; El-Bassuony, A.A.; Bin-Jumah, M.; Lamsabhi, A.M.; Ahmed, S.A. Rumex dentatus L. Phenolics Ameliorate Hyperglycemia by Modulating Hepatic Key Enzymes of Carbohydrate Metabolism, Oxidative Stress and PPARγ in Diabetic Rats. Food Chem. Toxicol. 2020, 138, 111202. [Google Scholar] [CrossRef]
  42. Sedaghat, R.; Roghani, M.; Ahmadi, M.; Ahmadi, F. Antihyperglycemic and Antihyperlipidemic Effect of Rumex patientia Seed Preparation in Streptozotocin-Diabetic Rats. Pathophysiology 2011, 18, 111–115. [Google Scholar] [CrossRef] [PubMed]
  43. Sampietro, D.A.; Catalan, C.A.N.; Vattuone, M.A.; Narwal, S.S. Isolation, Identification and Characterization of Allelochemicals/Natural Products; Taylor & Francis Ltd.,: Mexico City, Mexico, 2009; ISBN 9781578085774. [Google Scholar]
  44. Pérez-Pérez, E.M.; Vit, P.; Rivas, E.; Sciortino, R.; Sosa, A.; Tejada, D.; Rodríguez-Malaver, A.J. Antioxidant Activity of Four Color Fractions of Bee Pollen from Mérida, Venezuela. Arch. Latinoam. Nutr. 2012, 62, 375–380. [Google Scholar] [PubMed]
  45. Mahboubi, M.; Kazempour, N.; Nazar, A.R.B. Total Phenolic, Total Flavonoids, Antioxidant and Antimicrobial Activities of Scrophularia Striata Boiss Extracts. Jundishapur J. Nat. Pharm. Prod. 2013, 8, 15–19. [Google Scholar] [CrossRef] [PubMed] [Green Version]
  46. Herald, T.J.; Gadgil, P.; Perumal, R.; Bean, S.R.; Wilson, J.D. High-Throughput Micro-Plate HCl-Vanillin Assay for Screening Tannin Content in Sorghum Grain. J. Sci. Food Agric. 2014, 94, 2133–2136. [Google Scholar] [CrossRef] [PubMed]
  47. Makkar, H.P.S.; Siddhuraju, P.; Becker, K. Plant Secondary Metabolites; Methods in Molecular BiologyTM; Humana Press: Totowa, NJ, USA, 2007; Volume 393, ISBN 978-1-58829-993-2. [Google Scholar]
  48. Xiong, Q.; Wilson, W.K.; Pang, J. The Liebermann–Burchard Reaction: Sulfonation, Desaturation, and Rearrangment of Cholesterol in Acid. Lipids 2007, 42, 87–96. [Google Scholar] [CrossRef] [PubMed]
  49. Ajanal, M.; Gundkalle, M.; Nayak, S. Estimation of Total Alkaloid in Chitrakadivati by UV-Spectrophotometer. Anc. Sci. Life 2012, 31, 198. [Google Scholar] [CrossRef]
  50. Salehi, P.; Asghari, B.; Esmaeili, M.A.; Dehghan, H.; Ghazi, I. α-Glucosidase and α-Amylase Inhibitory Effect and Antioxidant Activity of Ten Plant Extracts Traditionally Used in Iran for Diabetes. J. Med. Plants Res. 2013, 7, 257–266. [Google Scholar] [CrossRef]
  51. Norma Oficial Mexicana NOM-062-ZOO-1999; Especificaciones Técnicas Para La Producción, Cuidado y Uso de Los Animales de Laboratorio. Diario Oficial de la Federación: Mexico City, Mexico, 1999.
  52. Furman, B.L. Streptozotocin-Induced Diabetic Models in Mice and Rats. Curr. Protoc. 2021, 1, e78. [Google Scholar] [CrossRef]
  53. Norma Oficial Mexicana NOM-033-ZOO-1995; Sacrificio Humanitario de Los Animales Domésticos y Silvestres. Diario Oficial de la Federación: Mexico City, Mexico, 1995.
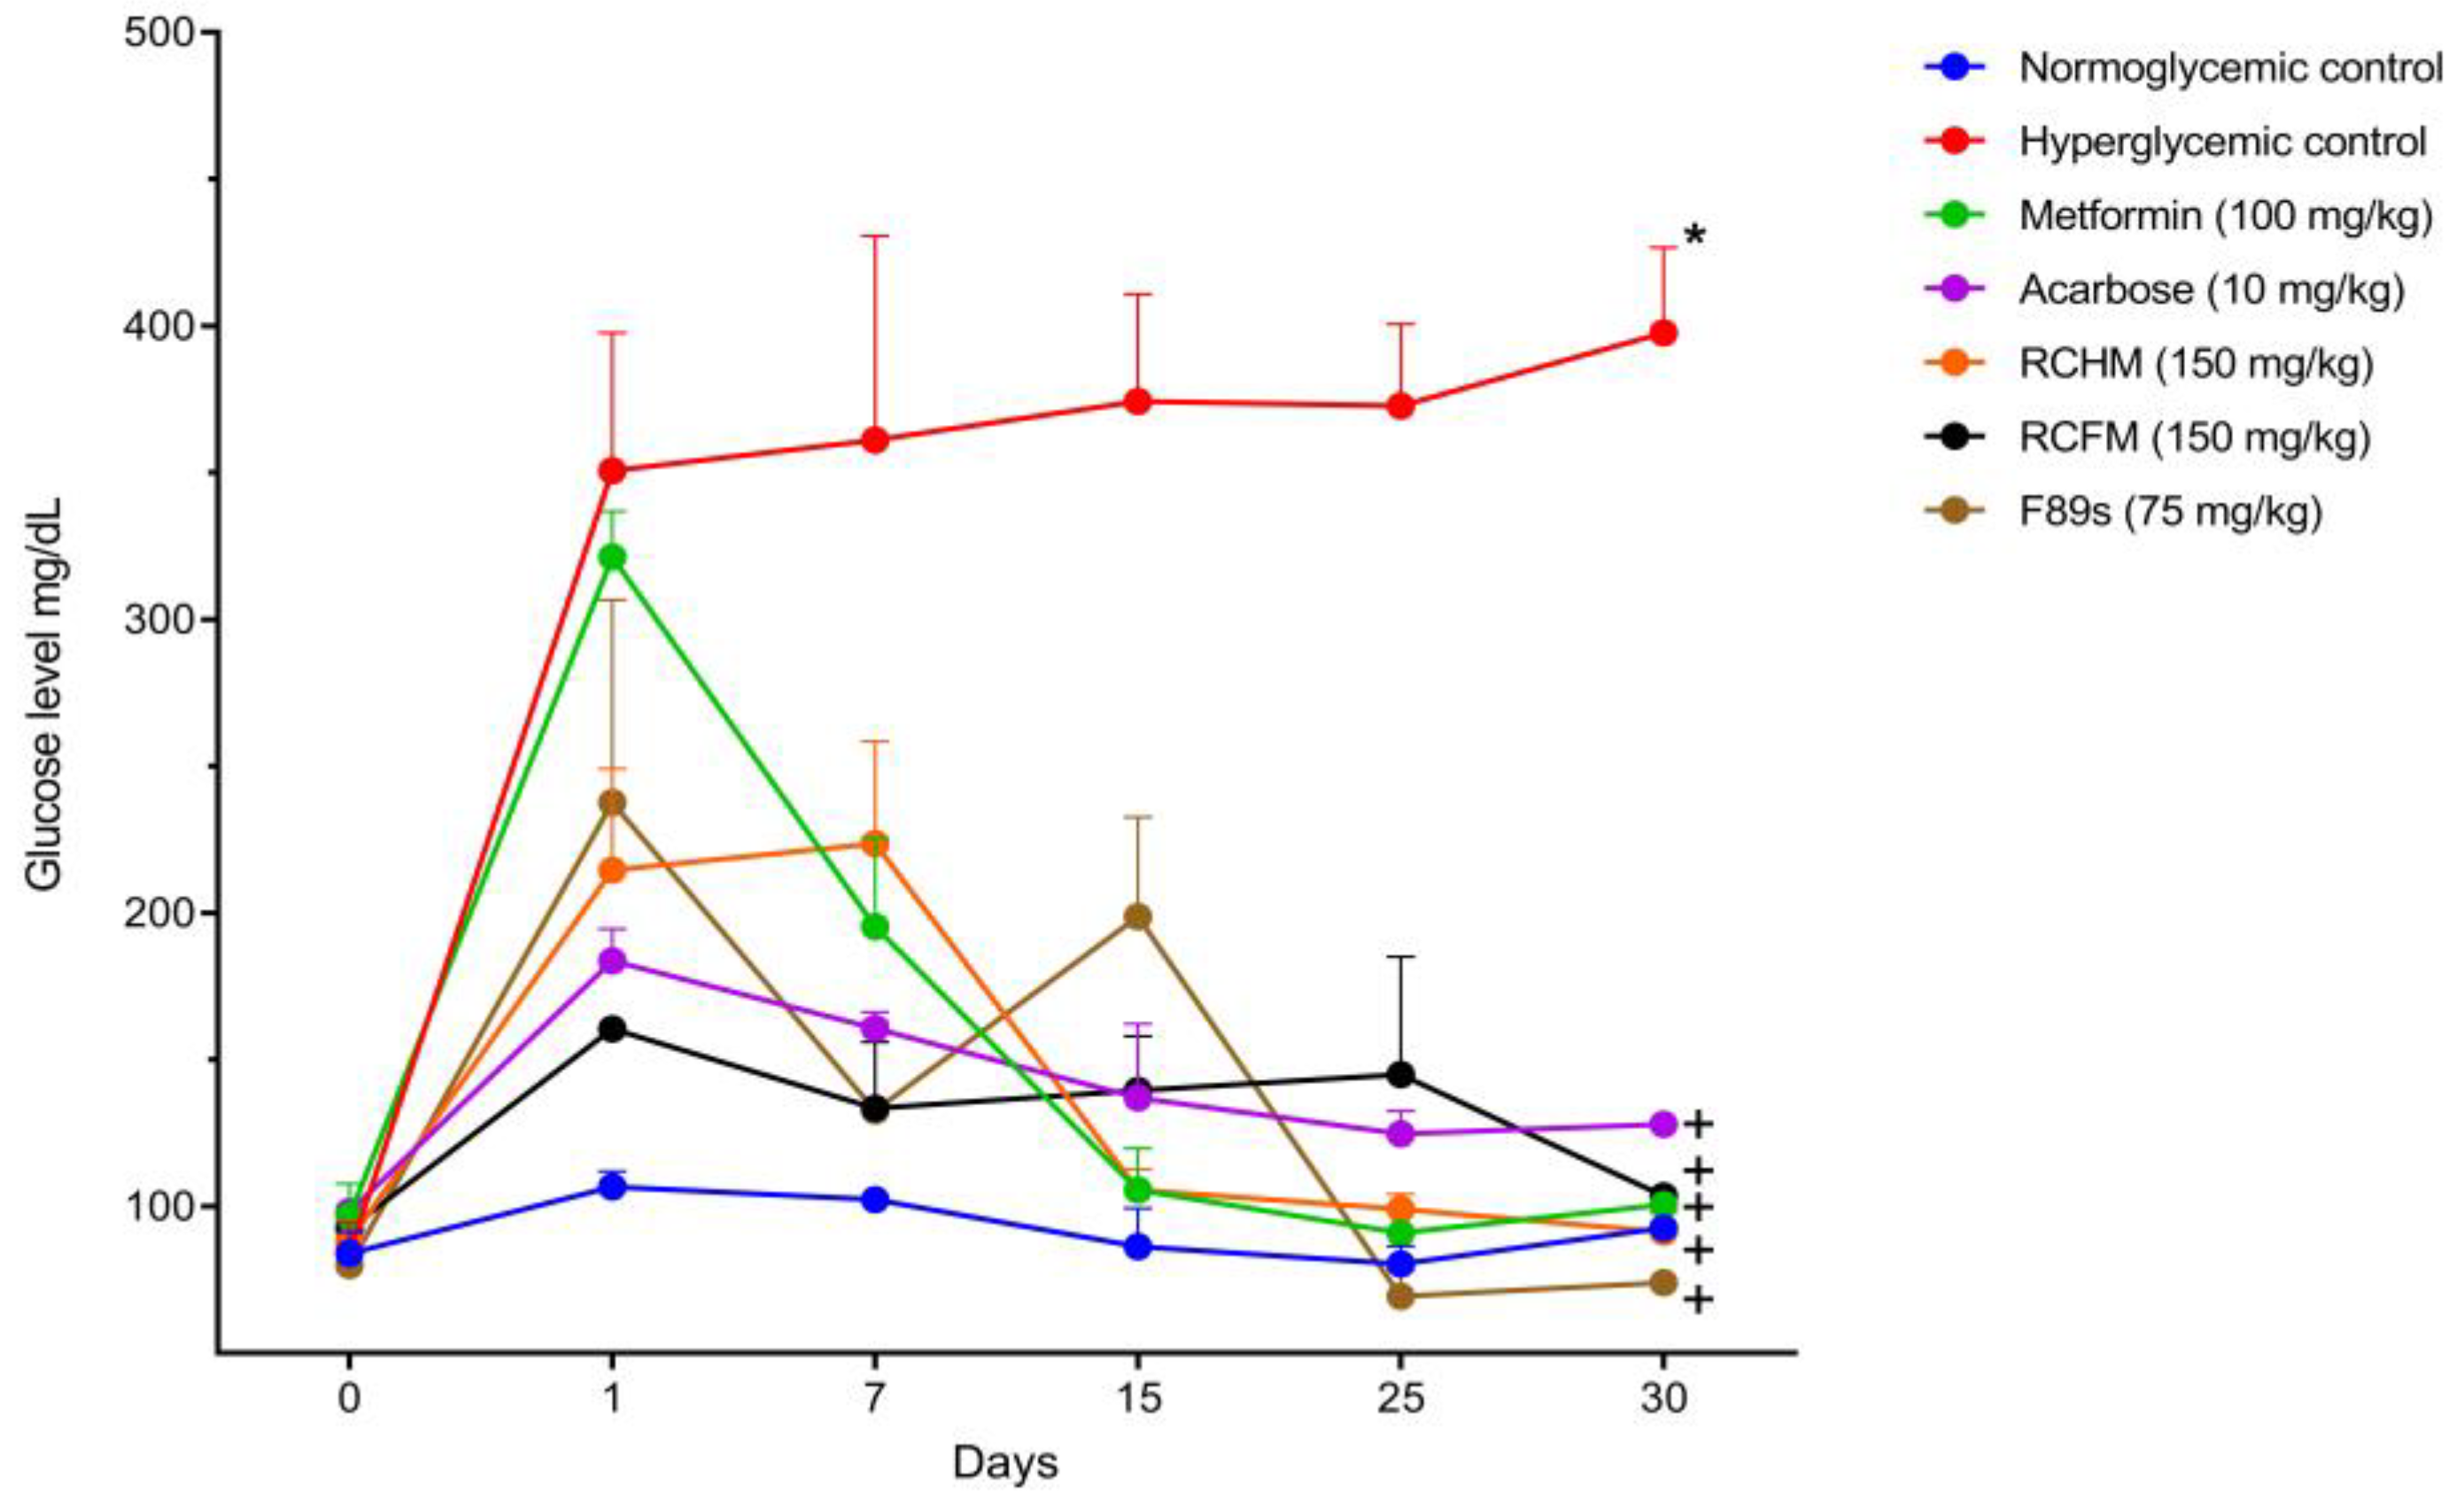
Figure 1. Peripheral glucose levels of normoglycemic rats and those with STZ-induced hyperglycemia and different treatments. p < 0.05 was considered as significant. * Statistically significant difference compared to normoglycemic controls. + Statistically significant difference compared to hyperglycemic controls.
Molecules 28 05760 g001
Figure 2. Body weight of normoglycemic rats and those with STZ-induced hyperglycemia and different treatments. p < 0.05 was considered as significant. * Statistically significant difference compared to normoglycemic controls. + Statistically significant difference compared to hyperglycemic controls.
Molecules 28 05760 g002
Figure 3. The serum levels of glucose (a) and insulin (b) of normoglycemic rats and those with STZ-induced hyperglycemia and different treatments. p < 0.05 was considered as significant. * Statistically significant difference compared to normoglycemic controls. + Statistically significant difference compared to hyperglycemic controls.
Molecules 28 05760 g003
Figure 4. The levels of liver enzymes (a) and total bilirubin (b) in normoglycemic rats and those with STZ-induced hyperglycemia and different treatments. p < 0.05 was considered as significant. * Statistically significant difference compared to normoglycemic controls. + Statistically significant difference compared to hyperglycemic controls.
Molecules 28 05760 g004
Figure 5. The serum levels of urea (a) and creatinine (b) in normoglycemic rats and those with STZ-induced hyperglycemia and different treatments. p < 0.05 was considered as significant. * Statistically significant difference compared to normoglycemic controls. + Statistically significant difference compared to hyperglycemic controls.
Molecules 28 05760 g005
Table 1. Physical description and yields of the crude extracts.
IDPhysical Description of the ExtractYield (g)% Yield (w/w)
RCHHDark brown and gummy3.6940.92
RCHDDark brown and gummy4.4371.11
RCHMBrown powder19.3724.84
RCFHDark brown and gummy3.51890.75
RCFDDark brown and gummy3.0690.65
RCFMBrown powder52.811.19
RC, Rumex crispus L.; plant organ subjected to extraction (H, leaves; F, flowers); solvent (H, n-hexane; D, dichloromethane; and M, methanol).
Table 2. Phytochemical composition of crude extracts.
IDTotal
Phenolics
(mg EGA/g)
Total
Polyphenols
(mg ETA/g)
Flavonoids
(mg EQ/g)
Condensed
Tannins
(mg EC/g)
Total Sterols
(mg EChol/g)
Total
Saponins
(mg ED/g)
Alkaloids
(mg EA/g)
RCHH12.24 ± 0.66 E3.54 ± 0.27 C63.18 ± 0.39 C23.62 ± 1.38 D142.82 ± 1.0 D154.14 ± 1.72 F2.13 ± 0.23 A
RCHD54.78 ± 0.83 C7.39 ± 0.17 C190.57 ± 0.74 A122.02 ± 0.59 A329.82 ± 5.19 A161.05 ± 1.54 E0.55 ± 0.22 CD
RCHM260.76 ± 1.77 B108.65 ± 0.46 B19.37 ± 0.18 E81.19 ± 0.20 C13.68 ± 1.02 E319.93 ± 0.96 C0.76 ± 0.07 BC
RCFH7.50 ± 0.20 E3.02 ± 0.10 C26.80 ± 0.22 D8.75 ± 0.14 F163.78 ± 3.06 C289.73 ± 1.62 D1.15 ± 0.28 B
RCFD38.76 ± 0.26 D9.11 ± 0.46 C135.41 ± 0.60 B21.48 ± 0.59 E290.54 ± 1.15 B374.44 ± 1.54 B0.18 ± 0.02 D
RCFM662.31 ± 4.51 A837.44 ± 7.50 A8.34 ± 0.16 F117.30 ± 0.59 B2.09 ± 0.11 F727.72 ± 2.72 A0.18 ± 0.02 D
Different letters in a column indicate significant differences (p < 0.05) using Tukey’s test. Values are expressed as the mean ± standard deviation (n = 3).
Table 3. Inhibitory activity of the extracts and fractions of R. crispus L. on α-glucosidase.
IDIC50 (μg/mL)IDIC50 (μg/mL)
RCHH>400RCFH>400
RCHD>400RCFD>400
RCHM112.0 ± 1.23RCFM7.3 ± 0.17
RCHM-FDCM205.5 ± 2.46RCFM-FDCM15.8 ± 0.15
RCHM-FM98.2 ± 0.78RCFM-FM4.4 ± 0.03
RCHM-SA>100RCFM-SA3.89 ± 0.06
RCHM-SM>100RCFM-SM>4.0
Acarbose3698.0 ± 76.5F89s3.8 ± 0.11
Values are expressed as the mean (based on four replicates) ± standard deviation. Acarbose served as a positive control. Fractions were obtained with dichloromethane (RCHM-FDCM and RCFM-FDCM) or methanol (RCHM-FM and RCFM-FM), while subfractions were obtained with acetone (RCHM-SA and RCFM-SA) or methanol (RCHM-SM and RCFM-SM) and the bioactive fraction F89s.
Table 4. Correlation matrix with the Pearson coefficient values for the phytochemicals and α-glucosidase inhibitory activity of R. crispus L.
Parameters1/IC50Total
Phenolics
Total
Polyphenols
FlavonoidsCondensed
Tannins
Total
Sterols
Alkaloids
Total phenolics0.946
Total polyphenols0.9970.968
Flavonoids−0.459−0.522−0.487
Condensed
Tannins
0.5410.6410.5620.146
Total
Sterols
−0.588−0.716−0.630.925−0.178
Alkaloids−0.434−0.49−0.447−0.204−0.504−0.081
Total
saponins
0.9140.8950.92−0.5010.35−0.568−0.62
Table 5. Tentative identification of metabolites present in R. crispus L.
PeakRT (min)Tentative IdentificationFormulaObserved
m/z
Main Fragments (m/z)Bibliography
10.47AspalathinC21H24O11451.1211377, 271, 211, 125
20.75Gallic acidC7H6O5169.0124151, 125, 124, 123 [20,21,22]
31.94D-(+)-catechinC15H14O6289.071273, 257, 179, 161, 137, 125[20,21,23]
42.42Procyanidin A2C30H24O12575.1205451, 425, 407, 289, 161, 125
52.73(−)-EpicatechinC15H14O6289.0716273, 243, 161, 137, 125, 123[20,21]
63.08Isorhamnetin-3-O-galactosideC22H22O12477.1034411, 372, 314, 289, 250, 193[24]
74.6(-)-Epicatechin-3-O-gallateC22H18O10441.0829301, 271, 245, 175, 169, 151, 125[21]
94.74Quercetin-7-glucuronideC21H18O13477.0667463, 301, 300, 288, 271, 151, 133, 123, 125[25]
84.74DemethylwedelolactoneC15H8O7299.0183271, 255, 151, 133
104.79RutinC27H30O16609.1491463, 301, 299, 243, 151, 133[21,26]
114.84LyonisideC27H36O12551.2143521, 289, 215, 187, 171, 133, 125
125.01Procyanidin B3 3′-O-gallateC37H30O16729.1468559, 407, 303, 289, 287, 269, 169, 125[26]
135.02Brucein AC26H34O11521.2023461, 359, 313, 289, 165, 125
145.25NudiposideC27H36O12551.2122521, 359, 289, 284, 165, 125
155.5TectoridinC22H22O11461.1089447, 357, 300, 284, 169
165.84ScutellarinC21H18O12461.0732300, 285, 284, 271, 161, 151, 133[27]
176.08QuercitrinC21H20O11447.0931300, 285, 243, 201, 190, 151[28]
186.09Rhein glucosideC21H18O11445.0776271, 255, 243, 215, 161, 133, 125
196.36Isorhamnetin 3-glucosideC22H22O12477.1041407, 372, 314, 285, 243, 161, 133
206.93AloesinC19H22O9393.1179300, 299, 285, 270, 255, 227
217.06VitexinC21H20O10431.0987299, 285, 270, 255, 227, 135[21]
227.37Chrysophanol-8-(6-O-galloyl-β-D-glucopyranoside)C28H24O13567.1156407, 341, 270, 225, 169, 135, 125
237.68PruninC21H22O10433.1134323, 311, 270, 269, 231, 151, 125[21]
248.967-Hydroxy-3-(4-hydroxyphenyl)-4-oxo-4H-chromen-8-yl-hexopyranosideC21H20O10431.0983359, 297, 269, 131
259.05ApigeninC15H10O5269.0443253, 230, 227, 151, 131, 117[21,27]
269.21KaempferolC15H10O6285.0391253, 229, 227, 151, 137, 117[21,29]
2714.74EmodinC15H10O5269.0446241, 165, 137, 133[23,30]
Table 6. The serum lipid profile and atherogenic index of normoglycemic rats and those with STZ-induced hyperglycemia and different treatments.
Normoglycemic
Controls
Hyperglycemic ControlsMetformin
(100 mg/kg)
Acarbose
(10 mg/kg)
RCHM
(150 mg/kg)
RCFM
(150 mg/kg)
F89s
(75 mg/kg)
TC (mg/dL)72.20 ± 2.7564.50 ± 2.6661.60 ± 2.9751.8 ± 3.44 *52.3 ± 3.76 *48.50 ± 5.50 *56.70 ± 2.96 *
HDL (mg/dL)35.60 ± 2.82 +14.86 ± 1.58 *24.20 ± 1.46 *,+25.5 ± 3.52 *,+17.67 ± 1.45 *12.50 ± 2.50 *22.00 ± 3.51 *
LDL (mg/dL)21.67 ± 4.3931.13 ± 0.9330.60 ± 4.0230.33 ± 1.4332.67 ± 5.931.50 ± 7.5024.50 ± 0.50
TG (mg/dL)104.80 ± 12.71 +200.50 ± 21.03 *83.29 ± 7.89 +37.6 ± 2.18 *,+35.67 ± 6.64 *,+35.50 ± 9.50 *,+35.33 ± 2.91 *,+
VLDL (mg/mL)20.95 ± 2.54 +40.10 ± 4.21 *16.66 ± 1.58 +6.27 ± 1.3 *,+7.13 ± 1.33 *,+7.10 ± 1.90 *,+7.07 ± 0.58 *,+
AI2.50 ± 0.15 +4.61 ± 0.80 *2.69 ± 0.20 +2.29 ± 0.48 +3.02 ± 0.363.95 ± 0.352.67 ± 0.32 +
Values are expressed as the mean ± SEM. p < 0.05 was considered as significant. * Statistically significant difference compared to normoglycemic controls. + Statistically significant difference compared to hyperglycemic controls. Total cholesterol (TC), triglycerides (TG), high-density lipoprotein (HDL), low-density lipoprotein (LDL), very low-density lipoprotein (VLDL), and atherogenic index (AI).
Disclaimer/Publisher’s Note: The statements, opinions and data contained in all publications are solely those of the individual author(s) and contributor(s) and not of MDPI and/or the editor(s). MDPI and/or the editor(s) disclaim responsibility for any injury to people or property resulting from any ideas, methods, instructions or products referred to in the content.