Abstract
The main target of this work is to discover new protein fractions from natural resources with high antibacterial action. The 7S and 11S globulin fractions, as well as the basic subunit (BS), were isolated from lupine seeds (Lupinus termis), chemically characterized, and screened for antibacterial activity against seven pathogenic bacteria. SDS-PAGE revealed molecular weights ranging from 55 to 75 kDa for 7S globulin, 20–37 kD for 11S globulin, and 20 kD for the BS. 11S globulin and the BS migrated faster on Urea-PAGE toward the cathode compared to 7S globulin. FTIR and NMR showed different spectral patterns between the 7S and 11S globulins but similar ones between 11S globulin and the BS. The MICs of the BS were in the range of 0.05–2 μg/mL against Listeria monocytogenes, Klebsiella oxytoca, Proteus mirabilis, Staphylococcus aureus, Listeria ivanovii, Salmonella typhimurium, and Pseudomonas aeruginosa compared to higher values for 11S globulin. The BS surpassed 11S globulin in antibacterial action, while 7S globulin showed no effect. The MICs of 11S globulin and the BS represented only 5% and 2.5% of the specific antibiotic against L. monocytogenes, respectively. Scanning electron microscopy (SEM) demonstrated different signs of cellular deformation and decay in the protein-treated bacteria, probably due to interaction with the bacterial cell wall and membranes. 11S globulin and the BS can be nominated as effective food biopreservatives.
1. Introduction
Extensive use and misuse of antibiotics in human and veterinary medicine have escalated the challenge of emergent circulating multidrug-resistant bacterial strains [1,2,3]. Thus, identifying new antimicrobial agents with different mechanisms of action is highly required [4,5,6,7,8,9,10,11]. On the contrary, natural alternatives have a much better image. For several years, basic proteins, spices, herbs, and herbal extracts have been identified for their antimicrobial activities [12,13,14,15,16,17,18,19,20]. Moreover, the biodiversity of plants provides an essential source of chemical compounds with therapeutic applications, including antiviral, antibacterial, antifungal, and anticancer activities [21].
Antimicrobial proteins and peptides (AMPPs) are among the selected lead compounds fighting microbial resistance. Although some antimicrobial peptides may be currently far from reaching the antimicrobial potency of current drugs, they are still highly interesting due to the following advantages: (a) the ability to avoid developing bacteria resistance mechanisms thanks to unspecific mechanisms of action, (b) a broad range of activity, and (c) low toxicity to the host. Some natural drugs other than AMPPs have been developed in the past years. Generally, AMPPs display high contents of cationic amino acids [18,22,23,24,25]. It is widely believed that they act through nonspecific binding to biological membranes, even though the exact nature of these interactions is still unclear [26].
Microbial contamination of food by food-borne pathogens is one of the main problems resulting in reduced food shelf life and possible food poisoning, triggering major health hazards. Therefore, numerous chemical additives are utilized as food preservatives to promote food safety and extend food shelf life. The potentially harmful effect of using chemical preservatives has switched the search for safe natural bio-preservatives with considerable antimicrobial capacity for use in food industries [27].
Legumes play a key role in many regions’ traditional diets [28,29,30]. Lupine seeds are characterized by virtually nonexistent starch and high protein content (total protein content of approximately 34%) in comparison with other legumes, including beans and peas [31]. Lupine seed globulins comprise three major groups of proteins: two groups of storage proteins referred to as α-conglutin (11S legumin-like lupine globulin) and β-conglutin (7S vicilin-like lupine globulin). The third group is a smaller protein fraction (γ-conglutin) [32]. The antibacterial activities of 7S and 11S globulins and basic polypeptides from soybeans have been recently explored [33,34,35,36,37].
Lupine seeds are utilized in traditional medicine worldwide due to their antioxidant and antimicrobial properties [38]. These activities are mainly associated with some bioactive secondary compounds, such as polyphenols, alkaloids, and phytosterols, as well as some nutritional primary compounds, such as proteins and glycosides [39]. Ethanol extract from bitter Lupinus albus seeds exhibited great antimicrobial activity against Gram-positive bacteria (Staphylococcus aureus). However, they were weakly active or had no activity against Gram-negative bacteria (Escherichia coli) [40]. On the other hand, yellow lupine extract showed high antibacterial activity against various studied bacteria; that is, the minimum inhibitory concentration (MIC) ranged from 6.25 to 200 µg/mL, which was attributed to the presence of bioactive polyphenol compounds, particularly chlorogenic acid and rutin [41]. However, no specific research has been dedicated to the antimicrobial activities of the bioactive proteins and peptides of lupine seeds. Therefore, the present work aims to further isolate lupine seed proteins into 11S globulin and its basic subunit to thoroughly explore novel natural products with potentially high antimicrobial activities. This is particularly necessary in the context of the emergence of multidrug-resistant bacteria. The outcomes of the present study, including effective natural antibacterial properties with very low MICs, are novel and can have wide prospective applications, leading to the substitution of traditional antibiotics. The current study elucidates the physicochemical characteristics of lupine 11S globulin and its basic subunit (BS) and clarifies their modes and levels of antibacterial actions against many pathogenic bacterial strains.
2. Results
2.1. Chemical Characterization of Lupine Protein Isolate (LPI), 7S and 11S Globulins, and Basic Subunit (BS) from Lupine Seeds
2.1.1. SDS-PAGE and Urea-PAGE of 7S and 11S Globulins and BS
An SDS-PAGE electropherogram (shown in Figure 1, lane 1) representing the LPI indicated the presence of six bands with a molecular weight in the range of 20–180 KDa. These bands represented the main fractions of LPI, 11S globulin, and 7S globulin. The fraction for 7S globulin (lane 2) exhibited three bands with molecular weights ranging from 55 to 75 kDa. The fraction for 11S globulin (lane 3) showed two bands (20 and 37 KDa) representing the acidic and basic subunits, respectively. The fraction in lane 4 (the basic subunit) presented only one band (20 KDa), a key component of 11S.
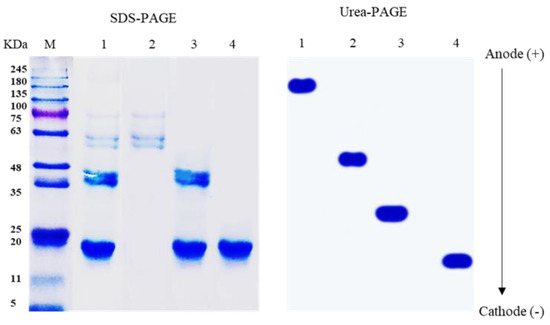
Figure 1.
SDS-PAGE and Urea-PAGE of LPI (lane 1), 7S globulin (lane 2), 11S globulin (lane 3), and BS (lane 4) in comparison with protein marker (M).
Urea-PAGE showed the bands of LPI, 7S, 11S, and BS migrating to the cathode in a successively increasing order, that is, LPI < 7S < 11S < BS. This is consistent with previous research on legume seed proteins (Sitohy et al., 2013). The fractionation of LPI led conclusively to the liberation of the positive charges on separated protein moieties, ending with a full release at the basic subunit.
2.1.2. pH–Solubility Curve
The pH–solubility curves of LPI, the 7S and 11S globulins, and the BS are illustrated in Figure 2. It is clear that the least soluble points (isoelectric points) appeared at pH 4.4, 5.4, 7.2, and 7.9 for LPI, 7S, 11S, and BS, respectively.
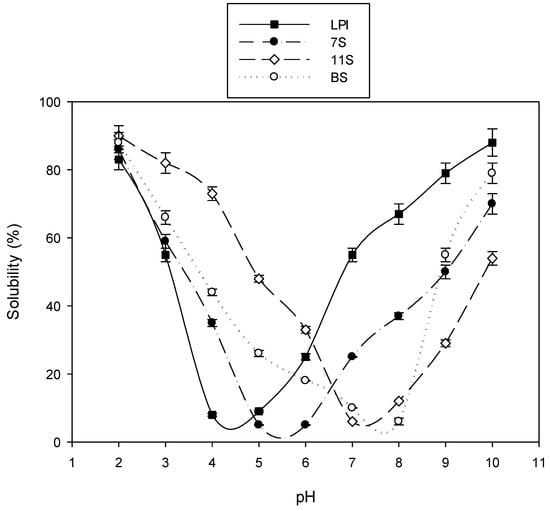
Figure 2.
pH–solubility curves of lupine protein isolate (LPI), its main subunits of 7S and 11S globulin, and its basic subunit (BS).
2.1.3. FT-IR Spectroscopy
The IR spectra of 11S globulin and the basic subunit (BS) showed great similarity (Figure 3). They had common high absorption peaks at 3364 and 3278 cm−1, respectively, referring to the presence of the amidic NH of the peptide bond; at 1770 cm−1, indicating the presence of acid (C=O) groups of the carboxyl groups; at 1693 and 1668 cm−1, referring to the (C=O) of peptide linkage; at 1593 cm−1 for C=N groups (histidine); at 1514–1452 cm−1 for C=C; and at 1129 cm−1 for ester (-O-) or -COOH groups.
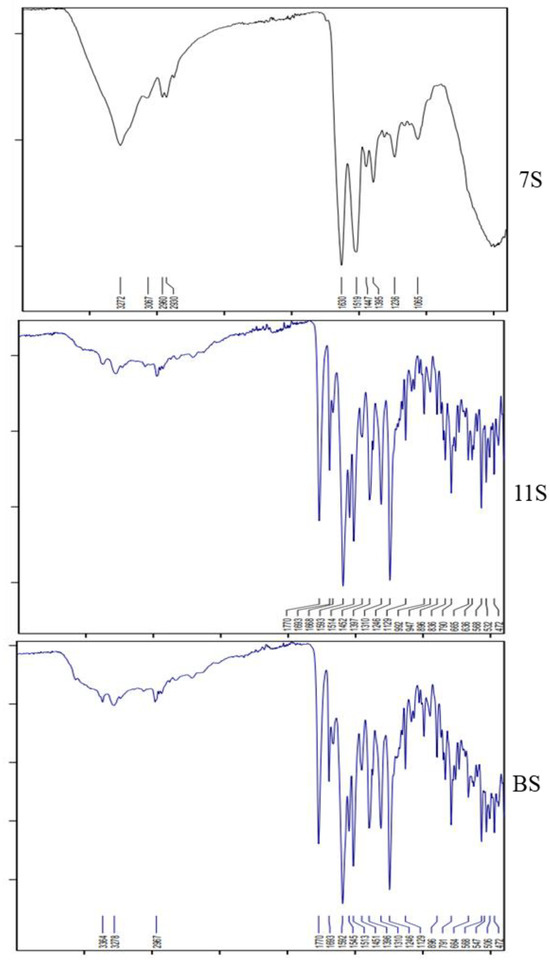
Figure 3.
FT-IR spectra of lupine seed protein: 7S and 11S globulins and BS.
Alternatively, there were some deviations in the IR spectrum of 7S globulin from those of the two previous fractions (11S globulin and the BS). The first deviation was noticed for the absorption at 3272 cm−1 instead of at 3364 and 3278 cm−1 (amidic NH), as well as high absorption at 1630 cm−1 for the (C=O) of amide peptide linkage instead of at 1693 and 1668 cm−1, as in the cases of the two basic protein fractions (11S globulin and the BS).
The other high IR spectrum absorption level of 7S globulin appeared at 1519–1447 cm−1, and was linked to the presence of (C=C); this was comparable to its levels in 11S globulin and the BS.
Finally, both 11S globulin and the BS were specifically characterized by high IR absorption at 3364 and 3278 cm−1, as well as 1693 and 1668 cm−1, distinguishing them from 7S globulin, which was correspondingly characterized by high absorption at 3272 cm−1 and 1630 cm−1.
2.1.4. 1H NMR Spectroscopy
Similar NMR spectra were found for the lupine seed protein of 11S globulins (glycinin) and the basic subunit (BS), as shown in Figure 4. For 11S globulin, the spectrum showed 1H NMR (DMSO-d6): δ = 1.51 (s, 1H, CH3), 5.09 (s, 2H, OCH2), 5.44 (s, 1H, Ar-H), 7.48 (d, 1H, J = 6.8 Hz, Ar-H), 7.59 (d, 1H, J = 6.90 Hz, Ar-H), 7.27 (s, 1H, NH), and 7.58–7.66 (m, 3H, Ar-H).
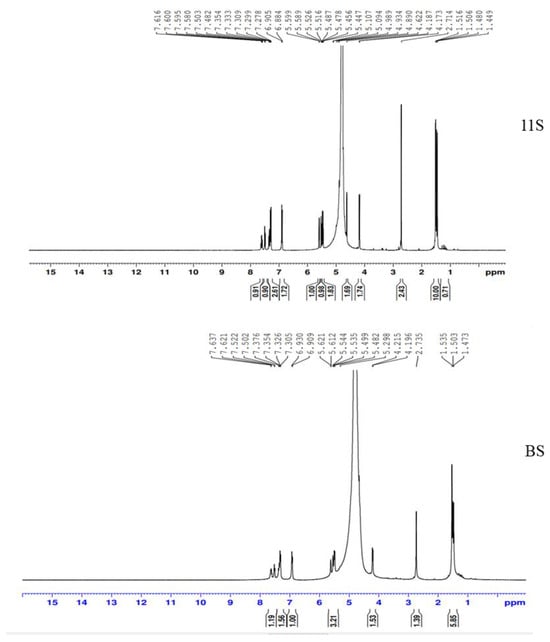
Figure 4.
1H NMR spectra of 11S globulin and BS.
For the BS, the spectrum was located at 1H NMR (DMSO-d6): δ = 1.51 (s, 1H, CH3), 5.09 (s, 2H, OCH2), 5.52 (s, 1H, Ar-H), 7.48 (d, 1H, J = 6.8 Hz, Ar-H), 7.50 (s, 1H, NH), and 7.58–7.66 (m, 3H, Ar-H).
2.1.5. Total Phenolic Compounds
The total phenolic compound contents in the two protein fractions (11S globulin and the basic subunit) were 0.05 and 0.03 mg gallic acid/g protein, respectively. Flavonoids were absent in these two products and could not be detected.
2.2. Antibacterial Activity of LPI, 7S and 11S Globulins, and BS against Gram-Positive and Gram-Negative Bacteria
Using the disk diffusion method, the initially tested antibacterial activities of different lupine protein fractions at a high concentration (1000 µg/mL) demonstrated that 11S globulin and the BS had antibacterial activity against all of the six tested bacteria (Figure 5). On the contrary, the LPI and 7S globulin produced no inhibition zones against any of the tested bacteria. These results indicated that 11S globulin has fewer antibacterial activities than the basic subunit.
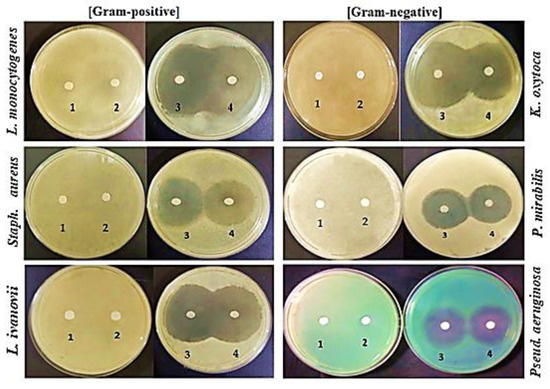
Figure 5.
Initial testing of antibacterial activity of different lupine protein fractions of (1) LPI, (2) 7S globulin, (3) BS, and (4) 11S globulin tested at a concentration of 1000 µg/mL against Gram-positive and Gram-negative bacteria.
2.3. Minimum Inhibitory Concentration (MIC)
The data in Table 1 and Table 2 present the bacterial inhibitory actions of graded concentrations of lupine 11S globulin and BS using the disk and well diffusion assay techniques, as well as their statistical significance. The results of the two techniques (disk and well diffusion assays) were similar. The data in Table 1, Table 2 and Table 3 show that lupine 11S globulin had MIC values in the range of 0.1–4 µg/mL compared to the range of 0.05–2 µg/mL for lupine BS. Generally, in most cases the inhibition zone diameter induced by the BS was relatively higher than that induced by 11S globulin at the same concentration. The data in Table 1B and Table 2B demonstrate the significance of the differences in antibiotic activities of the tested substances. The antibacterial activity of the BS (Table 1B) could be classified into categories as follows: 26–28, 15–16, and 7–11 corresponding to L. monocytogenes and K. oxytoca; L. ivanovii and S. aureus; and P. mirabilis, P. aeruginosa, and S. typhimurium, respectively. The difference between the groups regarding microorganism effect was significant. Meanwhile, the antibacterial activity of 11S globulin (Table 2B) could be classified into categories as follows: 23–24, 16–17, and 12–13 corresponding to L. monocytogenes and K. oxytoca; L. ivanovii, S. aureus, and P. mirabilis; and P. aeruginosa and S. typhimurium, respectively. Therefore, the difference between the groups regarding microorganism effect was also significant in the case of 11S globulin. Increase in the tested protein concentrations resulted in significant increases in antibacterial activity (Table 1B and Table 2B). The significant increase caused by concentration referred to the essential role of the identified substances in inducing antibacterial action. Figure 6 illustrates the antibacterial effects of 11S globulin and the BS against S. aureus and K. oxytoca.

Table 1.
Bacterial inhibitory actions of graded concentrations of lupine 11S globulin using agar well diffusion and disk assay techniques (A) and statistical significance (B).
Table 2.
Bacterial inhibitory actions of graded concentrations of lupine BS using agar well diffusion and disk assay techniques (A) and statistical significance (B).
Table 3.
Minimum inhibitory concentrations (MICs; µg/mL) of 11S globulin and basic subunit (BS) from lupine seeds against tested bacteria.

Figure 6.
Antibacterial sensitivity test of 11S globulin and BS against Gram-positive (S. aureus) and Gram-negative bacteria (K. oxytoca). The numbers (1–10) correspond to 8, 4, 2, 1, 0.5, 0.3, 0.1, 0.05, 0.025, and 0.0125 µg/mL, respectively.
2.4. SEM Image Analysis
The SEM images illustrate that the presence of both 11S globulin and the basic subunit at the MIC (0.5 μg/mL) in brain heart infusion (BHI) broth medium containing S. aureus or K. oxytoca evidently reduced the relative content of the intact cells after 2.5 h of incubation at 37 ºC (as shown in Figure 7). The manifested ultrastructure clearly revealed a higher degree of damaged bacteria in the presence of the BS in comparison with 11S globulin. The small letters of a, b, and c refer to normal, intermediary, and completely deformed bacterial cells, respectively. The SEM images in Figure 7 present the morphological shapes of Gram-positive bacteria (S. aureus) and Gram-negative bacteria (K. oxytoca) in their original statuses and as affected by the presence of 0.5 μg/mL of 11S globulin and 0.5 μg/mL of BS in S. aureus medium and 0.5 μg/mL of 11S globulin and 0.5 μg/mL of BS in K. oxytoca medium. It was noticed that the control bacteria had their integral natural forms, while their corresponding ones subjected to 11S globulin and BS treatments showed different magnitudes of deformation. The highest magnitude of cellular deformation was manifested with the BS treatment. The cellular deformation of the bacterial cells induced by the presence of low concentrations of both 11S globulin and BS could explain the antibacterial action previously observed (Figure 5).

Figure 7.
Scanning electron microscopic (SEM) images (10,000 X) of S. aureus (Gram-positive) and K. oxytoca (Gram-negative) as affected by 0.5 μg/mL 11S globulin and 0.5 μg/mL BS. The small letters of a, b, and c refer to normal, intermediary, and completely deformed bacterial cells, respectively.
2.5. Comparison of the MIC of Tested Lupine (11S and BS) with Specific Antibiotics for Each Microorganism
The data in Figure 8 present comparative measurements of the MICs of the tested 11S globulin and BS against Gram-positive and Gram-negative pathogenic bacteria compared to the actions of specific antibiotics in each case. In the case of the three tested Gram-positive bacteria, 11S globulin and the BS greatly surpassed the specific antibiotics. This distinction was most evident in the case of L. ivanovii, followed by L. monocytogenes, where the MICs of 11S globulin and the BS were 1 and 0.5 µg/mL, respectively, against L. ivanovii and 0.1 and 0.05 µg/mL, respectively, against L. monocytogenes.

Figure 8.
Comparison of MICs of tested lupine (11S globulin and BS) with specific antibiotics for each microorganism.
A lesser extent of excellence was detected against S. aureus. It was also observed that the BS surpassed even 11S globulin in its antibacterial action. The MIC was nearly two times lower in the case of the BS in comparison with 11S globulin. This trend also applied to most of the pathogenic Gram-negative bacteria, that is, three of the four studied: K. oxytoca, S. typhimurium, and P. mirabilis. In the case of P. aeruginosa, the MICs of 11S globulin and the BS were only slightly higher than those of the antibiotics but still very effective. The MIC of the BS was about 2–50 times lower than those of the specific antibiotics in the cases of Gram-positive bacteria and about 4–12 times lower than the antibiotics in the cases of Gram-negative bacteria. Alternatively, the MICs of 11S globulin represented about 5%, 8%, 13%, 50%, 50%, 100%, and 400% of those of the corresponding specific antibiotics against L. monocytogenes, K. oxytoca, L. ivanovii, S. aureus, S. typhimurium, P. mirabilis, and P. aeruginosa, respectively. Meanwhile, the MICs of the BS represented about 2.5%, 7%, 8%, 25%, 25%, 50%, and 200% of those of the corresponding specific antibiotics against L. monocytogenes, L. ivanovii, K. oxytoca, P. mirabilis, S. typhimurium, S. aureus, and P. aeruginosa, respectively.
2.6. Quantitative Inhibition of Pathogenic Bacteria by 11S Globulin and BS
Using different 11S globulin and BS concentrations (as presented in Table 1 and Table 2) revealed that 8 μg/mL of BS and 11S globulin yielded the most inhibition against all the tested bacteria. The disk diffusion assay indicated concentration-dependent inhibition zone diameters for the BS and 11S globulin. The data in Figure 8 elucidate the 24 h growth curves of seven pathogenic bacteria subjected to one value of MIC for 11S globulin or the BS, which indicated general growth inhibition.
Among the Gram-positive bacteria, L. monocytogenes and K. oxytoca were the most inhibited organisms by both proteins. However, strong effects of the BS on the seven tested bacteria were observed compared to the control. Therefore, the BS was the most inhibitory compared to 11S globulin and the control bacteria (Figure 9).

Figure 9.
Twenty-four-hour growth curves of three pathogenic Gram-positive bacteria and four pathogenic Gram-negative bacteria in the presence of MICs of 11S globulin and BS.
3. Discussion
Unbalanced consumption and overuse of antimicrobial treatments have resulted in the growth of antibiotic-resistant bacteria, forcing scientists to search for novel antimicrobial agents with different mechanisms of action for utilization as food preservatives or for controlling human diseases. Cationic antimicrobial peptides and proteins (AMPPs) are still the best choices and most promising candidates. Numerous studies have shown broad antibacterial spectra of numerous natural AMPPs against various pathogenic bacteria. Thus, several plant proteins with antibacterial or antifungal properties have been isolated, investigated, and qualified as antimicrobial agents [22,33,42].
The current study revealed remarkable antibacterial activity in lupine seed 7S and 11S globulins and BS. Therefore, confirming their chemical identities was required. Initially, the observed molecular mass range of LPI subunits between 20 and 180 kDa could indicate their ability to dissociate into more active subunits under various ionic strengths and pH levels. The appearance of two 11S globulin bands of about 20 and 37 kDa corresponded to the basic and acidic subunits, concurring with another previously published work [43].
The faster migration of 11S globulin and the BS on Urea-PAGE in the cathode direction compared to those of LPI and 7S globulin could represent bigger positive charges. However, the slower migration of 11S globulin than BS could indicate bigger positive charges in the latter, predicting a higher inhibitory effect against pathogenic bacteria. On the contrary, the slower migration of LPI and 7S globulin referring to less positive charges could indicate lower antibacterial action, which agrees with previously published work [43]. The appearance of the least soluble points in the pH–solubility curves of pH 4.4, 5.4, 7.2, and 7.9 for LPI, 7S globulin, 11S globulin, and BS, respectively, agrees with previous studies, indicating the isoelectric points of the 7S and 11S globulins isolated from soybeans at about pH 5 and 6.5, respectively [10]. The higher values of isoelectric points for the 11S globulin and BS fractions (pH 7.2 and 7.9, respectively) could reflect a more basic nature, especially for the BS, following the Urea-PAGE results. FT-IR spectroscopy elucidated the specific secondary structures of the different lupine seed protein fractions, the 7S and 11S globulins, and the BS. These results are consistent with recent work elucidating the secondary structure of a protein by FT-IR and providing conformational and structural dynamic information for proteins [44]. The IR spectra of 11S globulin and the BS were marked by the presence of high absorption at 3364 and 3278 cm−1, as well as 1693 and 1668 cm−1, against 3272 cm−1 and 1630 cm−1, respectively, in the case of 7S globulin. This distinction could be due to possibly higher shielding of the two amidic groups (amidic NH and amidic CO) by relatively higher proportions of the free carboxyl groups (from aspartic and glutamic residues) in the case of 7S globulin than in both 11S globulin and the BS [19]. This shielding could occur through forming hydrogen bonds between free carboxyl groups and peptide bonds. The close 1H NMR spectra of 11S globulin and the BS confirmed the IR spectra results and concluded that 11S globulin and the BS were structurally similar since the BS was a major component of 11S globulin. This confirmed the structural closeness of the two proteins. Furthermore, the lack of cationic nature from the structure of 7S globulin could explain its limited action, which agrees with other reports on the 7S globulin fractions from different legume seed proteins, such as cowpea seed protein [43] and soybean protein [33]. The high antimicrobial activities of the BS and 11S globulin could be due to their more intense cationic nature and higher hydrophobicity [33], initiating electrostatic interactions between the positive charges of the antimicrobial agent and the negative charges on bacterial cell walls or membranes. The potential hydrophobic aggregation between similar regions of the two reactants could further stabilize this complex. Oscillating random Brownian motion of these aggregations could produce large-sized pores channels, disintegrating the cell wall and cell membranes and engendering higher cell permeability, cell emptiness, and death [18,21]. The results of the present study demonstrated very low MIC values of 11S globulin (0.5 µg/mL) and still lower values of the BS against L. monocytogenes (0.05 µg/mL), which was ten times lower than that of 11S globulin (0.5 µg/mL). Generally, the MIC values obtained in the current study were much lower than the ones obtained by Aneta et al. [44] for enzyme-assisted supercritical fluid from yellow lupine extract against Bacillus subtilis, which were in the range of 6.25–200 µg/mL. These results confirmed that the impact of the positive charges on the protein molecules of 11S globulin and the BS may be stronger than those exerted by the polyphenol compounds, as presented in the study by Aneta et al. [44]. The agents of 11S globulin and BS excelled in antibacterial effectiveness compared to commonly used antibiotics. In conclusion, 11S globulin and the BS were more effective than antibiotics as antimicrobial agents and could be further recommended as good and more efficient substitutes for antibiotics. The MIC data of 11S globulin and the BS also indicated higher antibacterial effectiveness than other natural bioactive proteins, such as cowpea subunits of 11S globulin, against some pathogenic bacteria [45].
To discern whether the antibacterial actions of the tested material were due to the protein identity or to some interference in the possible contamination by flavonoids or phenolic compounds in the source material, 11S globulin and the BS were analyzed for these two components. The results indicated an absence of flavonoid compounds, as well as levels of 5 and 3 microgram phenolic compounds in 11S globulin and the BS, respectively. Therefore, even using higher levels of 11S globulin and the BS, that is, 100 µg/mL, includes 5 and 3 ng of phenolic compounds, respectively, which are very far from the effective level of phenolic compounds (6.25–200 µg/mL), as indicated by Aneta et al. [41]. The actual MICs found in this study contained very few traces of phenolic compounds, that is, 0.025 and 0.0025 ng/mL. Thus, the observed inhibitory actions of the studied materials were solely due to the protein identities of these two materials. The MIC values of both the BS and 11S globulin (0.05–0.5 µg/g) against different tested pathogenic bacteria could be promising as safe food additives recommended for food preservation and probably for medical use after due clinical studies.
4. Materials and Methods
4.1. Isolation and Chemical Characterization of Lupine Protein Isolate (LPI), 7S and 11S Globulins, and Basic Subunit (BS) from Lupine Seeds
4.1.1. Sample Preparation
Lupine seeds (Lupinus termis) were purchased from a local market in Zagazig city, Sharkia, Egypt, and were manually cleaned and ground for 3 min using a Moulinex mixer (Type 716, France) at the maximum speed setting. The meal was ground until it could pass through a 1 mm2 sieve. The powder was then defatted with n-hexane for 8 h. Solvent was evaporated using a rotary evaporator, and the dried, defatted meal was stored at 4 °C until performing the analysis.
4.1.2. Extraction of Protein Isolate
Dispersions of 5% (w/v) defatted lupine flour in water were adjusted to pH 9 with 0.1 N NaOH at room temperature, shaken for 1 h, and centrifuged for 15 min at 2000× g. The extraction and centrifugation procedures were repeated on the residue to increase the yield. The extracts were combined, and the pH was adjusted to 4.5 with 1 N HCl to precipitate the protein. The proteins were recovered by centrifugation at 2000× g for 15 min, followed by removing the supernatant by decantation. Crude protein was washed with distilled water, then dispersed in a limited volume of distilled water at pH 7.5, dialyzed overnight, and lyophilized [46].
4.1.3. Isolation of 7S and 11S Globulins and Basic Subunit (BS) from Lupine
The 7S and 11S globulin protein subunits were isolated from the defatted powder of lupine seeds in accordance with methods described previously, with slight modifications [43]. Ten grams of defatted lupine seed meal was dispersed in 150 mL buffer (0.03 M Tris HCl at pH 8.5, 0.4 M NaCl, 10 mM β-mercaptoethanol, 1 mM EDTA, and 0.02% (w/v) NaN3), and the solubilized contents were separated by centrifugation at 5000× g for 10 min. The solution was stirred for 1 h at 45 °C in a water bath. Afterward, both 7S and 11S globulins were precipitated through the use of ammonium sulfate (50–65% and 65–85%, respectively). The precipitates were dispersed and solubilized as described above and dialyzed against the same buffer for 48 h to remove salts.
Basic subunits were separated from 11S globulin following the methods described by Sitohy et al. [33]. 11S globulin was dissolved in 30 mM Tris buffer (pH 8.0) containing 15 mM β-mercaptoethanol (at 0.5% w/v). The protein solution was heated to 90 °C for 30 min and then centrifuged at 10,000× g at 4 °C for 20 min. The precipitate (basic subunit) was washed twice with 30 m MTris buffer (pH 8.0), suspended in distilled water, and freeze-dried.
4.1.4. Sodium Dodecyl-Sulfate Polyacrylamide Gel Electrophoresis (SDS-PAGE) of Proteins
Twenty milligrams of lupine protein isolate, 7S and 11S globulins, and basic subunit from lupine seeds were dissolved in 1 mL aliquots of SDS (10%) with 100 µL β-mercaptoethanol and subjected to intermittent vortexing over 15 min. The mixture was then centrifuged at 10,000× g for 5 min to separate the extract. 20 µL of extract were mixed with 20 µL of SDS-loading sample buffer (SDS 4%, β-mercaptoethanol 3%, glycerol 20%, Tris HCl 50 mM, pH 6.8, and bromophenol blue traces) and heated at 96 °C for 5 min. 10 µL aliquots were electrophoresed (10 µL of protein/lane) and analyzed using SDS-PAGE [47].
4.1.5. Urea-PAGE of 7S and 11S Globulins and BS
Lyophilized LPI, 7S and 11S globulins, and BS from lupine seeds were dispersed (10 mg/mL) in pH 6.8 buffer containing 0.25 M Tris-base, 50% glycerol, and bromophenol blue traces. Samples were centrifuged at 15,000× g for 5 min at 20 °C. Supernatants were analyzed using Urea-PAGE (10 µL of protein/lane) in 3% and 12% stacking and resolving gels, respectively [48].
4.1.6. pH–Solubility Curve
Protein pH–solubility curves were assayed using lyophilized LPI, 7S and 11S globulins, and BS from lupine seeds in the pH range of 2–10 [49]. Isoelectric points were estimated from the protein pH–solubility curves, with pH corresponding to the smallest protein solubility.
4.1.7. Fourier-Transform Infrared (FT-IR) Spectroscopy
Protein samples were prepared through the use of the potassium bromide (KBr) pellet method [50]. Infrared spectra were measured using an FT-IR spectrometer (Nicolet Nexus 470, DTGS, Thermo Scientific, Waltham, MS, USA) at 25 °C. For each spectrum, 256 interferograms were collected at a resolution of 4 cm−1, with 64 scans and a 2 cm−1 interval from the 4000–400 cm−1 region. The system was continuously purged with dry air. Second derivation spectra were obtained using a Savitzky–Golay derivative smoothing function. The relative amounts of different secondary structures were determined from the second infrared derivative amide spectra by manually computing the areas under the bands assigned to particular substructures.
4.1.8. 1H Nuclear Magnetic Resonance (1H NMR) Spectroscopy
The 1H NMR spectra were recorded on a Bruker Avance III 400 MHZ High-Performance Digital FT-NMR spectrometer with dimethyl sulfoxide (DMSO-d6) acting as the solvent. Chemical shifts were reported in δ(ppm) using tetramethylsilane (TMS) as an internal standard.
4.1.9. Total Phenolic Compounds (TPCs) and Total Flavonoid Content (TFC) Estimation
The total phenolic compounds (TPCs) and total flavonoid content (TFC) were determined in the protein samples (11S globulin and its basic subunit) by combining 0.1 g of each protein with 4 mL 70% methanol and stirring at room temperature for 24 h. The mixtures were centrifuged at 3000× g for 15 min. The residue was re-extracted twice, as before, and the resulting methanolic extracts were combined and utilized for determining the TPCs using the Folin–Ciocalteu assay, as described by Singleton and Rossi [51]. Gallic acid was utilized as the standard. TFC was also determined according to the protocol of Ordoñez et al. [52]. Quercetin was utilized as the standard.
4.2. Antibacterial Activities of LPI, 7S and 11S Globulins, and BS against Gram-Negative and Gram-Positive Bacteria
The antibacterial activities of LPI, 7S globulin, 11S globulin, and the BS, as well as their size exclusion fractions, were assessed against seven tested pathogenic bacteria through a disk diffusion assay, as described by Abdel-Hamid et al. [21], and an agar well diffusion assay [25].
For the agar well diffusion assay, overnight cultures of the seven tested bacteria were diluted to 6 log CFU/mL and spread on brain heart infusion (BHI) agar plates, followed by adding 15 µL drops of lupine protein fractions (LPI, 11S and 7S globulins, and BS) at a concentration of 1000 µg/mL. In the case of the disk diffusion assay, sterilized paper disks of 6 mm in diameter were soaked in diluted LPI, 7S and 11S globulins, and BS solutions (1000 μg/mL) and laid on the surface of nutrient agar medium with appropriate distances separating them from each other. The plates were incubated at 37 °C for 48 h, and the diameters (mm) of the clear zones were recorded.
4.2.1. Minimum Inhibitory Concentration (MIC)
Minimum inhibitory concentration (MIC) was determined using agar well diffusion and disk diffusion methods. The MIC of an antimicrobial agent is taken as the lowest concentration (μg/mL) that inhibits the visible growth of a microorganism after overnight incubation.
Agar Well Diffusion Assay
11S globulin and the BS were tested for antibacterial activity against the seven tested bacteria using a conventional well diffusion assay [53]. Pure cultures of bacterial strains were subcultured on BHIB at 37 °C on a rotary shaker at 200 r.p.m. The exponential phase cultures of these strains were adjusted to a concentration of 1.05 × 10⁹ CFU mL−1. Each strain was spread uniformly onto individual plates using sterile cotton swabs. Wells of 6 mm in diameter were made on BHI agar using a gel-puncturing tool. Aliquots (40 μL) of 11S globulin and BS solutions (0, 0.1, 0.3, 0.5, 1, 2, 4, and 8 μg/mL) were transferred into each well. After incubation at 37 °C for 24 h, the inhibition zone diameters were measured using a transparent ruler. Each bacterium was cultivated on its specific medium.
Disk Diffusion Assay
The antibacterial activities of 11S globulin and the BS was tested against the seven experimental pathogenic bacteria using the Kirby–Bauer disk diffusion method [54]. Bacterial suspensions were spread over the surfaces of nutrient agar plates. Then, sterilized paper disks of 6 mm in diameter were soaked in diluted 11S globulin and its basic subunit solutions (0, 0.1, 0.3, 0.5, 1, 2, 4, and 8 μg/mL) and laid on the surface of nutrient agar medium with appropriate distances separating them from each other. The nutrient agar plates were incubated at 37 °C for 24 h, and diameters of inhibition zones (mm) were measured through the use of a millimeter ruler. Diameters of either antibiotic disks or proteins disks (6 mm) were subtracted from the total zone diameters.
4.2.2. Scanning Electron Microscopy (SEM)
S. aureus Gram-positive and K. oxytoca Gram-negative strains were chosen for SEM using an FEI Helios dual-beam scanning electron microscope and following standard protocols [55]. Briefly, the two tested bacteria were treated with MIC concentrations of 11S globulin and BS, where 11S globulin (0.5 μg/mL) and BS (0.5 μg/mL) were added to S. aureus and 11S globulin (0.5 μg/mL) and BS (0.5 μg/mL) were added to K. oxytoca cell suspensions at 10,000× g for 5 min. Bacterial pellets were fixed with 2% glutaraldehyde in PBS with a pH of 7.3 at 4 °C for 16 h. The pellets were washed three times with distilled water and then post-fixed with 1% aqueous OsO4 at 4 °C for 16 h. The pellets were rewashed three times with distilled water. The samples were then dehydrated in serial dilutions of ethanol (30%, 50%, 70%, 80%, 90%, 96%, and 100%), followed by serial dilutions of acetone (30%, 50%, and 100%) at 25 °C for 10 min in each dilution. Samples were then dried to a critical point in an Automated Critical Point Dryer (Leica EM CPD300, GmbH, Mannheim, Germany). Finally, samples were mounted on an aluminum stub, platinum-coated in a High-Resolution Sputter Coater (Cressington 208HR, Cressington Scientific Instruments, UK), and examined by SEM at 2 KV. For the size analysis, FIJI (NIH public domain) was used; samples were grown on BHIB and incubated at 37 °C to reach the maximum level of 109 CFU/ mL, which was subsequently diluted to 108 CFU/ mL using peptone buffer solution (0.1% peptone plus 0.85% NaCl).
4.2.3. Comparison of MICs of Tested Lupine (11S Globulin and BS) with Specific Antibiotics for Each Microorganism
An antibiotic sensitivity test was carried out for all the tested pathogenic bacteria using four antibiotics [25]. There was variability in the sensitivities of the tested pathogenic bacteria. The results in Figure 7 present the MICs of antibiotics, 11S globulin, and BS. MIC values (μg/mL) were 7.5, 6, 4, 2, 1, 1, and 2 for chloramphenicol, gentamycin, ciprofloxacin, ciprofloxacin, vancomycin, ciprofloxacin, and ciprofloxacin antibiotics as determined against L. ivanovii, K. oxytoca, S. typhimurium, L. monocytogenes, S. aureus, P. aeruginosa, and P. mirabilis, respectively. MICs of 11S globulin and BS ranged between 0.05 and 8 μg/mL.
4.2.4. Quantitative Inhibition of Pathogenic Bacteria by 11S Globulin and BS
A 50 μL aliquot of each tested bacterial culture after incubation at 37 °C for 4 h diluted in BHIB was dispensed into each test well of a 96-well plate. In all, bacterial cells treated with 50 μL of 1 MIC of 11S globulin and BS were added into wells. The negative control was BHIB only, whereas the positive control contained cell cultures alone with no added treatment. Growth was determined at 0 h and after 6, 12, 18, and 24 h of incubation using optical density (OD) and was measured at 600 nm through a microplate reader (Bio-Rad 680XR, Hertfordshire, UK).
4.3. Statistical Analysis
Data were statistically analyzed for descriptive measurements, that is, mean and standard error, through the use of SPSS program version 23. Two-way ANOVA tests were performed to compare the different microorganisms (i.e., L. monocytogenes, K. oxytoca, L. ivanovii, S. aureus, P. mirabilis, P. aeruginosa, and S. typhimurium), as well as the different concentrations (i.e., 0.05, 0.1, 0.3, 0.5, 1, 2, 4, and 8), and the interactions between them for inhibition zone diameter. If the p-value of the ANOVA was less than 0.05, the null hypothesis was rejected, indicating the absence of significant differences between the means. If the p-value was larger than 0.05, we could not conclude that a significant difference existed. We followed the two-way ANOVA test with a post hoc test using Duncan’s test to make multiple comparisons between averages of different groups. Means followed by the same letter were not significantly different from each other at the 5% probability level (Duncan’s multiple range tests).
5. Conclusions
Lupine seed (Lupinus termis) protein fractions were chemically characterized as having molecular weights in the range of 55–75 kDa for 7S globulin, 20–37 kD for 11S globulin, and 20 kD for the BS. The faster migration of 11S globulin and the BS than 7S globulin on Urea-PAGE toward the cathode could indicate higher positive charges and antibacterial activities. The basic subunit (BS) was the most effective antibacterial agent, surpassing 11S globulin and common utilized antibiotics against the studied pathogenic bacteria. The antibacterial actions of 11S globulin and the BS against L. monocytogenes surpassed the specific antibiotic (ciprofloxacin), as the MICs represented only 5% and 2.5% of that of the antibiotic, respectively. The various signs of cellular deformation and decay in the protein-treated bacteria revealed by scanning electron microscopy (SEM) confirmed the antibacterial actions of 11S globulin and the BS, probably because of some electrostatic and hydrophobic interactions between these two proteins and bacterial cell walls and membranes. Thus, the high antibacterial activities of 11S globulin and the BS against Gram-negative and Gram-positive bacteria could nominate them as effective food biopreservatives, with probable use for medical interventions after clinical validation. The specified novel antimicrobial agents had very effective antimicrobial activity, i.e., the MICs of the BS were in the range of 0.05–2 μg/mL, which exceeded those of many synthetic antibiotics, were entirely new, and could inspire many other studies. In addition, the identified FTIR and NMR spectral identities documented in this study could serve as standards to compare any other potential new antibacterial agents with comparable antibacterial activity.
Author Contributions
G.E., M.S., A.O., S.A.-S. and B.S. were responsible for the conceptualization; M.E.-N., B.S. and A.O. contributed to the methodology; A.O. was responsible for the software, investigation, and project administration; G.E, B.S. and M.S. performed the validation; B.S. performed the formal analysis; M.E.-N. was responsible for the resources; S.A.-S. conducted data curation; A.O., B.S. and M.E.-N. prepared the original draft; M.S. reviewed and edited the manuscript; S.A.-S. was responsible for the visualization; S.A.-S., G.E. and M.S. supervised the work; B.S. carried out funding acquisition. All authors have read and agreed to the published version of the manuscript.
Funding
Zagazig University, Zagazig, Egypt, and the County Council of Västerbotten (BS), Lions Cancer Research Fund (BS) and Kempestiftelserna (BS), Sweden.
Institutional Review Board Statement
Not applicable.
Informed Consent Statement
Not applicable.
Data Availability Statement
Not applicable.
Acknowledgments
The authors would like to thank the University of Zagazig and the County Council of Västerbotten (BS), Lions Cancer Research Fund (BS) and Kempestiftelserna (BS), Sweden.
Conflicts of Interest
The authors declare no conflict of interest.
Sample Availability
Samples of the compounds are available from the authors.
References
- Golkar, Z.; Bagasra, O.; Pace, D.G. Bacteriophage therapy: A potential solution for the antibiotic resistance crisis. J. Infect. Dev. Ctries 2014, 8, 129–136. [Google Scholar] [CrossRef]
- Adekanye, U.O.; Ekiri, A.B.; Galipó, E.; Muhammad, A.B.; Mateus, A.; La Ragione, R.M.; Wakawa, A.; Armson, B.; Mijten, E.; Alafiatayo, R. Knowledge, attitudes and practices of veterinarians towards antimicrobial resistance and stewardship in Nigeria. Antibiotics 2020, 9, 453. [Google Scholar] [CrossRef] [PubMed]
- Vivas, R.; Barbosa, A.A.T.; Dolabela, S.S.; Jain, S. Multidrug-resistant bacteria and alternative methods to control them: An overview. Microb. Drug Resist. 2019, 25, 890–908. [Google Scholar] [CrossRef] [PubMed]
- Maiyo, Z.; Ngure, R.; Matasyoh, J.; Chepkorir, R. Phytochemical constituents and antimicrobial activity of leaf extracts of three Amaranthus plant species. Afr. J. Biotechnol. 2010, 9, 3178–3182. [Google Scholar]
- Enan, G.; Abdel-Shafi, S.; Abdel-Haliem, M.; Negm, S. Characterization of probiotic lactic acid bacteria to be used as starter and protective cultures for dairy fermentations. Int. J. Probiotics Prebiotics 2013, 8, 157–164. [Google Scholar]
- Enan, G.; Al-Mohammadi, A.; El-Didamony, G.; Abdel-Haliem, M.; Zakaria, A. Antimicrobial activity of Enterococcus faecium NM2 isolated from urine: Purification, characterization and bactericidal action of enterocin NM2. Asian J. Appl. Sci. 2014, 7, 721–734. [Google Scholar] [CrossRef]
- Enan, G.; El-Didamony, G.; Mohamed, E.; Zakaria, A. Novel antibacterial activity of Enterococcus faecium NM2 isolated from urine of healthy people. Asian J. Appl. Sci. 2014, 7, 66–78. [Google Scholar] [CrossRef]
- Erfan, A.M.; Marouf, S. Cinnamon oil downregulates virulence genes of poultry respiratory bacterial agents and revealed significant bacterial inhibition: An in vitro perspective. Veter-World 2019, 12, 1707. [Google Scholar] [CrossRef]
- Osman, A.; Abdel-Shafi, S.; Al-Mohammadi, A.-R.; Kamal, N.; Enan, G.; Sitohy, M. Catfish glycoprotein, a highly powerful safe preservative of minced beef stored at 4 C for 15 days. Foods 2020, 9, 1115. [Google Scholar] [CrossRef]
- Osman, A.; El-Didamony, G.; Sitohy, M.; Khalifa, M.; Enan, G. Soybean glycinin basic subunit inhibits methicillin resistant-vancomycin intermediate Staphylococcus aureus (MRSA-VISA) in vitro. Int. J. Appl. Res. Nat. Prod. 2016, 9, 17–26. [Google Scholar]
- Hudson, M.A.; Lockless, S.W. Elucidating the Mechanisms of Action of Antimicrobial Agents. mBio 2022, 13, e02240-02221. [Google Scholar] [CrossRef]
- Beuchat, L. Antimicrobial properties of spices and their essential oils. Food Preserv. 1994, 12, 257–262. [Google Scholar]
- Kumaravel, S.; Muthukumaran, P.; Thomas, N. Phytochemical, GC-MS and FT-IR analysis of Papver somniferum. J. Pharm. Biol. Sci. 2019, 7, 1–8. [Google Scholar]
- Arora, D.S.; Kaur, J. Antimicrobial activity of spices. Int. J. Antimicrob. Agents 1999, 12, 257–262. [Google Scholar] [CrossRef] [PubMed]
- Marino, M.; Bersani, C.; Comi, G. Antimicrobial activity of the essential oils of Thymus vulgaris L. measured using a bioimpedometric method. Food Prot. 1999, 62, 1017–1023. [Google Scholar] [CrossRef]
- Penalver, P.; Huerta, B.; Borge, C.; Astorga, R.; Romero, R.; Perea, A. Antimicrobial activity of five essential oils against origin strains of the Enterobacteriaceae family. Apmis 2005, 113, 1–6. [Google Scholar] [CrossRef]
- Mahgoub, S.; Osman, A.; Sitohy, M. Inhibition of growth of pathogenic bacteria in raw milk by legume protein esters. J. Food Prot. 2011, 74, 1475–1481. [Google Scholar] [CrossRef]
- Sitohy, M.; Mahgoub, S.; Osman, A.; El-Masry, R.; Al-Gaby, A. Extent and mode of action of cationic legume proteins against Listeria monocytogenes and Salmonella Enteritidis. Probiotics Antimicrob. Proteins 2013, 5, 195–205. [Google Scholar] [CrossRef]
- Osman, A.O.; Mahgoub, S.A.; Sitohy, M.Z. Preservative action of 11S (glycinin) and 7S (β-conglycinin) soy globulin on bovine raw milk stored either at 4 or 25 C. J. Dairy Res. 2013, 80, 174–183. [Google Scholar] [CrossRef]
- Osman, A.; Mahgoub, S.; Sitohy, M.Z. Hindering milk quality storage deterioration by mild thermization combined with methylated chickpea protein. Int. Food Res. J. 2014, 21, 693–701. [Google Scholar]
- Abdel-Hamid, M.; Goda, H.A.; De Gobba, C.; Jenssen, H.; Osman, A. Antibacterial activity of papain hydrolysed camel whey and its fractions. Int. Dairy J. 2016, 61, 91–98. [Google Scholar] [CrossRef]
- Sitohy, M.; Osman, A. Antimicrobial activity of native and esterified legume proteins against Gram-negative and Gram-positive bacteria. Food Chem. 2010, 120, 66–73. [Google Scholar] [CrossRef]
- Sitohy, M.; Osman, A.; Ghany, A.; Salama, A. Antibacterial phycocyanin from Anabaena oryzae SOS13. Int. J. Appl. Res. Nat. Prod. 2015, 8, 27–36. [Google Scholar]
- Osman, A.; Goda, H.A.; Abdel-Hamid, M.; Badran, S.M.; Otte, J. Antibacterial peptides generated by Alcalase hydrolysis of goat whey. LWT-Food Sci. Technol. 2016, 65, 480–486. [Google Scholar] [CrossRef]
- Abdel-Shafi, S.; Osman, A.; Enan, G.; El-Nemer, M.; Sitohy, M. Antibacterial activity of methylated egg white proteins against pathogenic G+ and G-bacteria matching antibiotics. SpringerPlus 2016, 5, 1–13. [Google Scholar] [CrossRef]
- Shai, Y. Mode of action of membrane active antimicrobial peptides. Biopolymers 2002, 66, 236–248. [Google Scholar] [CrossRef]
- Sitohy, M.Z.; Osman, A.O. Enhancing milk preservation with esterified legume proteins. Probiotics Antimicrob. Proteins 2011, 3, 48–56. [Google Scholar] [CrossRef]
- Joray, M.; Rayas-Duarte, P.; Mohamed, A.; Van Santen, E. Coated lupin bean snacks. J. Food Qual. 2007, 30, 267–279. [Google Scholar] [CrossRef]
- Yeheyis, L.; Kijora, C.; Wink, M.; Peters, K.J. Effect of a traditional processing method on the chemical composition of local white lupin (Lupinus albus L.) seed in North-Western Ethiopia. Z. Nat. C 2011, 66, 403–408. [Google Scholar]
- Abd Elhamid, M.A.; Mandour, A.E.S.; Ismail, T.A.; Al-Zohairy, A.M.; Almowallad, S.; Alqahtani, L.S.; Osman, A. Powerful Antioxidants and Cytotoxic Activities of the Methanol Extracts from Eight Soybean Cultivars. Molecules 2022, 27, 2895. [Google Scholar] [CrossRef]
- Torres, A.; Frias, J.; Vidal-Valverde, C. Changes in chemical composition of lupin seeds (Lupinus angustifolius) after selective α-galactoside extraction. J. Sci. Food Agric. 2005, 85, 2468–2474. [Google Scholar] [CrossRef]
- Cerletti, P.; Fumagalli, A.; Venturin, D. Protein composition of seeds of Lupinus albus. J. Food Sci. 1978, 43, 1409–1411. [Google Scholar] [CrossRef]
- Sitohy, M.Z.; Mahgoub, S.A.; Osman, A.O. In vitro and in situ antimicrobial action and mechanism of glycinin and its basic subunit. Int. J. Food Microbiol. 2012, 154, 19–29. [Google Scholar] [CrossRef] [PubMed]
- Li, Y.-Q.; Sun, X.-X.; Feng, J.-L.; Mo, H.-Z. Antibacterial activities and membrane permeability actions of glycinin basic peptide against Escherichia coli. Innov. Food Sci. Emerg. Technol. 2015, 31, 170–176. [Google Scholar] [CrossRef]
- Yang, J.; Sun, G.-J.; Li, Y.-Q.; Cui, K.-Y.; Mo, H.Z. Antibacterial characteristics of glycinin basic polypeptide against Staphylococcus aureus. Food Sci. Biotechnol. 2016, 25, 1477–1483. [Google Scholar] [CrossRef] [PubMed]
- Zhao, G.-P.; Li, Y.-Q.; Sun, G.-J.; Mo, H.-Z. Antibacterial actions of glycinin basic peptide against Escherichia coli. J. Agric. Food Chem. 2017, 65, 5173–5180. [Google Scholar] [CrossRef]
- Sitohy, M.; Osman, A. Bioactive compounds in soybean proteins and its applications in food systems. Sustain. Agric. Environ. Egypt Part I 2018, 147–160. [Google Scholar]
- Santiago Quiles, M.R.; Oquendo-Jiménez, I.; Herreño-Saénz, D.; Antoun, M.D. Genotoxicity of alkaloid-rich extract from Lupinus termis seeds. Pharm. Crops 2010, 1, 18–23. [Google Scholar] [CrossRef]
- Abdallah, E.M.; Qureshi, K.A.; Musa, K.H. Antimicrobial, antioxidant and phytochemical screening of Lupin seeds (Lupinus termis Forrsk.) from Sudan. CIBTech J. Microbiol. 2017, 6, 1–8. [Google Scholar]
- Hanania, M.; Radwan, S.; Karmi, E. Extraction method and evaluation of phenolics, flavonoids, antioxidant activity, antimicrobial activity and minerals of bitter Lupinus albus in Palestine. J. Biol. Act. Prod. Nat. 2018, 8, 137–143. [Google Scholar] [CrossRef]
- Krakowska-Sieprawska, A.; Rafińska, K.; Walczak-Skierska, J.; Buszewski, B. The influence of plant material enzymatic hydrolysis and extraction conditions on the polyphenolic profiles and antioxidant activity of extracts: A green and efficient approach. Molecules 2020, 25, 2074. [Google Scholar] [CrossRef] [PubMed]
- Abebe, E.; Gugsa, G.; Ahmed, M. Review on major food-borne zoonotic bacterial pathogens. J. Trop. Med. 2020, 4674235. [Google Scholar] [CrossRef]
- Abdel-Shafi, S.; Al-Mohammadi, A.-R.; Osman, A.; Enan, G.; Abdel-Hameid, S.; Sitohy, M. Characterization and antibacterial activity of 7S and 11S globulins isolated from cowpea seed protein. Molecules 2019, 24, 1082. [Google Scholar] [CrossRef]
- Hancock, R.E. Mechanisms of action of newer antibiotics for Gram-positive pathogens. Lancet Infect. Dis. 2005, 5, 209–218. [Google Scholar] [CrossRef] [PubMed]
- Osman, A.; Enan, G.; Al-Mohammadi, A.-R.; Abdel-Shafi, S.; Abdel-Hameid, S.; Sitohy, M.Z.; El-Gazzar, N. Antibacterial peptides produced by Alcalase from cowpea seed proteins. Antibiotics 2021, 10, 870. [Google Scholar] [CrossRef]
- Johnson, E.A.; Brekke, C. Functional properties of acylated pea protein isolates. J. Food Sci. 1983, 48, 722–725. [Google Scholar] [CrossRef]
- Laemmli, U.K. Cleavage of structural proteins during the assembly of the head of bacteriophage T4. Nature 1970, 227, 680–685. [Google Scholar] [CrossRef] [PubMed]
- Evans, R.W.; Williams, J. The electrophoresis of transferrins in urea/polyacrylamide gels. Biochem. J. 1980, 189, 541. [Google Scholar] [CrossRef] [PubMed]
- Chobert, J.-M.; Touati, A.; Bertrand-Harb, C.; Dalgalarrondo, M.; Nicolas, M.-G.; Haertle, T. In vitro proteolysis and functional properties of reductively alkylated β-casein derivatives. J. Dairy Res. 1991, 58, 285–298. [Google Scholar] [CrossRef]
- Souillac, P.O.; Middaugh, C.R.; Rytting, J.H. Investigation of protein/carbohydrate interactions in the dried state. 2. Diffuse reflectance FTIR studies. Int. J. Pharm. 2002, 235, 207–218. [Google Scholar] [CrossRef]
- Singleton, V.L.; Rossi, J.A. Colorimetry of total phenolics with phosphomolybdic-phosphotungstic acid reagents. Am. J. Enol. Vitic. 1965, 16, 144–158. [Google Scholar]
- Ordonez, A.; Gomez, J.; Vattuone, M. Antioxidant activities of Sechium edule (Jacq.) Swartz extracts. Food Chem. 2006, 97, 452–458. [Google Scholar] [CrossRef]
- Nanda, A.; Saravanan, M. Biosynthesis of silver nanoparticles from Staphylococcus aureus and its antimicrobial activity against MRSA and MRSE. Nanomed. Nanotechnol. Biol. Med. 2009, 5, 452–456. [Google Scholar] [CrossRef] [PubMed]
- Bauer, A. Antibiotic susceptibility testing by a standardized single disc method. Am. J. Clin. Pathol. 1966, 45, 149–158. [Google Scholar] [CrossRef]
- Mojsoska, B.; Carretero, G.; Larsen, S.; Mateiu, R.V.; Jenssen, H. Peptoids successfully inhibit the growth of gram negative E. coli causing substantial membrane damage. Sci. Rep. 2017, 7, 42332. [Google Scholar] [CrossRef]
Disclaimer/Publisher’s Note: The statements, opinions and data contained in all publications are solely those of the individual author(s) and contributor(s) and not of MDPI and/or the editor(s). MDPI and/or the editor(s) disclaim responsibility for any injury to people or property resulting from any ideas, methods, instructions or products referred to in the content. |
© 2022 by the authors. Licensee MDPI, Basel, Switzerland. This article is an open access article distributed under the terms and conditions of the Creative Commons Attribution (CC BY) license (https://creativecommons.org/licenses/by/4.0/).