Article

Reaction Mechanism for the Removal of NOx by Wet Scrubbing Using Urea Solution: Determination of Main and Side Reaction Paths

1
School of Environment and Architecture, University of Shanghai for Science and Technology, Shanghai 200093, China
2
School of Environmental & Chemical Engineering, Shanghai University, Shanghai 200444, China
3
Institute of Engineering Technology, Sinopec Catalyst Co., Ltd., Beijing 101111, China
*
Authors to whom correspondence should be addressed.
Molecules 2023, 28(1), 162; https://doi.org/10.3390/molecules28010162
Submission received: 24 November 2022 / Revised: 18 December 2022 / Accepted: 20 December 2022 / Published: 25 December 2022

Abstract

:
Secondary problems, such as the occurrence of side reactions and the accumulation of by-products, are a major challenge in the application of wet denitrification technology through urea solution. We revealed the formation mechanism of urea nitrate and clarified the main and side reaction paths and key intermediates of denitrification. Urea nitrate would be separated from urea absorption solution only when the concentration product of [urea], [H+] and [NO3] was greater than 0.87~1.22 mol3/L3. The effects of the urea concentration (5–20%) and reaction temperature (30–70 °C) on the denitrification efficiency could be ignored. Improving the oxidation degree of the flue gas promoted the removal of nitrogen oxides. The alkaline condition was beneficial to the dissolution process, while the acidic condition was beneficial to the reaction process. As a whole, the alkaline condition was the preferred process parameter. The research results could guide the optimization of process conditions in theory, improve the operation efficiency of the denitrification reactor and avoid the occurrence of side reactions.

1. Introduction

Denitration at low temperatures is a common demand area for air pollution control, such as in the catalyst industry and the nitric acid industry [1,2,3,4]. Due to the low temperature and high moisture content of the flue gas in such industries, the selective catalytic reduction (SCR) technology that is widely used in the power industry is difficult to apply in this field [5,6,7]. Wet denitration technologies are commonly adopted in this field, such as alkali absorption and urea absorption [8,9,10]. As urea is reducible and easy to cause to react with nitrite to generate nitrogen, a number of technologies and research reports related to denitrification using the urea absorption method have been investigated [11,12,13,14,15]. In particular, there have been many research reports on simultaneous desulfurization and denitrification using urea, which can even reach a higher level of desulfurization and denitrification at the same time [11,12]. Another key technology for the successful application of urea absorption denitrification is the use of a high gravity reactor. The high-gravity reactor is essentially composed of a rotor and a stator, rotating at high speed through a coaxial rotor. Under the action of shear, the gas phase is broken into a large number of tiny bubbles so as to achieve an efficient gas-liquid contact reaction [16]. The high-gravity reactor has good applications in the fields of separation enhancement, nanoparticle preparation and synthesis, and SO2 removal [17,18]. A complete set of technology and equipment for nitrogen oxide removal and dust removal has been developed in China. This technology has achieved good results in the field of low-temperature denitration in the petrochemical industry and achieved the integration goal of high-efficiency denitrification, dust removal and desulfurization.
However, during the practical application of this technology, a series of secondary problems have emerged with the extension of the service time. The composition of calcined tail gas is unstable and contains catalyst dust because of the difference in the formula of hydrogenation catalyst. In addition, the denitrification process of tail gas is accompanied by side reactions such as urea hydrolysis, the formation of nitric acid and urea nitrate, resulting in a gradual reduction of the denitration capacity of urea absorption solution or even inability to use. At the same time, urea nitrate, as an energetic substance, has potential safety hazards. The successful solution to this problem would overcome an important problem that restricts environmental protection and up-to-standard production in the catalyst industry. It provides an important guarantee for the popularization and application of urea absorption denitrification technology in high-gravity beds.
Most of the research focuses on the adjustment of process parameters and the selection of oxidation additives. The research on the reaction mechanism of nitrogen oxide absorption by urea solution, especially in the occurrence of side reactions, is relatively lacking. For the mechanism of denitrification through the urea absorption method, on the main reaction path, a relatively consistent view has been formed on the key path, that nitrogen oxides are absorbed into nitrous acid, and then react with urea to generate N2 and CO2 [11,12,19]. The work of Lasalle et al. further gave the kinetic results of the reaction [19]. However, due to the limited application of this reaction and there being few studies of it, no detailed research into the mechanism of the side reaction, such as investigating the accumulation of nitrate or the impact of pH and nitrogen oxides on the side reaction, has been retrieved. In consideration of the lack of research in this field abroad, it is of great significance to study the side reaction of denitrification by the urea absorption method for the application of this technology.
Since urea nitrate has strong explosiveness and is also one of the precursors of explosive synthesis, it has a high risk [20,21,22]. Therefore, the formation of urea nitrate should be avoided under any circumstances. In order to avoid the production of urea nitrate in any case, such as the operation of the supergravity reactor and the disposal of the absorption liquid waste liquid, the formation path of urea nitrate was studied. Due to a large number of components in the supergravity reactor, it is necessary to eliminate them one by one when determining the conditions for the formation of urea nitrate. The workload is large, and it is difficult to efficiently determine the exact reaction mechanism. Starting from the crystal analysis of urea nitrate, we analyzed its crystal structure characteristics and preliminarily estimated the conditions for the formation of urea nitrate [23]. Whether urea nitrate was formed under different conditions was tested through experiments. Finally, the theoretical understanding of the formation of urea nitrate was formed, and the range of safe working process parameters to avoid the formation of urea nitrate was proposed. In addition, the following two issues are also studied in this paper: (1) does SO2 promote or inhibit the denitrification reaction; (2) under what conditions are nitrate by-products easy to accumulate?

2. Results and Discussion

2.1. Determination of the Boundary Conditions for the Formation of Urea Nitrate

In order to investigate the effects of the concentration of urea, H+ and NO3 on the formation of urea nitrate, a series of experiments were designed based on the structural formula of urea nitrate. In five groups of experiments, precipitation was observed in the solution, as shown in Figure 1a. After adding a certain amount of nitric acid (HNO3) into the urea solution, white crystals were formed. Combined with XRD pattern analysis, as shown in Figure 1b, the precipitated crystals were urea nitrate (JCPDS PDF #06-0332) [23].
Figure 2a shows the amount of HNO3 required for precipitation under different urea concentrations. As the concentration of urea solution increased, the amount of HNO3 required to produce urea nitrate precipitation decreased gradually. When the concentration of urea solution was 0.83 mol/L, 2.08 mol/L HNO3 was needed to form precipitation. However, when the concentration of urea solution was increased to 3.33 mol/L, HNO3 of 1.14 mol/L was added to precipitate in the solution. The following formula was obtained by linear fitting:
[ HNO 3 ] = 0.3461 · [ urea ] + 2.2159
where [HNO3] and [urea] are the concentrations of HNO3 and urea solution, respectively. Based on this mathematical relationship, it is possible to predict the HNO3 concentration required for the formation of urea nitrate precipitation under the conditions of different concentrations of urea solution, and then adjust the working conditions, such as the concentration of the absorption solution. Figure 2b shows the amount of HNO3 required for the formation of urea nitrate precipitation under different NO3 concentrations. The amount of HNO3 needed for urea nitrate precipitation reduced with the increase of NO3 concentration. Through data fitting, it can be seen that the two were in a linear relationship.
[ HNO 3 ] = 0.8019 · [ urea ] + 2.5433
Each increase of 1 mol/L of NaNO3 can reduce 1 mol/L of NO3 from other sources, that is, about 1 mol/L of HNO3 can be reduced, so the slope was closed to −1. However, since HNO3 also provided H+, the slope would be slightly larger than −1, and the fitting value was around −0.8.
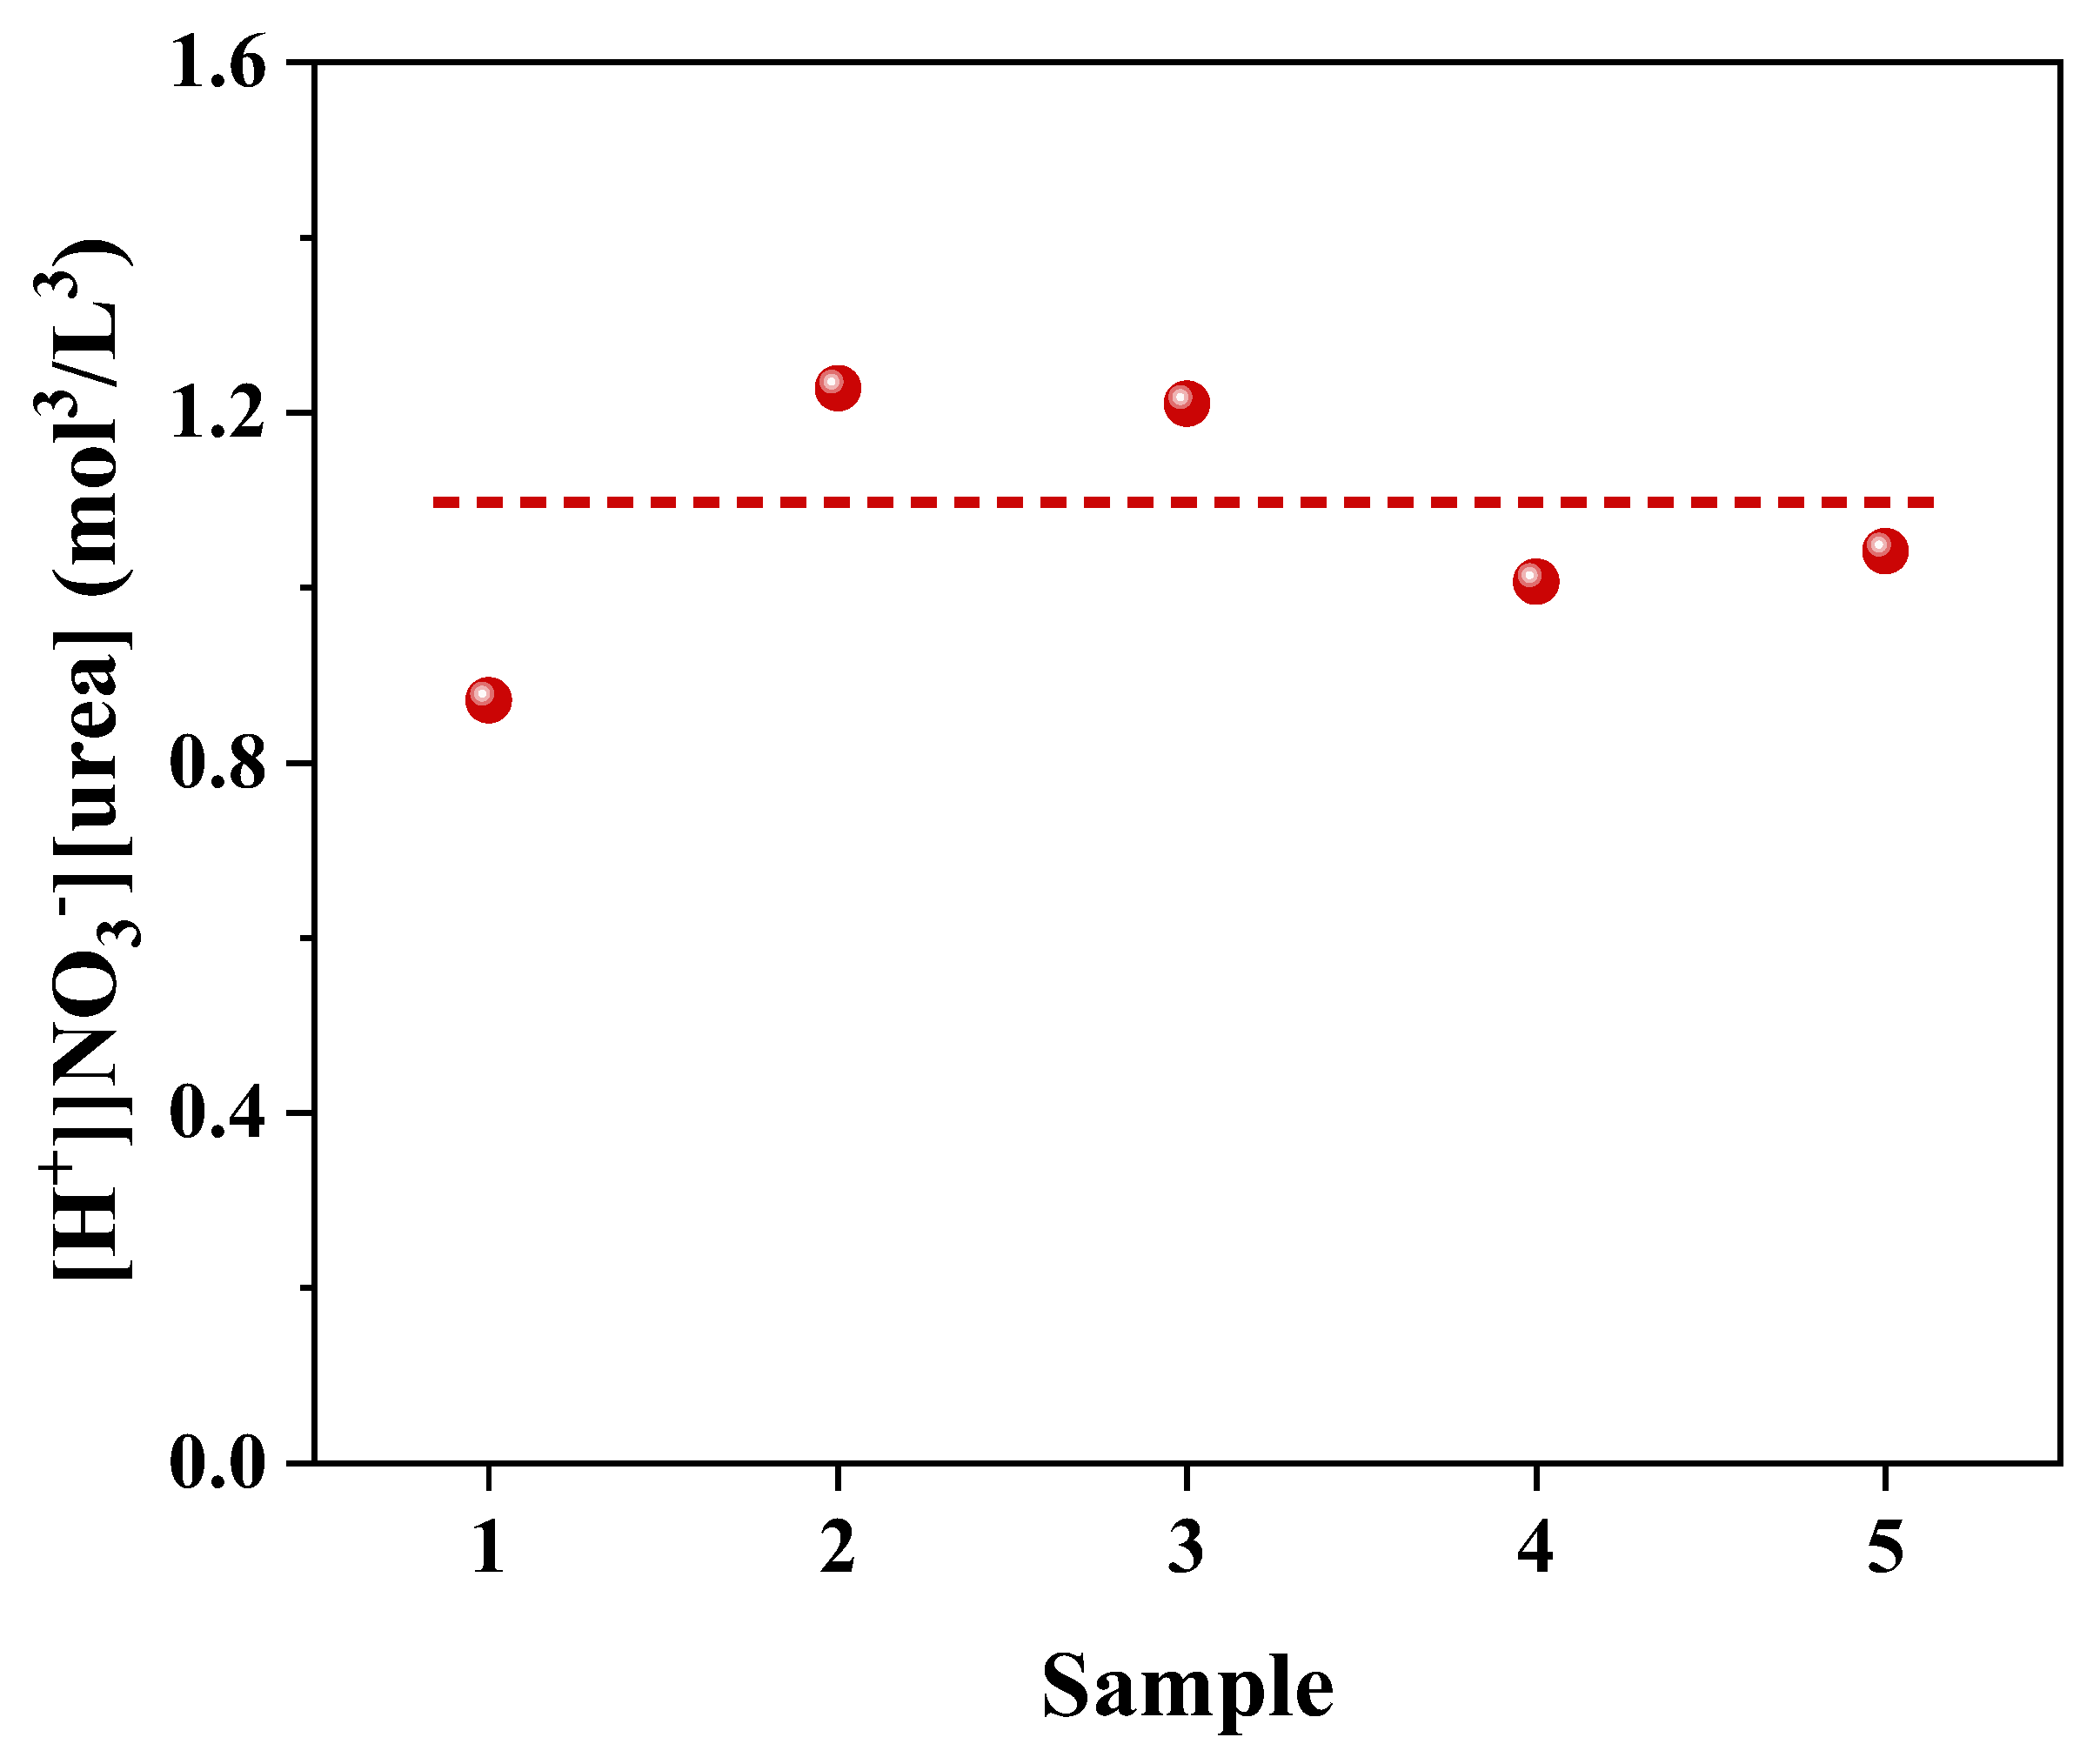
Our findings lead us to conclude that the critical sedimentation condition of urea nitrate is closely related to the concentration of urea solution, H+ and NO3. The product of [urea], [H+] and [NO3] is shown in Figure 3. It can be found that the product of the three concentrations is approximately a constant. Taking into account the above observations and the crystal structure of urea nitrate, the formation of urea nitrate requires the carbonyl protonation of urea. The formation process of urea nitrate is displayed in the following Equations (4) and (5):
CO ( NH 2 ) 2 ( aq ) + H + ( aq ) C + ( OH ) ( NH 2 ) 2 ( aq )
C + ( OH ) ( NH 2 ) 2 ( aq ) +   NO 3 ( aq ) CO ( NH 2 ) · HNO 3 ( s )
where C+(OH)(NH2)2 is the product of carbonyl protonation to the hydroxyl of urea. In this process, the concentration of C+(OH)(NH2)2 is determined by the product of [urea] and [H+], which can be obtained from its acid-base equilibrium constant (Equation (6)).
[ C + ( OH ) ( NH 2 ) 2 ] = K b · [ CO ( NH 2 ) 2 ] · [ H + ]
where Kb is the base equilibrium constant of urea. the concentration product of C+(OH)(NH2)2 and NO3 could not be higher than the solubility product of urea nitrate ( K s p ).
K s p = [ C + ( OH ) ( NH 2 ) 2 ] · [ NO 3 ]
Substituting Equation (6) into Equation (7) to obtain Equation (8).
[ CO ( NH 2 ) 2 ] · [ H + ] · [ NO 3 ] = K s p K b = K s p
Equation (8) also illustrates that the formation of urea nitrate is related to the product of [urea], [H+] and [NO3], coinciding with the observation from our experiments. These results indicate that only when the concentration product of the three solutes ([urea], [H+] and [NO3]) is high enough, it is possible to generate urea nitrate precipitation. The critical value of the concentration product, namely the solubility product K s p , is about 0.87–1.22 mol3/L3.
In addition, we verified whether adding alkali could re-dissolve urea nitrate. As described earlier, the addition of concentrated HNO3 to a concentrated urea solution resulted in urea nitrate precipitate. Whereas, when NaOH solution was added, the precipitate dissolved rapidly. This suggests that the formation of urea nitrate requires a certain pH, and that if the pH increases, the urea nitrate can be re-dissolved. Furthermore, when NaNO3 was added to the concentrated urea aqueous solution, no precipitation was generated, regardless of the addition. It indicates that H+ is one of the necessary factors for the formation of urea nitrate. In other words, the formation of urea nitrate requires the simultaneous presence of high concentrations of urea, H+ and NO3. From the results we have obtained, one can conclude that, (1) if the formation of urea nitrate is observed in the supergravity urea absorption device, it means that the concentration of urea, H+ or NO3 is too high; (2) even if urea nitrate is formed, it can be re-dissolved as long as the pH of the absorption solution is increased; (3) the implication is that the formation of urea nitrate is not one of the main side reactions under normal working conditions.

2.2. Reaction Mechanism for NOx Removal

In contrast to the alkali absorption of NOx, the absorption path of NOx using the urea reduction method is more complex, and no systematic study concerning the side reaction process of the urea reduction method has been published. The main and side reactions of the urea reduction method were systematically investigated. For the main reaction, it is necessary to confirm the flow transition paths of various nitrogen-containing substances in the chemical grid, so as to clarify the main reaction process. In particular, it’s important to confirm whether the optimal reaction range for the dissolution of NOx and subsequent reaction with urea is in the same pH range. For the side reactions, gas-phase analysis and liquid-phase analysis were combined to track the gas-liquid two-phase changes in the process of the urea solution absorbing NOx, thereby further exploring the side reaction mechanism, inhibiting or cutting off the side reaction paths, improving the efficiency of NOx removal, and reducing the generation of by-products.

2.2.1. Concentration of Urea Solution

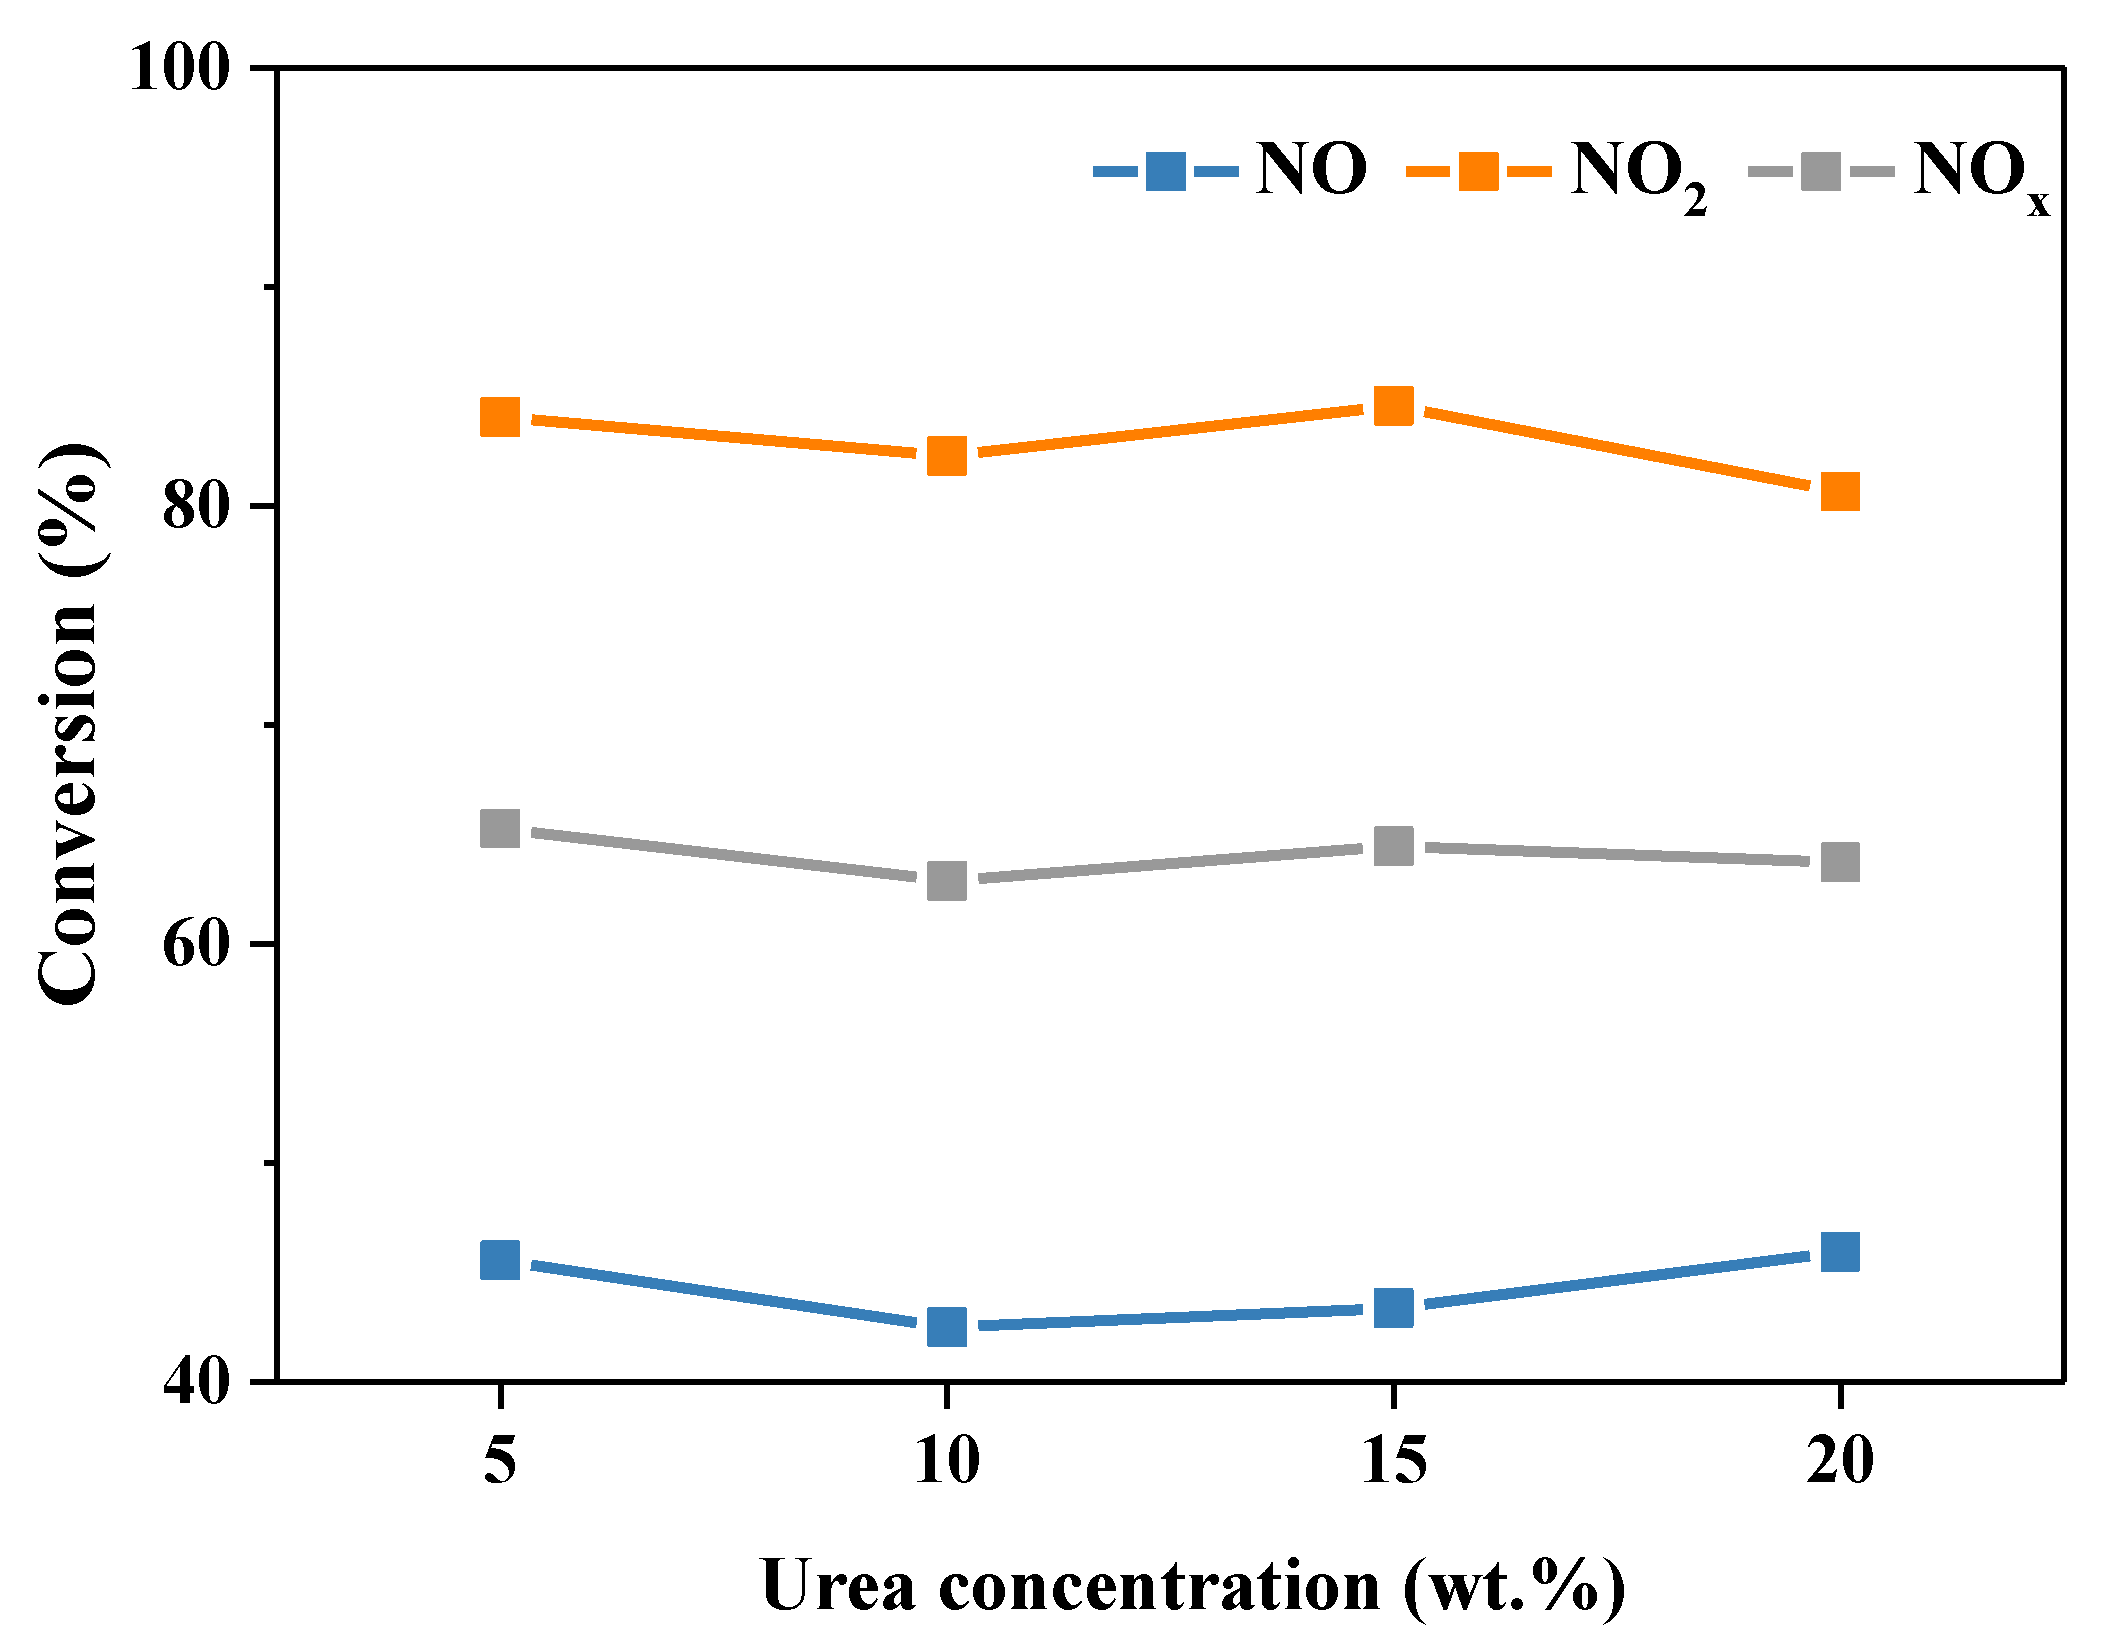
The concentration of urea solution is one of the influencing factors of the NOx removal process [11], thus the influence of the urea concentration on the denitration process was investigated. Firstly, in order to eliminate the change in pH value of the absorption solution caused by the change of the urea concentration, the pH value of the urea solution with different concentrations was analyzed. As listed in Table S1, the pH value of the urea solution increased slightly from 7.06 to 7.58 with the increase of the urea concentration from 5 wt.% to 20 wt.%, showing a weak alkaline. This indicates that the urea concentration has no remarkable effect on the pH value of the absorption solution. Figure S1 shows the curve of NO, NO2 and NOx conversion rates over time with different urea concentrations. It can be seen that the reaction began to stabilize after 30 min, so each condition in the later experiment was stable for 60 min. As shown in Figure 4, the urea concentration exhibited no notable effect on NOx removal efficiency when it was higher than 5 wt.%. The conversion of NO, NO2 and NOx was around 43%, 85% and 65%, respectively. This is because the urea concentration affects the removal of NOx from both physical properties and chemical reactions. From the point of view of the chemical reaction, increasing the concentration of urea can accelerate the denitration reaction. However, in terms of physical properties, with the increase of the urea concentration, the viscosity of the urea solution increases, and the diffusion rate and solubility of NOx in the absorption solution decrease [9]. Herein, combining the actual operating conditions and experimental results, the 15 wt.% urea solution was employed in the latter.

2.2.2. Reaction Temperature

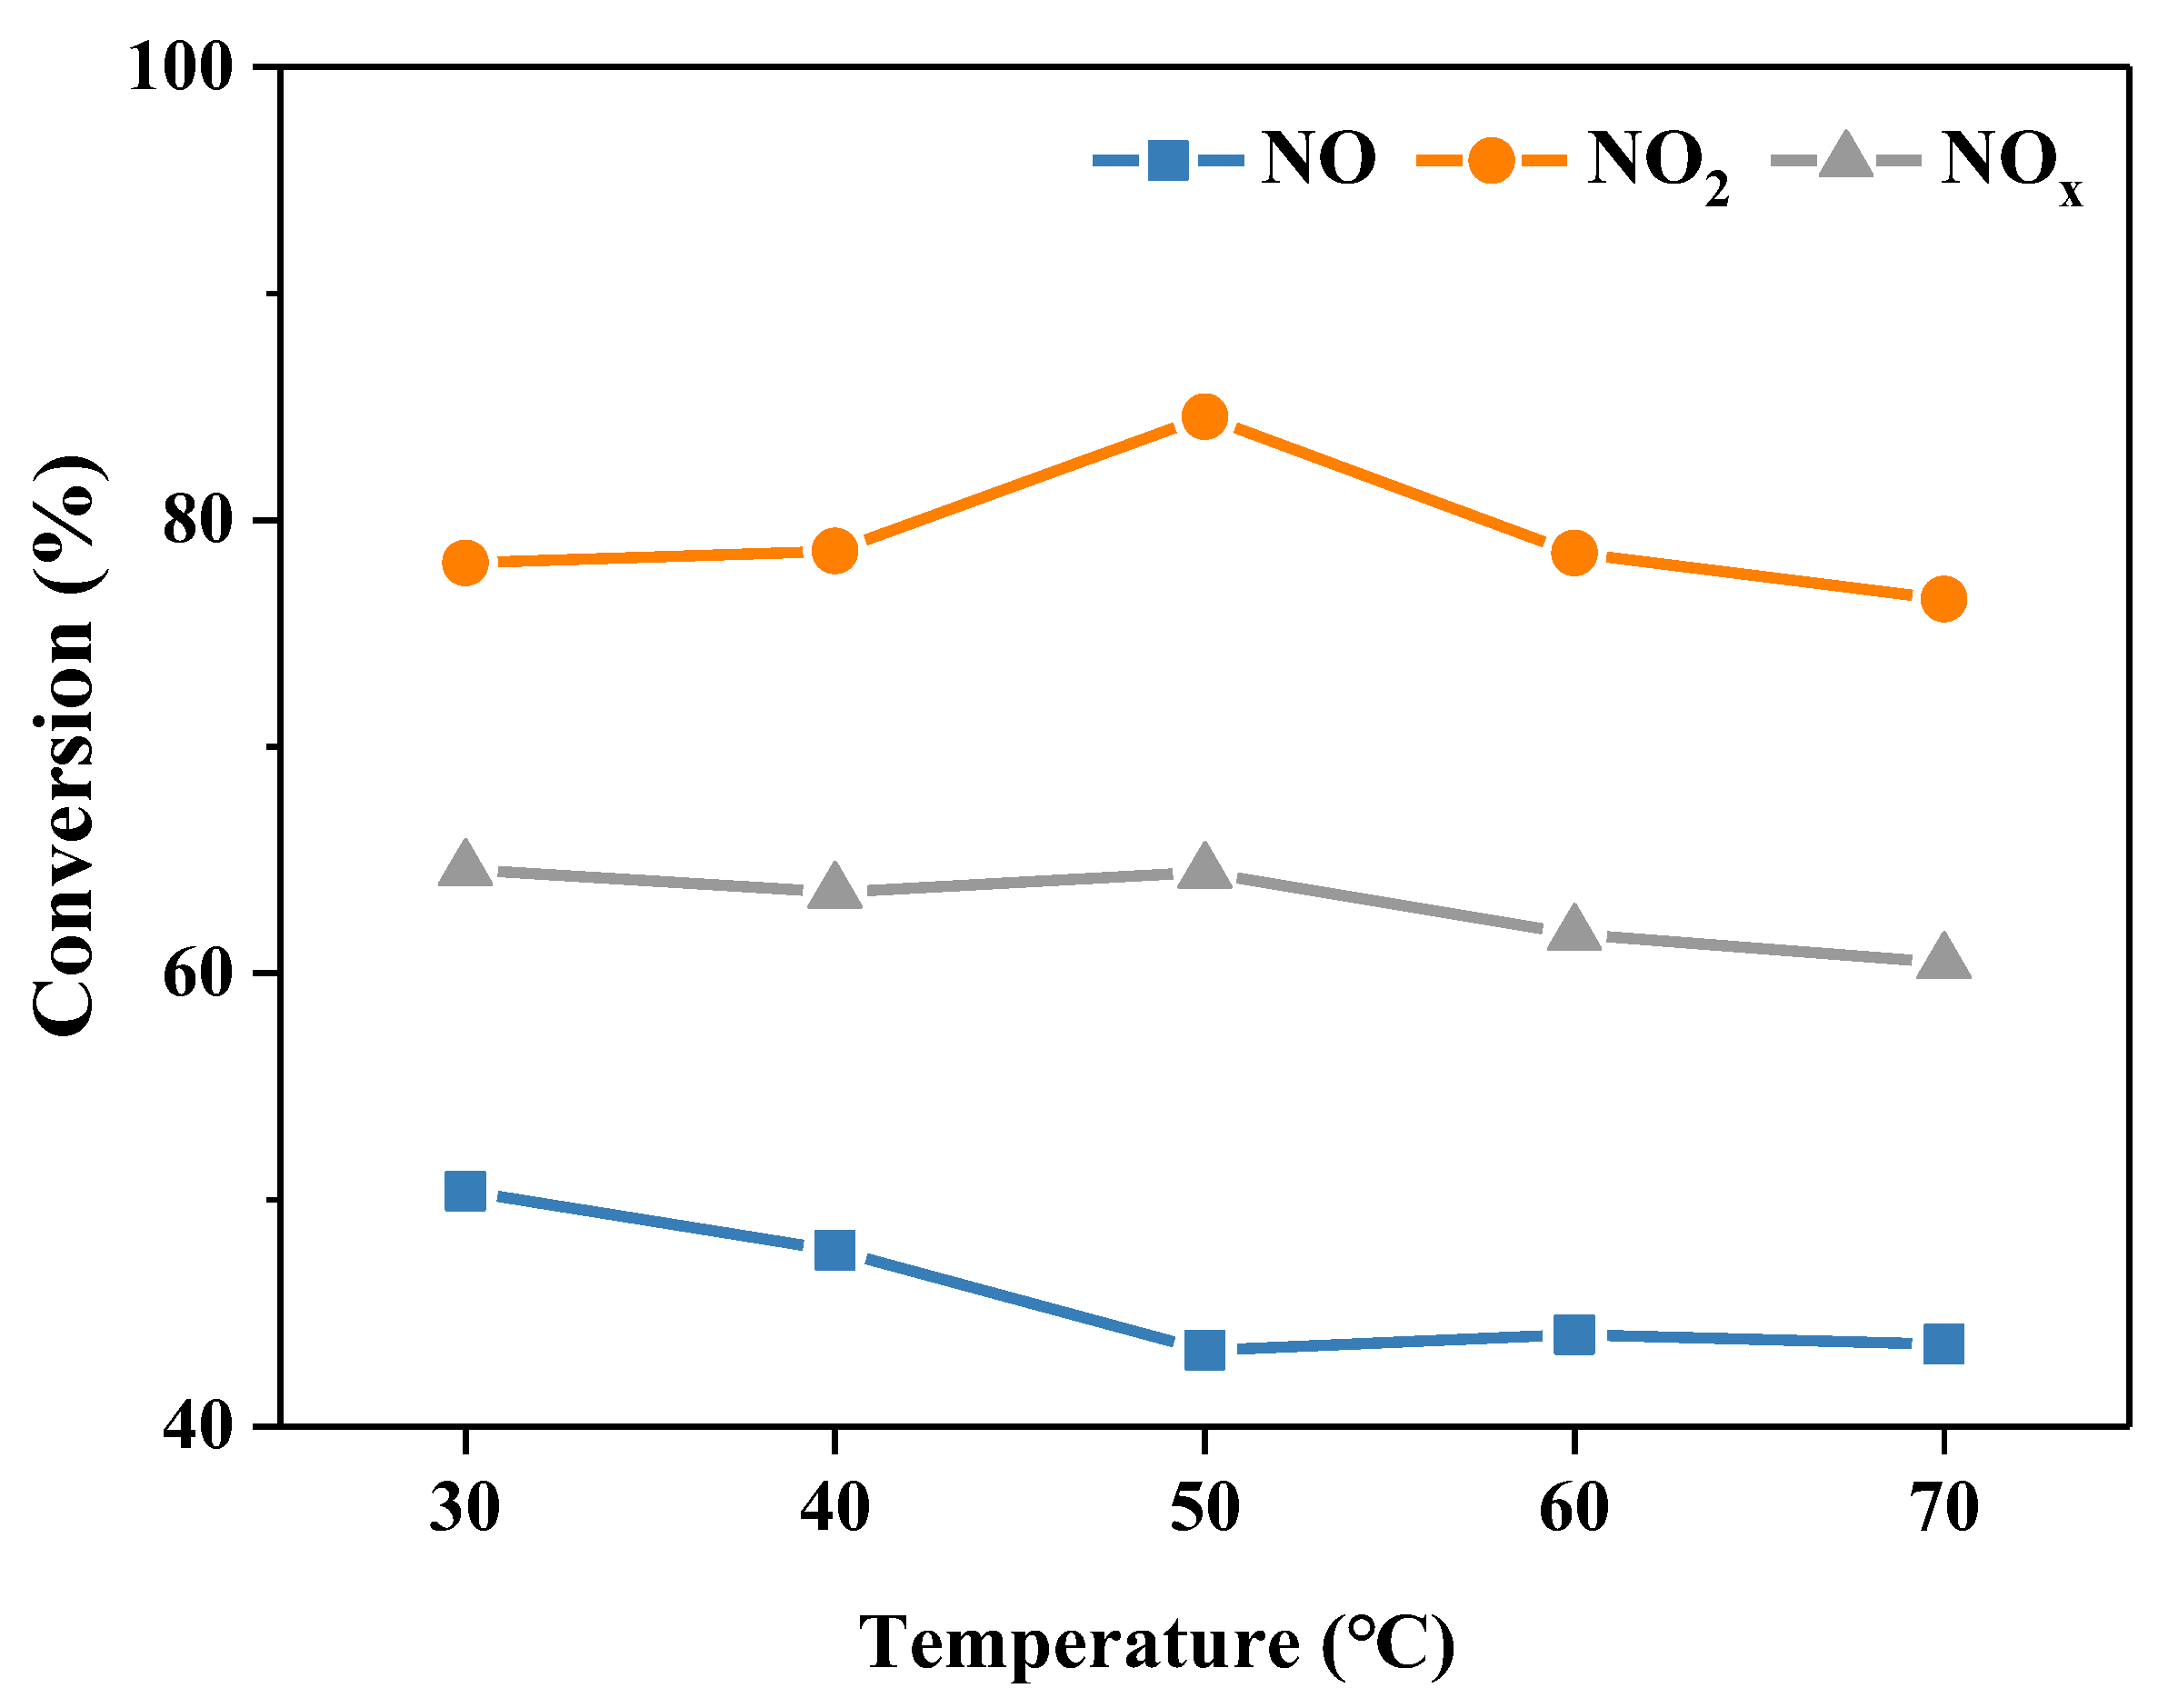
The diffusion, dissolution and reaction characteristics of the reactants or intermediate species in the urea absorption solution are closely related to the reaction temperature. Therefore, the denitration reaction was conducted at different temperatures. As shown in Figure 5, the NO conversion declined slightly, while the NO2 conversion increased first and then dropped in the temperature range of 30–70 °C. Taken together, the NOx conversion remained stable in the range of 30–50 °C, and it decreased at higher temperatures (50–70 °C). As the reaction temperature increases, on the one hand, the solubility of NO and NO2 in the solution decreases, and the decomposition rate or the key intermediate HNO2 accelerates, which are conducive to the absorption and removal of NO and NO2. On the other hand, the NO oxidation rate increases, and the hydrolysis of the urea gradually strengthens, which are conducive to the absorption and removal of NOx. Hence, the influence of reaction temperature on NOx removal is the result of the comprehensive effects of diffusion, dissolution and reaction characteristics. When the reaction temperature exceeds 50 °C, various side reactions and negative effects dominate, leading to the reduction of NOx removal efficiency.

2.2.3. Oxidation Degree of NOx

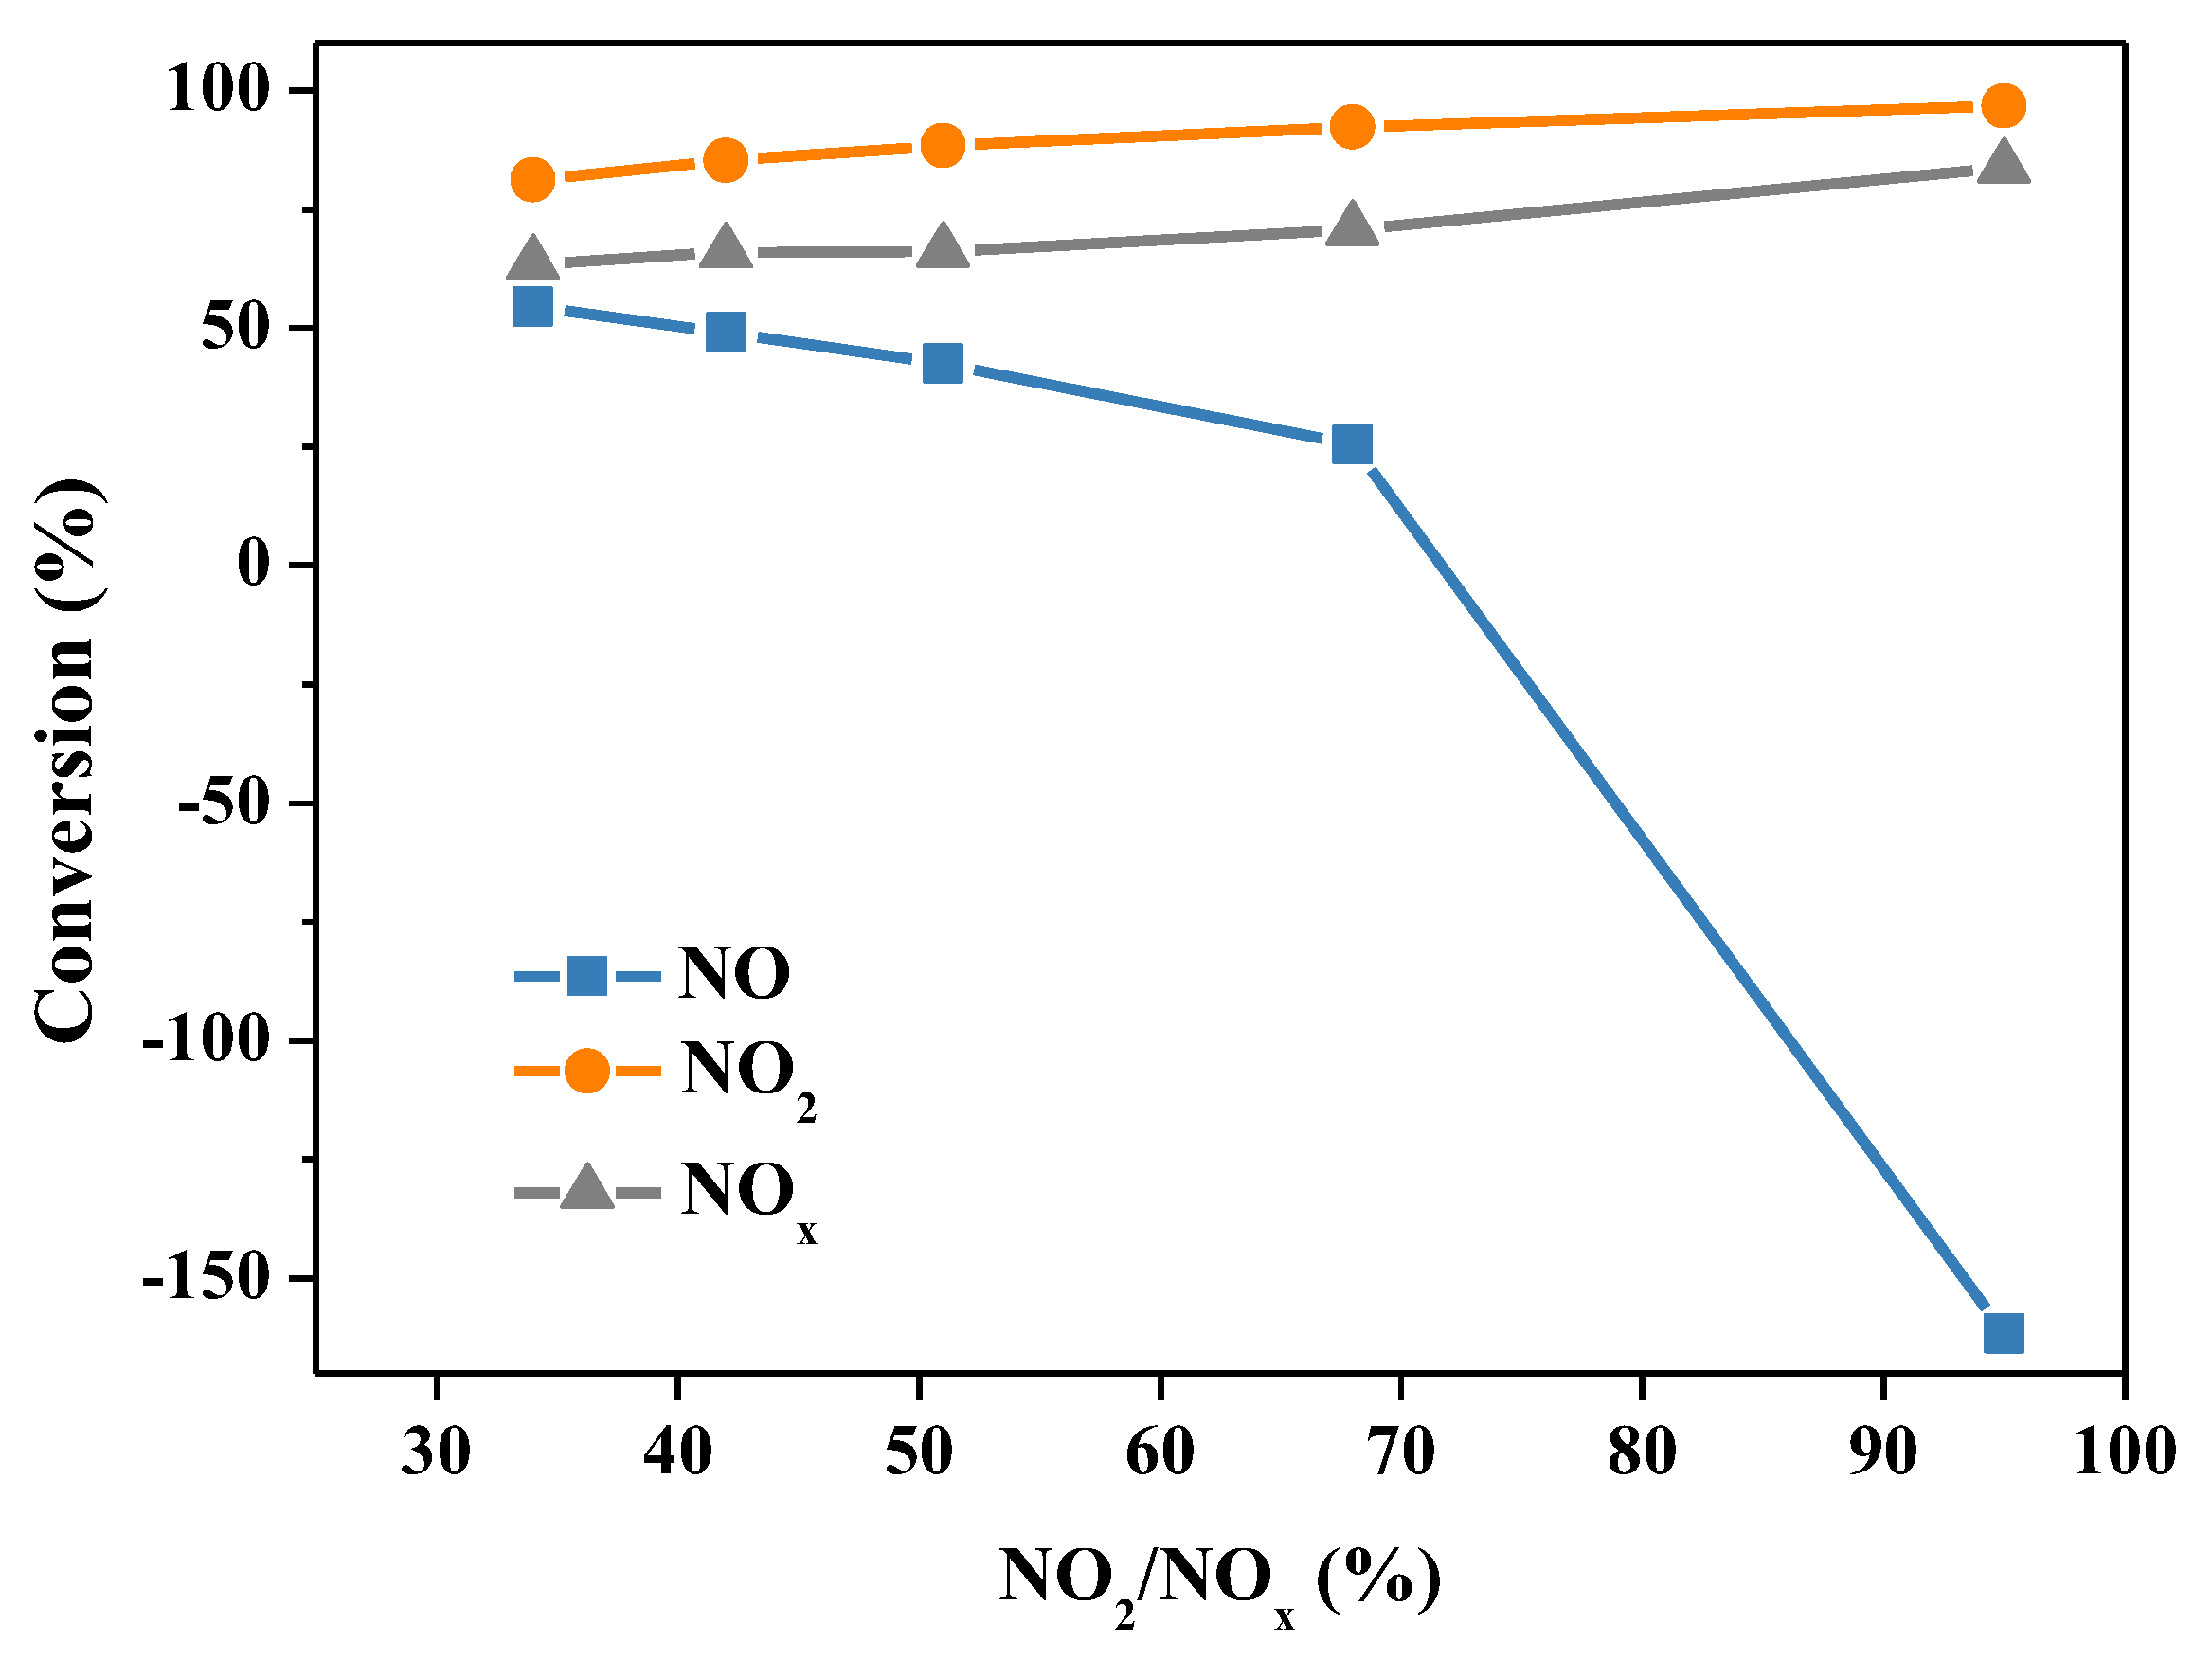
Since NO is hardly soluble in water, the dissolution of NOx in water can be divided into situations: one is the absorption of NO2, and the other is the synergistic absorption of NO and NO2 [24]. In the process of liquid-phase absorption of NOx, NOx in the gas phase must be dissolved in the absorption solution before they react with urea. Accordingly, the oxidation degree of NOx shows a significant impact on the final absorption efficiency of NOx. The influence of the oxidation degree of NOx (NO2/NOx) on denitrification through the urea absorption method was investigated, and the results are shown in Figure 6. The NOx removal efficiency improved with the increase of the NOx oxidation degree in the gas phase, that is, the higher the NO2 content was in the gas phase, the better the NOx absorption efficiency was. With the oxidation degree of NOx increasing from 30% to 95%, the NO2 conversion and NOx conversion increased gradually. Whereas, the NO conversion decreased, and when the oxidation degree of NOx was higher than 50%, the NO conversion dropped markedly. Among them, when the oxidation degree of NOx was 95%, the NO2 conversion and NOx conversion were as high as 97% and 84%, respectively, but the NO conversion dropped to a negative value of −162%. These results indicate that a great quantity of NO is generated in the denitrification reaction system of the urea solution. This is because, when the NO2 in the gas phase is relatively excessive, a great deal of HNO2 is unstable in the liquid phase, which can easily decompose and regenerate NO [25]. As shown in the reaction formula (9), it is generally considered that NO2 and H2O react to generate NO, and the essence of NO generation is the decomposition of HNO2. From the results we have obtained, one can conclude that a high NOx oxidation degree is conducive to the absorption and removal of NOx using a urea solution.
3 NO 2 + H 2 O NO + 2 HNO 3

2.2.4. Initial pH of Urea Solution

The pH value of the absorption solution is one of the main factors affecting denitration efficiency. The pH value of a 15 wt.% urea solution is 7.54, which is alkalescent and close to neutral. HCl and NaOH were adopted to adjust the pH value of the absorption solution. On the one hand, it is an effect of the pH value on the gas dissolution process [11,12]. Nitrogen oxides are easy to dissolve under alkaline conditions. The higher the pH value is, the more conducive the solution is to the dissolution of NO2 in NOx, which promotes the dissolution of NOx and the reaction rate. On the other hand, urea is easily activated under acidic conditions [19]. With the reduction of the pH value, the concentration of H+ elevates. H+ exhibits a considerable promoting effect on the hydrolysis of the urea solution. The hydrolysis of urea produces ammonium carbamate (NH2COONH4). NH2COONH4 is easier to make react with HNO2, enhancing the reaction rate, thereby improving the removal efficiency. However, when the pH value of the absorption solution is too low, not only is the dissolution of NOx is inhibited, but the decomposition rate of HNO2 is also accelerated, which is not beneficial to the absorption and removal of NOx.
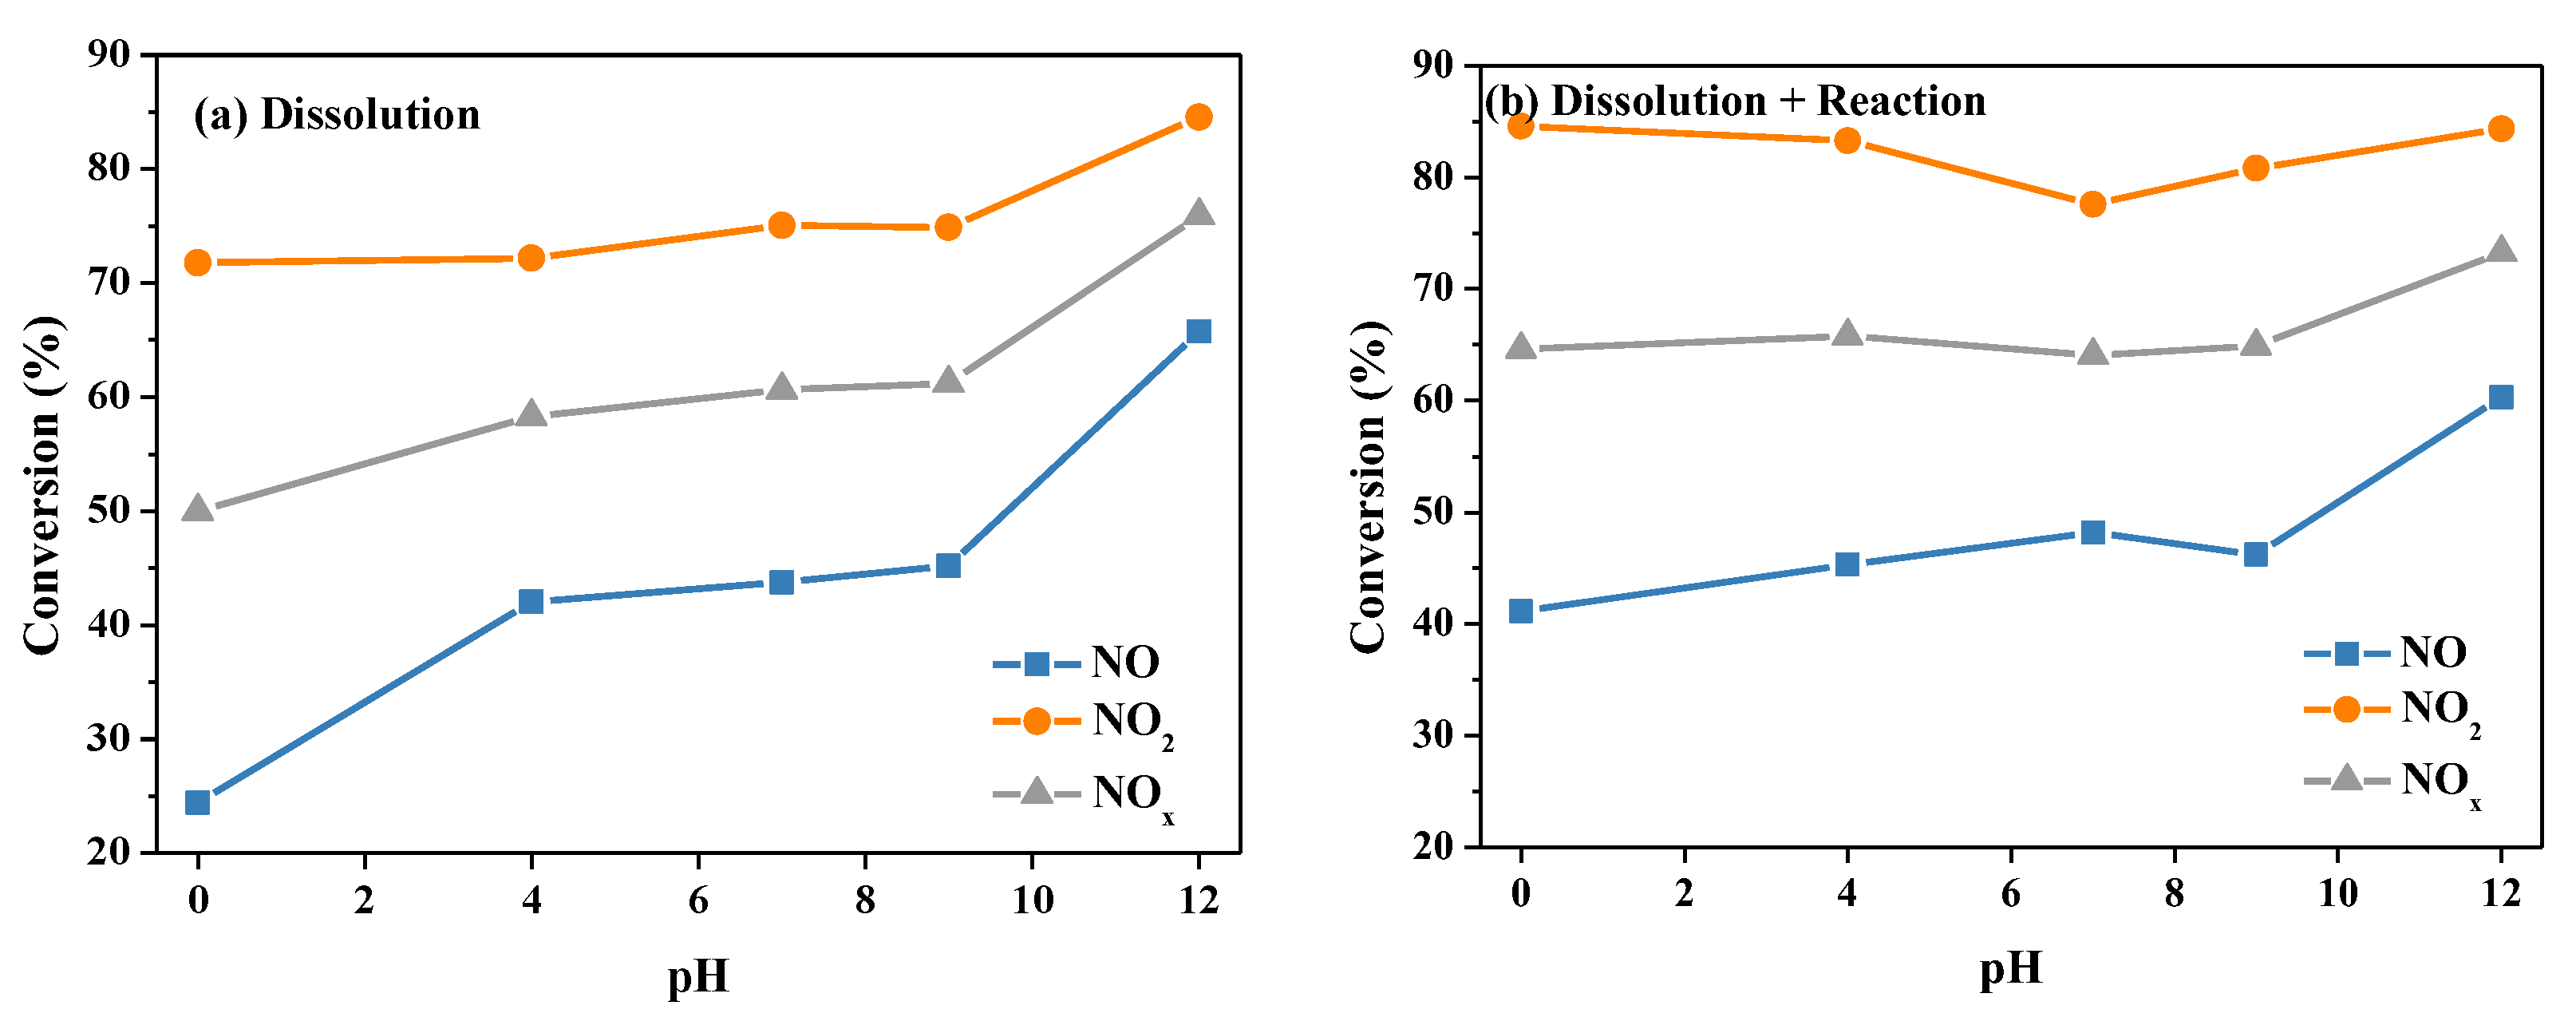
Taking into account the complexity of the influence of pH on the denitration reaction through urea absorption, the denitration process was divided into two processes in the experimental design: the dissolution process and the reaction process. The complete absorption denitration process was expressed as (Dissolution + Reaction). In the Dissolution process, the simulated gas was introduced into the aqueous solution, and the absorption of the gas was monitored online via the flue gas analyzer. In the Reaction process, sodium nitrite (NaNO2) was added to the urea solution, and N2 was used as a carrier gas to analyze the gas components generated online. In the Dissolution + Reaction process, the simulated reaction gas was injected into the urea solution, and the composition changes in the gas phase were measured online. The removal efficiencies of NO, NO2 and NOx in the Dissolution process and the Dissolution + Reaction process at different pH values are displayed in Figure 7. As shown in Figure 7a, for the dissolution process, with the increase of the pH value of the aqueous solution, the dissolution efficiency of NO was significantly improved. The dissolution efficiency of NO2 was also gradually enhanced, which was comprehensively reflected in the improvement of the NOx dissolution efficiency. For the Dissolution + Reaction process, as displayed in Figure 7b, the conversions of NO and NOx increased in the pH range of 0–12. The NO2 conversion declined in the acidic range but accelerated in the alkaline, and pH = 7 was the turning point. The behavior of the NO, NO2 and NOx removal efficiencies makes us conclude that alkaline conditions are beneficial to gas-phase dissolution; nevertheless, acidic conditions are good for liquid-phase reaction.
The pH changes of the aqueous solution and urea solution before/after the Dissolution process and Dissolution + Reaction process are summarized in Table 1 and Table 2. After the dissolution and absorption denitrification reaction, the pH of the solution dropped to different degrees. Among them, the pH value of the aqueous solution in the range of 7–10 declined markedly after the dissolution process. This is mainly due to the formation of HNO2 and HNO3 after NO and NO2 are dissolved in an aqueous solution, which leads to a decrease in the pH value after the Dissolution process. The concentration of NH4+, NO2 and NO3 ions in the aqueous solution and urea solution after the Dissolution process and Dissolution + Reaction process are listed in Table 3. As for the Dissolution process, with the increase of the pH value of the aqueous solution, the concentration of NO2 increased from 3.44 to 6.72 mg/L. When the pH value was 12, the NO2 concentration increased significantly to 69.34 mg/L. Accordingly, the concentration of NO3 showed a downward trend on the whole. This results from NO2 being decomposed into NO3 at an accelerated rate under acidic conditions. When the pH is at a higher level, e.g., pH = 12, NO2 can be stably stored in the solution. When urea was added into the aqueous solution, the denitration reaction occurred, and the total accumulation of NO2 and NO3 declined. On the basis of the principle of mass conservation of the N element, it was speculated that part of the NOx to be removed would react with urea to generate N2.
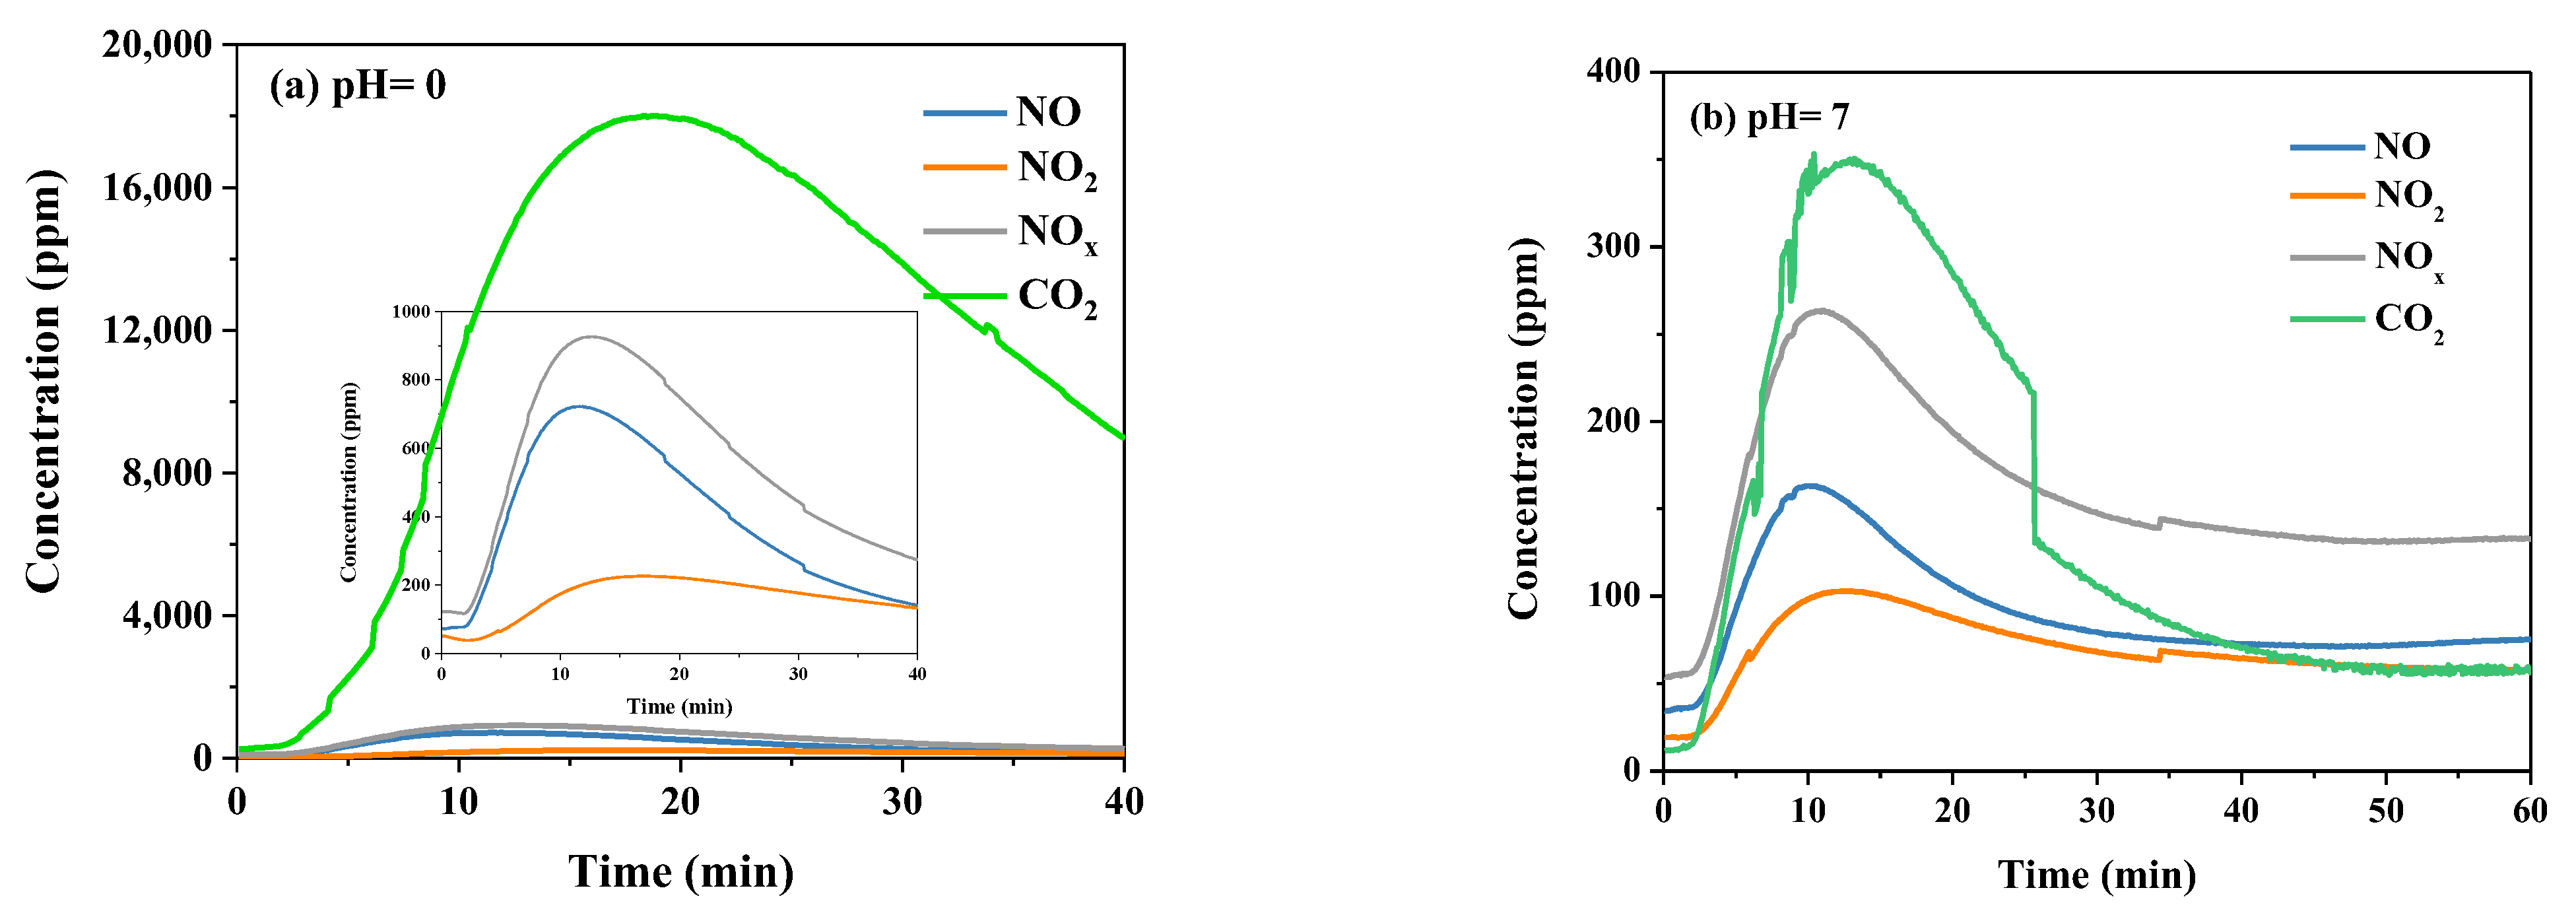
Furthermore, the Reaction process was also investigated under different pH values. The specific experimental operation was to add NaNO2 into the urea solution and use N2 as the carrier gas. Nitrite (HNO2) is the key intermediate product during the denitrification reaction through the urea solution. Hence, the reaction process was simulated via adding NaNO2. When NaNO2 was added to the urea solution with pH = 0, a large amount of reddish-brown gas was produced immediately, and then the gas disappeared. HNO2 only exists stably in a dilute aqueous solution. In a concentrated nitrite solution, nitrite will undergo disproportionation and decomposition reactions at the same time, generating the disproportionation products HNO3 and NO, as well as the decomposition products N2O3. N2O3 will decompose into NO and NO2 rapidly. Therefore, the reddish-brown gas should be NO2 at the beginning of the reaction process. The NO and NO2 produced in the Reaction process could reach 720 and 220 ppm, respectively, as shown in Figure 8a, and the corresponding CO2 could reach ppm. No reddish-brown gas appeared when NaNO2 was mixed with the urea solution with pH = 7. As shown in Figure 8b, the generation amounts of NO, NO2 and CO2 were 160, 100 and 350 ppm, respectively. There was a remarkable difference in CO2 production between the two groups’ reactions. These results indicate that HNO2 is the key intermediate, and the following reactions occur:
CO ( NH 2 ) 2 + 2 HNO 2 2 N 2 + CO 2 + 3 H 2 O

2.3. Simultaneous Removal of NOx and SO2

Urea is a strong reducing agent with weak alkalinity. Its aqueous solution has a high removal efficiency of SO2. The desulfurization product is ammonium sulfate, which avoids the generation of large quantities of desulfurization gypsum and the occupation of land. Does SO2 promote or inhibit the denitrification reaction in the absorption solution? From the current literature, there is no unified conclusion. Figure 9 shows the influence of 250, 600 and 1000 ppm SO2 on the denitrification efficiency of the urea solution. The SO2 removal rate could be maintained above 99% in the wake of the variety of SO2 concentrations. SO2 inhibited the denitrification reaction. The conversion of NO, NO2 and NOx declined slightly. This is due to the small difference between the electrode potential of NO and that of SO2, which compete with each other when they coexist. Therefore, when the initial concentration of SO2 is increased, the probability of NO contacting with oxidant will inevitably be reduced, leading to the decrease of the NO removal rate. The ion concentration and pH value of the solution after the reaction process are displayed in Table 4. As the concentration of SO2 increased from 0 to 1000 ppm, the pH value of the urea absorption solution dropped, and the accumulated NO3 and SO42− increased. After absorption, SO2 exists in the stable form of SO42−, and SO32− is not detected in the absorption solution. In terms of the denitrification and desulfurization, the desulfurization efficiency of the urea solution is above 99%, and SO2 will slightly inhibit denitrification. In general, a urea solution can realize simultaneous desulfurization and denitrification.

3. Experimental

The wet denitration of urea solution was evaluated in the laboratory’s self-made absorption equipment. The absorption solution was urea solution with a certain concentration, and the filling volume of the absorption bottle was 150 mL. In order to increase the contact area and enhance mass transfer of the gas-liquid two-phase, metal Pall rings with a diameter of 10 mm were filled into the absorption bottle. The temperature of the urea absorption solution was controlled by a thermostat water bath. The simulated flue gas was used in the experiment, and its specific components were: 500–1500 ppm NO (when used), 500–1500 ppm NO2 (when used), 100–1000 ppm SO2 (when used), 10 vol.% O2, N2 used as the balance gas, and a total gas flow rate of 100 mL/min. The concentrations of each component of the inlet and outlet gases were monitored online by a Fourier transform infrared (FTIR) spectrometer (Gasmet DX-4000). Each reaction was carried out for 70 min to ensure that the reaction reached equilibrium. The removal efficiency of NO/NO2/NOx was calculated using the following equation [26]:
N   conversion = C N i n C N o u t C N i n × 100 %
where N refers to NO/NO2/NOx, and NOx is the sum of NO and NO2. Cin and Cout are the concentrations at the inlet and outlet, respectively.
The ion concentrations in the urea absorption solution were obtained with an ion chromatography system (761 Compact IC, Metrohm, Zurich, Switzerland) equipped with a conductivity detector. The C4 cation column and Metrosep A Supp 5 anion separation column were applied to separate anions (i.e., NO2, NO3, SO32− and SO42−) and cations (i.e., NH4+) in the solution. In order to protect the chromatographic column, each sample needed to be filtered to remove organic matter (i.e., urea) before testing. The pH value of the solution was analyzed using a pH meter (FE28-Standard, Mettler Toledo, Zurich, Switzerland). The urea concentration was characterized on a spectrophotometer (T6-1650E, PGENERAL, Beijing, China), and the wavelength of the light source was 420 nm.

4. Conclusions

The boundary conditions for the formation of urea nitrate in urea solution were determined, and the main and side reaction paths of the urea absorption denitrification process were revealed in this study. The product of [urea], [H+] and [NO3] concentrations was the critical condition for the formation of urea nitrate. Only when the product of the three concentrations in the absorption solution was higher than 0.87~1.22 mol3/L3 would the urea nitrate precipitation be released, which could preliminarily eliminate the generation of urea nitrate precipitation in the actual operation of the urea absorption unit. The urea concentration exhibited no considerable influence on denitrification in the range of 5–20 wt.%. The influence of the reaction temperature on NOx removal was a comprehensive result, and 50 °C was a slightly preferred reaction temperature. The higher oxidation degree of the flue gas was conducive to the removal of NOx. Alkaline conditions were beneficial to the dissolution process, while acidic conditions were beneficial to the reaction process. Therefore, the complete denitration process was the comprehensive embodiment of the dissolution and reaction processes. The desulfurization efficiency of the urea solution was above 99%, and SO2 would slightly inhibit denitrification process.

Supplementary Materials

The following supporting information can be downloaded at: https://www.mdpi.com/article/10.3390/molecules28010162/s1, Figure S1: Conversion of NO, NO2 and NOx at different urea concentration: (a) 5 wt.%, (b) 10 wt.%, (c) 15 wt.% and (d) 20 wt.%; Table S1: pH value of urea solution with different concentration.

Author Contributions

Conceptualization, L.G. and K.L.; methodology, Y.L.; software, P.Y.; validation, L.G., Y.L. and P.Y.; formal analysis, Y.L.; investigation, Y.L.; resources, L.G.; data curation, P.Y.; writing—original draft preparation, L.G.; writing—review and editing, H.N.; visualization, L.G.; supervision, K.L.; project administration, L.G.; funding acquisition, L.G. All authors have read and agreed to the published version of the manuscript.

Funding

This research was funded by [National Natural Science Foundation of China] grant number [22206130].

Conflicts of Interest

The authors declare no conflict of interest.

References

  1. Forzatti, P. Present status and perspectives in de-NOx SCR catalysis. Appl. Catal. A Gen. 2001, 222, 221–236. [Google Scholar] [CrossRef]
  2. Liu, Z.M.; Woo, S.I. Recent advances in catalytic DeNOx science and technology. Catal. Rev. Sci. Eng. 2006, 48, 43–89. [Google Scholar] [CrossRef]
  3. Li, J.; Chang, H.; Ma, L.; Hao, J.; Yang, R.T. Low-temperature selective catalytic reduction of NOxwith NH3 over metal oxide and zeolite catalysts-A review. Catal. Today 2011, 175, 147–156. [Google Scholar] [CrossRef]
  4. Gan, L.; Guo, F.; Yu, J.; Xu, G. Improved low-temperature activity of V2O5-WO3/TiO2 for denitration using different vanadium precursors. Catalysts 2016, 6, 25. [Google Scholar] [CrossRef] [Green Version]
  5. Li, J.; He, H.; Hu, C.; Zhao, J. The abatement of major pollutants in air and water by environmental catalysis. Front. Environ. Sci. Eng. 2013, 7, 302–325. [Google Scholar] [CrossRef] [PubMed]
  6. Gan, L.; Li, K.; Yang, W.; Chen, J.; Peng, Y.; Li, J. Core-shell-like structured α-MnO2@CeO2 catalyst for selective catalytic reduction of NO: Promoted activity and SO2 tolerance. Chem. Eng. J. 2020, 391, 123473. [Google Scholar] [CrossRef]
  7. Gan, L.; Shi, W.; Li, K.; Chen, J.; Peng, Y.; Li, J. Synergistic promotion effect between NOxand chlorobenzene removal on MnOx–CeO2 catalyst. ACS Appl. Mater. Interfaces 2018, 10, 30426–30432. [Google Scholar] [CrossRef]
  8. He, F.; Deng, X.; Chen, M. Nitric oxide removal by combined urea and FeII EDTA reaction systems. Chemosphere 2017, 168, 623–629. [Google Scholar] [CrossRef] [PubMed]
  9. Wei, J.; Luo, Y.; Yu, P.; Cai, B.; Tan, H. Removal of NO from flue gas by wet scrubbing with NaClO2/(NH2)2CO solutions. J. Ind. Eng. Chem. 2009, 15, 16–22. [Google Scholar] [CrossRef]
  10. Wang, X.; Xu, X.; Liu, S.; Zhang, Y.; Zhao, C.; Yang, F. Combination of complex adsorption and anammox for nitric oxide removal. J. Hazard. Mater. 2016, 312, 175–183. [Google Scholar] [CrossRef]
  11. Fang, P.; Cen, C.; Tang, Z.; Zhong, P.; Chen, D.; Chen, Z. Simultaneous removal of SO2 and NOx by wet scrubbing using urea solution. Chem. Eng. J. 2011, 168, 52–59. [Google Scholar] [CrossRef]
  12. Wen, Z.; Shen, H.; Li, Y.; Wang, Z.; Wang, G.; Cen, K. Experimental Study on the NOx Removal by Scrubbing with Urea-H2O2 Solution after NO Partial Preoxidation. Energy Fuel 2019, 33, 6600–6605. [Google Scholar] [CrossRef]
  13. Fang, P.; Cen, C.-p.; Wang, X.-m.; Tang, Z.-j.; Tang, Z.-x.; Chen, D.-s. Simultaneous removal of SO2, NO and Hg0 by wet scrubbing using urea+KMnO4 solution. Fuel Process. Technol. 2013, 106, 645–653. [Google Scholar] [CrossRef]
  14. Kang, X.; Ma, X.; Yin, J.a.; Gao, X. A study on simultaneous removal of NO and SO2 by using sodium persulfate aqueous scrubbing. Chin. J. Chem. Eng. 2018, 26, 1536–1544. [Google Scholar] [CrossRef]
  15. Zhao, Y.; Guo, T.-x.; Chen, Z.-y.; Du, Y.-r. Simultaneous removal of SO2 and NO using M/NaClO2 complex absorbent. Chem. Eng. J. 2010, 160, 42–47. [Google Scholar] [CrossRef]
  16. Jiao, W.; Luo, S.; He, Z.; Liu, Y. Applications of high gravity technologies for wastewater treatment: A review. Chem. Eng. J. 2017, 313, 912–927. [Google Scholar] [CrossRef]
  17. Kang, F.; Wang, D.; Pu, Y.; Zeng, X.-F.; Wang, J.-X.; Chen, J.-F. Efficient preparation of monodisperse CaCO3 nanoparticles as overbased nanodetergents in a high-gravity rotating packed bed reactor. Powder Technol. 2018, 325, 405–411. [Google Scholar] [CrossRef]
  18. Chang, C.-F.; Lee, S.-C. Adsorption behavior of pesticide methomyl on activated carbon in a high gravity rotating packed bed reactor. Water Res. 2012, 46, 2869–2880. [Google Scholar] [CrossRef]
  19. Lasalle, A.; Roizard, C.; Midoux, N.; Bourret, P.; Dyens, P.J. Removal of nitrogen oxides (NOx) from flue gases using the urea acidic process: Kinetics of the chemical reaction of nitrous acid with urea. Ind. Eng. Chem. Res. 1992, 31, 777–780. [Google Scholar] [CrossRef]
  20. Almog, J.; Klein, A.; Tamiri, T.; Shloosh, Y. A field diagnostic test for the improvised explosive urea nitrate. J. Forensic Sci. 2005, 50, 582–586. [Google Scholar] [CrossRef]
  21. Désilets, S.; Brousseau, P.; Chamberland, D.; Singh, S.; Feng, H.; Turcotte, R.; Armstrong, K.; Anderson, J. Analyses of the thermal decomposition of urea nitrate at high temperature. Thermochim. Acta 2011, 521, 59–65. [Google Scholar] [CrossRef]
  22. Tokmakov, I.V.; Alavi, S.; Thompson, D.L. Urea and Urea Nitrate Decomposition Pathways:  A Quantum Chemistry Study. J. Phys. Chem. A 2006, 110, 2759–2770. [Google Scholar] [CrossRef] [PubMed]
  23. Worsham, J.E., Jnr; Busing, W.R. The crystal structure of uronium nitrate (urea nitrate) by neutron diffraction. Acta Crystallogr. Sect. B 1969, 25, 572–578. [Google Scholar] [CrossRef]
  24. Kayan, G.Ö.; Kayan, A. Composite of Natural Polymers and Their Adsorbent Properties on the Dyes and Heavy Metal Ions. J. Polym. Environ. 2021, 29, 3477–3496. [Google Scholar] [CrossRef]
  25. Zheng, C.; Xu, C.; Zhang, Y.; Zhang, J.; Gao, X.; Luo, Z.; Cen, K. Nitrogen oxide absorption and nitrite/nitrate formation in limestone slurry for WFGD system. Appl. Energy 2014, 129, 187–194. [Google Scholar] [CrossRef]
  26. Thomas, D.; Vanderschuren, J. Analysis and prediction of the liquid phase composition for the absorption of nitrogen oxides into aqueous solutions. Sep. Purif. Technol. 1999, 18, 37–45. [Google Scholar] [CrossRef]
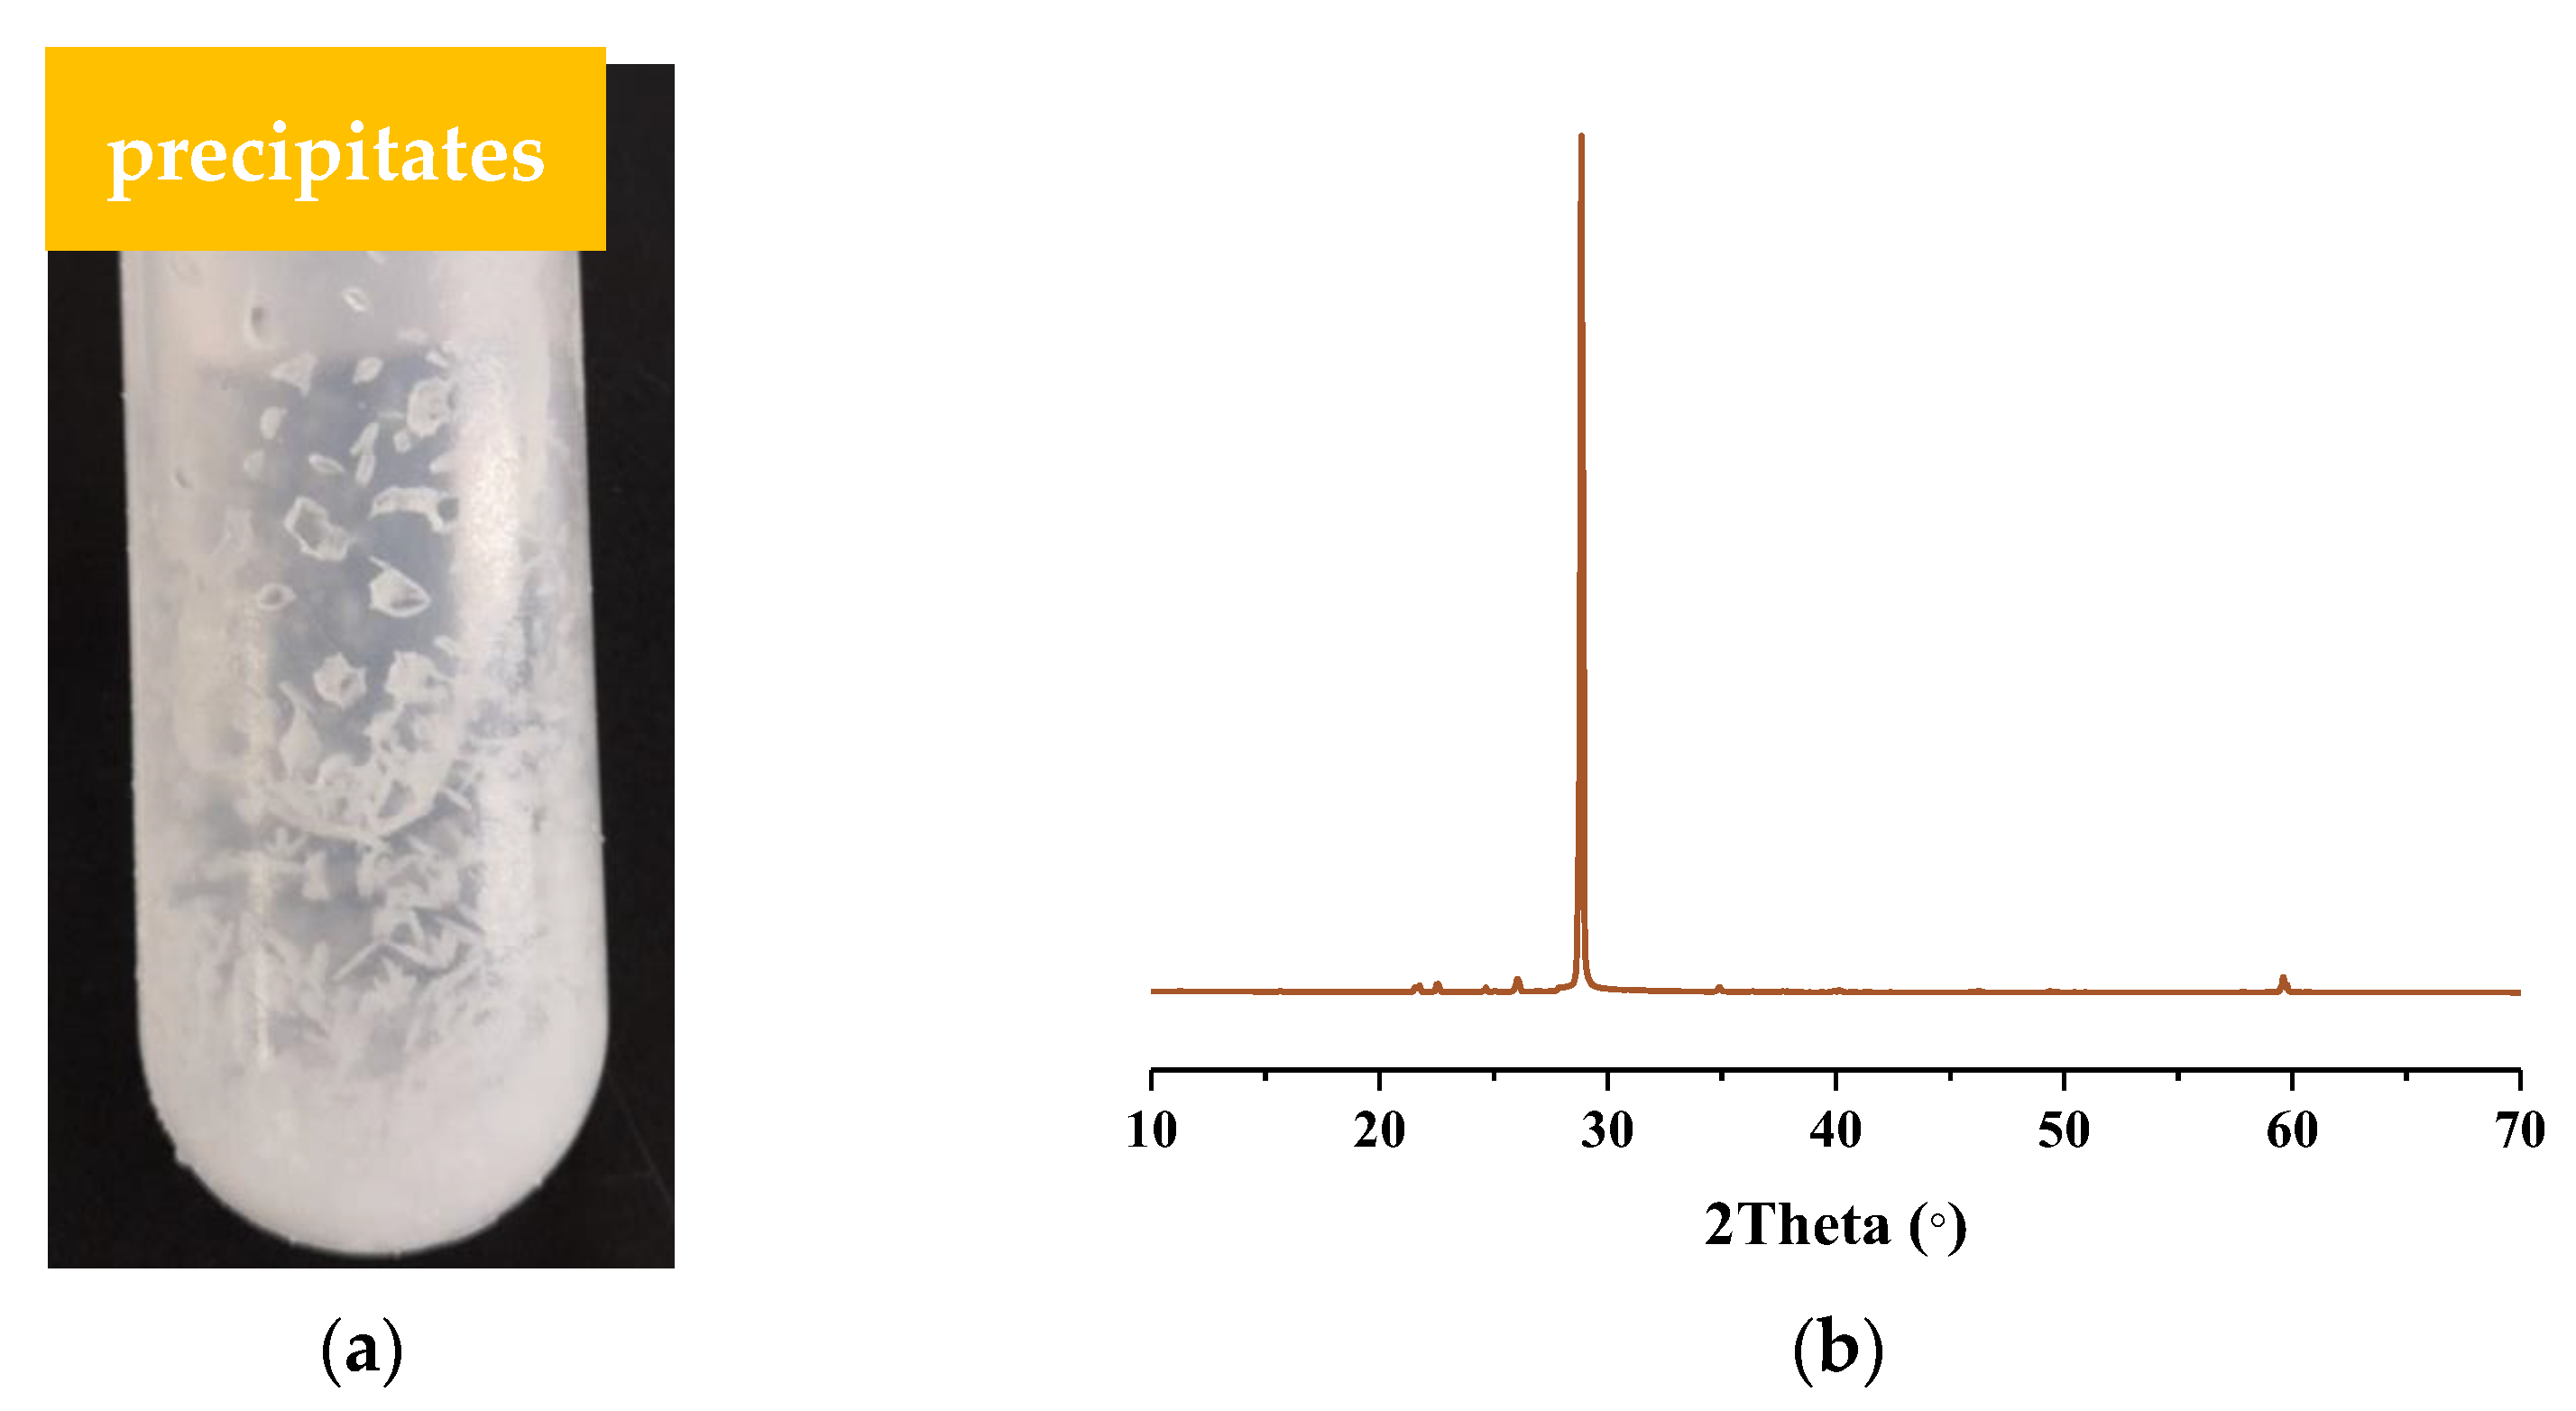
Figure 1. (a) Photograph and (b) XRD pattern of the precipitates formed during the reaction.
Molecules 28 00162 g001
Figure 2. The amount of HNO3 required for precipitation under the different concentrations of (a) urea solution and (b) NO3 (NO3 from NaNO3, and urea at 1.67 mol/L).
Molecules 28 00162 g002
Figure 3. The product of [urea], [H+] and [NO3] when urea nitrate was formed. The red dot is the ordinate, and the red line is the auxiliary line for reading.
Molecules 28 00162 g003
Figure 4. The conversion of NO, NO2 and NOx with different urea concentration. Reaction conditions: NO 1000 ppm, NO2 1000 ppm, O2 10 vol.%, N2 as balance gas, temperature 50 °C.
Molecules 28 00162 g004
Figure 5. The conversion of NO, NO2 and NOx at different reaction temperature. Reaction conditions: NO 1000 ppm, NO2 1000 ppm, O2 10 vol.%, N2 as balance gas, urea concentration 15 wt.%.
Molecules 28 00162 g005
Figure 6. The influence of the oxidation degree of NOx (NO2/NOx) on the conversion of NO, NO2 and NOx. Reaction conditions: NOx 2000 ppm (NO 500–1500 ppm and NO2 500–1500 ppm), O2 10 vol.%, N2 as balance gas, urea concentration 15 wt.%, temperature 50 °C.
Molecules 28 00162 g006
Figure 7. The conversions of NO, NO2 and NOx at different pH values: (a) the urea solution: Dissolution + Reaction process; (b) the aqueous solution: Dissolution process. Reaction conditions: NO 1000 ppm, NO2 1000 ppm, O2 10 vol.%, N2 as balance gas, urea concentration 15 wt.%, temperature 50 °C.
Molecules 28 00162 g007
Figure 8. The concentration of the gas produced during the Reaction process at different pH values: (a) Ph = 0 and (b) pH = 7. Reaction conditions: N2 as carrier gas, urea concentration 15 wt.%, temperature 50 °C.
Molecules 28 00162 g008
Figure 9. The influence of SO2 concentration on the conversion of SO2, NO, NO2 and NOx. Reaction conditions: NO 1000 ppm, NO2 1000 ppm, O2 10 vol.%, N2 as balance gas, urea concentration 15 wt.%, temperature 50 °C.
Molecules 28 00162 g009
Table 1. The ion concentration and pH value in the solution after absorption reaction.
SampleNH4+ (mg/L)NO2 (mg/L)NO3 (mg/L)pH
34%5.8012.351.136.29
42%13.7420.107.105.65
50%11.104.14--5.82
70%8.0413.946.855.49
95%10.3810.926.256.09
Table 2. The pH value of the solution before/after Dissolution/Reaction process.
SampleDissolutionDissolution + Reaction
Fresh SolutionUsed SolutionFresh SolutionUsed Solution
0−0.38−0.330.100.11
42.061.993.092.98
75.242.877.436.66
910.082.978.207.25
1212.7912.0912.9312.68
Table 3. The ion concentration of the solution after Dissolution/Reaction process (mg/L).
SampleDissolutionDissolution + Reaction
NO2NO3NO2NO3NH4+
43.4443.242.588.2843.8
73.7024.0114.818.4222.6
96.7246.6518.3610.2413.2
1269.3410.6623.924.131.2
Table 4. The ion concentration and pH value of the solution after the absorption denitration process.
SampleNH4+
(mg/L)
NO2
(mg/L)
NO3
(mg/L)
SO42−
(mg/L)
pH
SO2 022.614.818.42--6.66
SO2 250 ppm32.218.1322.2816.765.49
SO2 600 ppm31.315.3226.8533.825.29
SO2 1000 ppm38.3--46.0253.473.64
Disclaimer/Publisher’s Note: The statements, opinions and data contained in all publications are solely those of the individual author(s) and contributor(s) and not of MDPI and/or the editor(s). MDPI and/or the editor(s) disclaim responsibility for any injury to people or property resulting from any ideas, methods, instructions or products referred to in the content.