
A Sensitive LC-MS/MS Method for the Simultaneous Determination of Two Thia-Analogous Indirubin N-Glycosides and Indirubin-3′-Monoxime in Plasma and Cell Culture Medium

 , ,
, , 
Abstract
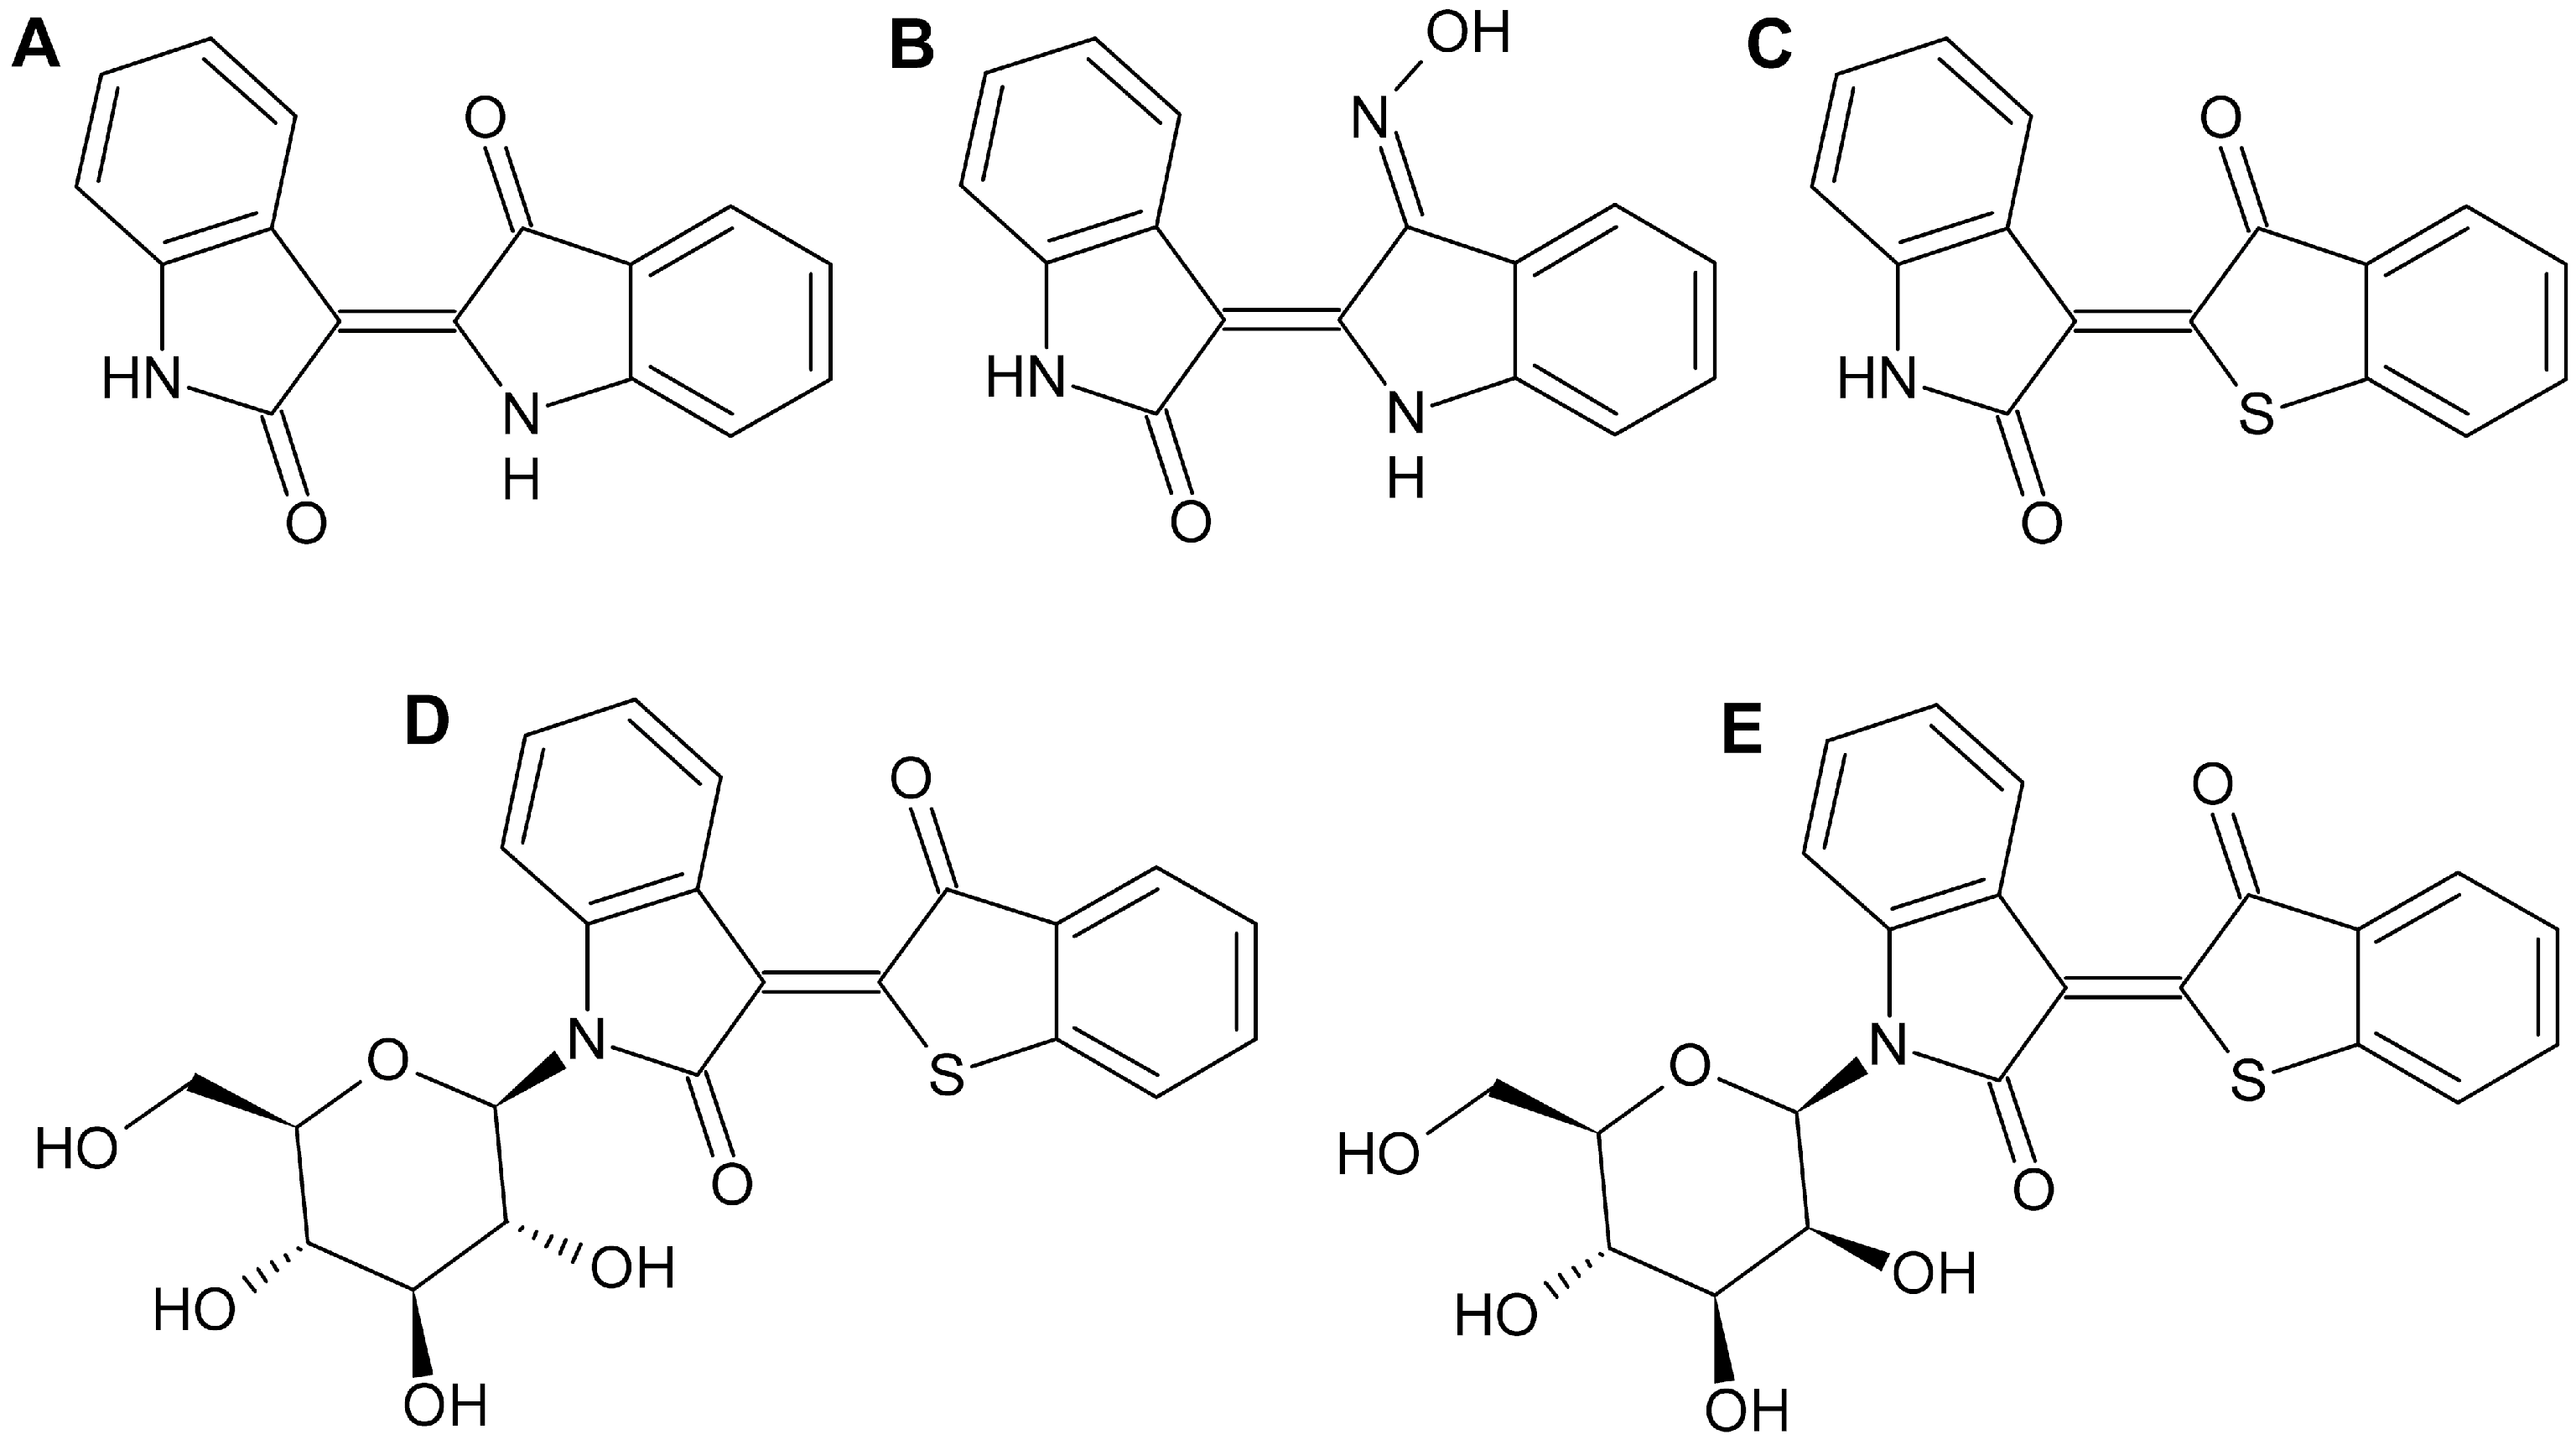
:1. Introduction
2. Results and Discussion
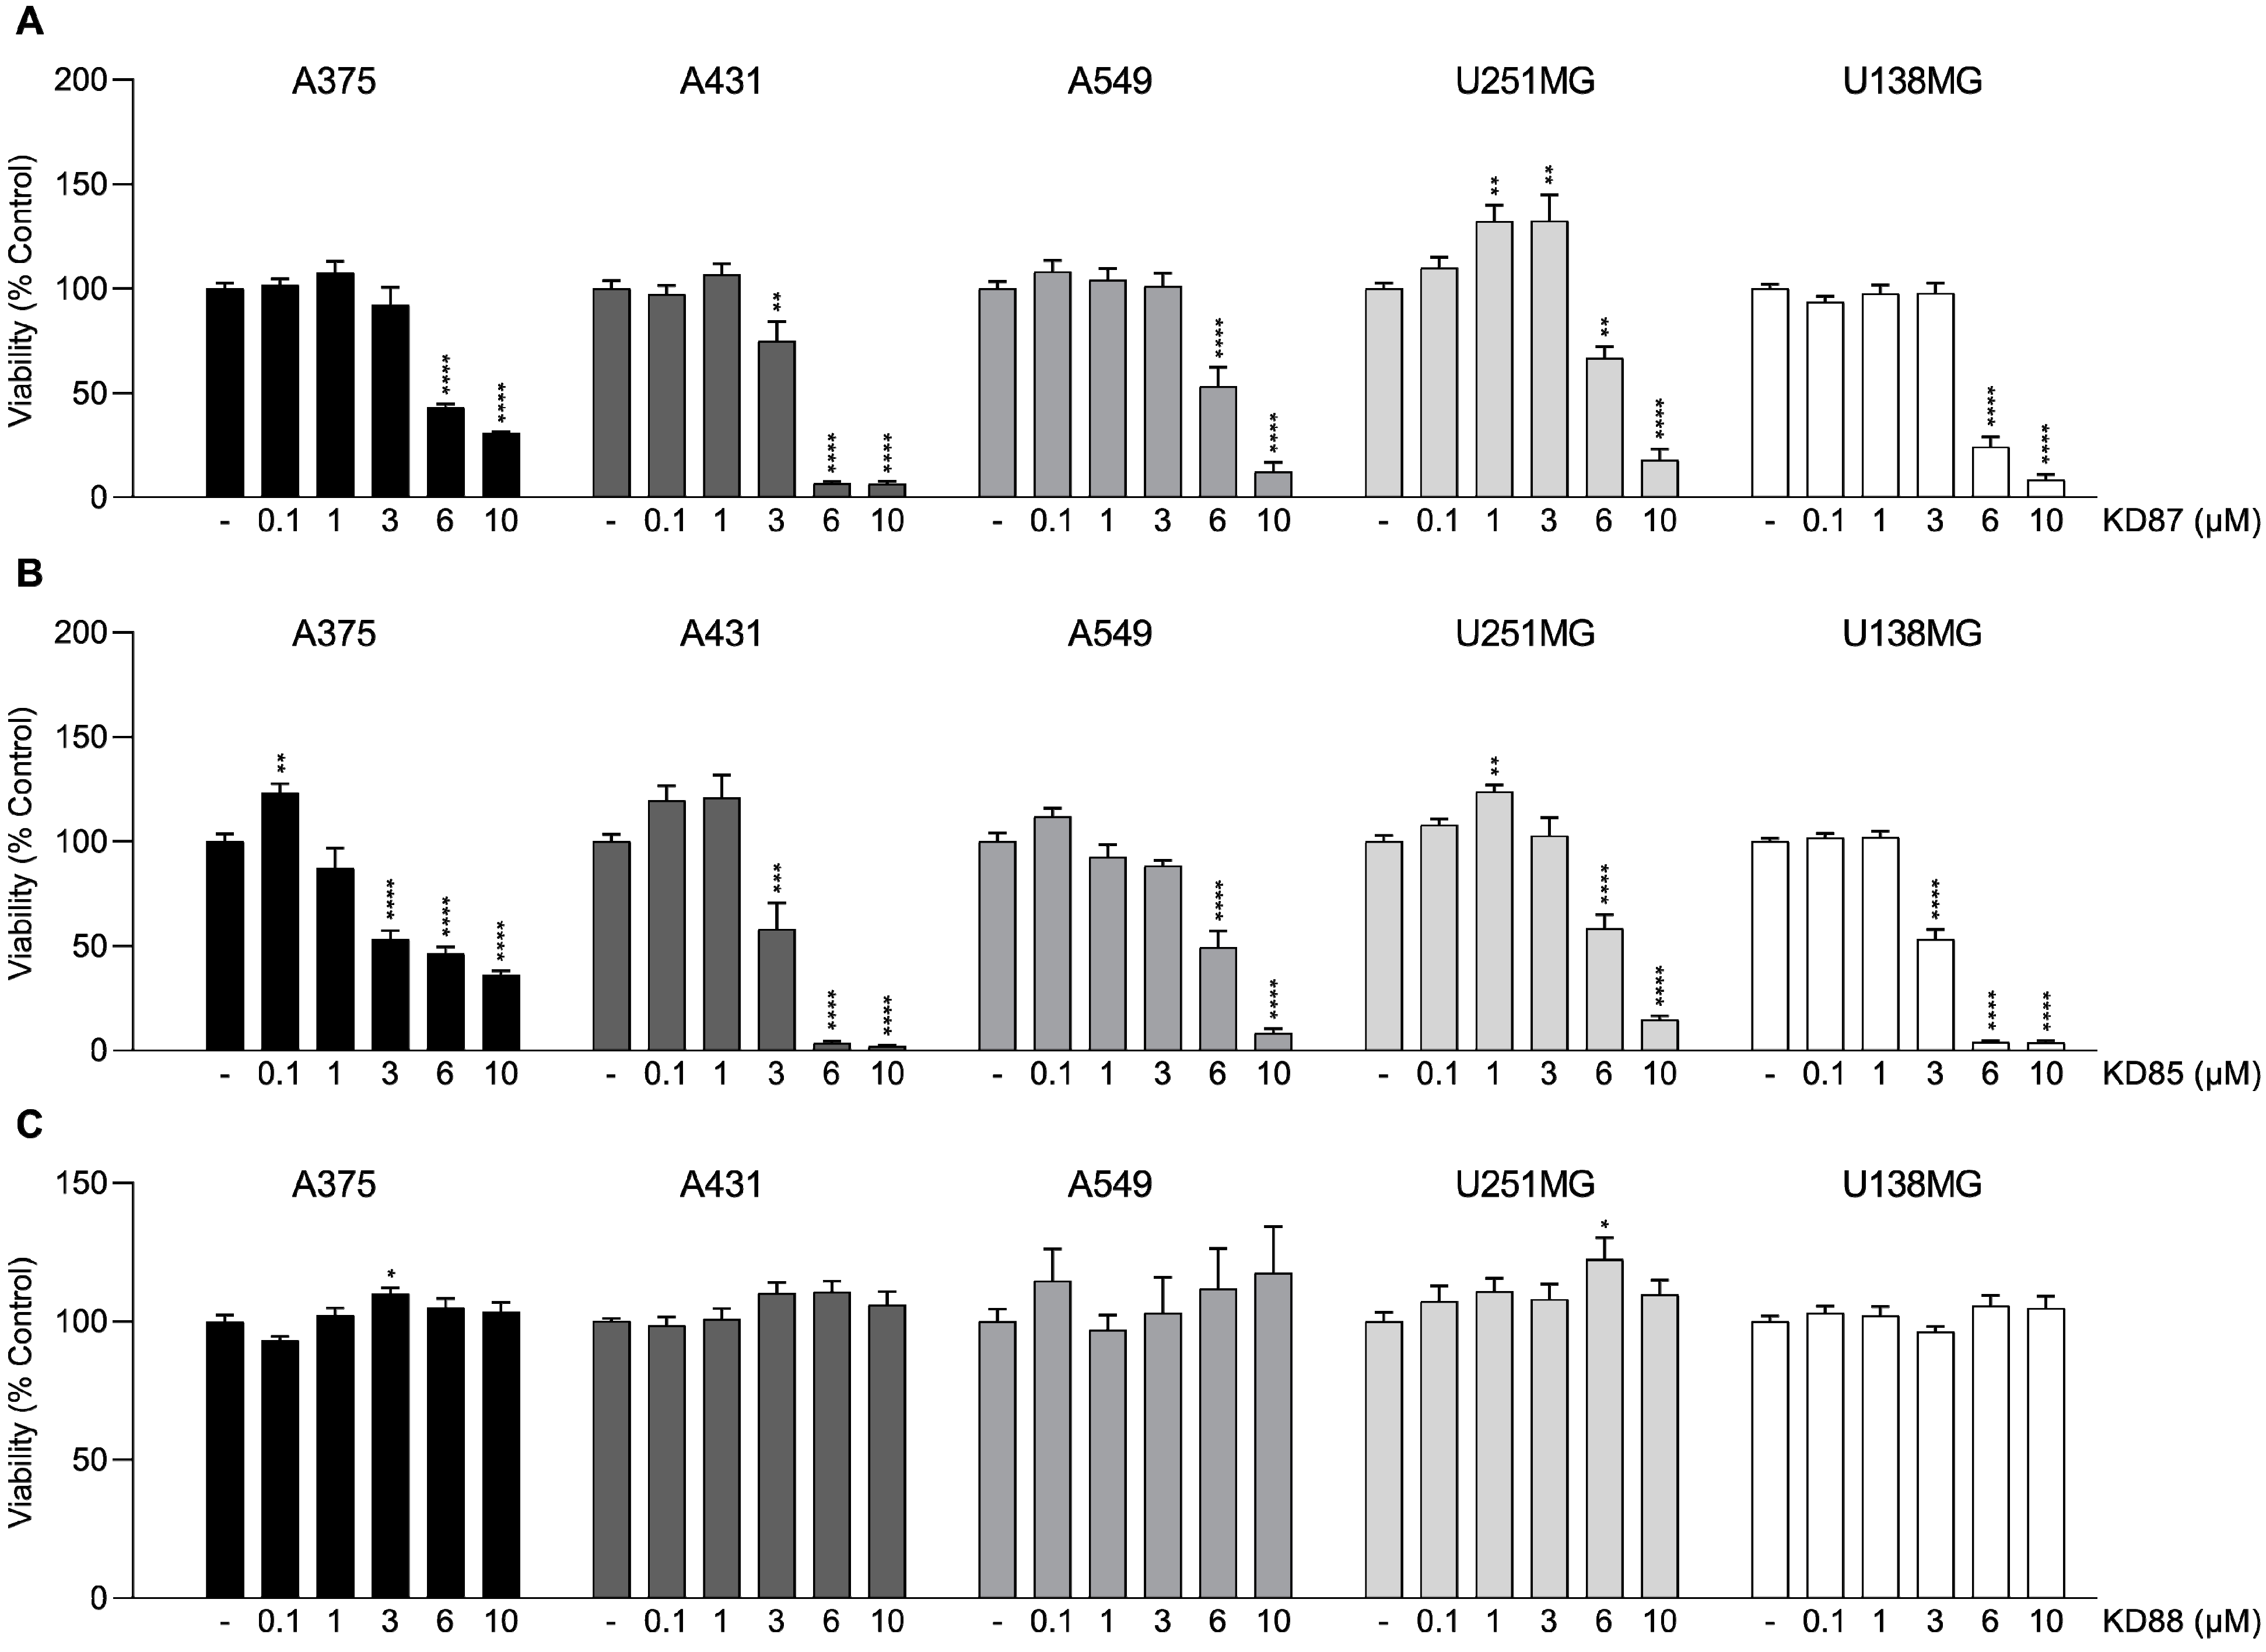
2.1. Effect of Thia-Analogous Indirubin N-Glycosides on the Viability of Various Tumor Cells
2.2. Method Development
2.3. Calibration Curve
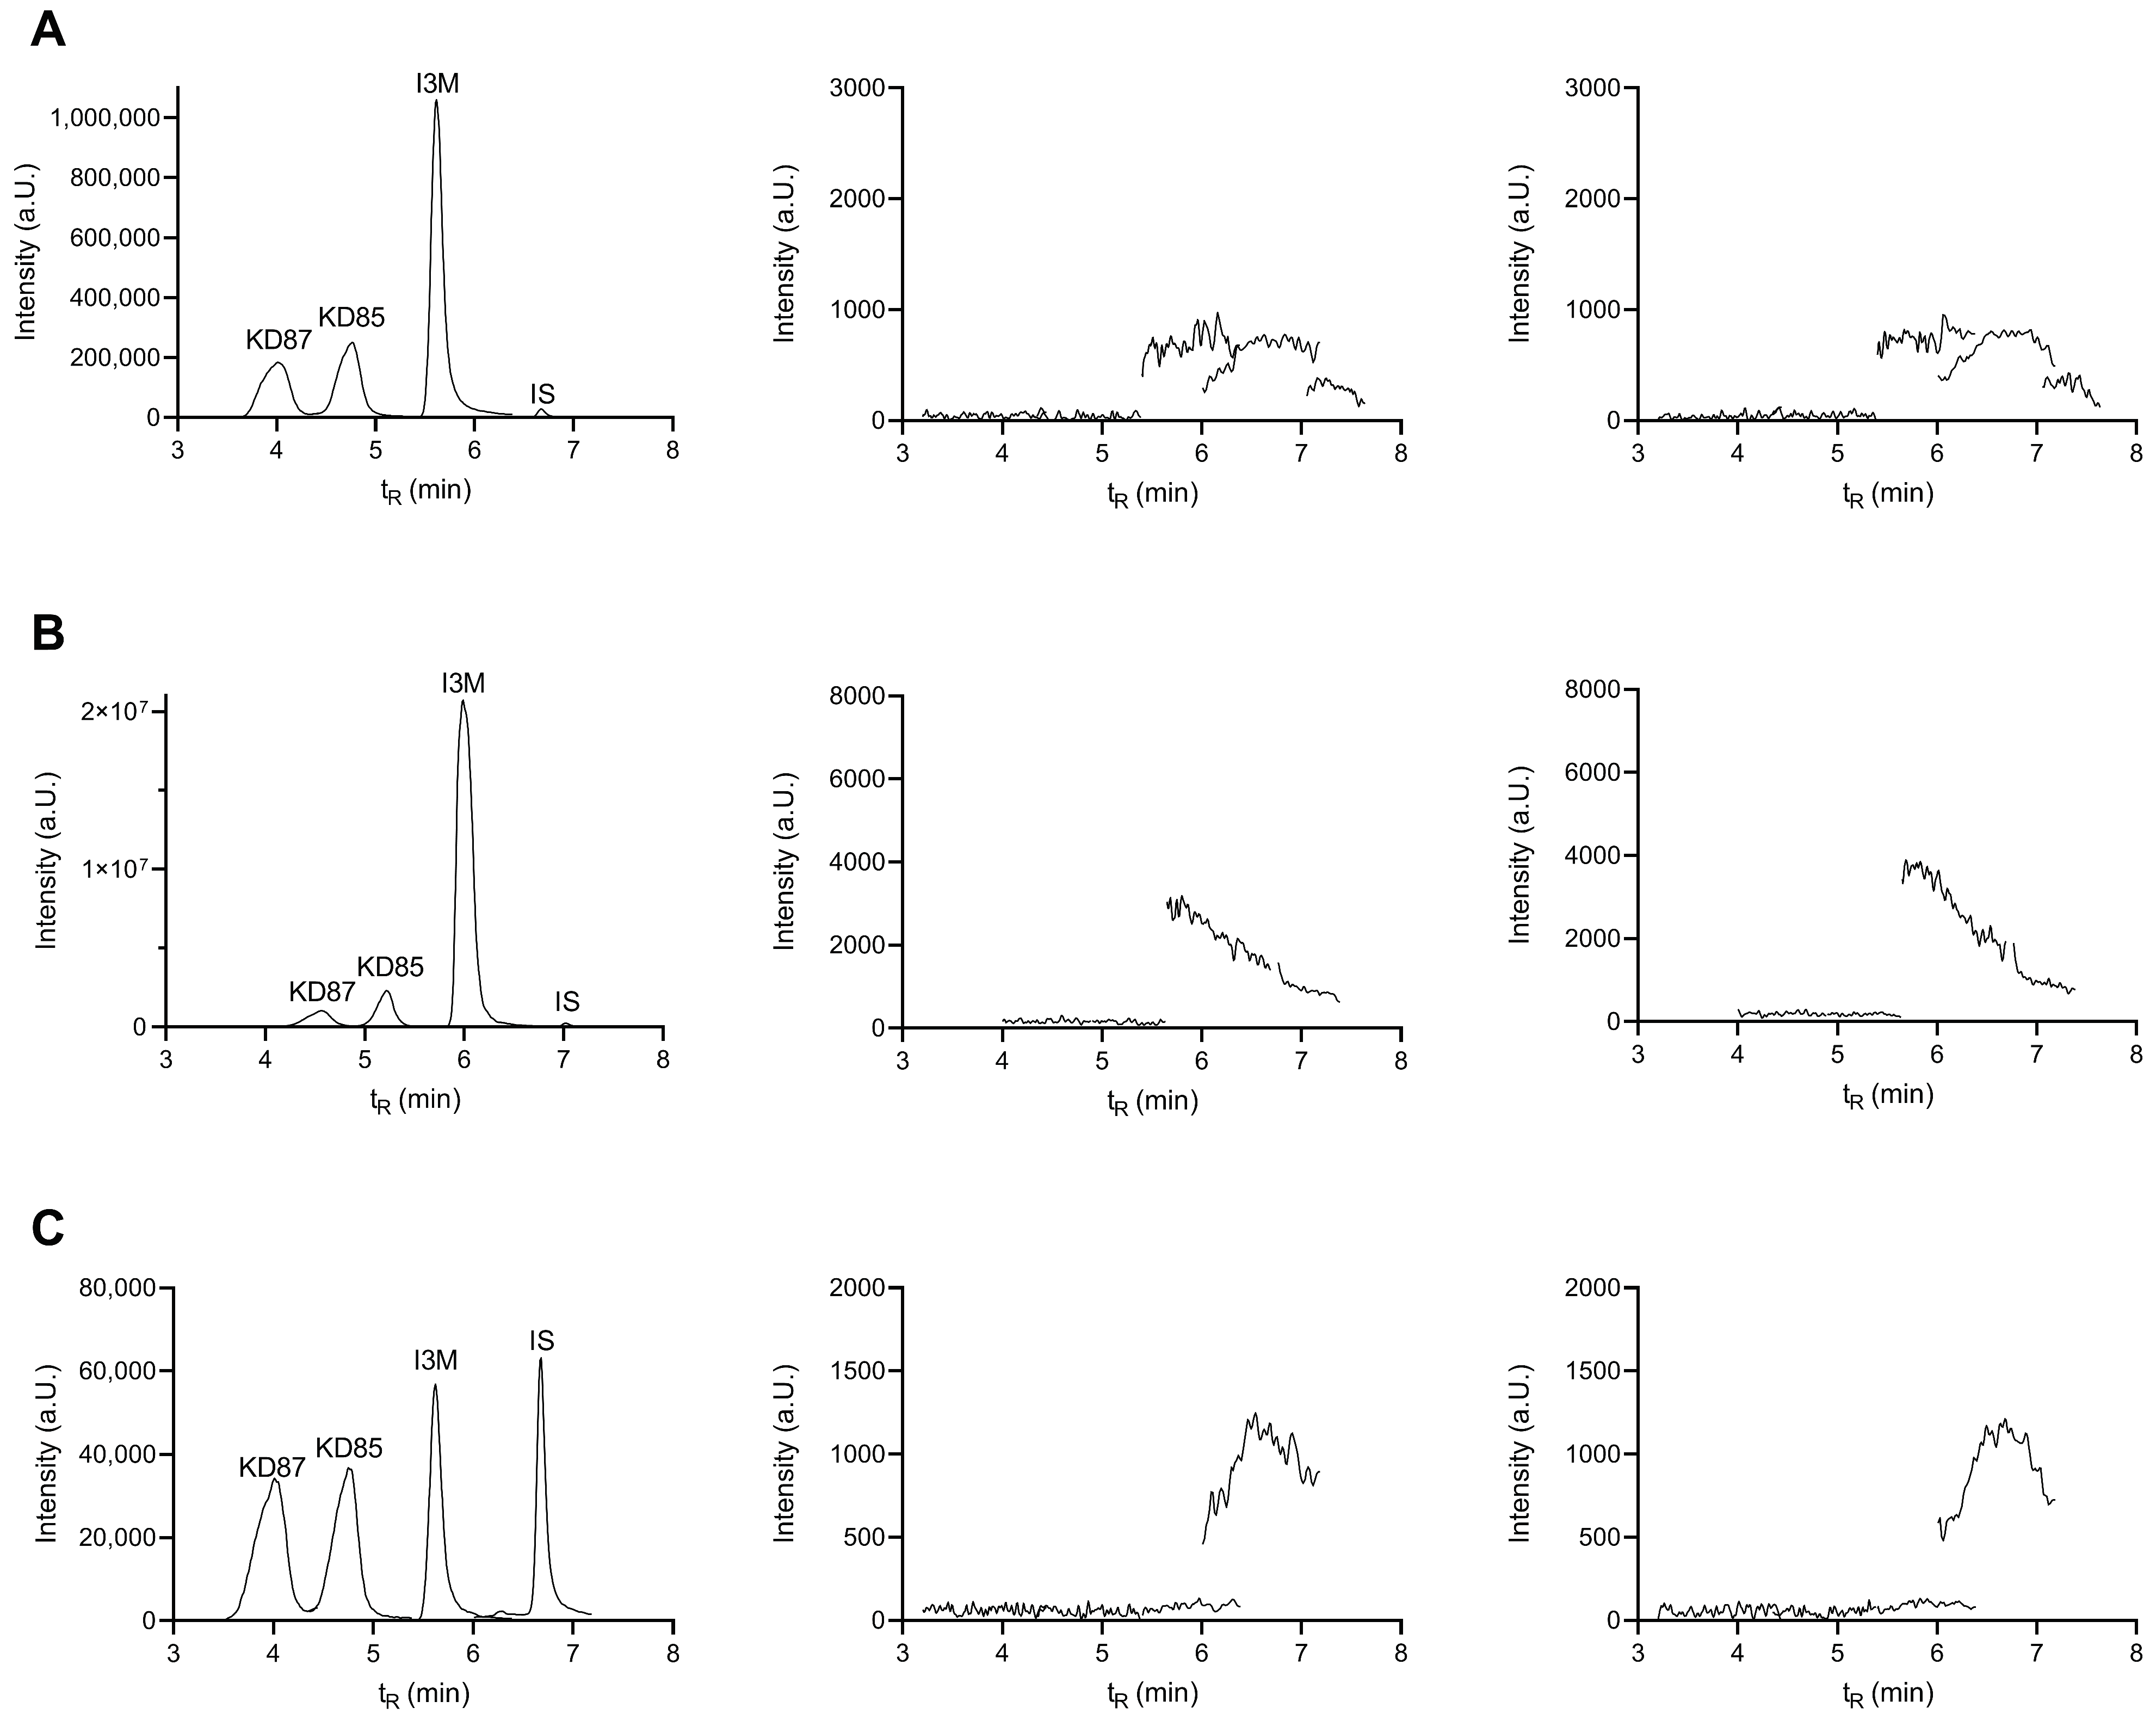
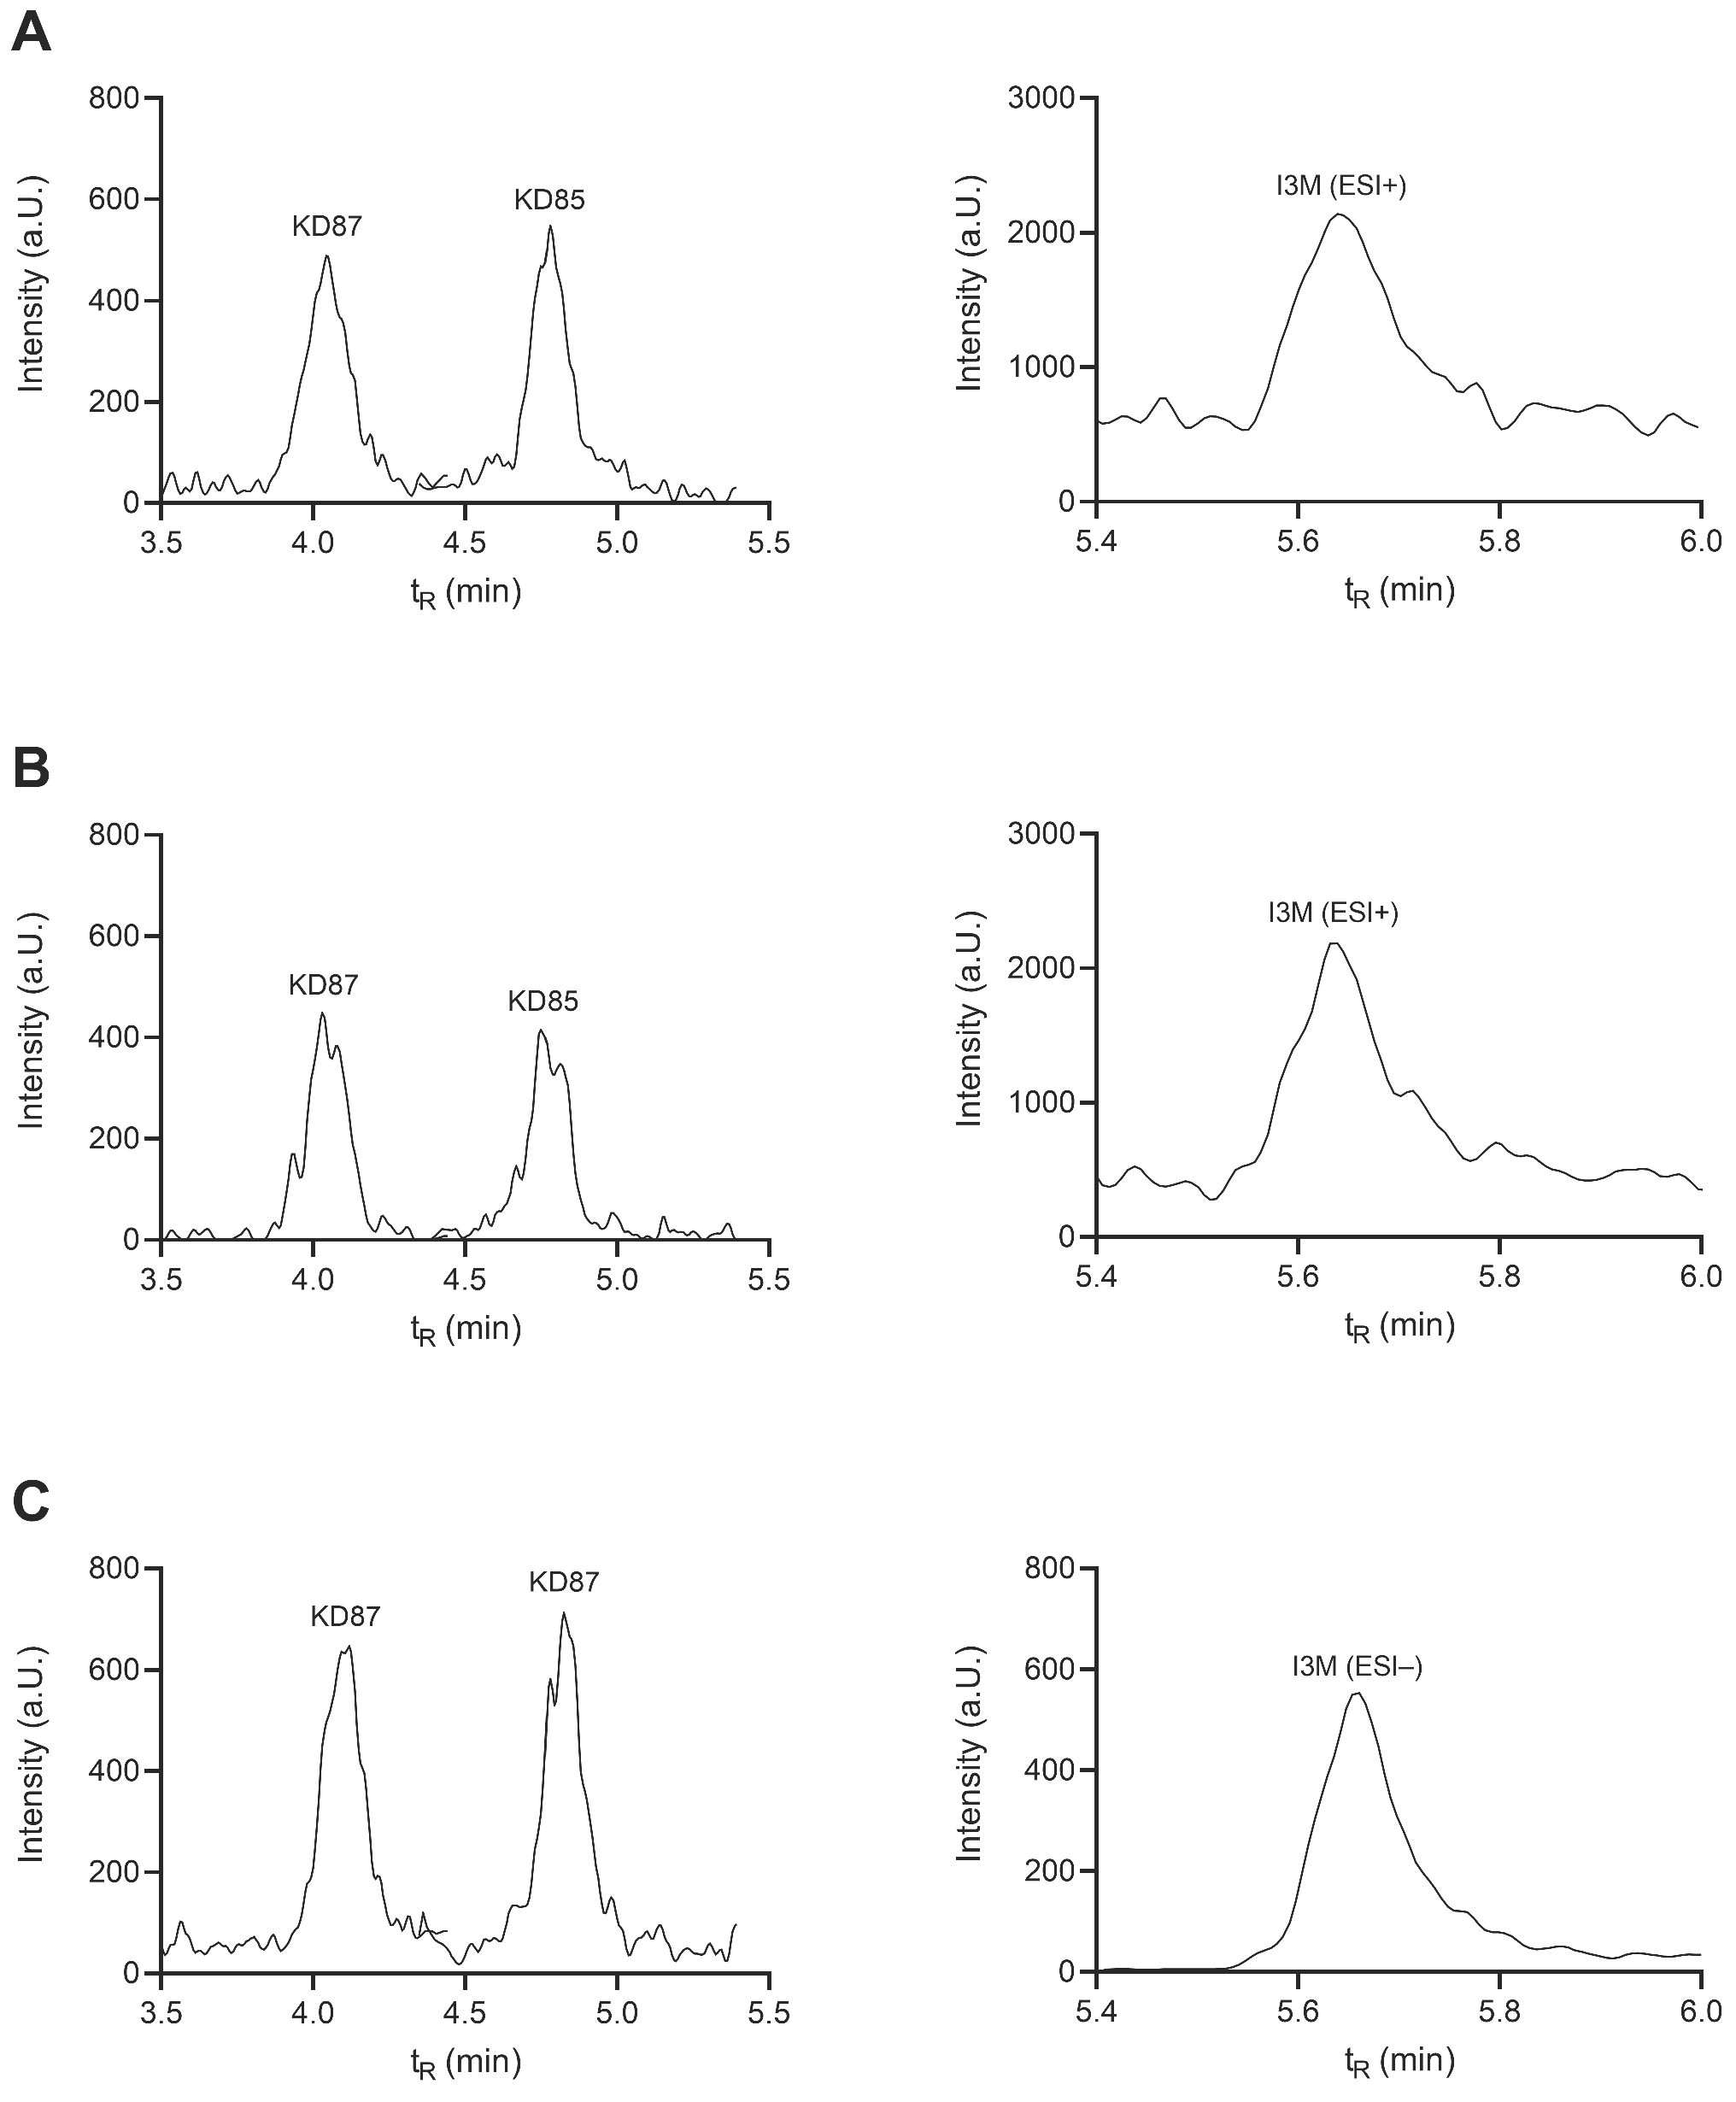
2.4. Selectivity and Carryover
2.5. Sensitivity, Accuracy and Precision
2.6. Recovery and Matrix Effect
2.7. Stability
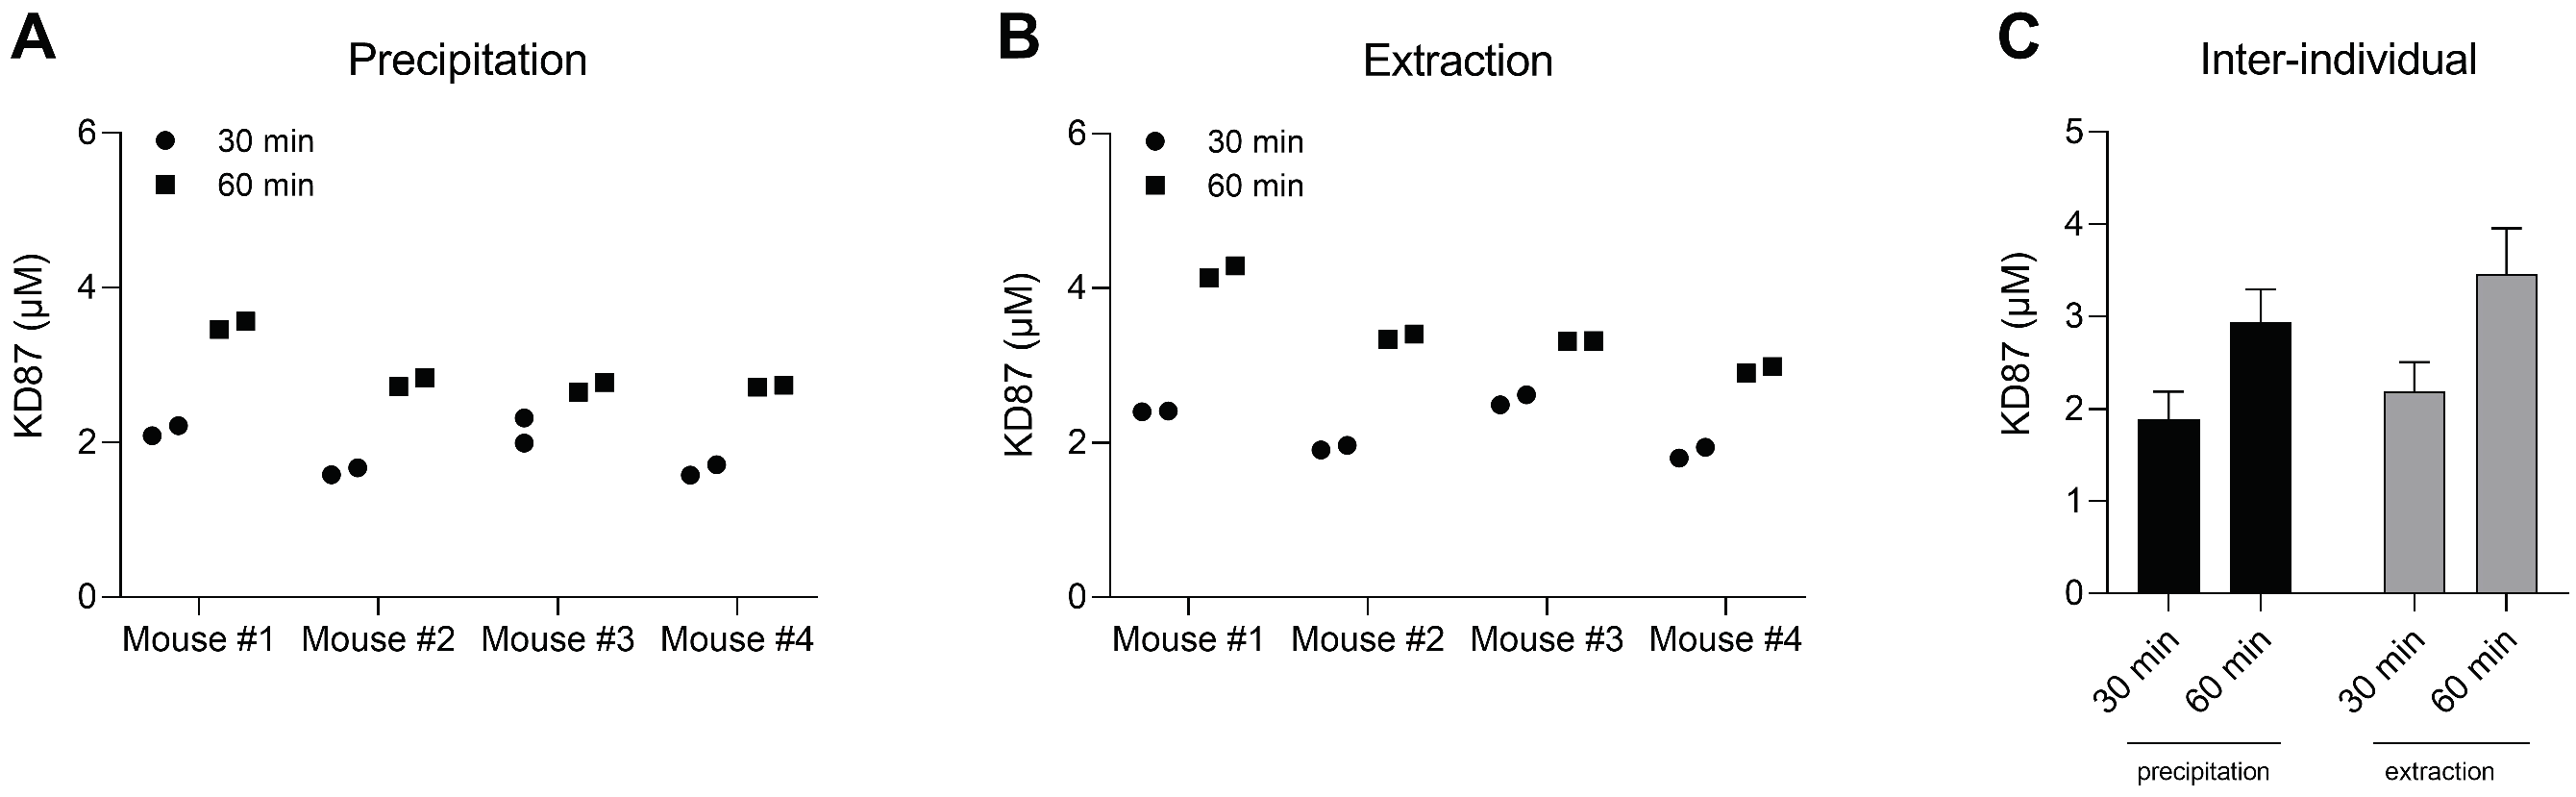
2.8. Quantification of KD87 in Plasma from Mice Treated with KD87 Intraperitoneally
3. Materials and Methods
3.1. Chemical Reagents
3.2. Cell Culture and Viability Assay
3.3. Standard Preparation
3.4. LC-MS/MS Analysis
3.5. Validation
3.6. Animal Experiment and Mouse Plasma Collection
4. Conclusions
Author Contributions
Funding
Institutional Review Board Statement
Informed Consent Statement
Data Availability Statement
Conflicts of Interest
Sample Availability
References
- Xiao, Z.; Hao, Y.; Liu, B.; Qian, L. Indirubin and meisoindigo in the treatment of chronic myelogenous leukemia in China. Leuk. Lymphoma 2002, 43, 1763–1768. [Google Scholar] [CrossRef] [PubMed]
- Eisenbrand, G.; Hippe, F.; Jakobs, S.; Muehlbeyer, S. Molecular mechanisms of indirubin and its derivatives: Novel anticancer molecules with their origin in traditional Chinese phytomedicine. J. Cancer Res. Clin. Oncol. 2004, 130, 627–635. [Google Scholar] [CrossRef] [PubMed]
- Marko, D.; Schätzle, S.; Friedel, A.; Genzlinger, A.; Zankl, H.; Meijer, L.; Eisenbrand, G. Inhibition of cyclin-dependent kinase 1 (CDK1) by indirubin derivatives in human tumour cells. Br. J. Cancer 2001, 84, 283–289. [Google Scholar] [CrossRef] [PubMed] [Green Version]
- Meijer, L.; Skaltsounis, A.-L.; Magiatis, P.; Polychronopoulos, P.; Knockaert, M.; Leost, M.; Ryan, X.P.; Vonica, C.A.; Brivanlou, A.; Dajani, R.; et al. GSK-3-selective inhibitors derived from Tyrian purple indirubins. Chem. Biol. 2003, 10, 1255–1266. [Google Scholar] [CrossRef] [Green Version]
- Nam, S.; Buettner, R.; Turkson, J.; Kim, D.; Cheng, J.Q.; Muehlbeyer, S.; Hippe, F.; Vatter, S.; Merz, K.-H.; Eisenbrand, G.; et al. Indirubin derivatives inhibit Stat3 signaling and induce apoptosis in human cancer cells. Proc. Natl. Acad. Sci. USA 2005, 102, 5998–6003. [Google Scholar] [CrossRef] [Green Version]
- Zhang, Y.; Du, Z.; Zhuang, Z.; Wang, Y.; Wang, F.; Liu, S.; Wang, H.; Feng, H.; Li, H.; Wang, L.; et al. E804 induces growth arrest, differentiation and apoptosis of glioblastoma cells by blocking Stat3 signaling. J. Neurooncol. 2015, 125, 265–275. [Google Scholar] [CrossRef]
- Maskey, R.P.; Grün-Wollny, I.; Fiebig, H.H.; Laatsch, H. Akashins A, B, and C: Novel Chlorinated Indigoglycosides from Streptomyces sp. GW 48/1497. Angew. Chem. Int. Ed. 2002, 41, 597–599. [Google Scholar] [CrossRef]
- Libnow, S.; Methling, K.; Hein, M.; Michalik, D.; Harms, M.; Wende, K.; Flemming, A.; Köckerling, M.; Reinke, H.; Bednarski, P.J.; et al. Synthesis of indirubin-N′-glycosides and their anti-proliferative activity against human cancer cell lines. Bioorg. Med. Chem. 2008, 16, 5570–5583. [Google Scholar] [CrossRef]
- Kunz, M.; Driller, K.M.; Hein, M.; Libnow, S.; Hohensee, I.; Ramer, R.; Hinz, B.; Berger, A.; Eberle, J.; Langer, P. Synthesis of thia-analogous indirubin N-Glycosides and their influence on melanoma cell growth and apoptosis. ChemMedChem 2010, 5, 534–539. [Google Scholar] [CrossRef]
- Berger, A.; Quast, S.-A.; Plötz, M.; Hein, M.; Kunz, M.; Langer, P.; Eberle, J. Sensitization of melanoma cells for death ligand-induced apoptosis by an indirubin derivative--Enhancement of both extrinsic and intrinsic apoptosis pathways. Biochem. Pharmacol. 2011, 81, 71–81. [Google Scholar] [CrossRef] [Green Version]
- Kleeblatt, D.; Becker, M.; Plötz, M.; Schönherr, M.; Villinger, A.; Hein, M.; Eberle, J.; Kunz, M.; Rahman, Q.; Langer, P. Synthesis and bioactivity of N-glycosylated 3-(2-oxo-2-arylethylidene)-indolin-2-ones. RSC Adv. 2015, 5, 20769–20782. [Google Scholar] [CrossRef]
- Soltan, M.Y.; Sumarni, U.; Assaf, C.; Langer, P.; Reidel, U.; Eberle, J. Key Role of Reactive Oxygen Species (ROS) in Indirubin Derivative-Induced Cell Death in Cutaneous T-Cell Lymphoma Cells. Int. J. Mol. Sci. 2019, 20, 1158. [Google Scholar] [CrossRef] [PubMed] [Green Version]
- Zhivkova, V.; Kiecker, F.; Langer, P.; Eberle, J. Crucial role of reactive oxygen species (ROS) for the proapoptotic effects of indirubin derivative DKP-073 in melanoma cells. Mol. Carcinog. 2019, 58, 258–269. [Google Scholar] [CrossRef] [PubMed]
- Zhu, J.; Langer, P.; Ulrich, C.; Eberle, J. Crucial Role of Reactive Oxygen Species (ROS) for the Proapoptotic Effects of Indirubin Derivatives in Cutaneous SCC Cells. Antioxidants 2021, 10, 1514. [Google Scholar] [CrossRef] [PubMed]
- Moon, M.J.; Lee, S.K.; Lee, J.-W.; Song, W.K.; Kim, S.W.; Kim, J.I.; Cho, C.; Choi, S.J.; Kim, Y.-C. Synthesis and structure-activity relationships of novel indirubin derivatives as potent anti-proliferative agents with CDK2 inhibitory activities. Bioorg. Med. Chem. 2006, 14, 237–246. [Google Scholar] [CrossRef]
- Schäfer, M.; Semmler, M.L.; Bernhardt, T.; Fischer, T.; Kakkassery, V.; Ramer, R.; Hein, M.; Bekeschus, S.; Langer, P.; Hinz, B.; et al. Small Molecules in the Treatment of Squamous Cell Carcinomas: Focus on Indirubins. Cancers 2021, 13, 1770. [Google Scholar] [CrossRef]
- Bioanalytical Method Validation—Guidance for Industry; U.S. Department of Health and Human Services, Food and Drug Administration; Center for Drug Evaluation and Research (CDER); Center for Veterinary Medicine (CVM): Rockville, MD, USA, 2018. Available online: http://www.fda.gov/downloads/Drugs/Guidances/ucm070107.pdf (accessed on 27 March 2022).
- Kim, N.Y.; Kim, Y.-C.; Kim, Y.G. Development of UHPLC-MS/MS Method for Indirubin-3′-Oxime Derivative as a Novel FLT3 Inhibitor and Pharmacokinetic Study in Rats. Molecules 2020, 25, 2039. [Google Scholar] [CrossRef]
- Tchoumtchoua, J.; Halabalaki, M.; Gikas, E.; Tsarbopoulos, A.; Fotaki, N.; Liu, L.; Nam, S.; Jove, R.; Skaltsounis, L.A. Preliminary pharmacokinetic study of the anticancer 6BIO in mice using an UHPLC-MS/MS approach. J. Pharm. Biomed. Anal. 2019, 164, 317–325. [Google Scholar] [CrossRef]
- Vainchtein, L.D.; Rosing, H.; Maier, A.; Fiebig, H.-H.; Schellens, J.H.M.; Beijnen, J.H. Quantitative and selective assay of 5-methylindirubine, an inhibitor of cyclin-dependent kinases, in murine plasma using coupled liquid chromatography and electrospray tandem mass spectrometry. J. Chromatogr. B Analyt. Technol. Biomed. Life Sci. 2007, 856, 261–266. [Google Scholar] [CrossRef]
- Park, M.-H.; Lee, Y.Y.; Cho, K.H.; La, S.; Lee, H.J.; Yim, D.-S.; Ban, S.; Park, M.-Y.; Kim, Y.-C.; Kim, Y.-G.; et al. Validation of a liquid chromatography-triple quadrupole mass spectrometric method for the determination of 5-nitro-5′-hydroxy-indirubin-3′-oxime (AGM-130) in human plasma and its application to microdose clinical trial. Biomed. Chromatogr. 2016, 30, 323–329. [Google Scholar] [CrossRef]
- Huang, M.; Lin, H.-S.; Lee, Y.S.; Ho, P.C. Evaluation of meisoindigo, an indirubin derivative: In vitro antileukemic activity and in vivo pharmacokinetics. Int. J. Oncol. 2014, 45, 1724–1734. [Google Scholar] [CrossRef] [PubMed] [Green Version]
- Kim, H.M.; Kim, Y.-C.; Kim, J.I.; Choi, Y.S.; Kim, Y.G. Development of a Liquid Chromatography-Tandem mass Spectrometry method for the Determination of Indirubin-5-Nitro-3’-Monoxime, a novel CDK Inhibitor, in rat plasma. J. Liq. Chromatogr. Relat. Technol. 2012, 35, 2175–2187. [Google Scholar] [CrossRef]


| Parameters for LC | Parameters for MS | |||||
|---|---|---|---|---|---|---|
| Compound | tR (min) | ESI | Precursor m/z | Product m/z | Dwell Time (ms) | Collision Energy (V) |
| KD87 | 4.1 | + | 442.0 | 280.0 * 292.0 | 72.0 | −16.0 |
| KD85 | 4.8 | + | 442.0 | 280.0 * 292.0 | 72.0 | −16.0 |
| I3M | 5.6 | + | 278.0 | 261.1 * 205.0 | 58.0 | −16.0 |
| I3M | 5.6 | - | 276.1 | 246.2 * 157.0 | 181.0 | 17.0 |
| Indirubin | 6.7 | + | 263.2 | 219.1 * 234.8 | 123.0 | −24.0 |
| KD87 | KD85 | I3M | |||||||||||||
|---|---|---|---|---|---|---|---|---|---|---|---|---|---|---|---|
| Added Concentration (nM) | Intra-Day | Inter-Day | Intra-Day | Inter-Day | Intra-Day | Inter-Day | |||||||||
| Measured Concentration (nM) | RE (%) | CV (%) | RE (%) | CV (%) | Measured Concentration (nM) | RE (%) | CV (%) | RE (%) | CV (%) | Measured Concentration (nM) | RE (%) | CV (%) | RE (%) | CV (%) | |
| 0.67 | 0.66 ± 0.02 | −0.95 ± 2.9 | 2.91 | −0.95 ± 6.5 | 6.53 | 0.67 ± 0.03 | 0.93 ± 4.7 | 4.69 | 0.98 ± 5.7 | 5.62 | 0.65 ± 0.01 | −2.48 ± 2.2 | 2.26 | −2.49 ± 7.0 | 7.21 |
| 2.00 | 2.01 ± 0.08 | 0.35 ± 4.1 | 4.07 | 0.35 ± 4.7 | 4.72 | 1.98 ± 0.07 | −1.03 ± 3.5 | 3.51 | −1.03 ± 4.2 | 4.25 | 2.04 ± 0.09 | 1.99 ± 4.6 | 4.52 | 1.99 ± 5.4 | 5.27 |
| 26.7 | 26.09 ± 0.39 | −2.18 ± 1.5 | 1.49 | −2.19 ± 2.9 | 2.91 | 26.02 ± 0.36 | −2.43 ± 1.4 | 1.39 | −2.43 ± 2.7 | 2.79 | 26.97 ± 0.66 | 1.15 ± 2.5 | 2.46 | 1.06 ± 4.1 | 4.05 |
| 167 | 165.8 ± 1.13 | −0.51 ± 0.68 | 0.68 | −0.51 ± 1.9 | 1.90 | 166.4 ± 0.63 | −0.16 ± 0.38 | 0.38 | −0.15 ± 1.3 | 1.33 | 165.5 ± 5.63 | −0.68 ± 3.4 | 3.40 | −0.68 ± 4.0 | 4.01 |
| KD87 | KD85 | I3M | |||||||||||||
|---|---|---|---|---|---|---|---|---|---|---|---|---|---|---|---|
| Added Concentration (nM) | Intra-Day | Inter-Day | Intra-Day | Inter-Day | Intra-Day | Inter-Day | |||||||||
| Measured Concentration (nM) | RE (%) | CV (%) | RE (%) | CV (%) | Measured Concentration (nM) | RE (%) | CV (%) | RE (%) | CV (%) | Measured Concentration (nM) | RE (%) | CV (%) | RE (%) | CV (%) | |
| 1.0 | 0.99 ± 0.03 | −0.67 ± 2.7 | 2.67 | −0.62 ± 5.0 | 4.99 | 1.00 ± 0.006 | −0.04 ± 0.6 | 0.59 | −0.02 ± 3.1 | 3.12 | 1.02 ± 0.05 | 2.24 ± 5.1 | 5.01 | 2.24 ± 7.1 | 6.89 |
| 3.0 | 2.97 ± 0.09 | −1.14 ± 3.1 | 3.09 | −1.14 ± 4.1 | 4.14 | 2.93 ± 0.05 | −2.47 ± 1.6 | 1.61 | −2.57 ± 4.1 | 4.20 | 2.99 ± 0.13 | −0.42 ± 4.2 | 4.21 | −0.66 ± 5.8 | 5.82 |
| 40 | 39.4 ± 1.14 | −1.59 ± 2.8 | 2.88 | −1.59 ± 3.6 | 3.67 | 39.2 ± 0.91 | −1.97 ± 2.3 | 2.33 | −1.99 ± 2.8 | 2.84 | 39.8 ± 0.61 | −0.59 ± 1.5 | 1.53 | −0.71 ± 3.1 | 3.11 |
| 250 | 241.7 ± 7.29 | −3.32 ± 2.9 | 3.01 | −3.32 ± 4.2 | 4.34 | 243.4 ± 7.03 | −2.66 ± 2.8 | 2.89 | −2.67 ± 3.6 | 3.74 | 242.2 ± 2.79 | −3.14 ± 1.1 | 1.15 | −3.07 ± 2.6 | 2.71 |
| KD87 | KD85 | I3M | |||||||||||||
|---|---|---|---|---|---|---|---|---|---|---|---|---|---|---|---|
| Added Concentration (nM) | Intra-Day | Inter-Day | Intra-Day | Inter-Day | Intra-Day | Inter-Day | |||||||||
| Measured Concentration (nM) | RE (%) | CV (%) | RE (%) | CV (%) | Measured Concentration (nM) | RE (%) | CV (%) | RE (%) | CV (%) | Measured Concentration (nM) | RE (%) | CV (%) | RE (%) | CV (%) | |
| 1.0 | 1.03 ± 0.02 | 2.71 ± 1.8 | 1.75 | 2.71 ± 3.5 | 3.37 | 0.99 ± 0.04 | −1.13 ± 3.9 | 3.96 | −1.00 ± 6.5 | 6.55 | 0.99 ± 0.04 | −0.80 ± 3.7 | 3.73 | −0.64 ± 4.4 | 4.45 |
| 3.0 | 3.03 ± 0.11 | 1.00 ± 3.6 | 3.60 | 1.00 ± 4.5 | 4.50 | 3.0 ± 0.08 | 0.16 ± 2.5 | 2.51 | 0.16 ± 5.3 | 5.32 | 3.07 ± 0.05 | 2.43 ± 1.6 | 1.56 | 2.35 ± 2.9 | 2.85 |
| 15 | 15.07 ± 0.26 | 0.49 ± 1.7 | 1.70 | 0.59 ± 2.9 | 2.88 | 14.49 ± 0.45 | −3.38 ± 3.0 | 3.13 | −3.27 ± 3.3 | 3.43 | 15.18 ± 0.07 | 1.18 ± 0.5 | 0.47 | 1.18 ± 2.1 | 2.12 |
| 40 | 39.86 ± 0.67 | −0.35 ± 1.7 | 1.69 | −0.42 ± 2.6 | 2.63 | 39.15 ± 1.06 | −2.13 ± 2.7 | 2.72 | −2.19 ± 3.5 | 3.60 | 40.13 ± 0.25 | 0.31 ± 0.6 | 0.61 | 0.34 ± 0.6 | 1.43 |
| Plasma Precipitation | Plasma Extraction | DMEM Extraction | |||||||||||||||
|---|---|---|---|---|---|---|---|---|---|---|---|---|---|---|---|---|---|
| c (nM) | KD87 | KD85 | I3M | IS | c (nM) | KD87 | KD85 | I3M | IS | c (nM) | KD87 | KD85 | I3M | IS 5 µL | IS 2 µL | ||
| 50 | 97.0 ± 2.1 | 50 | 64.3 ± 1.3 | 50 | 83.4 ± 5.1 | 85.4 ± 4.2 | |||||||||||
| 2.0 | 92.77 ± 6.1 | 90.20 ± 7.7 | 107.09 ± 4.5 | 3.0 | 87.94 ± 5.4 | 92.86 ± 4.5 | 105.3 ± 2.6 | 3.0 | 64.36 ± 1.5 | 59.97 ± 1.8 | 71.67 ± 0.5 | ||||||
| 26.7 | 86.64 ± 2.7 | 87.67 ± 3.6 | 92.34 ± 5.0 | 40 | 87.39 ± 4.1 | 88.75 ± 3.7 | 92.17 ± 2.8 | 15 | 61.90 ± 0.9 | 62.95 ± 3.0 | 71.25 ± 2.2 | ||||||
| 167 | 89.67 ± 1.5 | 89.27 ± 1.5 | 96.74 ± 10.8 | 250 | 87.43 ± 1.8 | 86.94 ± 0.4 | 92.08 ± 6.9 | 40 | 70.46 ± 2.3 | 64.75 ± 2.3 | 69.95 ± 1.4 | ||||||
| Plasma Extraction | DMEM Extraction | ||||||||||
|---|---|---|---|---|---|---|---|---|---|---|---|
| c (nM) | KD87 | KD85 | I3M | IS | c (nM) | KD87 | KD85 | I3M | IS 5 µL | IS 2 µL | |
| 50 | 2.68 ± 3.2 | 50 | 2.13 ± 2.9 | 1.96 ± 2.2 | |||||||
| 3.0 | 0.94 ± 1.4 | 0.61 ± 1.5 | −0.55 ± 3.6 | 3.0 | 0.68 ± 4.7 | −0.61 ± 2.4 | 1.46 ± 5.5 | ||||
| 40 | −0.08 ± 3.3 | 1.01 ± 2.1 | 2.57 ± 1.2 | 15 | 1.20 ± 1.8 | 5.97 ± 1.1 | 2.93 ± 3.6 | ||||
| 250 | 3.15 ± 1.2 | 1.31 ± 2.9 | −1.12 ± 4.1 | 40 | 3.95 ± 3.2 | 1.74 ± 1.5 | 1.83 ± 4.0 | ||||
| Plasma Precipitation | Plasma Extraction | DMEM Extraction | |||||||||||||||||||||
|---|---|---|---|---|---|---|---|---|---|---|---|---|---|---|---|---|---|---|---|---|---|---|---|
| c (nM) | BT | 4 °C | −20 °C | AS | FT | −80 °C 91 d | c (nM) | BT | 4 °C | −20 °C | AS | FT | −80 °C 90 d | c (nM) | BT | 4 °C | −20 °C | AS | FT | −80 °C 91 d | |||
| KD87 | 2.0 | 64.3 ± 5.6 | 81.4 ± 3.1 | 94.6 ± 2.8 | 105.7 ± 6.7 | 98.8 ± 5.6 | 96.7 ± 8.6 | KD87 | 3.0 | 64.4 ± 4.6 | 79.3 ± 2.4 | 101.4 ± 3.4 | 80.8 ± 3.0 | 98.3 ± 5.4 | 100.1 ± 8.4 | KD87 | 3.0 | 104.9 ± 4.0 | 81.4 ± 3.3 | 87.7 ± 3.2 | 101.2 ± 7.4 | 98.3 ± 5.4 | 97.8 ± 6.0 |
| 167 | 75.0 ± 3.5 | 84.5 ± 2.0 | 92.6 ± 2.6 | 99.9 ± 4.8 | 97.9 ± 4.1 | 106.0 ± 1.4 | 250 | 77.8 ± 2.7 | 94.1 ± 5.6 | 100.1 ± 0.7 | 73.7 ± 3.3 | 99.7 ± 2.6 | 100.9 ± 3.6 | 40 | 98.3 ± 1.1 | 84.5 ± 2.1 | 84.2 ± 2.6 | 81.7 ± 3.7 | 101.9 ± 5.4 | 92.3 ± 7.8 | |||
| KD85 | 2.0 | 57.5 ± 4.1 | 81.3 ± 3.4 | 90.1 ± 5.7 | 97.6 ± 8.0 | 107.9 ± 4.9 | 105.1 ± 12.4 | KD85 | 3.0 | 64.4 ± 3.6 | 85.5 ± 2.2 | 86.4 ± 3.5 | 71.8 ± 2.7 | 99.4 ± 4.0 | 102.5 ± 5.2 | KD85 | 3.0 | 115.3 ± 1.8 | 98.3 ± 2.2 | 86.8 ± 1.8 | 75.6 ± 5.8 | 99.4 ± 4.0 | 93.2 ± 6.9 |
| 167 | 70.3 ± 3.2 | 85.5 ± 1.9 | 96.3 ± 2.3 | 99.6 ± 4.1 | 99.5 ± 3.8 | 108.2 ± 3.7 | 250 | 76.0 ± 2.6 | 94.3 ± 5.7 | 101.8 ± 3.2 | 73.1 ± 2.7 | 99.1 ± 2.0 | 101.7 ± 1.1 | 40 | 100.5 ± 1.9 | 80.5 ± 1.8 | 81.9 ± 3.9 | 71.6 ± 1.9 | 99.9 ± 3.3 | 92.7 ± 5.7 | |||
| I3M | 2.0 | 100.1 ± 9.0 | 89.7 ± 1.5 | 95.2 ± 3.7 | 124.3 ± 9.5 | 104.1 ± 5.5 | 101.0 ± 9.0 | I3M | 3.0 | 102.2 ± 1.8 | 95.9 ± 8.7 | 93.8 ± 1.9 | 68.0 ± 1.5 | 94.9 ± 4.0 | 96.2 ± 7.2 | I3M | 3.0 | 66.8 ± 2.7 | 113.8 ± 6.6 | 92.0 ± 1.1 | 65.0 ± 1.3 | 100.0 ± 5.7 | 90.6 ± 4.5 |
| 167 | 98.6 ± 4.3 | 91.5 ± 3.3 | 93.7 ± 7.7 | 112.0 ± 6.8 | 99.7 ± 7.4 | 103.0 ± 3.6 | 250 | 96.3 ± 7.3 | 94.6 ± 2.2 | 96.5 ± 1.6 | 58.5 ± 1.3 | 99.7 ± 1.6 | 100.6 ± 3.0 | 40 | 59.4 ± 2.4 | 100.4 ± 1.3 | 93.1 ± 2.5 | 63.6 ± 0.3 | 99.5 ± 3.2 | 99.0 ± 2.7 | |||
Publisher’s Note: MDPI stays neutral with regard to jurisdictional claims in published maps and institutional affiliations. |
© 2022 by the authors. Licensee MDPI, Basel, Switzerland. This article is an open access article distributed under the terms and conditions of the Creative Commons Attribution (CC BY) license (https://creativecommons.org/licenses/by/4.0/).
Share and Cite
Fischle, A.; Schwarz, R.; Wendt, F.; Kordt, M.; Ramer, R.; Boeckmann, L.; Hein, M.; Langer, P.; Emmert, S.; Vollmar, B.; et al. A Sensitive LC-MS/MS Method for the Simultaneous Determination of Two Thia-Analogous Indirubin N-Glycosides and Indirubin-3′-Monoxime in Plasma and Cell Culture Medium. Molecules 2022, 27, 3031. https://doi.org/10.3390/molecules27093031
Fischle A, Schwarz R, Wendt F, Kordt M, Ramer R, Boeckmann L, Hein M, Langer P, Emmert S, Vollmar B, et al. A Sensitive LC-MS/MS Method for the Simultaneous Determination of Two Thia-Analogous Indirubin N-Glycosides and Indirubin-3′-Monoxime in Plasma and Cell Culture Medium. Molecules. 2022; 27(9):3031. https://doi.org/10.3390/molecules27093031
Chicago/Turabian StyleFischle, Alica, Rico Schwarz, Franziska Wendt, Marcel Kordt, Robert Ramer, Lars Boeckmann, Martin Hein, Peter Langer, Steffen Emmert, Brigitte Vollmar, and et al. 2022. "A Sensitive LC-MS/MS Method for the Simultaneous Determination of Two Thia-Analogous Indirubin N-Glycosides and Indirubin-3′-Monoxime in Plasma and Cell Culture Medium" Molecules 27, no. 9: 3031. https://doi.org/10.3390/molecules27093031
APA StyleFischle, A., Schwarz, R., Wendt, F., Kordt, M., Ramer, R., Boeckmann, L., Hein, M., Langer, P., Emmert, S., Vollmar, B., & Hinz, B. (2022). A Sensitive LC-MS/MS Method for the Simultaneous Determination of Two Thia-Analogous Indirubin N-Glycosides and Indirubin-3′-Monoxime in Plasma and Cell Culture Medium. Molecules, 27(9), 3031. https://doi.org/10.3390/molecules27093031