Article

Multi-Element Analysis and Origin Discrimination of Panax notoginseng Based on Inductively Coupled Plasma Tandem Mass Spectrometry (ICP-MS/MS)

1
State Key Laboratory for Conservation and Utilization of Bio-Resources in Yunnan, National Engineering Research Center for Applied Technology of Agricultural Biodiversity, College of Plant Protection, Yunnan Agricultural University, Kunming 650201, China
2
Laboratory for Quality Control and Traceability of Food and Agricultural Products, Tianjin Normal University, Tianjin 300387, China
3
Department of Animal Science, Division of Agriculture, University of Arkansas, Fayetteville, AR 72701, USA
4
Key Laboratory for Forest Resources Conservation and Utilization in the Southwest Mountains of China, Ministry of Education, Southwest Landscape Architecture Engineering Research Center of National Forestry and Grassland Administration, Southwest Forestry University, Kunming 650224, China
5
The Animal, Plant & Foodstuff Inspection Center, Tianjin Customs, Tianjin 300387, China
6
Department of Chemistry, College of Science, King Saud University, Riyadh 11451, Saudi Arabia
7
School of Life Sciences, Pharmacy and Chemistry, Kingston University London, Penrhyn Road, Kingston upon Thames KT1 2EE, UK
*
Authors to whom correspondence should be addressed.
These authors contributed equally to this work.
Molecules 2022, 27(9), 2982; https://doi.org/10.3390/molecules27092982
Submission received: 11 April 2022 / Revised: 29 April 2022 / Accepted: 3 May 2022 / Published: 6 May 2022

Abstract

:
Panax notoginseng is an important functional health product, and has been used worldwide because of a wide range of pharmacological activities, of which the taproot is the main edible or medicinal part. However, the technologies for origin discrimination still need to be further studied. In this study, an ICP-MS/MS method for the accurate determination of 49 elements was established, whereby the instrumental detection limits (LODs) were between 0.0003 and 7.716 mg/kg, whereas the quantification limits (LOQs) were between 0.0011 and 25.7202 mg/kg, recovery of the method was in the range of 85.82% to 104.98%, and the relative standard deviations (RSDs) were lower than 10%. Based on the content of multi-element in P. notoginseng (total of 89 mixed samples), the discriminant models of origins and cultivation models were accurately determined by the neural networks (prediction accuracy was 0.9259 and area under ROC curve was 0.9750) and the support vector machine algorithm (both 1.0000), respectively. The discriminant models established in this study could be used to support transparency and traceability of supply chains of P. notoginseng and thus avoid the fraud of geographic identification.

Graphical Abstract

1. Introduction

Sanqi (Panax notoginseng (Burk.) F. H. Chen) is a perennial herb belonging to the genus Panax and is considered an evolutionary remnant that originated in areas ranging from East Asia to North America in the tertiary tropical mountainous area 25 million years ago. Today, its modern distribution center is located in Yunnan, China [1], and it has been widely used in medicine, health care, cosmetics, and other industries. P. notoginseng has a wide range of pharmacological activities, including cardiovascular protection [2], anti-atherosclerotic activity [3], and anti-tumor activity [4], with the cardiovascular impact being the most prominent. Therefore, it is a key component of many Chinese medicines which has been used worldwide and is of significant economic value [5]. At present, the main cultivation model of P. notoginseng is monoculture in field or greenhouses, imitating conventional crops [6]. The cultivation model in forest, with a high level of biodiversity, can supply a suitable growing environment that can use allelopathy to stimulate the plant’s growth and prevent pests and diseases [7,8]. Forest cultivation is a developing planting model that is used to improve the quality and safety of medicinal herbs [7,9,10]. Therefore, it is highly necessary to establish discrimination methods for P. notoginseng from different cultivation models.
Due to the presence of fraudulent practices of commodity identification, there is an urgent need to strengthen the testing and certification of foods, as well to use discriminatory science and technology for their regulation and verification, such as chemical analysis [11,12] and molecular detection [13,14]. A geographical indication (GI) has been introduced by farmers, manufacturers, or governments to protect agricultural products or foods, and the quality of food in a particular region is considered the best and most distinctive by consumers, especially in the field of herbal medicines [12,15,16]. At present, the origin traceability methods in food mainly include stable isotopes [17,18], multi-element composition [19,20], the characteristic content of organic components [21,22], near-infrared spectra [23,24], and high-throughput sequencing [25]. Among these, methods for origin tracing through taking advantage of multi-element are increasingly used because of their stability and accuracy. Multi-element composition can be determined in commodities, such as wine [26,27], tea [28,29], coffee [30], olive oil [31], and octopus [32], and is also used in the origin discrimination of P. notoginseng [33]. The methods used to determine content of elements in P. notoginseng include atomic absorption spectroscopy (AAS) [34], atomic fluorescence spectrometry (AFS) [35], inductively coupled plasma optical emission spectrometer (ICP-OES) [36], and inductively coupled plasma mass spectrometry (ICP-MS) [30]. However, these methods suffer from some common problems that hamper the rapid determination of multi-element composition in P. notoginseng, and affect their accuracy and traceability. In terms of multi-element determination, ICP-MS/MS reduces elemental interference [37] and has higher accuracy and greater diversity of elements compared to other methods [38,39].
In order to obtain higher accuracy and greater diversity of the content of multi-element in P. notoginseng, this study established the ICP-MS/MS method for 49 elements. Then, the accumulation dynamics of elements in P. notoginseng after transplanting were analyzed for guiding the addition of elements during the growth of P. notoginseng. Further, based on the content of multi-element in P. notoginseng samples (including five growing origins and two cultivation models), various modeling algorithms, such as partial least squares discriminant analysis (PLS-DA), logistic regression (LR), linear discriminant analysis (LDA), random forest (RF), the Naive Bayes algorithm (NB), k-nearest neighbors (kNNs), support vector machines (SVMs), and neural networks (NNs), were used to train and predict the discriminant model of origins and cultivation models for screening out the model that could determine origin and cultivation type accurately. This study could provide support for the transparency and traceability of supply chains of P. notoginseng and thus effectively avoid the occurrence of the fraud of geographical indications.

2. Results

2.1. Analytical Performance of the ICP-MS/MS for P. notoginseng

The procedure for the determination of multi-element in P. notoginseng samples by ICP-MS/MS was evaluated for its linearity, detection, and quantification limits (respectively, LODs and LOQs), as well as its accuracy and precision (Table S1, Supplementary Materials). The calibration curves for all the elements revealed a good linearity over the entire range of concentrations, with coefficients of determinations (R2) higher than 0.99, between 0.9919 and 0.9997. The instrumental LODs of ICP-MS/MS were between 0.0003 mg/kg (for 200Hg) and 7.716 mg/kg (for 44Ca); moreover, the LOQs were between 0.0011 mg/kg and 25.7202 mg/kg. The method proposed in this work showed good sensitivity for multi-element determination in P. notoginseng samples. The average recoveries of multi-element in P. notoginseng were in the range between 85.82% and 104.98% (Table S2); the relative standard deviation (RSDs) was in the range of 1.56%–9.70%, lower than 10%. Considering these results, it was concluded that this method had high accuracy and met the requirements of analyzing and measuring the content of multi-element in P. notoginseng.

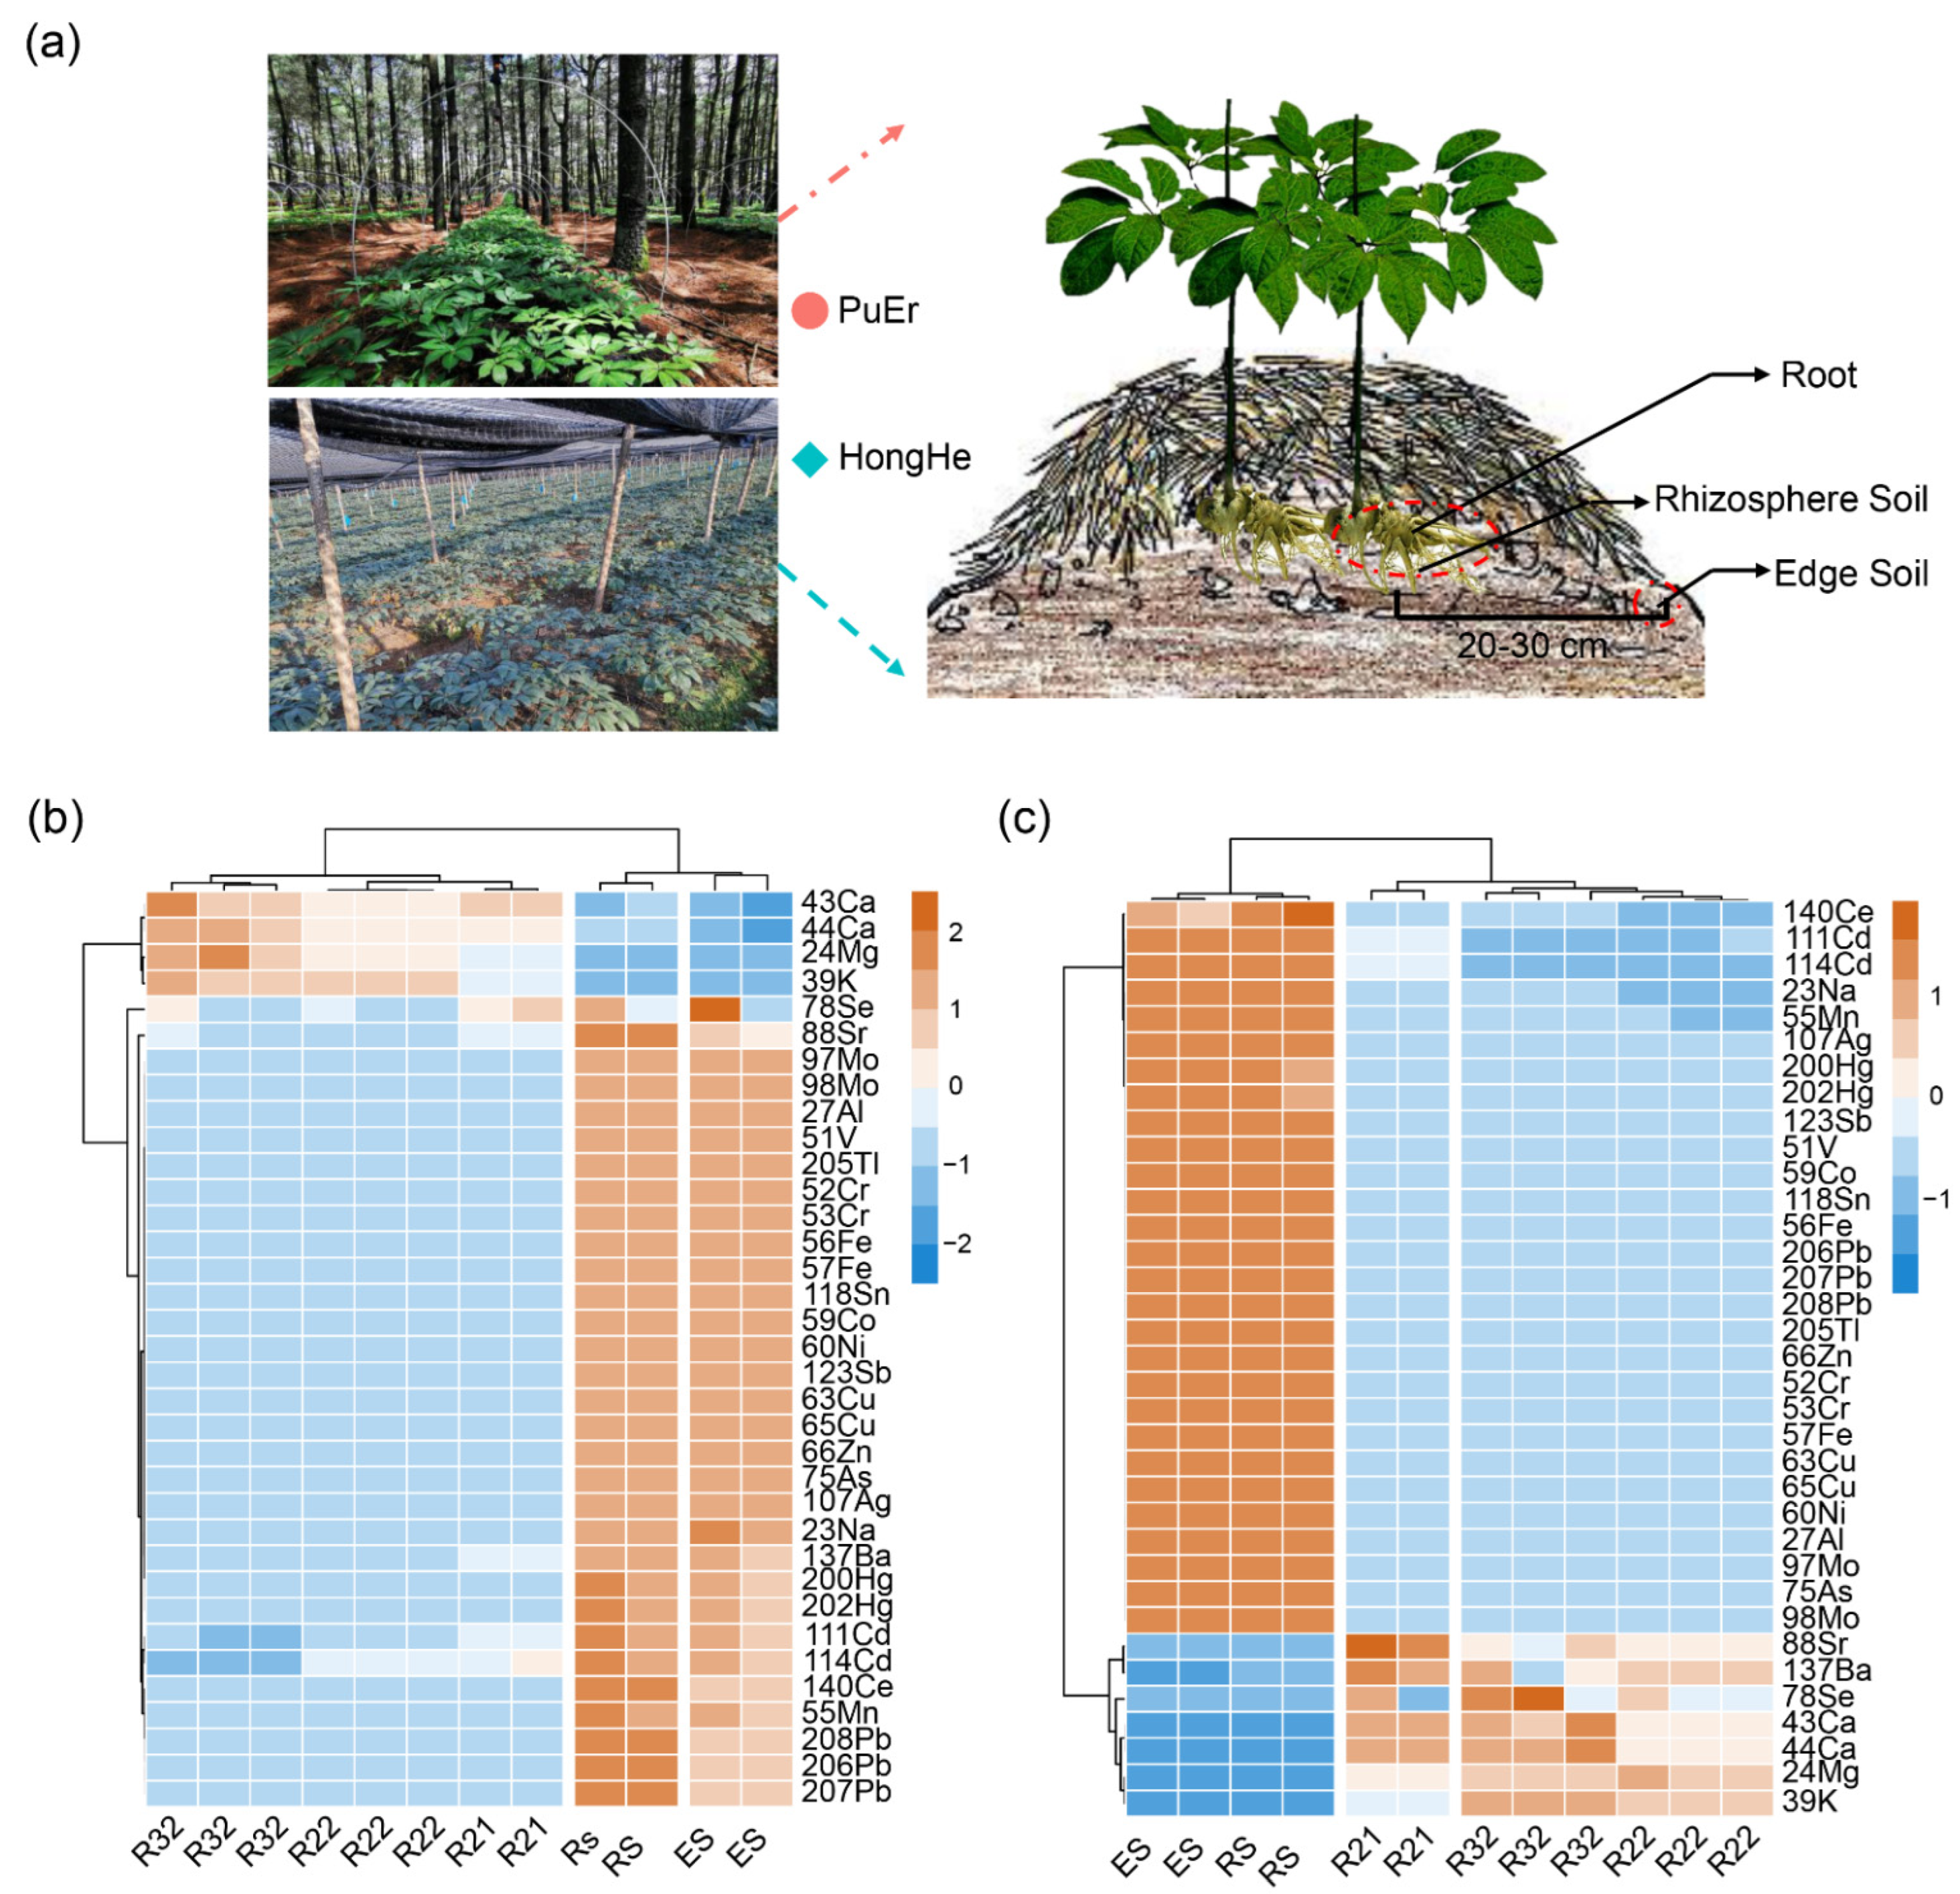
2.2. The Accumulation Dynamics of Elements during the Growth of P. notoginseng

The multi-element (total of twenty-six) determination of P. notoginseng (different time points in the same planting base) and soil (first sampling) was accomplished by the established ICP-MS/MS method. The heatmap of the multi-element content changes at different times (Figure 1b,c) showed that the contents of Ca, K, and Mg in P. notoginseng were significantly higher than those in soil, while the contents of other elements were lower than those in soil. With the growth extension, there was a trend of accumulation in the contents of Ca, K, and Mg in P. notoginseng, indicating a relatively large demand for these three elements during the growth process, which was consistent with the previous report [36].

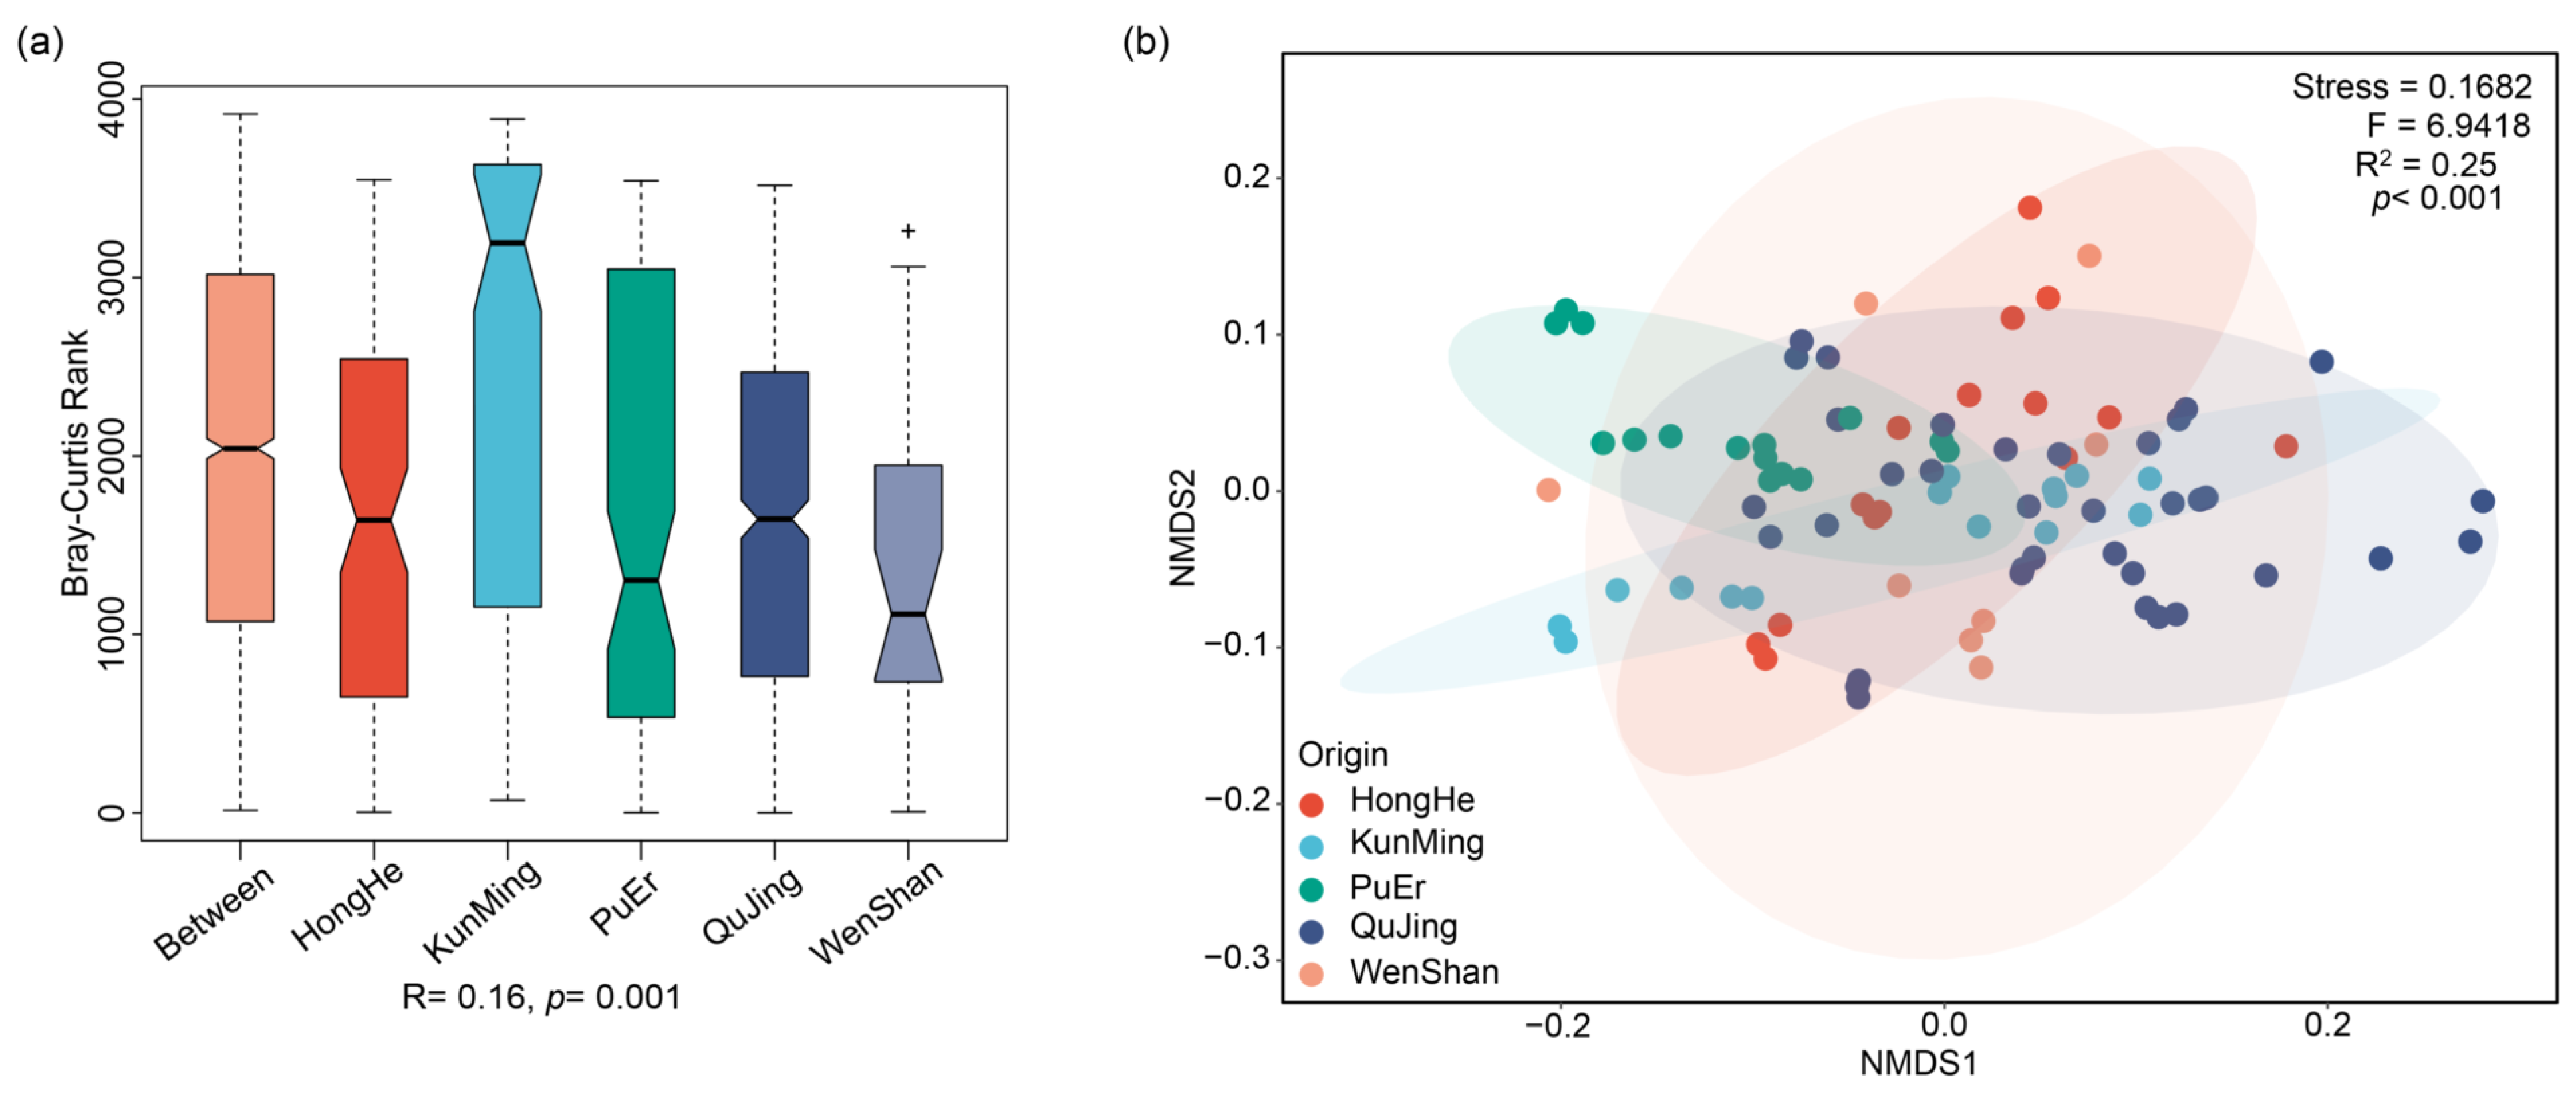
2.3. Modeling Analysis of P. notoginseng from Different Origins

The multi-element determination of P. notoginseng samples, collected from different growing origins, was carried out by the established ICP-MS/MS method. By performing a Duncan’ test analysis on the multi-element determination results (Table S3), the content of 23Na, 55Mn, 60Ni, 75As, 88Sr, 97Mo, 98Mo, 118Sn, 200Hg, 202Hg, 205Tl, and 232Th had no significant difference between different origins (p > 0.05); the remaining 35 elements had significant differences between different origins. Based on the results of the analysis of similarities (ANOSIM, using Bray–Curtis similarity distance matrix) of the multi-element content from five origins (Figure 2a), R was 0.16 (p = 0.001), which showed that the differences in the content of multi-element from different origins were significantly greater than the differences between samples within the origin; thus, the grouping between different origins was reasonable. At the same time, the results of the non-metric multidimensional scaling (NMDS, using the Bray–Curtis similarity distance matrix) of the multi-element content from five origins (Figure 2b) (PERMANOVA analysis, F-value: 6.9418, R-squared: 0.25, p-value: < 0.001, stress: 0.1682) showed that there were significant differences in the content of multi-element in P. notoginseng from different origins, and the results of multi-element could be used to discriminate P. notoginseng from different origins.
There were seven machine learning algorithms, such as PLS-DA, LDA, RF, NB, kNNs, SVMs, and NNs, which were used to construct and evaluate the discriminative models of different origins based on the content of multi-element in P. notoginseng. The data were preprocessed, and the training and prediction sets were grouped (2:1). Then, the model was trained, blindly evaluated, and evaluated with the area under the ROC curve (AUC) (Table 1). The accuracy of NNs was 0.9259, the AUC value was 0.9750, and the p-value [Acc > NIR] was 2.32 × 10⁻⁸ < 0.0001, which were all significantly better than other algorithms. The sensitivity and specificity of five origins were also higher than other algorithms, indicating that the prediction model of origin discrimination by the NNs algorithm in this study could be applied to the discrimination of different origins of P. notoginseng.

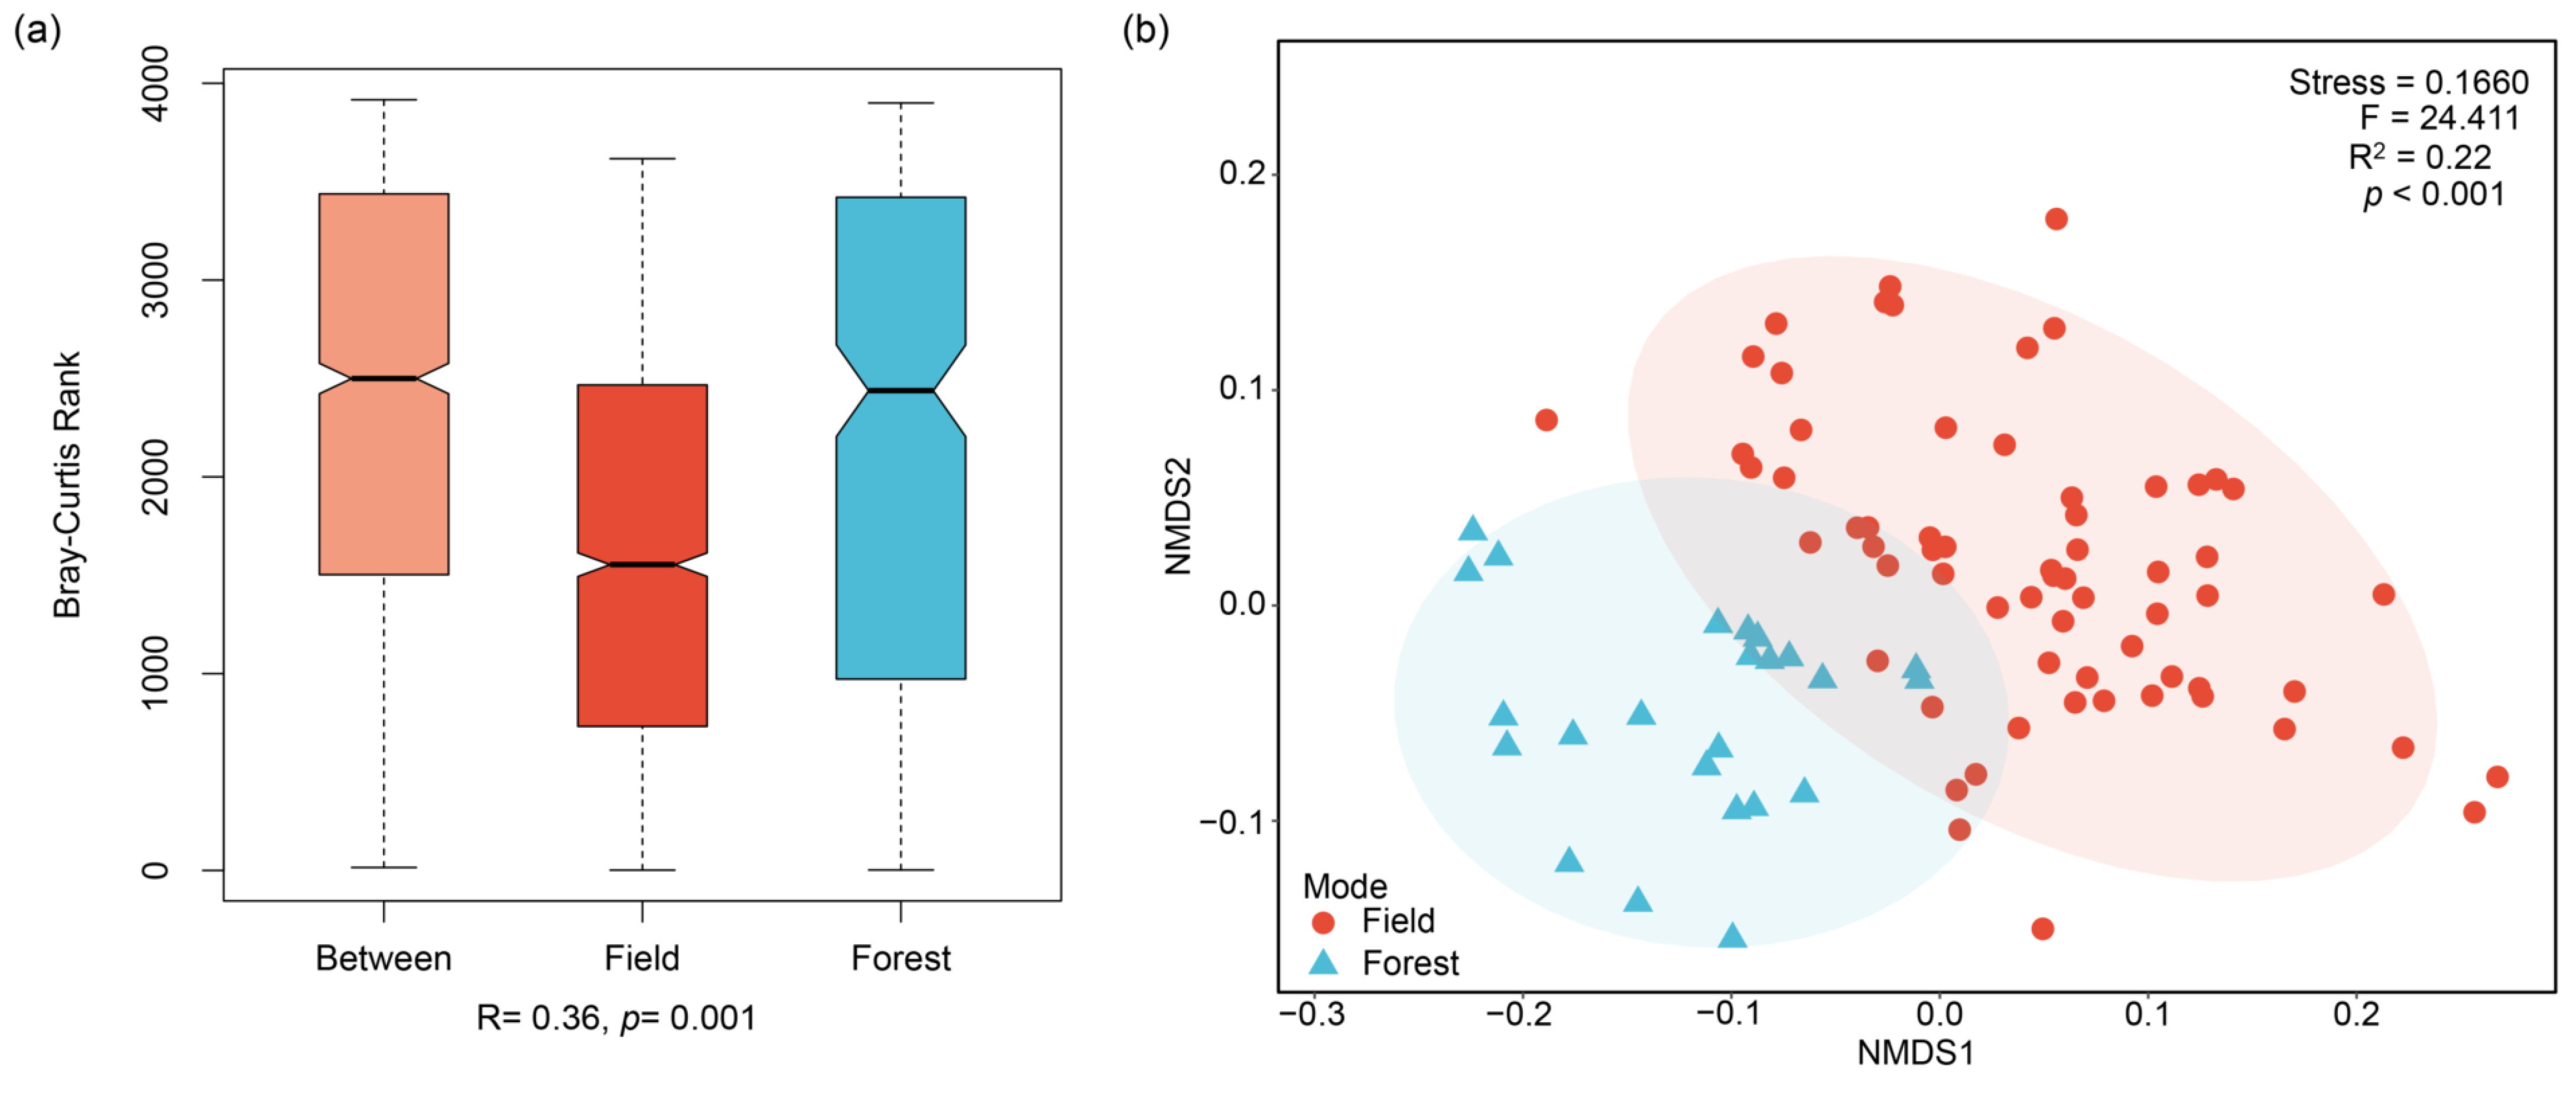
2.4. Modeling Analysis of P. notoginseng from Different Cultivation Models

The multi-element determination of P. notoginseng, collected from different cultivation models (field and forest), was accomplished by the established ICP-MS/MS method. After performing a T’ test analysis on the determination results of multi-element (Table S4), the contents of 23Na, 60Ni, 63Cu, 65Cu, 88Sr, 97Mo, 98Mo, 118Sn, 153Eu, 200Hg, 202Hg, 205Tl, and 232Th had no significant difference between the different models (ns). The contents of 24Mg, 43Ca, 44Ca, 66Zn, 107Ag, and 137Ba in P. notoginseng in the forest model were significantly higher than those in the field model. However, the remaining 30 elements had the opposite results. The results of the ANOSIM analysis (using the Bray–Curtis similarity distance matrix) of the content of multi-element in P. notoginseng from different cultivation models (Figure 3a), where R was 0.36 (p = 0.001), showed that the differences in the content of multi-elements from different cultivation models were significantly greater than the differences between samples within the model; thus, the grouping between different models was reasonable. NMDS analysis (using the Bray–Curtis similarity distance matrix) was carried out (Figure 3b) (PERMANOVA analysis, F-value: 24.411, R-squared: 0.22, p-value: < 0.001, stress: 0.1660), which showed that there were significant differences in the multi-element content of P. notoginseng from different models, and multi-element results could be used to discriminate P. notoginseng from different cultivation models.
There were eight machine learning algorithms, such as PLS-DA, LR, LDA, RF, NNs, kNNs, NB, and SVMs, which were used to construct and evaluate the discriminative models of different cultivation models based on the content of multi-element in P. notoginseng. The data were preprocessed, and the training and the prediction sets were grouped (7:3). Then, the model was trained, blindly evaluated, and evaluated with AUC (Table 2). The p-values [Acc > NIR] of PLS-DA, RF, and SVMs algorithms were <0.05, which showed that the prediction accuracies of these three models were significant. The accuracy and AUC of SVMs were both 1.0000 (best performance), indicating that the prediction model of cultivation model discrimination by the SVMs algorithm in this study could be applied to the discrimination of P. notoginseng in field or forest.

3. Discussion

In general, the content of multi-element in foods, especially agricultural products, may vary depending on factors, such as fertilizers, climatic conditions in the year of cultivation, differences in soil types, field history, and species in a single field [40], and is less affected by the processing process and storage time [41]. Therefore, multi-element can serve as a good geographical tracer as their distribution in the final product reflects the elemental signature in the soil of origin [36,42]. In this experiment, the ICP-MS/MS method was established to determine the content of 49 elements in P. notoginseng from different origins and cultivation models. Compared with the previous research methods [33,34,35,36], the ICP-MS/MS method in this work had good accuracy and sensitivity for multi-element determination in P. notoginseng. Moreover, the accumulation dynamics of multi-element of P. notoginseng after transplanting was analyzed, which showed that it had a relatively large demand for Ca, K, and Mg during the growth process, which may be due to the fact that Ca can ensure cell life activity, K can promote photosynthesis and increase plant resistance, and Mg is involved in plant photosynthesis and is an activator or component of many enzymes [43].
P. notoginseng has been used worldwide, is of significant economic value, is a significantly geographical indication product [33], and may have higher quality and safety when planted in forest [7,9]. Therefore, it is highly necessary to establish discrimination methods for P. notoginseng from different origins and cultivation models. In the field of data mining, many mistakes would be made throughout the analyses or attempting to establish relationships between multiple features. The chemometrics is a powerful tool in applying data mining, and thus can effectively solve the above problems [44,45], which can be divided into unsupervised algorithms and supervised algorithms. Among them, the supervised algorithms are used to classify samples into predefined classes, which is more helpful for the establishment of models [46,47]. In this study, the origin discriminant model using the NNs algorithm and the cultivation mode model using the SVMs algorithm were achieved based on the content of 49 elements in P. notoginseng. NNs, a series of algorithms that mimic the operations of a human brain to recognize relationships between vast amounts of data [48], was also used. At present, the study of geographical discrimination of edible oils [49], honey [50], French red wines [51], pork [52], and so on, had also proved that this algorithm could effectively help to establish the origin discrimination model. As one of the most popular supervised algorithms, SVMs was used to create the best line or decision boundary that can segregate n-dimensional space into classes; thus, easily put, the new data point toward the correct category in the future [53]. At present, the study of geographical discrimination of millet [54], Curcumae Radix [55], Angelicae Sinensis Radix [56], vegetables [57], and so on had also proved that this algorithm could effectively help to establish the discrimination model.

4. Material and Methods

4.1. Chemicals and Reagents

Nitric acid 65% (HNO3) was purchased from Merck, USA, and hydrofluoric acid 49% (HF) was purchased from Aladdin Reagent Corporation, China. Ultrapure deionized water (ddH2O) with a resistivity of 18.2 MΩ cm was obtained from a Milli-Q Plus water purification system (Millipore, Bedford, MA, USA).
Twenty-six multielement standard solutions (Na, Mg, K, Ca, Fe (1000 μg/mL), Sr (100 μg/mL), Al, V, Cr, Mn, Co, Ni, Cu, Zn, As, Se, Mo, Ag, Cd, Sb, Sn, Ba, Pb, Tl, Th, and U (10 μg/mL)), a single-element Hg standard solution, and seventeen rare-earth elements (Ce, Dy, Er, Eu, Gd, Ho, La, Lu, Nd, Pr, Sc, Sm, Tb, Th, Tm, Y, and Yb (10 μg/mL each)) were provided by Agilent Technologies Company.

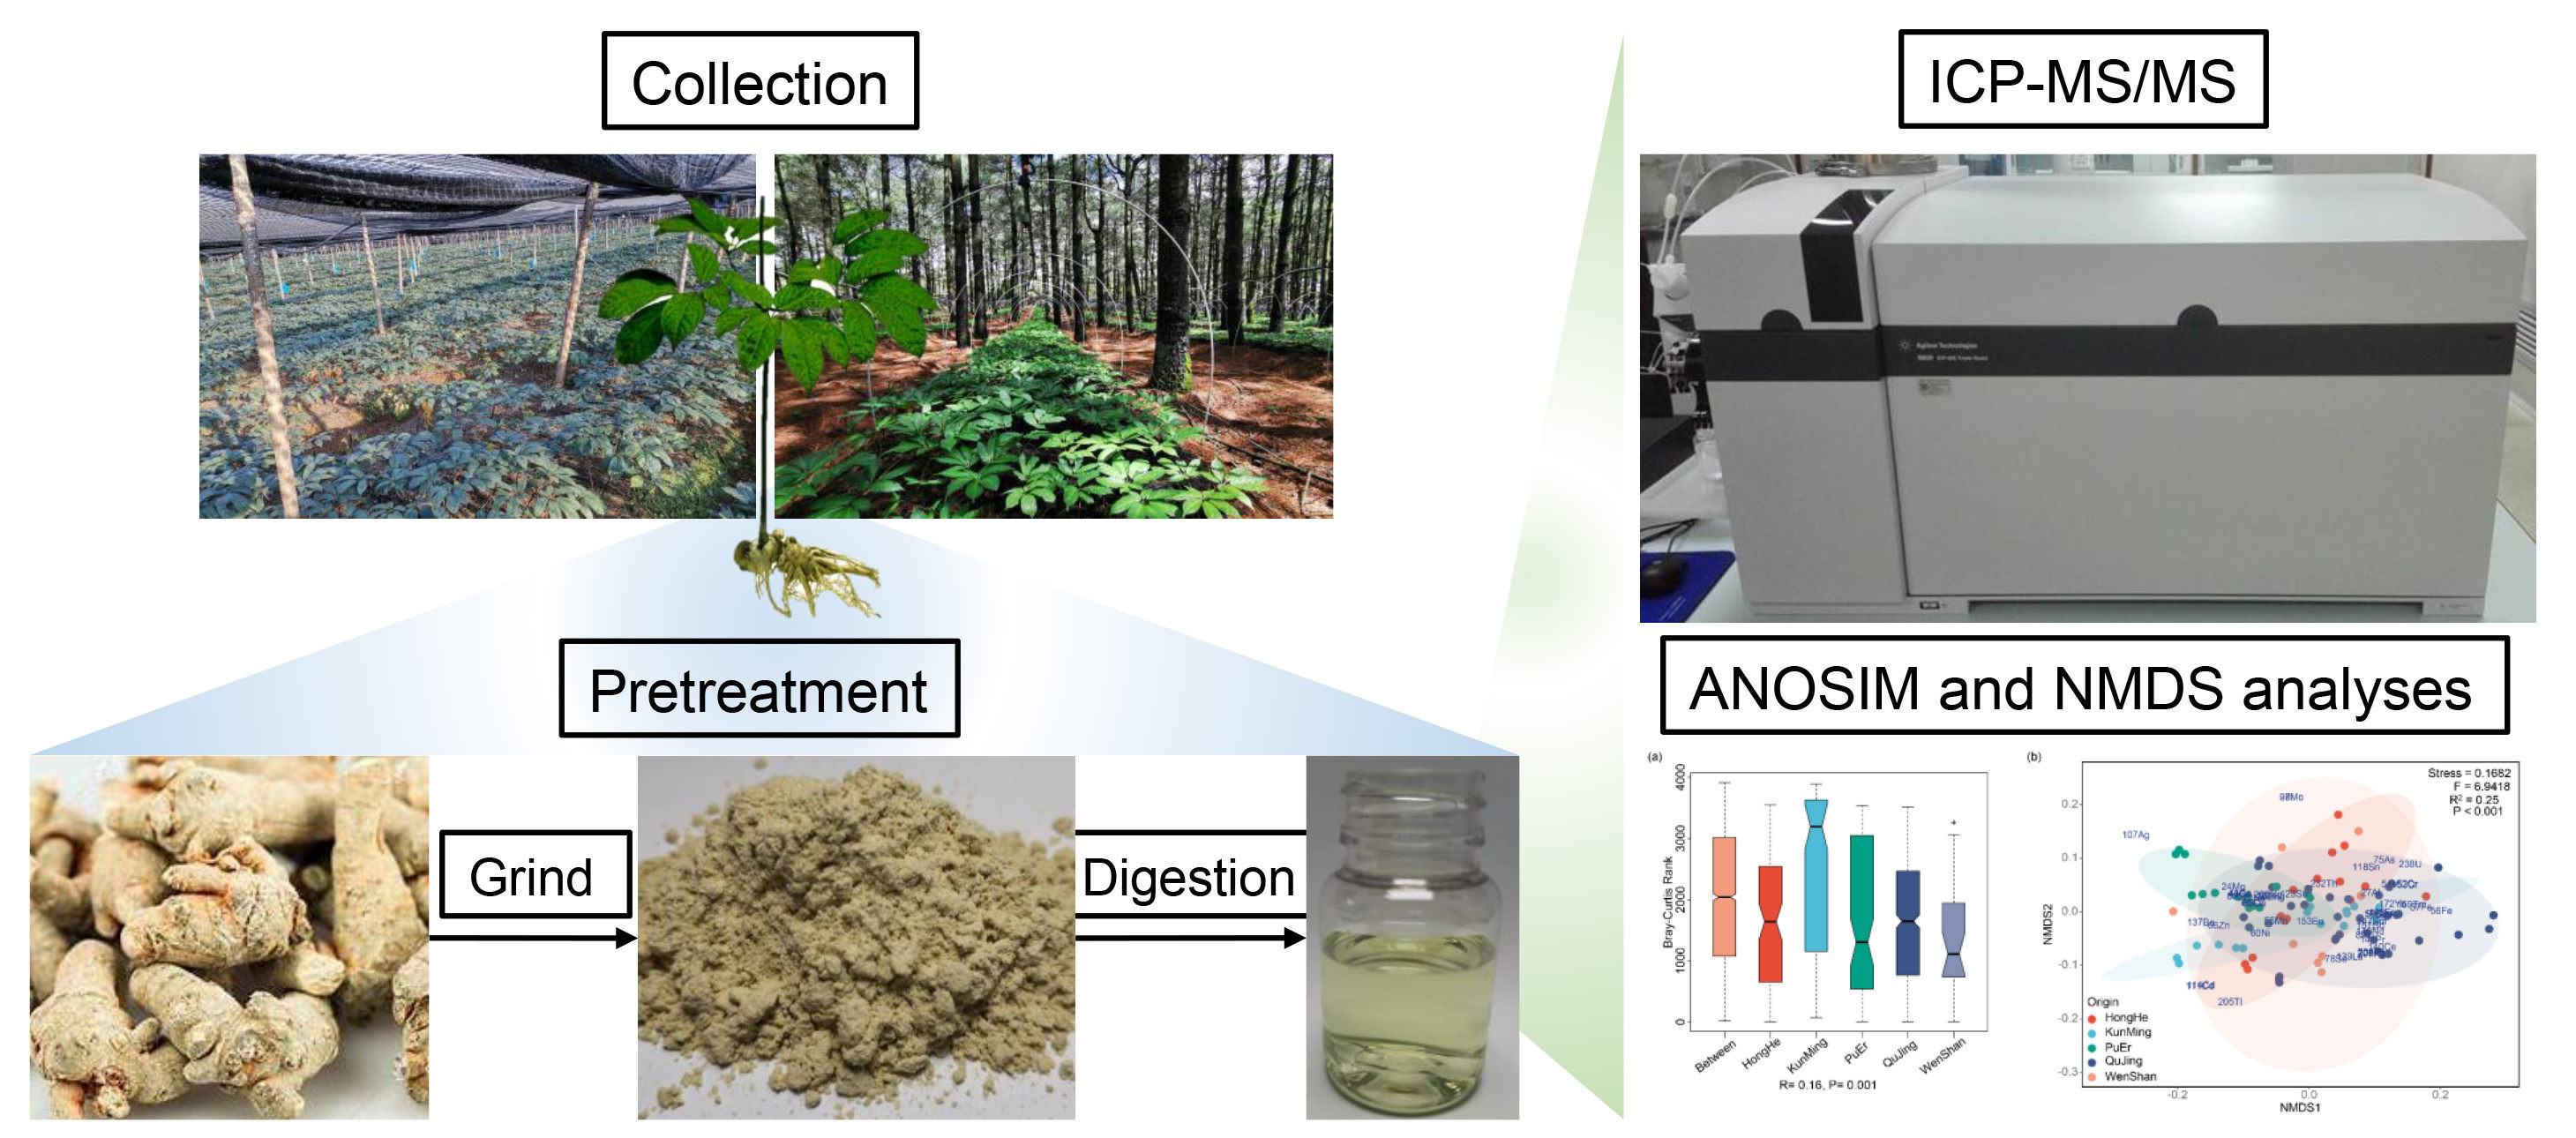
4.2. Collection and Pretreatment of P. notoginseng

P. notoginseng samples (a total of 89 mixed samples) were collected from the main planting origins in Yunnan Province, China, in 2019 and 2020. The sampling points were shown in Table S5 (a total of 30 sampling bases), which included both the five main planting origins (WenShan, QuJing, HongHe, KunMing, and PuEr) and the cultivation model in field and forest of P. notoginseng. Each planting base was randomly sampled at three points, and eight or ten P. notoginseng samples were collected at each point as mixed samples. Then, the collected roots of P. notoginseng were washed with clean water, dried at 60 °C, coarsely crushed, ground to ultrafine powder with a Planetary Mono Mill (PULVERISETTE 6, Fritsch, Idar-Oberstein, Germany), and then passed through a 60 mesh sieve.
In addition, in order to study the accumulation dynamics of multi-element (not rare earth elements) in P. notoginseng after transplanting, two planting bases, PuEr (forest model) and HongHe (field model), were selected, and samples were collected in August 2019, November 2019, and November 2020, respectively. A three-point random sampling method was adopted for each base. Ten P. notoginseng plants were collected from each sampling point and 100 g of rhizosphere soil and edge soil was also collected during the first sampling. Then, samples from three points were mixed as the same treatment. The P. notoginseng samples were pretreated by the same method. Next, the soils were naturally dry and then passed through a 60 mesh sieve.

4.3. Microwave-Assisted Acid Digestion Procedure

All glassware and polytetrafluoroethylene (PTFE) tubes were immersed in a 10% (v/v) HNO3 solution for 48 h, followed by a minimum of three rinses with ddH2O, before being dried and finally stored ready for use [58]. A Multiwave PRO microwave digestion system (AntonPaar, Ashland, VA, USA) was used for the digestion of samples.
Soil: About 0.1 g of each soil sample was weighed and mixed with 4 mL of HNO3 and 2 mL of HF, and pre-digested at 130 °C for 30 min. The samples were then processed by microwave digestion with a ramped-up temperature from ambient to 130 °C over 10 min and held for 5 min, followed by a ramped-up temperature to 195 °C over 10 min and held for 20 min. After digestion, the solutions were evaporated to near dryness and cooled to room temperature. A negative control (no sample) was provided for each series of digestions.
P. notoginseng: About 0.4 g of each homogenized sample was weighed and mixed with 6 mL of HNO3, and pre-digested at 130 °C for 30 min. The samples were then processed by microwave digestion with a ramped-up temperature from ambient to 120 °C over 10 min and held for 2 min, followed by a ramped-up temperature to 190 °C over 4 min and held for 20 min. After digestion, the solutions were cooled to room temperature. A negative control (no sample) was provided for each series of digestions. Both digested samples and blanks were diluted to 50 mL with ddH2O and analyzed by ICP-MS/MS.

4.4. ICP-MS/MS Analysis

The concentration of 49 elements (23Na, 24Mg, 27Al, 39K, 43Ca, 44Ca, 51V, 52Cr, 53Cr, 55Mn, 56Fe, 57Fe, 59Co, 60Ni, 63Cu, 65Cu, 66Zn, 75As, 78Se, 88Sr, 89Y, 97Mo, 98Mo, 107Ag, 111Cd, 114Cd, 118Sn, 123Sb, 137Ba, 139La, 140Ce, 141Pr, 146Nd, 147Sm, 153Eu, 157Gd, 163Dy, 165Ho, 166Er, 169Tm, 172Yb, 200Hg, 202Hg, 205Tl, 206Pb, 207Pb, 208Pb, 232Th, and 238U) in P. notoginseng was determined by ICP-MS/MS (Agilent 8800, Tokyo, Japan). The calibration standard solutions were prepared in the range of 0–4 μg/mL for 23Na, 24Mg, 39K, 43Ca, 44Ca, 56Fe, and 57Fe; 0–400 ng/mL for 27Al, 66Zn, 88Sr, and 118Sn; 0–40 ng/mL for 51V, 52Cr, 53Cr, 55Mn, 59Co, 60Ni, 63Cu, 65Cu, 75As, 78Se, 89Y, 97Mo, 98Mo, 107Ag, 111Cd, 114Cd, 123Sb, 137Ba, 146Nd, 147Sm, 153Eu, 157Gd, 163Dy, 166Er, 172Yb, 205Tl, 206Pb, 207Pb, 208Pb, 232Th, and 238U; 0–12.5 ng/mL for 139La, 140Ce, 141Pr, 165Ho, and 169Tm; and 0–8 ng/mL for 200Hg and 202Hg. A mixed internal standard (ISTD) solution with a concentration of 50 ng/mL Sc, Ge, In, and Bi was used to correct changes in the sample uptake rate and plasma conditions for the ICP-MS/MS [59]. Through the tuning program, the operational mode of He and no gas mode were optimized. The instrument’s other conditions of ICP-MS/MS were shown in Table S6.
The multi-element calibration solutions were prepared at different concentration levels using 5% HNO3 media to match the sample matrix. By analyzing the experimental data, a linear fitting standard curve with the X-axis as the concentration point and the Y-axis as the response value was created. Using this standard curve, a background equivalent concentration of the analysis element was obtained by calculating the element standard deviation. LODs were calculated as (3 σ/k) and the LOQs were calculated as (10 σ/k), where standard deviation (σ) was the standard deviation of the blank signal (n = 11) and k was the slope of the calibration line [33,60]. Then, the accuracy of the method was estimated using analytical recovery, which was evaluated by adding the standard solutions with two different concentration levels (high and low) to P. notoginseng samples. These samples were both digested and analyzed in triplicate by ICP-MS/MS [22].

4.5. Statistical Analysis

All statistical analyses were conducted in the R software environment (v4.1.2; http://www.r-project.org/, accessed on 18 January 2022). Most of the results were visualized using the ‘ggplot2′ package [61], unless otherwise indicated. The experimental data were expressed as mean ± S.E.M, and recorded in Excel 2019 (Microsoft); then, the significance analysis was performed using the ‘agricolae’ package [62] and ‘ggpubr’ package [63] for Duncan’s test and T’test, respectively. The permutational multivariate analysis of variance (PERMANOVA), Anosim, and NMDS were performed using the ‘vegan’ package [64]. Heatmaps were illustrated based on Z-score-normalized relative abundance of taxa using the ‘pheatmap’ package [65]. Discriminative models for P. notoginseng were trained and predicted using the ‘Caret’ package [66]. In the field of data mining, supervised algorithms were used to classify samples into predefined classes. This was helpful for the establishment of models [47], such as PLS-DA, LR, LDA, RF, NB, kNNs, SVMs, and NNs.

5. Conclusions

The discriminant models established in this study could be used to support transparency and traceability of supply chains of P. notoginseng and thus avoid the fraud of geographic identification. This study contributes toward generalizing the multi-element analysis coupled with chemometrics as a promising tool for discriminating the origin of medicinal herbs and food, and provides technical support for the relevant research of the origin discrimination.

Supplementary Materials

The following supporting information can be downloaded at: https://www.mdpi.com/article/10.3390/molecules27092982/s1. Table S1: Linear ranges, equations, correlation coefficients (R2), LODs, and LOQs of the ICP-MS/MS for the determination of multi-elements in P. notoginseng, Table S2: The spike recovery and reproducibility of P. notoginseng (n = 3), Table S3: Multi-element contents and comparison results using Duncan’test for P.notoginseng of different geographical origins (mg/kg), Table S4: Multi-element contents and comparison results using T’test for P.notoginseng of different cultivation models (mg/kg), Table S5: The allocation of sampling areas for the P. notoginseng in Yunnan province, China, Table S6: Agilent 8800 ICP-MS/MS operating parameters.

Author Contributions

C.J.: formal analysis, investigation, methodology, validation, visualization, writing—original draft, and writing—review and editing. J.L. (Jinyu Liu): formal analysis, investigation, visualization, and writing—original draft. Q.Z.: formal analysis and writing—review and editing. J.L. (Juan Li): investigation and methodology. Z.W.: validation and visualization. X.W.: investigation. Y.X.: methodology and validation. J.Z.: formal analysis and writing—review and editing. R.S.: formal analysis. X.M.: methodology and validation. M.R.K.: validation, funding acquisition, and writing—review and editing. R.B.: validation and writing—review and editing. X.H.: funding acquisition, supervision, and writing—review and editing. Y.Z.: conceptualization and supervision. S.Z.: conceptualization, funding acquisition, supervision, and writing—review and editing. W.Z.: conceptualization, funding acquisition, supervision, and writing—review and editing. All authors have read and agreed to the published version of the manuscript.

Funding

The research was funded by the Major Science and Technology Project of Yunnan and Kunming, Grant Numbers: 202102AE090042, 202102AA310048-2 and 2019ZG00901; the Major Science and Technology Project of Kunming, Grant Numbers: 2021JH002; the Innovative Research Team of Science and Technology in Yunnan Province, Grant Numbers: 202105AE160016; Tianjin Normal University, Grant Numbers: 046180201 and 135305YJ01; China Agriculture Research System, Grant Numbers: CARS-21; and the Researchers Supporting Project Number (RSP-2021/138), King Saud University, Riyadh, Saudi Arabia.

Institutional Review Board Statement

Not applicable.

Informed Consent Statement

Not applicable.

Data Availability Statement

The data presented in this study are available in this article and supplementary material.

Conflicts of Interest

The authors declare that they have no known competing financial interest or personal relationships that could have appeared to influence the work reported in this paper.

Sample Availability

Samples of the compounds are not available from the authors.

References

  1. Yue, J.; Zuo, Z.; Huang, H.; Wang, Y. Application of Identification and Evaluation Techniques for Ethnobotanical Medicinal Plant of Genus Panax: A Review. Crit. Rev. Anal. Chem. 2021, 51, 373–398. [Google Scholar] [CrossRef] [PubMed]
  2. Chen, S.; Wu, Y.; Qin, X.; Wen, P.; Liu, J.; Yang, M. Global gene expression analysis using RNA-seq reveals the new roles of Panax notoginseng saponins in ischemic cardiomyocytes. J. Ethnopharmacol. 2021, 268, 113639. [Google Scholar] [CrossRef] [PubMed]
  3. Yuan, Z.; Liao, Y.; Tian, G.; Li, H.; Jia, Y.; Zhang, H.; Tan, Z.; Li, X.; Deng, W.; Liu, K.; et al. Panax notoginseng saponins inhibit zymosan a induced atherosclerosis by suppressing integrin expression, FAK activation and NF-κB translocation. J. Ethnopharmacol. 2011, 138, 150–155. [Google Scholar] [CrossRef] [PubMed]
  4. Tan, M.-M.; Chen, M.-H.; Han, F.; Wang, J.W.; Tu, Y.X. Role of Bioactive Constituents of Panax notoginseng in the Modulation of Tumorigenesis: A Potential Review for the Treatment of Cancer. Front. Pharmacol. 2021, 12, 738914. [Google Scholar] [CrossRef] [PubMed]
  5. Liao, P.; Liu, P.; Wang, Y.; Huang, C.; Lan, L.; Yang, Y.; Cui, X. Stereoscopic cultivation of Panax notoginseng: A new approach to overcome the continuous cropping obstacle. Ind. Crop. Prod. 2018, 126, 38–47. [Google Scholar] [CrossRef]
  6. Wang, Y.L.; Cui, X.M.; Lan, L.; Chen, W.D.; Li, R.B.; Wang, C.X.; Yang, X.Y.; Liu, D.H.; Yang, Y. Light and temperature and their effects on photosynthesis characteristics of stereoscopic cultivation in Panax notoginseng. China J. Chin. Mater. Med. 2015, 15, 2921–2929. [Google Scholar] [CrossRef]
  7. Ye, C.; Fang, H.Y.; Liu, H.J.; Yang, M.; Zhu, S.S. Current status of soil sickness research on Panax notoginseng in Yunnan, China. Allelopath. J. 2019, 47, 1–14. [Google Scholar] [CrossRef]
  8. Wu, H.; Xia, J.; Qin, X.; Wu, H.; Zhang, S.; Zhao, Y.; Rensing, C.; Lin, W. Underlying Mechanism of Wild Radix pseudostellariae in Tolerance to Disease Under the Natural Forest Cover. Front. Microbiol. 2020, 11, 1142. [Google Scholar] [CrossRef]
  9. Chen, W.; Balan, P.; Popovich, D.G. Ginsenosides analysis of New Zealand-grown forest Panax ginseng by LC-QTOF-MS/MS. J. Ginseng Res. 2020, 44, 552–562. [Google Scholar] [CrossRef]
  10. Zhu, L.; Xu, L.; Dou, D.; Huang, L. The distinct of chemical profiles of mountainous forest cultivated ginseng and garden ginseng based on ginsenosides and oligosaccharides. J. Food Compos. Anal. 2021, 104, 104165. [Google Scholar] [CrossRef]
  11. Ma, G.; Zhang, Y.; Zhang, J.; Wang, G.; Chen, L.; Zhang, M.; Liu, T.; Liu, X.; Lu, C. Determining the geographical origin of Chinese green tea by linear discriminant analysis of trace metals and rare earth elements: Taking Dongting Biluochun as an example. Food Control 2016, 59, 714–720. [Google Scholar] [CrossRef]
  12. Lu, Y.; Yao, G.; Wang, X.; Zhang, Y.; Zhao, J.; Yu, Y.-J.; Wang, H. Chemometric discrimination of the geographical origin of licorice in China by untargeted metabolomics. Food Chem. 2022, 380, 132235. [Google Scholar] [CrossRef] [PubMed]
  13. Wu, Y.H.; Dong, Y.; Shi, Y.C.; Yang, H.; Zhang, J.Q.; Khan, M.R.; Deng, S.; He, G.P.; He, Q.; Lv, Y.P.; et al. CRISPR-Cas12-Based Rapid Authentication of Halal Food. J. Agric. Food Chem. 2021, 35, 10321–10328. [Google Scholar] [CrossRef] [PubMed]
  14. Wu, Y.H.; Liu, J.; Li, H.T.; Zhang, T.; Dong, Y.; Deng, S.; Lv, Y.P.; He, Q.; Deng, R.J. CRISPR-Cas sys-tem meets DNA barcoding: Development of a universal nucleic acid test for food authentication. Sens. Actuators B Chem. 2022, 353, 131138. [Google Scholar] [CrossRef]
  15. Liu, G.; Zhang, Q.; Yin, G.; Musyimi, Z. Spatial distribution of geographical indications for agricultural products and their drivers in China. Environ. Earth. Sci. 2016, 75, 612. [Google Scholar] [CrossRef]
  16. Ndraha, N.; Hsiao, H.-I.; Chih Wang, W.C. Comparative study of imported food control systems of Tai-wan, Japan, the United States, and the European Union. Food Control 2017, 78, 331–341. [Google Scholar] [CrossRef]
  17. Wang, J.; Zhang, T.; Ge, Y. C/N/H/O stable isotope analysis for determining the geographical origin of American ginseng (Panax quinquefolius). J. Food Compos. Anal. 2021, 96, 103756. [Google Scholar] [CrossRef]
  18. Su, Y.-Y.; Gao, J.; Zhao, Y.-F.; Wen, H.-S.; Zhang, J.-J.; Zhang, A.; Yuan, C.-L. Geographical Origin Classification of Chinese Wines Based on Carbon and Oxygen Stable Isotopes and Elemental Profiles. J. Food Prot. 2020, 83, 1323–1334. [Google Scholar] [CrossRef]
  19. Qian, L.; Zuo, F.; Liu, H.; Zhang, C.; Chi, X.; Zhang, D. Determination of Geographical Origin of Wuchang Rice with the Geographical Indicator by Multielement Analysis. J. Food Qual. 2019, 2019, 1–7. [Google Scholar] [CrossRef]
  20. Ng, W.L.; Bay, L.J.; Goh, G.; Ang, T.H.; Kong, K.; Chew, P.; Koh, S.P.; Ch’ng, A.L.; Phang, H.; Chiew, P. Multivariate statistical analysis of stable isotope signatures and element concentrations to differentiate the geographical origin of retail milk sold in Singapore. Food Control 2021, 123, 107736. [Google Scholar] [CrossRef]
  21. Zhang, J.; Tian, Z.; Ma, Y.; Shao, F.; Huang, J.; Wu, H.; Tian, L. Origin Identification of the Sauce-Flavor Chinese Baijiu by Organic Acids, Trace Elements, and the Stable Carbon Isotope Ratio. J. Food Qual. 2019, 2019, 1–7. [Google Scholar] [CrossRef] [Green Version]
  22. Du, M.; Fang, Y.; Shen, F.; Mao, B.; Zou, Y.; Li, P.; Pei, F.; Hu, Q. Multiangle discrimination of geographical origin of rice based on analysis of mineral elements and characteristic volatile components. Int. J. Food Sci. Technol. 2018, 53, 2088–2096. [Google Scholar] [CrossRef]
  23. Chen, H.; Tan, C.; Li, H. Discrimination between wild-grown and cultivated Gastrodia elata by near-infrared spectroscopy and chemometrics. Vib. Spectrosc. 2021, 113, 103203. [Google Scholar] [CrossRef]
  24. Arndt, M.; Drees, A.; Ahlers, C.; Fischer, M. Determination of the Geographical Origin of Walnuts (Juglans regia L.) Using Near-Infrared Spectroscopy and Chemometrics. Foods 2020, 9, 1860. [Google Scholar] [CrossRef] [PubMed]
  25. Gao, F.; Zeng, G.; Wang, B.; Xiao, J.; Zhang, L.; Cheng, W.; Wang, H.; Li, H.; Shi, X. Discrimination of the geographic origins and varieties of wine grapes using high-throughput sequencing assisted by a random forest model. LWT 2021, 145, 111333. [Google Scholar] [CrossRef]
  26. Orellana, S.; Johansen, A.M.; Gazis, C. Geographic classification of U.S. Washington State wines using elemental and water isotope composition. Food Chem. X 2019, 1, 100007. [Google Scholar] [CrossRef]
  27. Leder, R.; Petric, I.V.; Jusup, J.; Banović, M. Geographical Discrimination of Croatian Wines by Stable Isotope Ratios and Multielemental Composition Analysis. Front. Nutr. 2021, 8, 625613. [Google Scholar] [CrossRef]
  28. Wang, Y.; Kang, L.; Zhao, Y.; Xiong, F.; Yuan, Y.; Nie, J.; Huang, L.; Yang, J. Stable isotope and multi-element profiling of Cassiae Semen tea combined with chemometrics for geographical discrimination. J. Food Compos. Anal. 2022, 107, 104359. [Google Scholar] [CrossRef]
  29. Zhang, M.; Huang, C.; Zhang, J.; Qin, H.; Ma, G.; Liu, X.; Yin, J. Accurate discrimination of tea from multiple geographical regions by combining multi-elements with multivariate statistical analysis. J. Food Meas. Charaterization 2020, 14, 3361–3370. [Google Scholar] [CrossRef]
  30. Endaye, M.; Atlabachew, M.; Mehari, B.; Alemayehu, M.; Mengistu, D.A.; Kerisew, B. Combining Multi-Element Analysis with Statistical Modeling for Tracing the Origin of Green Coffee Beans from Amhara Region, Ethiopia. Biol. Trace Elem. Res. 2020, 195, 669–678. [Google Scholar] [CrossRef]
  31. Beltrán, M.; Sánchez-Astudillo, M.; Aparicio, R.; García-González, D.L. Geographical traceability of virgin olive oils from south-western Spain by their multi-elemental composition. Food Chem. 2015, 169, 350–357. [Google Scholar] [CrossRef] [PubMed]
  32. Martino, J.C.; Mazumder, D.; Gadd, P.; Doubleday, Z.A. Tracking the provenance of octopus using isotopic and multi-elemental analysis. Food Chem. 2022, 371, 131133. [Google Scholar] [CrossRef] [PubMed]
  33. Lv, H.; Zhang, Y.; Sun, Y.; Duan, Y. Elemental characteristics of Sanqi (Panax notoginseng) in Yunnan province of China: Multielement determination by ICP-AES and ICP-MS and statistical analysis. Microchem. J. 2019, 146, 931–939. [Google Scholar] [CrossRef]
  34. Yin, Q.; Zhu, Y.; Ju, S.; Liao, W.; Yang, Y. Rapid determination of copper and lead in Panax notoginseng by magnetic solid-phase extraction and flame atomic absorption spectrometry. Res. Chem. Intermed. 2016, 42, 4985–4998. [Google Scholar] [CrossRef]
  35. Pan, Q.; Liu, W.; Yang, J.; Min, Y.; Huang, Z. Determination of Arsenic in Panax notoginseng by Hydride Generation Atomic Fluorescence Spectrometry. Asian J. Chem. 2013, 25, 2959–2961. [Google Scholar] [CrossRef]
  36. Zheng, Y.; Xia, P.; Chai, W.; Liang, Z.; Yan, K. Accumulation dynamics of elements in Panax notoginseng during its whole growing seasons. Ind. Crop. Prod. 2020, 158, 113023. [Google Scholar] [CrossRef]
  37. Leyden, E.; Farkas, J.; Gilbert, S.; Hutson, J.; Mosley, L.M. A simple and rapid ICP-MS/MS determination of sulfur isotope ratios (34S/32S) in complex natural waters: A new tool for tracing seawater intrusion in coastal systems. Talanta 2021, 235, 122708. [Google Scholar] [CrossRef]
  38. Hirata, J.; Itabashi, D.; Aimoto, M. Determination of Ultra-trace Tellurium in Steel by ID-ICP-MS/MS with Liquid-Liquid Extraction. Anal. Sci. 2021, 37, 1757–1763. [Google Scholar] [CrossRef]
  39. Simpson, A.; Gilbert, S.; Tamblyn, R.; Hand, M.; Spandler, C.; Gillespie, J.; Nixon, A.; Glorie, S. In Situ Lu Hf geochronology of garnet, apatite and xenotime by LA ICP MS/MS. Chem. Geol. 2021, 577, 120299. [Google Scholar] [CrossRef]
  40. Ariyama, K.; Nishida, T.; Noda, T.; Kadokura, M.; Yasui, A. Effects of fertilization, crop year, variety, and provenance factors on mineral concentrations in onions. J. Agric. Food Chem. 2006, 9, 3341–3350. [Google Scholar] [CrossRef]
  41. Zhao, H.; Zhang, S.; Zhang, Z. Relationship between multi-element composition in tea leaves and in provenance soils for geographical traceability. Food Control 2017, 76, 82–87. [Google Scholar] [CrossRef]
  42. Carini, F.; Bengtsson, G. Post-deposition transport of radionuclides in fruit. J. Environ. Radioact. 2001, 52, 215–236. [Google Scholar] [CrossRef]
  43. Wang, X.; Li, L.; Zhang, S.C. Plant Physiology, 8th ed.; Higher Education Press: Beijing, China, 2019; ISBN 978-7-04-050044-8. [Google Scholar]
  44. Kotsiantis, S.B.; Zaharakis, I.D.; Pintelas, P.E. Machine learning: A review of classification and combining techniques. Artif. Intell. Rev. 2006, 3, 159–190. [Google Scholar] [CrossRef]
  45. Yuan, Y.; Hu, G.; Chen, T.; Zhao, M.; Zhang, Y.; Li, Y.; Xu, X.; Shao, S.; Zhu, J.; Wang, Q.; et al. Improved Discrimination for Brassica Vegetables Treated with Agricultural Fertilizers Using a Combined Chemometric Approach. J. Agric. Food Chem. 2016, 28, 5633–5643. [Google Scholar] [CrossRef]
  46. Liu, H.-L.; Zeng, Y.-T.; Zhao, X.; Tong, H.-R. Improved geographical origin discrimination for tea using ICP-MS and ICP-OES techniques in combination with chemometric approach. J. Sci. Food Agric. 2020, 100, 3507–3516. [Google Scholar] [CrossRef]
  47. Wold, S.; Ruhe, A.; Wold, H.; Dunn, W.J., III. The Collinearity Problem in Linear Regression. The Partial Least Squares (PLS) Approach to Generalized Inverses. SIAM J. Sci. Stat. Comput. 1984, 5, 735–743. [Google Scholar] [CrossRef] [Green Version]
  48. Schmidhuber, J. Deep learning in neural networks: An overview. Neural Netw. 2015, 61, 85–117. [Google Scholar] [CrossRef] [Green Version]
  49. Liu, Y.; Yao, L.; Xia, Z.; Gao, Y.; Gong, Z. Geographical discrimination and adulteration analysis for edible oils using two-dimensional correlation spectroscopy and convolutional neural networks (CNNs). Spectrochim. Acta Part A Mol. Biomol. Spectrosc. 2021, 246, 118973. [Google Scholar] [CrossRef]
  50. Drivelos, S.A.; Danezis, G.P.; Halagarda, M.; Popek, S.; Georgiou, C.A. Geographical origin and botanical type honey authentication through elemental metabolomics via chemometrics. Food Chem. 2021, 338, 127936. [Google Scholar] [CrossRef]
  51. Wu, H.; Lin, G.; Tian, L.; Yan, Z.; Yi, B.; Bian, X.; Jin, B.; Xie, L.; Zhou, H.; Rogers, K.M. Origin verification of French red wines using isotope and elemental analyses coupled with chemometrics. Food Chem. 2021, 339, 127760. [Google Scholar] [CrossRef]
  52. Qi, J.; Li, Y.; Zhang, C.; Wang, C.; Wang, J.; Guo, W.; Wang, S. Geographic origin discrimination of pork from different Chinese regions using mineral elements analysis assisted by machine learning techniques. Food Chem. 2021, 337, 127779. [Google Scholar] [CrossRef] [PubMed]
  53. Boser, B.E.; Guyon, I.M.; Vapnik, V.N. A Training Algorithm for Optimal Margin Classifiers. In Proceedings of the COLT 92: The 5th Annual Workshop on Computational Learning Theory, Pittsburgh, PA, USA, 27–29 July 1992; Haussler, D., Ed.; ACM Press: New York, NY, USA, 1992; pp. 144–152. [Google Scholar]
  54. Kabir, M.H.; Guindo, M.L.; Chen, R.; Liu, F. Geographic Origin Discrimination of Millet Using Vis-NIR Spectroscopy Combined with Machine Learning Techniques. Foods 2021, 10, 2767. [Google Scholar] [CrossRef]
  55. Wang, L.; Wang, X.; Liu, X.; Wang, Y.; Ren, X.; Dong, Y.; Song, R.; Ma, J.; Fan, Q.; Wei, J.; et al. Fast discrimination and quantification analysis of Curcumae Radix from four botanical origins using NIR spectroscopy coupled with chemometrics tools. Spectrochim. Acta Part A Mol. Biomol. Spectrosc. 2021, 254, 119626. [Google Scholar] [CrossRef] [PubMed]
  56. Zhang, Z.-Y.; Wang, Y.-J.; Yan, H.; Chang, X.-W.; Zhou, G.-S.; Zhu, L.; Liu, P.; Guo, S.; Dong, T.T.X.; Duan, J.-A. Rapid Geographical Origin Identification and Quality Assessment of Angelicae Sinensis Radix by FT-NIR Spectroscopy. J. Anal. Methods Chem. 2021, 2021, 127779. [Google Scholar] [CrossRef] [PubMed]
  57. Liu, X.; Liu, Z.; Qian, Q.; Song, W.; Rogers, K.M.; Rao, Q.; Wang, S.; Zhang, Q.; Shao, S.; Tian, M.L.; et al. Isotope chemometrics determines farming methods and geographical origin of vegetables from Yangtze River Delta Region, China. Food Chem. 2021, 342, 128379. [Google Scholar] [CrossRef]
  58. Nasr, E.G.; Epova, E.N.; de Diego, A.; Souissi, R.; Hammami, M.; Abderrazak, H.; Donard, O.F.X. Trace Elements Analysis of Tunisian and European Extra Virgin Olive Oils by ICP-MS and Chemometrics for Geographical Discrimination. Foods 2021, 1, 82. [Google Scholar] [CrossRef]
  59. Nguyen-Quang, T.; Bui-Quang, M.; Truong-Ngoc, M. Rapid Identification of Geographical Origin of Commercial Soybean Marketed in Vietnam by ICP-MS. J. Anal. Methods Chem. 2021, 2021, 9. [Google Scholar] [CrossRef]
  60. de Souza, M.J.; Barciela-Alonso, M.C.; Aboal-Somoza, M.; Bermejo-Barrera, P. Determination of the Trace Element Contents of Fruit Juice Samples by ICP OES and ICP-MS. Braz. J. Anal. Chem. 2021, 9, 49–61. [Google Scholar] [CrossRef]
  61. Gómez-Rubio, V. ggplot2-Elegant Graphics for Data Analysis, 2nd ed. ; J. Stat. Soft. 2017, 77, 1–3. [Google Scholar] [CrossRef] [Green Version]
  62. de Mendiburu, F. Agricolae: Statistical Procedures for Agricultural Research. Available online: https://cran.r-project.org/web/packages/agricolae/agricolae.pdf (accessed on 1 January 2020).
  63. Kassambara, A. ggpubr R Package: ggplot2-Based Publication Ready Plots. Available online: https://rpkgs.datanovia.com/ggpubr (accessed on 1 January 2020).
  64. Dixon, P. VEGAN, a package of R functions for community ecology. J. Veg. Sci. 2003, 14, 927–930. [Google Scholar] [CrossRef]
  65. Kolde, R. Pheatmap: Pretty Heatmaps. Available online: https://rdrr.io/cran/pheatmap/ (accessed on 1 January 2020).
  66. Kumar, A. Pre-processing and Modelling using Caret Package in R. Int. J. Comput. Appl. 2018, 181, 39–42. [Google Scholar] [CrossRef]
Figure 1. The accumulation dynamics of elements during the growth of P. notoginseng. (a) Growth environment of P. notoginseng in different cultivation models, and specific sampling locations of P. notoginseng roots, ehizosphere, and edge soil. (b) The multi-element determination result of P. notoginseng and soil in PuEr bases. (c) The multi-element determination result of P. notoginseng and soil in HongHe bases. RS: rhizosphere soil; ES: edge soil; R21: root of P. notoginseng collected in August 2019; R22: root of P. notoginseng collected in November 2019; and R32: root of P. notoginseng collected in November 2020.
Molecules 27 02982 g001
Figure 2. The results of ANOSIM and NMDS analyses of multi-element content of P. notoginseng from five origins. (a) The analysis of similarities (ANOSIM, using Bray–Curtis similarity distance matrix) of the multi-element content from five origins. ‘+’ represents outliers. (b) the results of the non-metric multidimensional scaling (NMDS, using the Bray–Curtis similarity distance matrix) of the multi-element content from five origins.
Molecules 27 02982 g002
Figure 3. The results of ANOSIM and NMDS analyses of the content of multi-element in P. notoginseng from different cultivation models. (a) The analysis of similarities (ANOSIM, using Bray-Curtis similarity distance matrix) of the multi-element content from cultivation models. (b) the results of the non-metric multidimensional scaling (NMDS, using the Bray–Curtis similarity distance matrix) of the multi-element content from cultivation models.
Molecules 27 02982 g003
Table 1. The major parameters of models of each class based on the content of multi-element in P. notoginseng from different origins.
ModesRegionSensitivitySpecificityBalanced AccuracyAccuracyp-Value [Acc > NIR]Kappa ValueArea under ROC Curve (AUC)
PLS-DAHongHe0.75000.86960.80980.48152.76 × 10−10.38440.8750
KunMing1.00000.56520.7862
PuEr0.50000.95650.7283
QuJing0.09101.00000.5455
WenShan0.75001.00000.8750
LDAHongHe0.25000.95650.60330.70371.78 × 10−30.61290.7881
KunMing0.75000.95650.8533
PuEr1.00000.95650.9783
QuJing0.63640.87500.7557
WenShan1.00000.86960.9348
RFHongHe0.75000.95650.85330.88892.89 × 10−70.84720.8750
KunMing0.75001.00000.8750
PuEr0.75001.00000.8750
QuJing1.00000.87500.9375
WenShan1.00001.00001.0000
NNsHongHe1.00000.95650.97830.92592.32 × 10−80.9020.9750
KunMing0.75000.95650.8533
PuEr1.00001.00001.0000
QuJing0.90911.00000.9545
WenShan1.00001.00001.0000
kNNsHongHe1.00000.95650.97830.66675.82 × 10−30.5950.8920
KunMing0.75000.82610.7880
PuEr1.00000.95650.9783
QuJing0.27271.00000.6364
WenShan1.00000.86960.9348
NBHongHe0.75000.95650.85330.74074.63 × 10−40.66550.9071
KunMing1.00000.82610.9130
PuEr0.75001.00000.8750
QuJing0.63640.93750.7869
WenShan0.75000.95650.8533
SVMsHongHe1.00000.95650.97830.88892.89 × 10−70.85480.9625
KunMing0.75000.91300.8315
PuEr1.00001.00001.0000
QuJing0.81821.00000.9091
WenShan1.00001.00001.0000
Table 2. The major parameters of models of each class based on the content of multi-element in P. notoginseng under different planting models.
ModesSensitivitySpecificityAccuracyp-Value [Acc > NIR]Kappa ValueArea under ROC Curve (AUC)
PLS-DA1.00000.85710.96150.00300.89760.9286
LR0.73681.00000.80770.26050.82610.8684
LDA0.68421.00000.85710.42580.53850.8421
RF1.00000.85710.96150.00300.89760.9286
NNs0.89470.85710.88460.05310.71940.8759
kNNs1.00000.57140.05310.05310.66090.7857
NB0.73681.00000.80770.260450.60120.8684
SVMs1.00001.00001.00000.00031.00001.0000
Publisher’s Note: MDPI stays neutral with regard to jurisdictional claims in published maps and institutional affiliations.

