
The Elemental Profile of Beer Available on Polish Market: Analysis of the Potential Impact of Type of Packaging Material and Risk Assessment of Consumption

 ,
,  ,
,
Abstract
:1. Introduction
2. Results and Discussion
2.1. Level of Metals in Analyzed Beer Samples
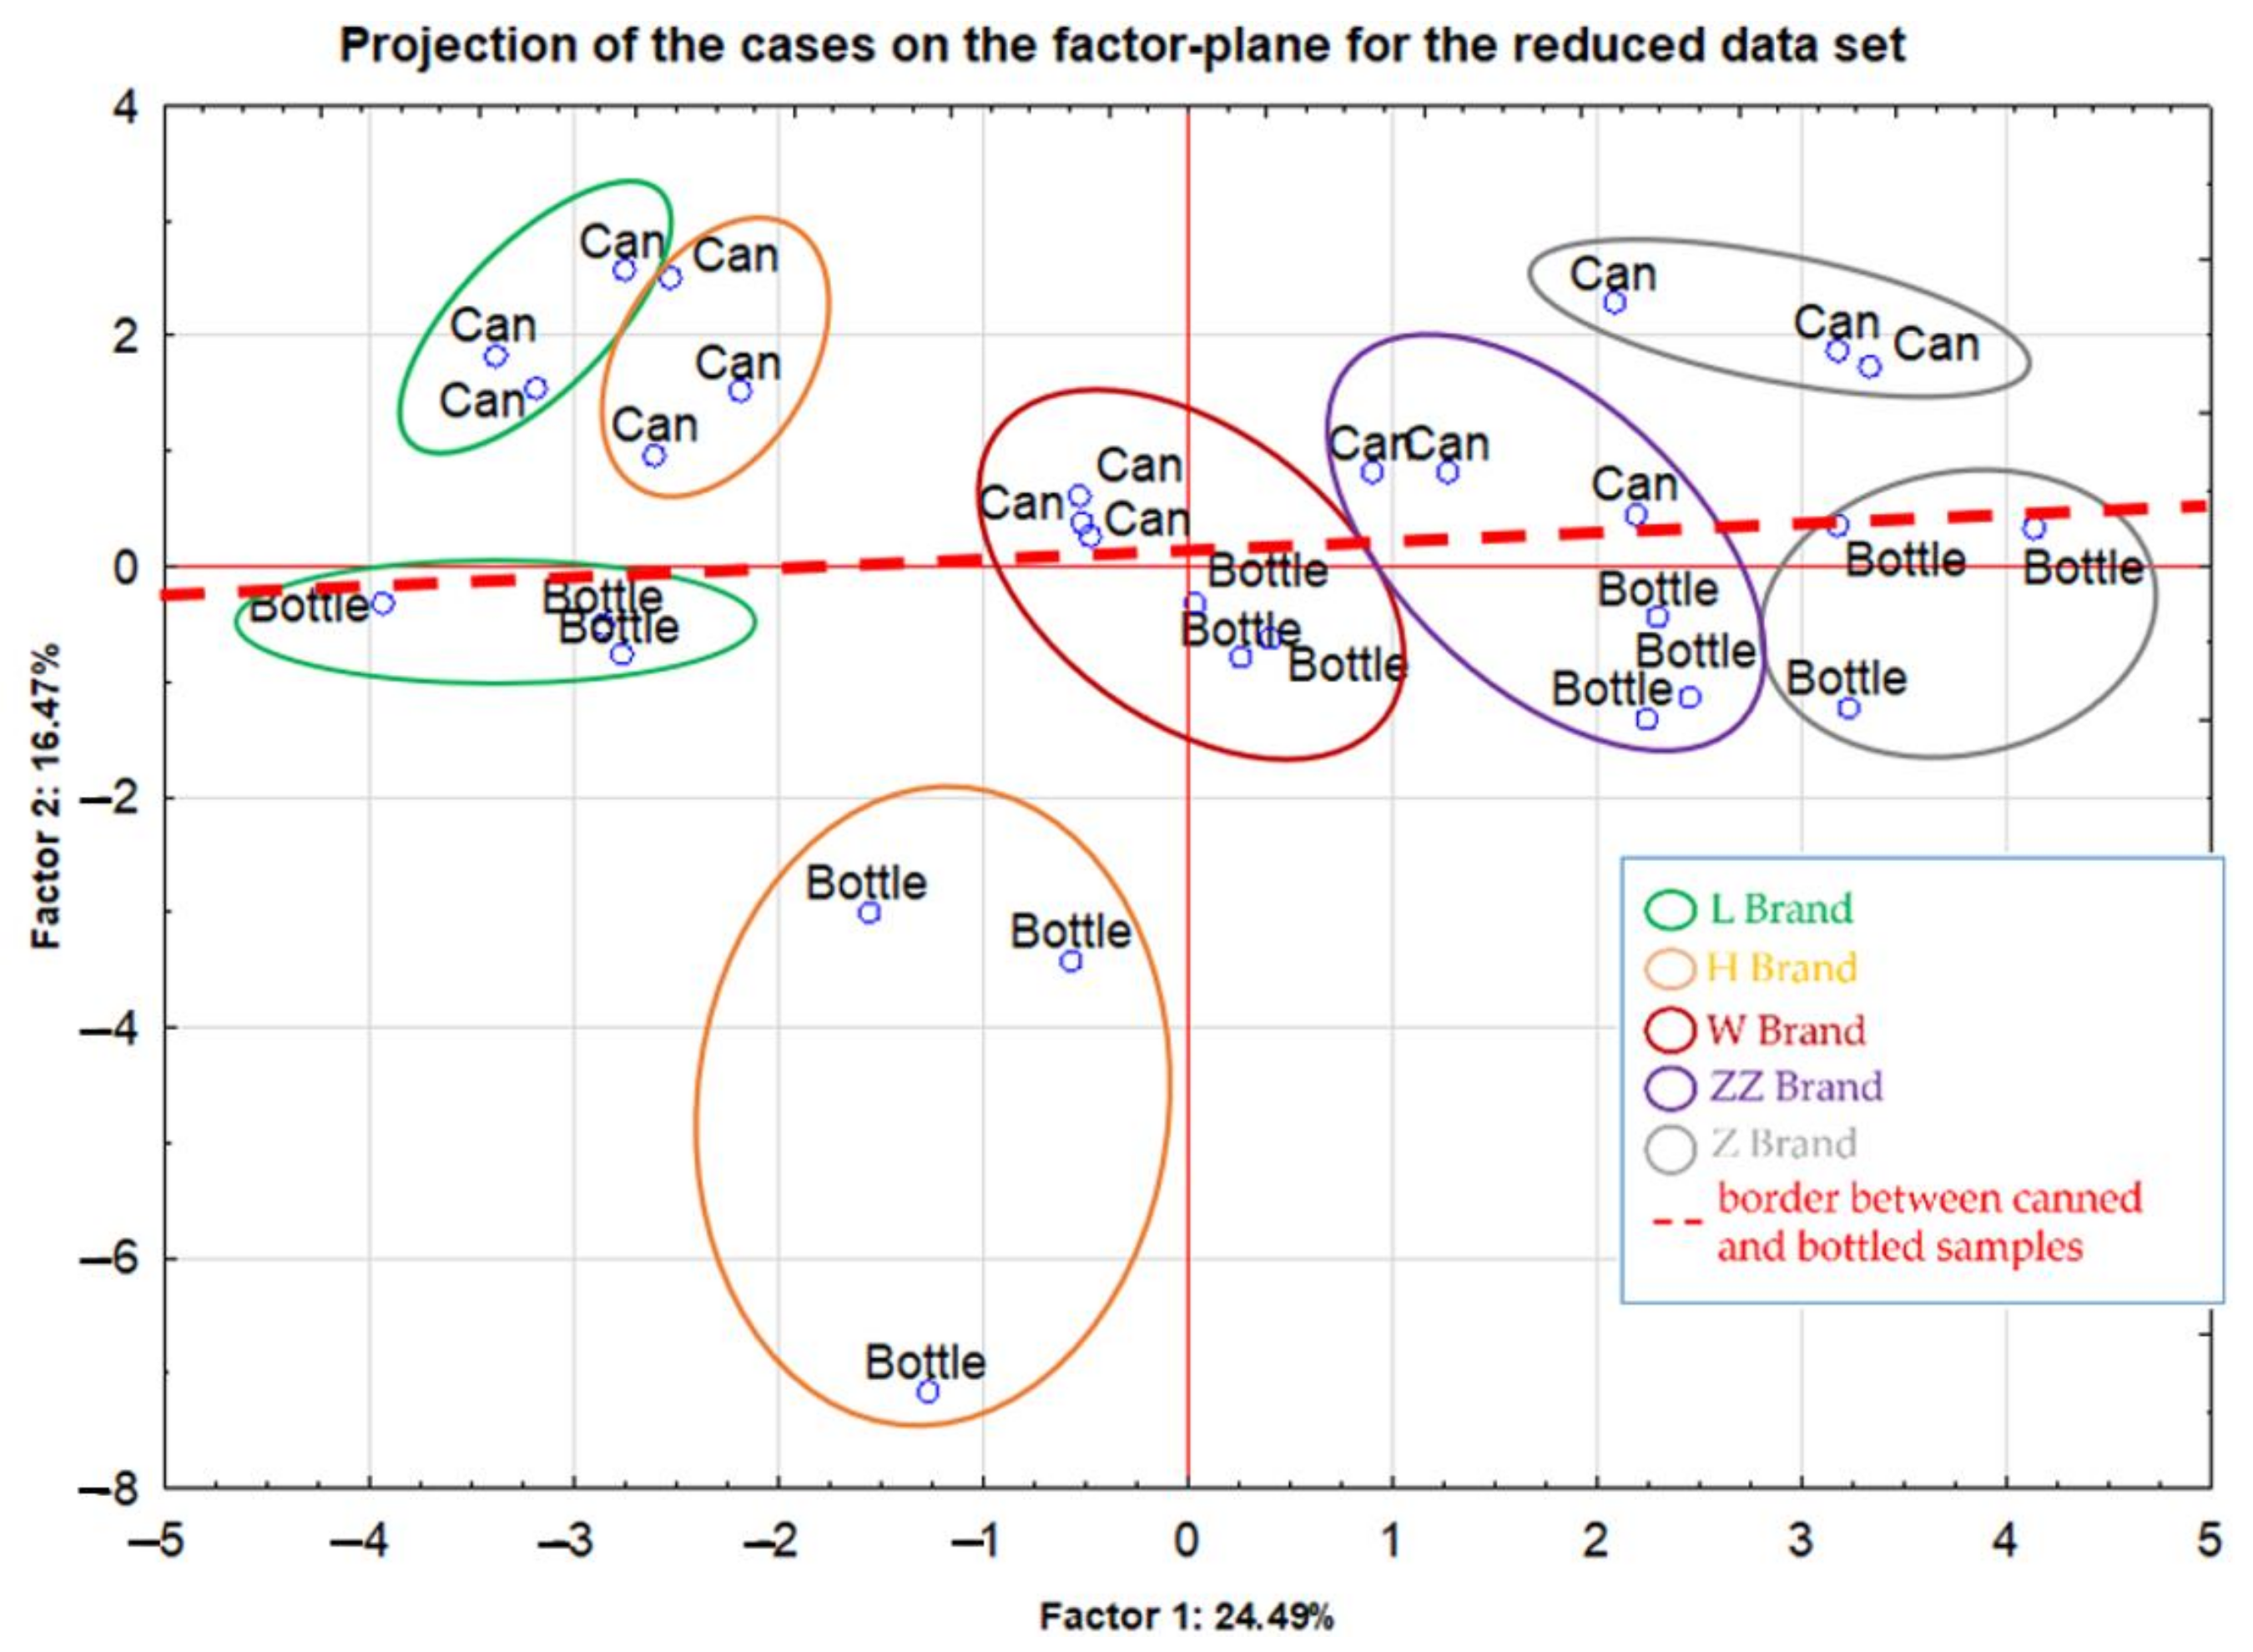
2.2. Analysis of the Potential Impact of Type of the Packaging Material
Analysis of the Impact of Packaging Material after Taking into Account Beer Brand
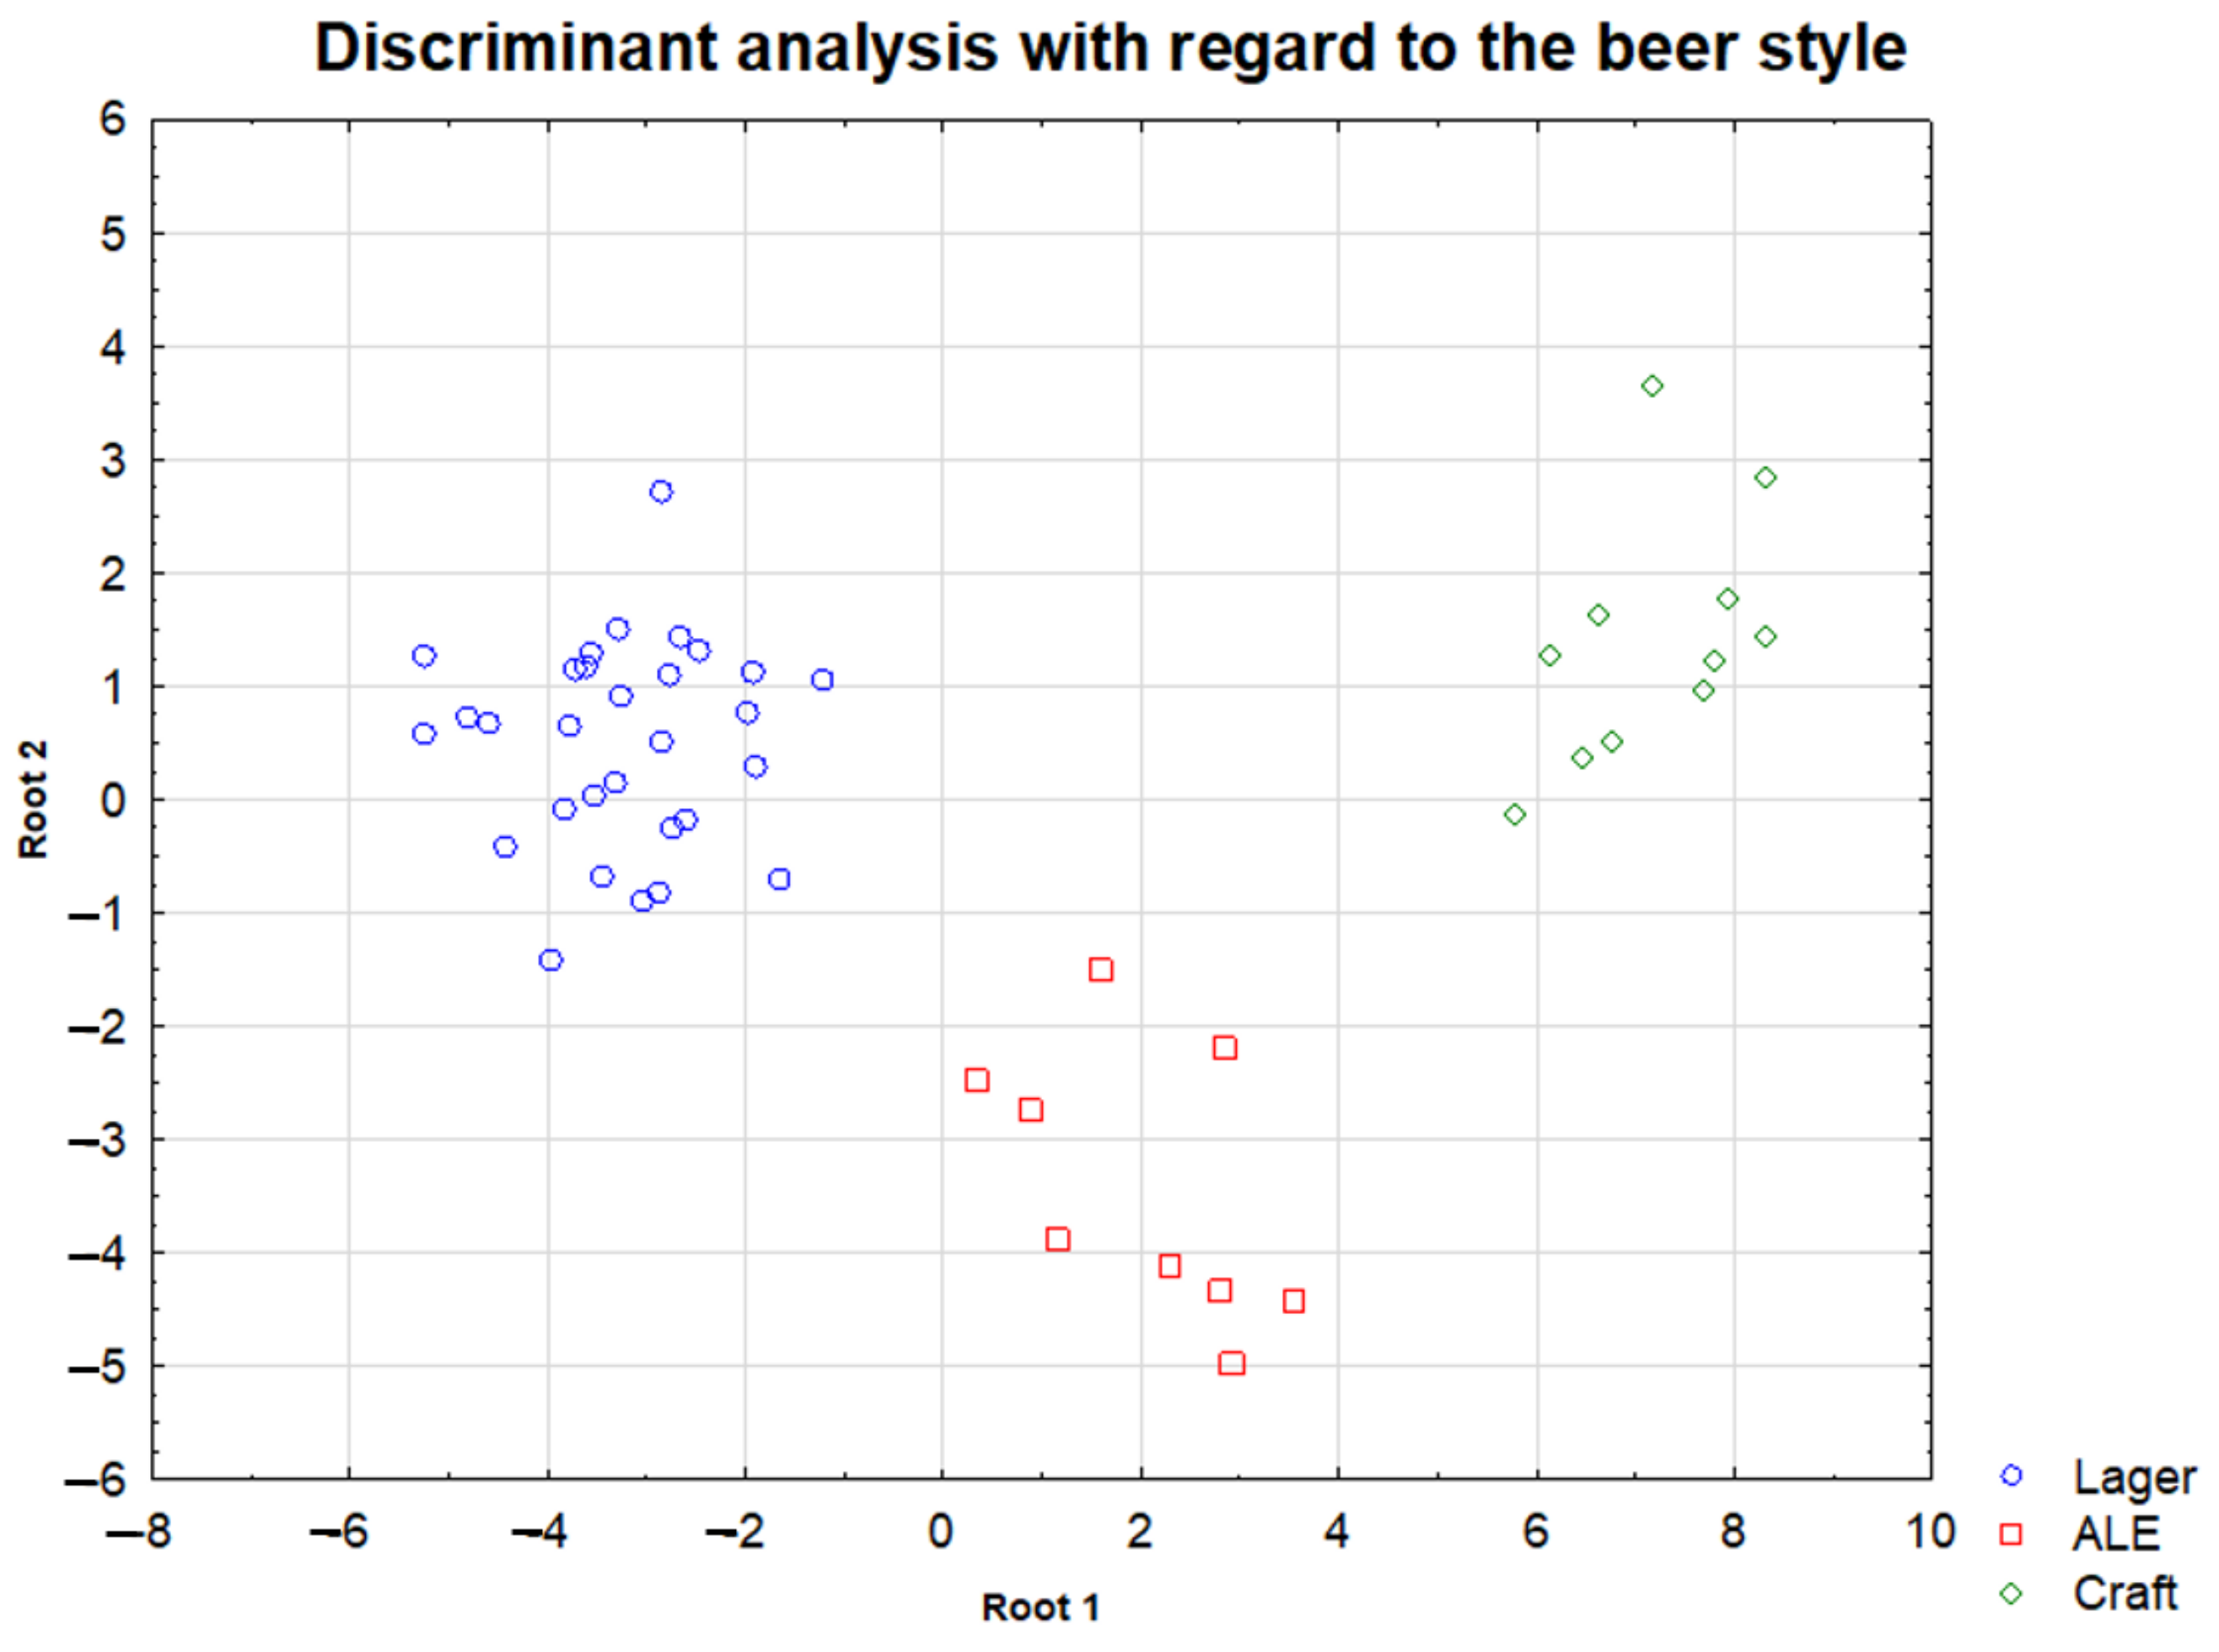
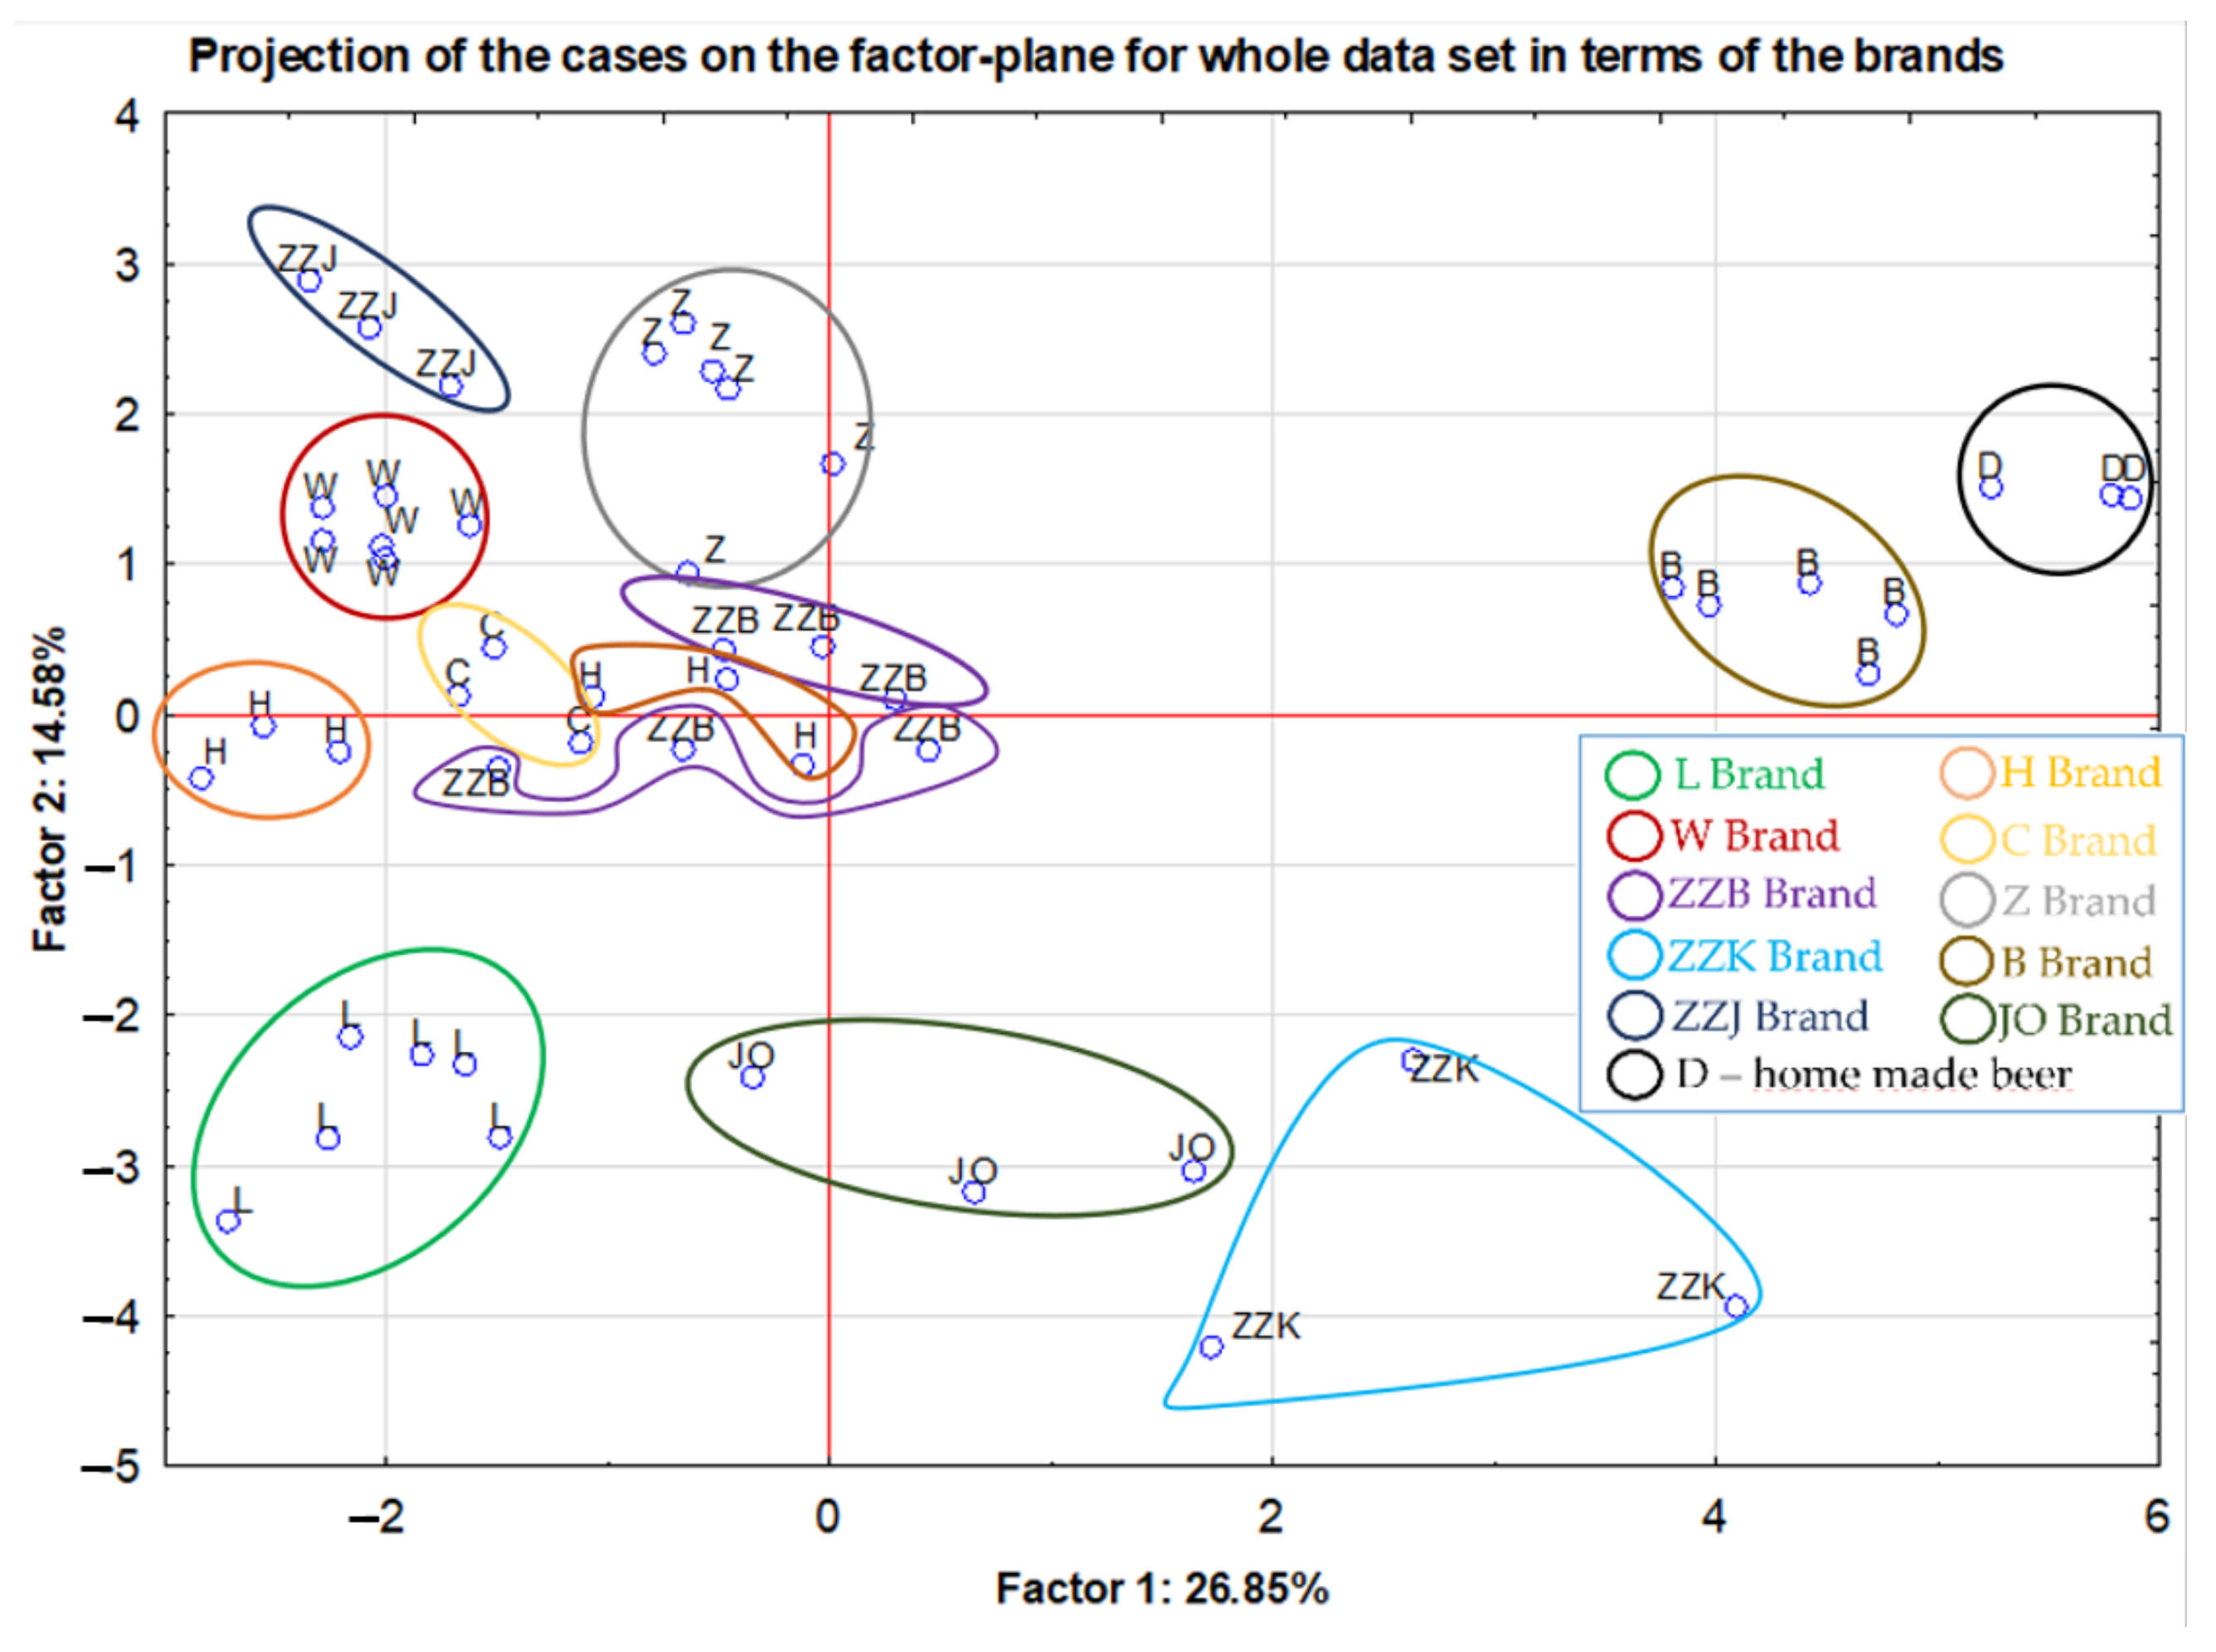
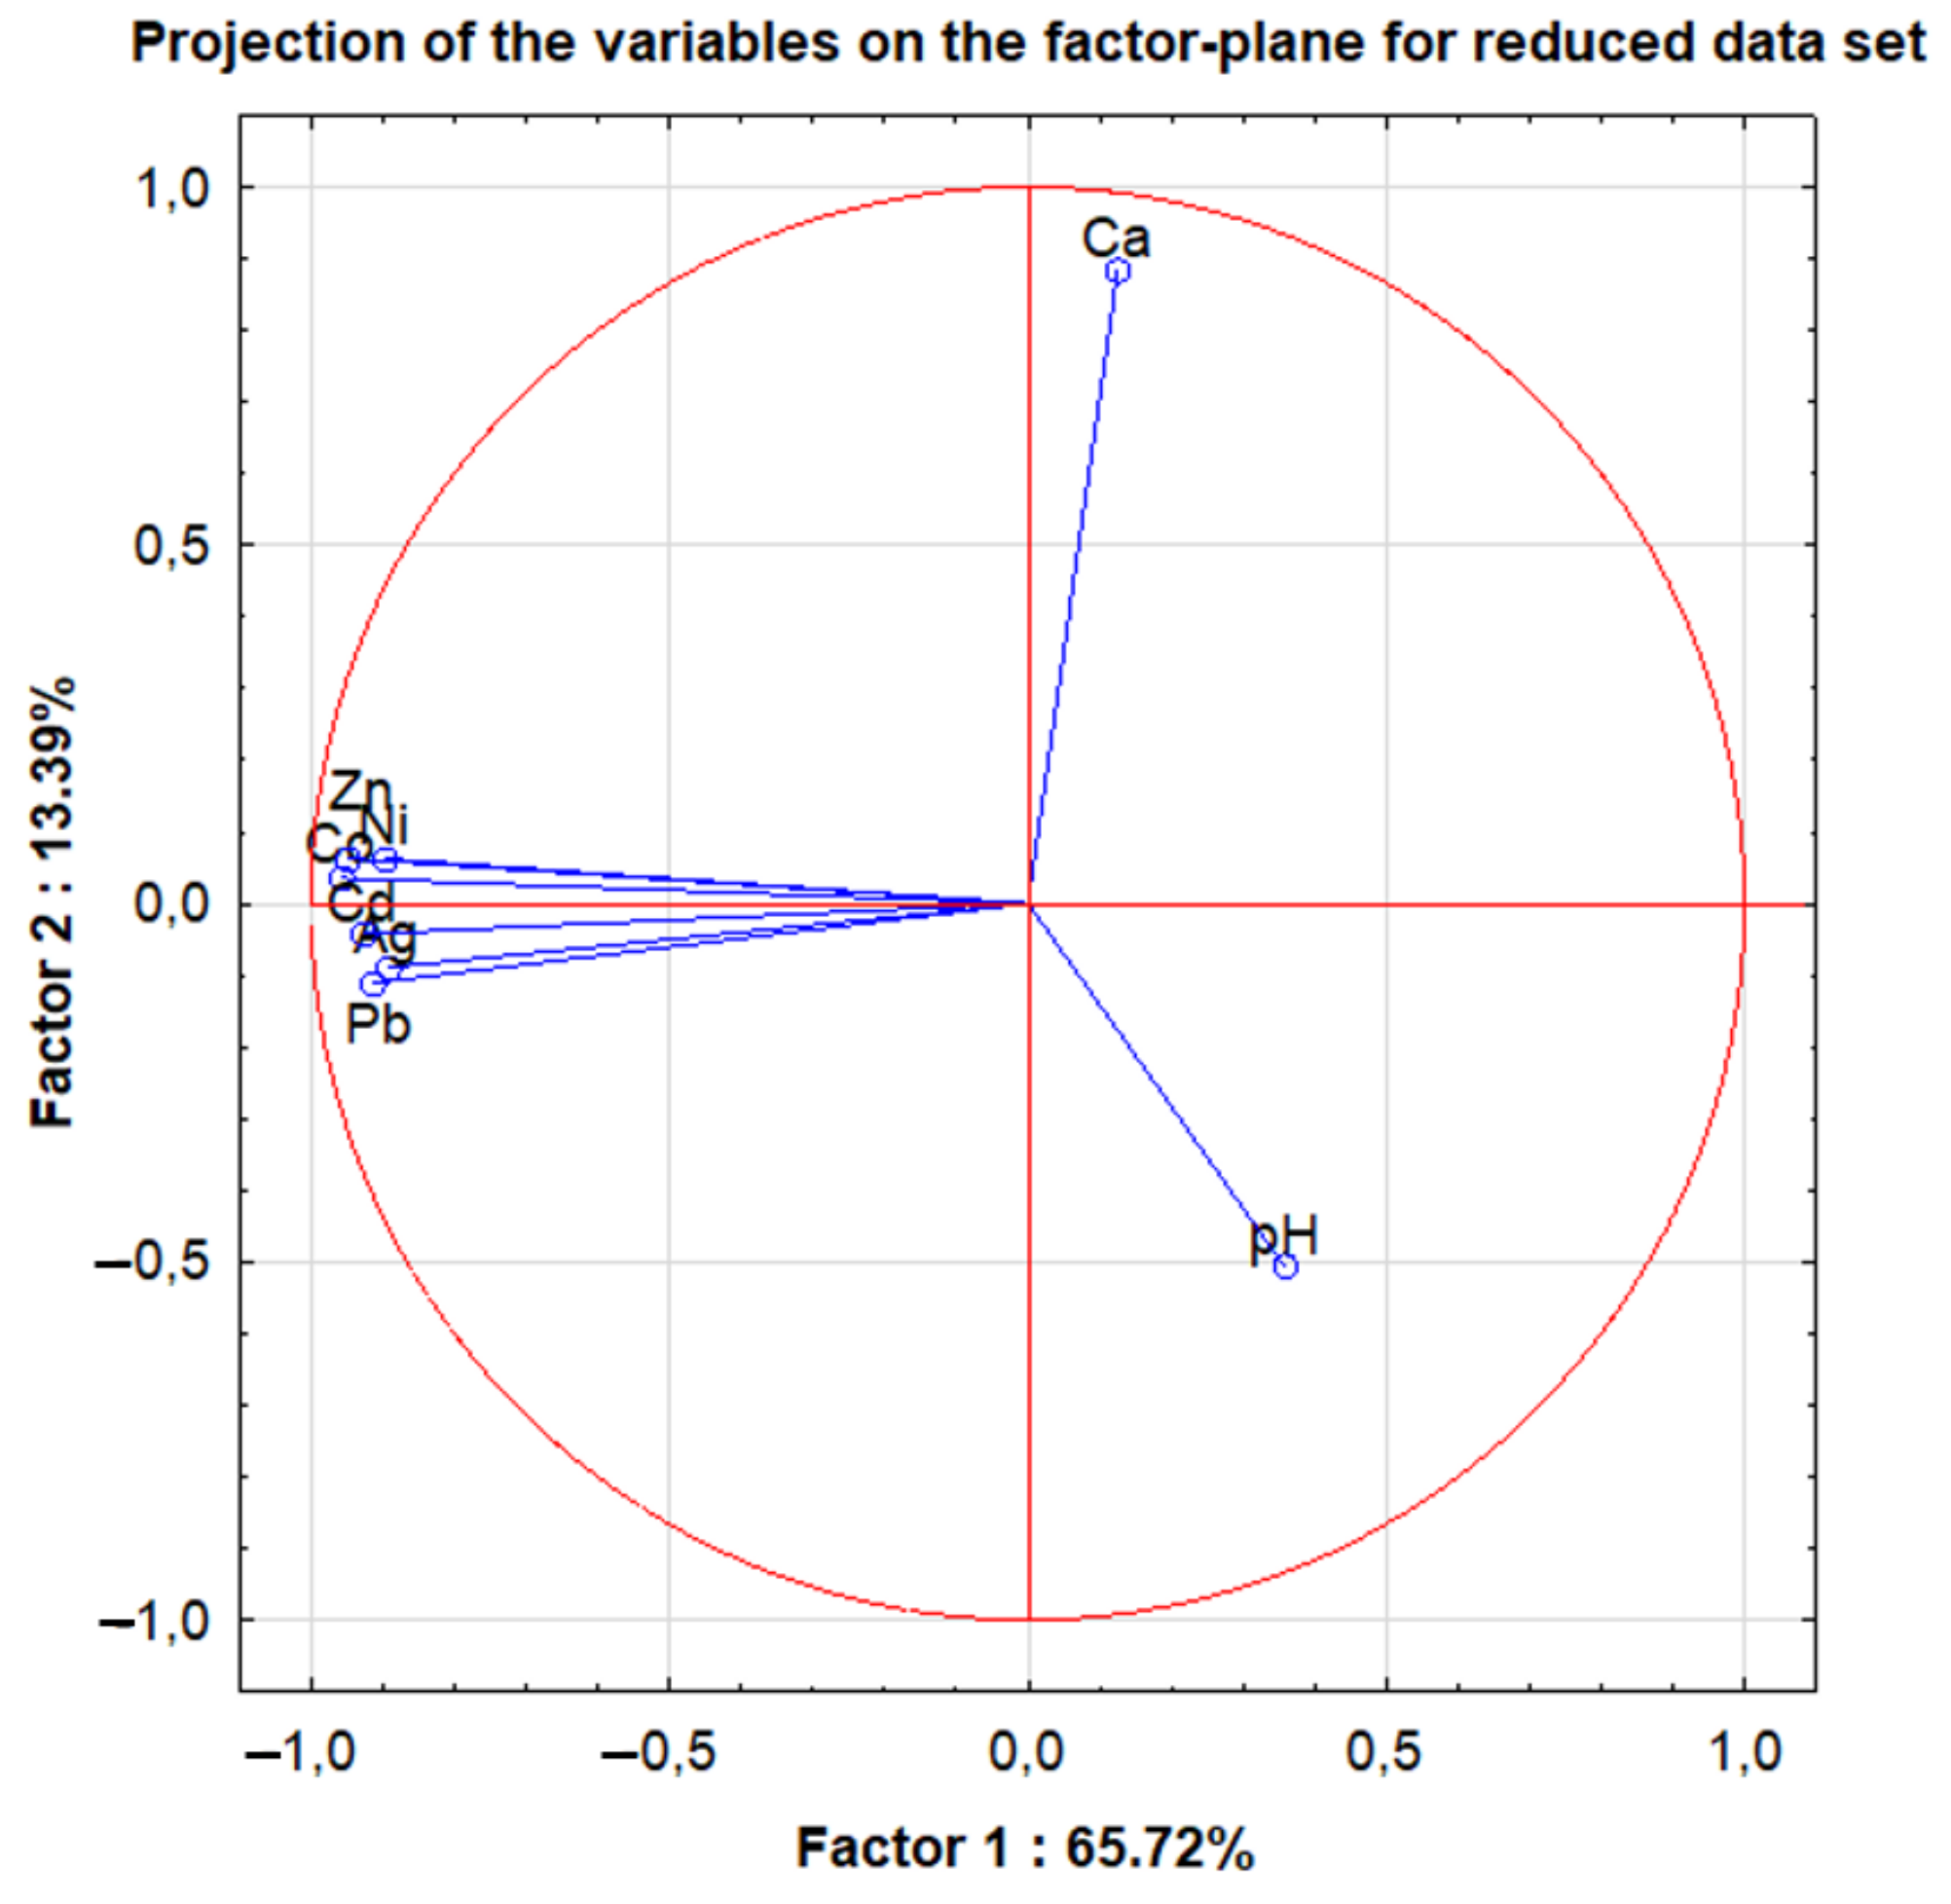
2.3. Differentiation of the Analyzed Beer Type According to Their Element Contents
2.4. Risk Assessment
3. Materials and Methods
3.1. Samples
3.2. Samples Preparation and Equipment
3.2.1. Beer Sample Digestion
3.2.2. ICP-OES and ICP-MS
3.2.3. Evaluation of the Correctness of the Obtained Results
3.2.4. CVAAS
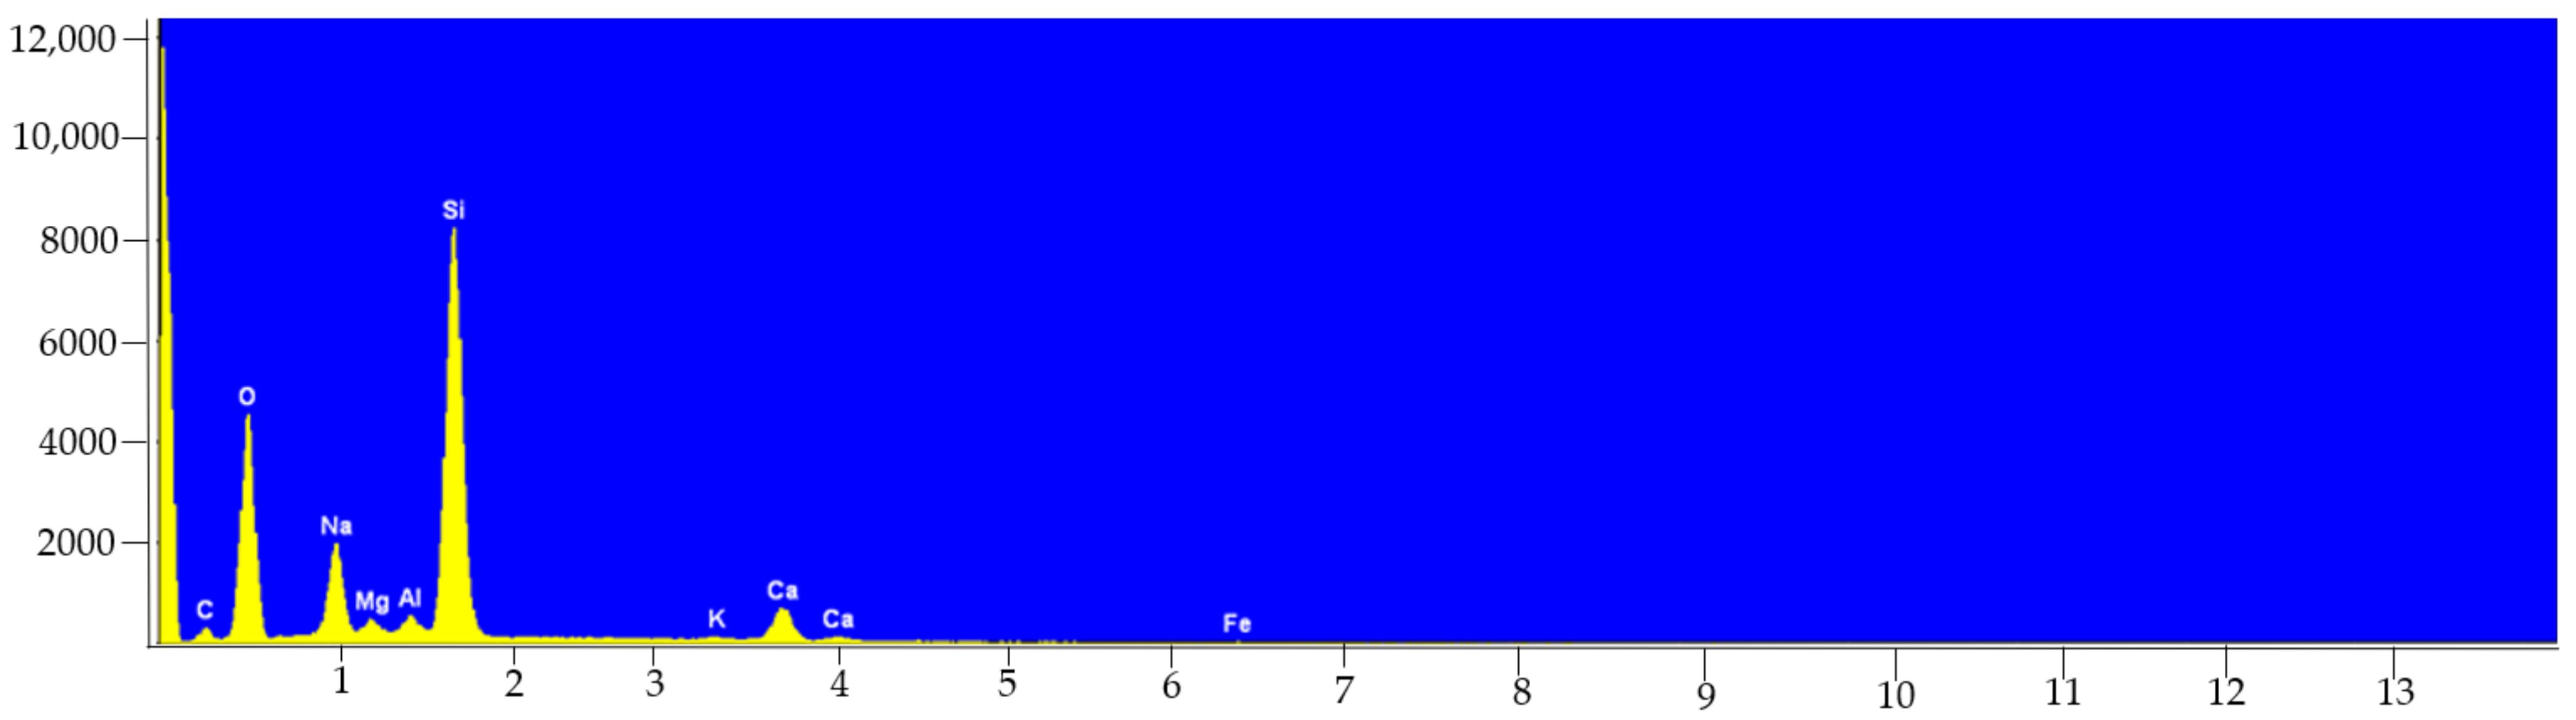
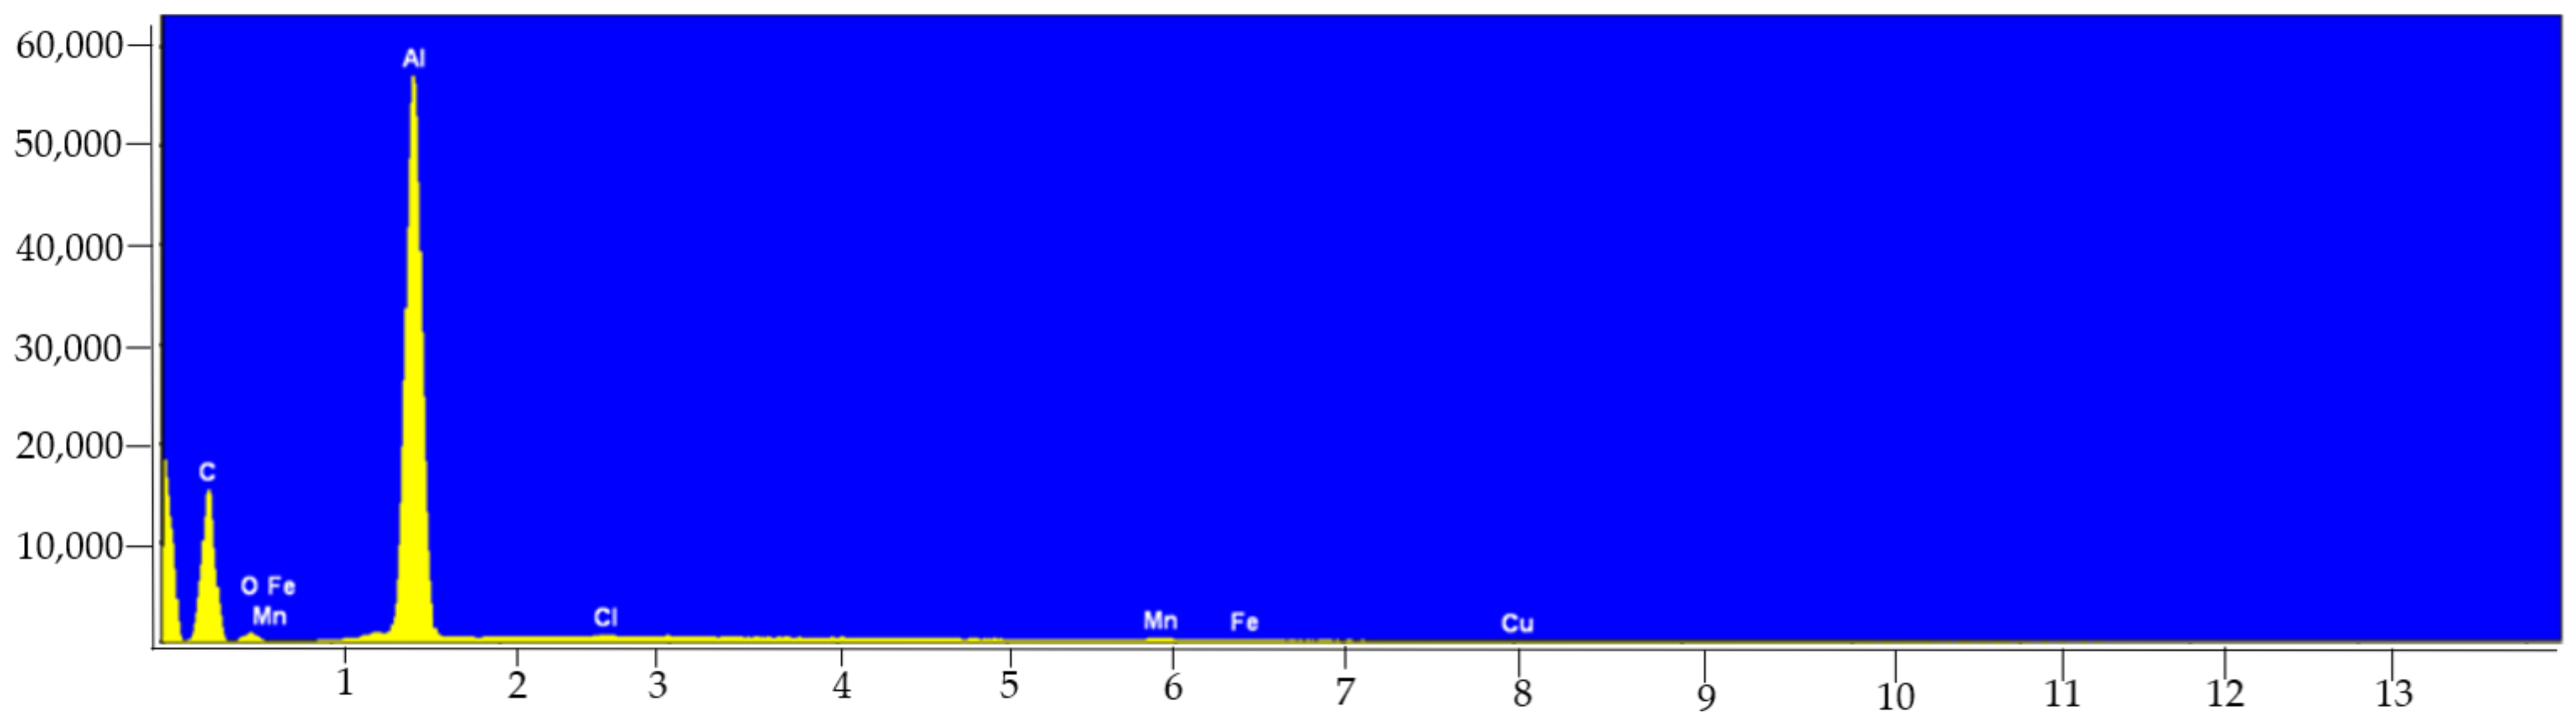
3.2.5. SEM-EDS
3.3. “Washout” Experiment
3.4. Risk Assessment
3.5. Data Analysis
4. Conclusions
Author Contributions
Funding
Institutional Review Board Statement
Informed Consent Statement
Data Availability Statement
Conflicts of Interest
Sample Availability
References
- Beer Report 2020 Statista Consumer Market Outlook—Segment Report. Available online: https://www.statista.com/study/48816/beer-report/ (accessed on 7 February 2022).
- Merriam-Webster, Beer Definition. Available online: https://www.merriam-webster.com/dictionary/beer (accessed on 7 February 2022).
- Alcázar, A.; Jurado, J.M.; Palacios-Morillo, A.; Pablos, F.; Martín, M.J. Recognition of the geographical origin of beer based on support vector machines applied to chemical descriptors. Food Control 2012, 23, 258–262. [Google Scholar] [CrossRef]
- Commission Regulation (EC) No 10/2011 of 14 January 2011 on Plastic Materials and Articles Intended to Come into Contact with food, Official Journal of the European Union. Available online: https://eur-lex.europa.eu/legal-content/PL/TXT/PDF/?uri=CELEX:32011R0010&from=EN (accessed on 11 February 2022).
- Mena, C.; Cabrera, C.; Lorenzo, M.L.; López, M.C. Cadmium levels in wine, beer and other alcoholic beverages: Possible sources of contamination. Sci. Total Environ. 1996, 181, 201–208. [Google Scholar] [CrossRef]
- Vela, M.M.; Toma, R.B.; Reiboldt, W.; Pierri, A. Detection of aluminum residue in fresh and stored canned beer. Food Chem. 1998, 63, 235–239. [Google Scholar] [CrossRef]
- Wyrzykowska, B.; Szymczyk, K.; Ichichashi, H.; Falandysz, J.; Skwarzec, B.; Yamasaki, S. Application of ICP sector field MS and principal component analysis for studying interdependences among 23 trace elements in Polish beers. J. Agric. Food Chem. 2001, 49, 3425–3431. [Google Scholar] [CrossRef]
- Bamforth, C.W. pH in brewing: An overview. Master Brewers Association of the Americas Technical Quarterly 2001, 38, 1–9. [Google Scholar]
- Guyot-Declerck, C.; François, N.; Ritter, C.; Govaerts, B.; Collin, S. Influence of pH and ageing on beer organoleptic properties. A sensory analysis based on AEDA data. Food Qual. Prefer. 2005, 16, 157–162. [Google Scholar] [CrossRef]
- Sedin, D.; Williams, S.; Kulikov, E.; Nelson, J.; Gilleland, G. Determination of Metals in Wort and Beer Samples Using the Agilent 5110 ICP-OES; Agilent Technologies: Santa Clara, CA, USA, 2017. [Google Scholar]
- Passaghe, P.; Bertoli, S.; Tubaro, F.; Buiatti, S. Monitoring of some selected heavy metals throughout the brewing process of craft beers by inductively coupled plasma mass spectrometry. Eur. Food Res. Technol. 2015, 241, 199–215. [Google Scholar] [CrossRef]
- Nascentes, C.C.; Kamogawa, M.Y.; Fernandes, K.G.; Arruda, M.A.Z.; Nogueira, A.R.A.; Nóbrega, J.A. Direct determination of Cu, Mn, Pb, and Zn in beer by thermospray flame furnace atomic absorption spectrometry. Spectrochimica Acta Part B 2005, 60, 749–753. [Google Scholar] [CrossRef]
- Pohl, P.; Prusisz, B. Chemical fractionation of Cu, Fe and Mn in canned Polish beers. J. Food Compos. Anal. 2010, 23, 86–94. [Google Scholar] [CrossRef]
- Alexa, L.; Kantor, A.; Kovacs, B.; Czipa, N. Determination of micro and trace elements of commercial beers. J. Microbiol. Biotechnol. Food Sci. 2018, 7, 432–436. [Google Scholar] [CrossRef] [Green Version]
- Mahmood, N.; Petraco, N.; He, Y. Elemental fingerprint profile of beer samples constructed using 14 elements determined by inductively coupled plasma–mass spectrometry (ICP-MS): Multivariation analysis and potential application to forensic sample comparison. Anal. Bioanal. Chem. 2012, 402, 861–869. [Google Scholar] [CrossRef] [PubMed]
- Pires, L.N.; Dias, F.D.S.; Teixeira, L.S.G. Assessing the internal standardization of the direct multi-element determination in beer samples through microwave-induced plasma optical emission spectrometry. Anal. Chim. Acta 2019, 1090, 31–38. [Google Scholar] [CrossRef] [PubMed]
- Sakellari, A.; Karavoltsos, S.; Plavsic, M.; Bempi, E.; Papantonopoulou, G.; Dassenakis, M.; Kalogeropoulos, N. Copper complexing properties, trace metal content and organic matter physicochemical characterization of Greek beers. Microchem. J. 2017, 135, 66–73. [Google Scholar] [CrossRef]
- Moirangthem, K.; Jenkins, D.; Ramakrishna, P.; Rajkumari, R.; Cook, D. Indian black rice: A brewing raw material with novel functionality. J. Inst. Brew. 2019, 126, 35–45. [Google Scholar] [CrossRef]
- Borges, S.S.D.O.; Beinner, M.A.; Silva, J.B.B. Direct Method for Determination of Al, Cd, Cu, and Pb in Beers In Situ Digested by GF AAS Using Permanent Modifiers. Biol. Trace Elem. Res. 2015, 167, 155–163. [Google Scholar] [CrossRef] [PubMed]
- Voica, C.; Magdas, D.-A.; Feher, I. Metal Content and Stable Isotope Determination in Some Commercial Beers from Romanian Markets. J. Chem. 2015, 3, 192032. [Google Scholar] [CrossRef] [Green Version]
- Gama, E.M.; Nascentes, C.C.; Matos, R.P.; Rodrigues, G.D.C.; Rodrigues, G.D. A simple method for the multi-elemental analysis of beer using total reflection X-ray fluorescence. Talanta 2017, 174, 274–278. [Google Scholar] [CrossRef]
- Gajek, M.; Pawlaczyk, A.; Wysocki, P.; Szynkowska-Jozwik, M.I. Elemental Characterization of Ciders and Other Low-Percentage Alcoholic Beverages Available on the Polish Market. Molecules 2021, 26, 2186. [Google Scholar] [CrossRef] [PubMed]
- Potortì, A.G.; Lo Turco, V.; Di Bella, G. Chemometric analysis of elements content in Algerian spices and aromatic herbs. LWT-Food Sci. Technol. 2021, 138, 110643. [Google Scholar] [CrossRef]
- Potortì, A.G.; Daniel Bua, G.; Lo Turco, V.; Ben Tekaya, A.; Beltifa, A.; Ben Mansour, H.; Dugo, G.; Di Bella, G. Major, minor and trace element concentrations in spices and aromatic herbs from Sicily (Italy) and Mahdia (Tunisia) by ICP-MS and multivariate analysis. Food Chem. 2020, 313, 126094. [Google Scholar] [CrossRef]
- Lo Turco, V.; Potortì, A.G.; Tropea, A.; Dugo, G.; Di Bella, G. Element analysis of dried figs (Ficus carica L.) from the Mediterranean areas. J. Food Compos. Anal. 2020, 90, 103503. [Google Scholar] [CrossRef]
- Michalski, B. Aluminium Market. Available online: https://www.ism.uni.wroc.pl/sites/ism/art/michalski_rynek_aluminium.pdf (accessed on 17 February 2022).
- Reimann, C.; Birke, M.; Filzmoser, P. Bottled drinking water: Water contamination from bottle materials (glass, hard PET, soft PET), the influence of colour and acidification. Appl. Geochem. 2010, 25, 1030–1046. [Google Scholar] [CrossRef]
- Chen, G.; Leea, H.; Young, K.L.; Yue, P.L.; Wong, A.; Tao, T.; Choi, K.K. Glass recycling in cement production—An innovative approach. Waste Manag. 2002, 22, 747–753. [Google Scholar] [CrossRef]
- Federico, L.M.; Chidiac, S.E. Waste glass as a supplementary cementitious material in concrete—Critical review of treatment methods. Cem. Concr. Compos. 2009, 31, 606–610. [Google Scholar] [CrossRef]
- McKenzie, J.S.; Jurado, J.M.; de Pablos, F. Characterization of tea leaves according to their total mineral content by means of probabilistic neural networks. Food Chem. 2010, 123, 859–864. [Google Scholar] [CrossRef]
- Orisakwe, O.E.; Ajaezi, A.C. Heavy Metal Hazards of Functional Beverages in Nigeria. Mal. J. Nutr. 2014, 20, 121–131. [Google Scholar]
- Woldemariam, D.M.; Chandravanshi, B.S. Concentration levels of essential and non-essential elements in selected Ethiopian wines. Bull. Chem. Soc. Ethiop. 2011, 25, 169–180. [Google Scholar] [CrossRef]
- Tabira, B. Metals in Wine—Impact on Wine Quality and Health Outcomes. Biol. Trace Elem. Res. 2011, 144, 143–156. [Google Scholar]
- Gajek, M.; Pawlaczyk, A.; Szynkowska-Jozwik, M.I. Multi-Elemental Analysis of Wine Samples in Relation to Their Type, Origin and Grape Variety. Molecules 2021, 26, 214. [Google Scholar] [CrossRef]
- Regulation of the Minister of Health on the Maximum Levels of Biological and Chemical Contaminants that May Be Present in Food, Food Ingredients, Permitted Additives, Processing Aids or on the Surface of Food of 13 January 2003 (Journal of Laws of 2003). Available online: Sejm.gov.pl (accessed on 23 February 2022).
- WHO. Evaluation of Certain Food Additives and Contaminants: Seventy Fourth Report of the Joint FAO/WHO Expert Committee on Food Additives; WHO Technical Report Series no. 966; WHO: Rome, Italy, 2011. [Google Scholar]
- SCHER. Assessment of the Tolerable Daily Intake of Barium; 22 March 2012. Available online: https://ec.europa.eu/health/scientific_committees/environmental_risks/docs/scher_o_161.pdf (accessed on 29 March 2022).
- EFSA. Scientific Opinion on Dietary Reference Values for Chromium; 18 September 2014. Available online: www.efsa.europa.eu/efsajournal (accessed on 29 March 2022).
- WHO. Evaluation of Certain Food Additives and Contaminants: Twenty-Six Report of the Joint FAO/WHO Expert Committee on Food Additives; WHO Technical Report Series no. 683; WHO: Geneva, Switzerland, 1982. [Google Scholar]
- WHO. Evaluation of Certain Food Additives and Contaminants: Twenty-Seventh Report of the Joint FAO/WHO Expert Committee on Food Additives; WHO Technical Report Series no. 696; WHO: Geneva, Switzerland, 1983. [Google Scholar]
- US EPA Non-Carcinogen Tolerable Daily Intake (TDI) Values from US EPA. Available online: http://www.popstoolkit.com/tools/HHRA/TDI_USEPA.aspx (accessed on 23 February 2022).
- WHO. Evaluation of Certain Food Additives and Contaminants: Seventy-Seventh Report of the Joint FAO/WHO Expert Committee on Food Additives; WHO Technical Report Series no. 983; WHO: Rome, Italy, 2013. [Google Scholar]
- EFSA. Scientific Opinion on Safety and Efficacy of Cobalt Compounds (E3) as Feed Additives for All Animal Species: Cobaltous Acetate Tetrahydrate, Basic Cobaltous Carbonate Monohydrate and Cobaltous Sulphate Heptahydrate, Based on a Dossier Submitted by TREAC EEIG; 12 June 2012. Available online: https://efsa.onlinelibrary.wiley.com/doi/epdf/10.2903/j.efsa.2012.2791 (accessed on 29 March 2022).
- HC, Non-Carcinogen Tolerable Daily Intake (TDI) Values from Health Canada, Federal Contaminated Site Risk Assessment in Canada. Part II: Health Canada Toxicological Reference Values (TRVs). Version 2.0. Available online: http://www.popstoolkit.com/tools/HHRA/TDI_HealthCanada.aspx (accessed on 23 February 2022).
- EFSA. Update of the Risk Assessment of Nickel in Food and Drinking Water; 24 September 2020. Available online: https://efsa.onlinelibrary.wiley.com/doi/epdf/10.2903/j.efsa.2020.6268 (accessed on 29 March 2022).
- HC, 2014, Description—The Equation Used to Calculate the Tolerable Daily Intake (TDI) of Antimony. Available online: www.hc-sc.gc.ca (accessed on 23 February 2022).
- Pawlaczyk, A.; Gajek, M.; Jozwik, K.; Szynkowska, M.I. Multielemental Analysis of Various Kinds of Whisky. Molecules 2019, 24, 1193. [Google Scholar] [CrossRef] [Green Version]
- Konieczka, P.; Namieśnik, J. Walidacja procedur analitycznych. In Ocena i kontrola jakości wyników pomiarów analitycznych; Konieczka, P., Namieśnik, J., Eds.; Wydawnictwo Naukowo-Techniczne: Warsaw, Poland, 2007; pp. 225–300. [Google Scholar]


| Samples | Elements | Technique + Preparation Process | Conclusions | Ref. |
|---|---|---|---|---|
| 68 samples of beer (15 samples from Germany, 18 samples from Portugal, 35 samples from Spain) | Al, Ba, Ca, Fe, K, Mg, Mn, Na, P, Sr, Zn | ICP-AES Digestion with 65% HNO3 and 30% H2O2 | Elemental contents for all samples [mg/L]: Al: 0.05–2.78; Ba: 0.01–0.06 Ca: 21.8–108.5; Fe: 0.03–1.41 K: 251.0–570.3; Mg: 43.1–210.4 Mn: 0.03–0.35; Na: 8.4–129.6 P: 108.6–382.3; Sr: 0.10–0.76 Zn: n.d.–0.98 | [3] |
| 35 samples of Polish beer (30 bottled and 5 canned) | Ag, Cd, Co, Cr, Cu, Fe, Hg, Mn, Ni, Pb, Sb, Sn, Zn | ICP-MS Digestion of 1 mL of degassed beer with 5 mL of concentrated HNO3 in automatic microwave digestion system | Elemental contents for all samples [ng/mL]: Ag: 0.01–0.20; Cd: 0.02–0.53 Co: 0.08–0.57; Cr: 3.8–45; Cu: 29–150; Fe: 45–530; Hg: 0.08–0.64; Mn: 53–470 Ni: 3.8–200; Pb: 1.4–6.0; Sb: 0.16–0.91; Sn: 0.42–3.4; Zn: 4.0–120 | [7] |
| 8 samples (4 beer samples and 4 wort samples) | Ca, Cu, Fe, K, Mg, Mn, Na, Zn | ICP-OES Degasification (20 min) + filtering (wort samples only) + dilution of 8 mL wort sample in 32 mL of 8.8% HNO3 and 3.8% ethanol; dilution of 10 mL beer sample in 10 mL of 14% HNO3. All samples were stored at 4 °C before analysis | Metal contents for wort samples [mg/L]: Ca: 74–96; Cu: 0.195–0.357 Fe: 0.045–0.149; K: 775–1125 Mg: 111–178 mg/L; Mn: 0.150–0.263 Na: 26–36; Zn: 0.163–0.262 Metal contents for beer samples [mg/L]: Ca: 61–101; Cu: 0.047–0.148 Fe: 0.023–0.038; K: 464–850 Mg: 90–145; Mn: 0.132–0.308 Na: 12–26; Zn: 0.000–0.028 | [10] |
| 48 samples of beer (16 samples from following stages of the production of 3 types of lager craft beer from 4 breweries) | As, Cd, Cr, Cu, Fe, Ni, Pb, Zn | ICP-MS Microwave mineralization with 3 mL of 65% HNO3, 1 mL of 30% H2O2 and 0.2 mL of 50% HF | All samples were measured in four breweries. Metal contents [μg/kg]: Cd: n.d.–91.43 Cr: n.d.–118.15 Cu: n.d.–3723.10 Fe: n.d.–91.05 Ni: <LOD for all samples Pb: <LOD for all samples Zn: n.d.–1081.60 | [11] |
| 4 samples of Brazilian beer | Cu, Mn, Pb, Zn | TS-FF-AAS, GFAAS Degasification in an ultrasonic bath for 20 min + dilution in the proportions 1:1 to 1:5 with 0.14 mol/l HNO3 depending on the analyte and the sample | Metal contents for all samples [μg/L]: Cu: TS-FF-AAS: 38.0–155; GFAAS: 39.9–160 Mn: TS-FF-AAS: 110–348; GFAAS: 117–355 Pb: TS-FF-AAS: 13.0–32.9; GFAAS: 14.1–4.6 Zn TS-FF-AAS: 52.7–226; GFAAS: 55.3–231 | [12] |
| 6 samples of Polish beer | Cu, Fe, Mn | F-AAS Filtration + degasification of 20 mL of the sample + digestion on a hot plate in glass beakers to reduce the sample volume to about 1 mL + dilution with 3 mL of concentrated HNO3 and evaporation of the samples nearly to dryness. Addition of 5 mL of 30% H2O2 to the residues + heating. Reduction of volume up to 1 mL and subsequent dilution to 10 mL. | Metal contents for all samples: Cu: 0.072–0.114 mg/L Fe: 0.209–0.345 mg/L Mn: 0.070–0.165 mg/L | [13] |
| 24 samples of 4 types of beer (pale barley, dark barley, pale wheat and dark wheat) Samples from 5 countries | Al, Ba, Cd, Co, Cr, Cu, Fe, Mn, Mo, Ni, Pb, Sr, Zn | ICP-MS Degasification + 20 mL of beer sample + 5 mL of HNO3 + left to stand overnight. Addition of 5 mL of HNO3 to beer sample at a speed of 1 mL/h + pre-digestion at temperature 60 °C for 30 min. Addition 3 mL of 30% H2O2 + digestion at 120 °C for 90 min + dilution to final volume of 50 mL with ultrapure water | Metal contents for all samples [μg/L]: Al: <LOD–92.8; Ba: 9.95–39.9 Cd: <LOD; Co: 0.169–0.481 Cr: 0.919–16.7; Cu: 27.3–109.0 Fe: <LOD; Mn: 41.0–260.0 Mo: 1.73–18.3; Ni: <LOD–13.7 Sr: 50.7–212.0; Pb: <LOD–6.01 Zn: 23.9–101.3 | [14] |
| 40 samples of beer (30 bottled and 10 canned) | Cd, Co, Cr, Mo, Ni, Pb, Sb | ICP-MS Placement of 4.50 g of beer sample into a Teflon beaker + drying on a hot plate at 185 °C. Addition of 3 mL of concentrated HNO3 + the heating of the sample at 185 °C until only a few drops were left. Addition of 1 mL of 30% H2O2 + heating of the sample until it is dry + cooling the beaker. Addition of 2% HNO3 + dilution to final volume of 10 ml | Metal contents for all samples: Cd: n.d.–2.63 ng/g Co: 0.08–0.48 ng/g Cr: 2.97–40.61 ng/g Mo: 0.74–29.05 ng/g Ni: 2.20–26.76 ng/g Pb: 0.23–7.48 ng/g Sb: 0.11–1.97 ng/g | [15] |
| 7 samples of Brazilian beer (Pilsen, craft and dark) | Al, Ba, Ca, Co, Cr, Cu, Fe, K, Mg, Mn, Na, Ni, Sr, Zn | ICP-OES, MIP-OES Dilution of the samples with 1.0 M HNO3 at ratio 1:4 with internal standard solutions (Be, Ga, Sc, In and Y) | Metal contents for all samples measured by ICP-OES [μg/L]: Al: <LOQ–401; Ba: 6–154; Ca: 12–112; Co: 95–195; Cr: 30–37; Cu: 30–81; Mn: 88–160; Fe: <LOQ–86; Ni: 318–610; Sr: 53–475; Zn: 55–164 [mg/L] K: 251–548; Mg: 24–79; Na: 51–171 | [16] |
| 30 samples of Greek beer (11 Ale, 10 Lager, 5 Pilsner, 2 Porter, 1 Weiss and 1 Barley wine beer) | Ba, Cd, Co, Cr, Cu, Fe, Mn, Ni, Pb, Sr, Zn | ICP-MS Ultrasonication with N2 + digestion with 65% HNO3 and 30% H2O2 | Mean values of metal contents in beer [μg/L]: Ba: 11–56; Cd: 0.01–1; Co: 0.001–1.1 Cr: 1.7–48; Cu: 0.01–84; Fe: 58–838 Mn: 44–377; Ni: 3.1–40; Pb: 0.39–11 Sr: 58–292; Zn: 0.05–105 | [17] |
| 2 samples of beer (brewed from 100% malted black and white rice from India) | Ag, Al, Ba, Ca, Cd, Co, Cr, Cu, Fe, K, Mg, Mn, Mo, Na, Ni, P, Pb, S, Sr, Ti, Zn | ICP-MS Degasification (5 min) + dilution with 2% HNO3 at ratio 1:10 | Higher contents of the following elements in white rice beer: Cd; Co; Cr; Cu; Fe; Mo; Na; Ni; Pb; S; Sr Higher contents of the following elements in black rice beer: Al; Ba; Ca; K; Mg; Mn; P; Ti; Zn | [18] |
| 20 samples of beer (13 from Brazil and 7 imported) | Al, Cd, Cu, Pb | GFAAS Degasification of beer + dilution with 0.2% HNO3 | Mean contents for all samples [μg/L]: Al: 10.0; Cd: 0.6; Cu: 17.0; Pb: 29.0 | [19] |
| 20 samples of Romanian bottled beer | Al, Ba, Ca, Cd, Cr, Cu, Fe, K, Mg, Mn, Na, Ni, P, Pb, Zn | ICP-MS, IRMS Degasification of 20 mL of beer for 20 min + filtration by passing through a 0,45 μm pore size membrane filter (process was repeated 3 times for complete degasification) | Elemental contents for all samples measured by ICP-MS [μg/L]: Al: 64.6–2617.6; Ba: 5.2–75.7 Cd: <0.001–0.4; Cr: 20.3–441.7 Cu: 25.9–73.6; Mn: 4.2–231.7 Ni: <0.001–187.1; Pb: <0.001–12.6 Zn: <0.001–704.2 [mg/L]: Fe: 0.2–3.5; Ca: 7.8–62.2; K: 29.8–197.0 Mg: 22.5–84.7; Na: 5.2–154.9; P: 66.0–154.3 | [20] |
| 30 samples of Brazilian beer | Ca, Cu, Fe, K, Mn, Ni, P, Pb, S, Sr, Zn | TXRF Degasification in an ultrasonic bath | Elemental contents for all samples measured by TXRF [mg/L]: Ca: 9.82–96; Cu: <LOD–0.32 Fe: 0.07–1.57; K: 183.79–418.47 Mn: 0.06–1.42; Ni: <LOD–1.13 P: 37.40–149.85; Pb: <LOD–0.18 S: 10.32–50.73; Sr: <LOD–0.41 Zn: 0.02–1.98 | [21] |
| 73 samples (25 samples of Polish ciders, and 40 samples of low-percentage, flavored alcoholic beverages based on beer from Polish market) | Ag, Al, Ba, Ca, Cd, Co, Cr, Cu, Fe, Hg, K, Mg, Mn, Na, Ni, Pb, Sr, Ti, Zn | ICP-OES, ICP-MS, CVAAS Degasification in an ultrasonic washer + dilution with 4 mL of 65% HNO3 + microwave mineralization + addition internal standard solution (In) + dilution with ultrapure deionized water up to 25 mL | Metal contents for low-percentage, flavored alcoholic beverages based on beer [μg/L]: Ag: 0.046–2.569; Al: 854.4–1905 Ba: 71.58–211.2; Cd: 0.046–0.422 Co: 0.032–1.408; Cr: 2.258–74.91 Cu: 4.937–95.38; Mn: 38.29–269.0 Ni: 3.161–111.1; Pb: <LOD–16.93 Sr: 4.881–29.57; Ti: <LOD–24.02 Zn: 2.521–92.24; Hg: <LOD [mg/L]: Ca: 31.09–140.4; Fe: <LOD–1.298 K: 24.86–489.5; Mg: 21.52–114.8 Na: 17.12–334.3 | [22] |
| Elements | n | Concentration Unit | Mean | Median | Min | Max | Std.dev. |
|---|---|---|---|---|---|---|---|
| 55Mn | 50 | µg/L | 130.2 | 119.7 | 63.19 | 282.8 | 54.66 |
| 59Co | 9.808 | 7.628 | 2.430 | 23.69 | 7.837 | ||
| 60Ni | 19.68 | 15.48 | 10.20 | 44.67 | 8.703 | ||
| 95Mo | 4.674 | 4.164 | 1.938 | 10.08 | 2.157 | ||
| 107Ag | 3.201 | 2.151 | <LOQ | 17.73 | 3.596 | ||
| 111Cd | 6.461 | 5.377 | 1.349 | 16.78 | 5.431 | ||
| 118Sn | 1.830 | 1.790 | 0.698 | 4.636 | 0.747 | ||
| 121Sb | 0.587 | 0.194 | <LOQ | 2.996 | 0.862 | ||
| 208Pb | 12.13 | 11.55 | <LOQ | 31.34 | 8.383 | ||
| Al 396.152 | mg/L | 3.125 | <LOQ | <LOQ | 20.06 | 5.786 | |
| Ba 455.403 | 0.032 | <LOQ | <LOQ | 0.837 | 0.124 | ||
| Ca 393.366 | 48.16 | 42.45 | 17.14 | 87.75 | 22.41 | ||
| Cr 267.716 | 0.044 | 0.041 | <LOQ | 0.097 | 0.018 | ||
| Cu 327.396 | 0.057 | 0.056 | <LOQ | 0.095 | 0.016 | ||
| Fe 259.940 | 0.280 | 0.203 | <LOQ | 0.939 | 0.220 | ||
| K 766.490 | 428.9 | 437.4 | 291.3 | 607.5 | 62.27 | ||
| Mg 279.553 | 80.19 | 80.28 | 47.33 | 106.4 | 15.19 | ||
| Na 589.592 | 33.64 | 24.65 | 3.490 | 99.16 | 24.54 | ||
| P 177.495 | 230.5 | 224.7 | 18.58 | 381.9 | 65.77 | ||
| S 180.731 | 67.07 | 66.55 | 6.437 | 99.84 | 16.76 | ||
| Sr 407.771 | 0.232 | 0.127 | 0.070 | 1.917 | 0.429 | ||
| Ti 334.941 | 0.008 | <LOQ | <LOQ | 0.170 | 0.025 | ||
| Zn 213.856 | 0.274 | 0.119 | <LOQ | 1.106 | 0.353 |
| Brand Code | H | L | W | Z | ZZ | |||||
|---|---|---|---|---|---|---|---|---|---|---|
| ZZB | ||||||||||
| Type of Packaging | C | B | C | B | C | B | C | B | C | B |
| n | 3 | 3 | 3 | 3 | 3 | 3 | 3 | 3 | 3 | 3 |
| Total | 6 | 6 | 6 | 6 | 6 | |||||
| Washout Experiment | 3 bottles | - | 3 bottles | 3 cans | 3 bottles | |||||
| Elements | Type of Packaging | n | Mean | Median | Min | Max | Std.dev. |
|---|---|---|---|---|---|---|---|
| Na 589.592 | bottle | 15 | 39.93 | 38.12 | 29.69 | 58.74 | 8.877 |
| can | 18.02 | 18.03 | 3.490 | 25.85 | 5.822 | ||
| 55Mn | bottle | 94.82 | 93.48 | 46.06 | 136.8 | 32.44 | |
| can | 152.6 | 154.0 | 96.97 | 227.9 | 38.95 | ||
| Al 396.152 | bottle | <LOQ | <LOQ | <LOQ | <LOQ | 0.000 | |
| can | 10.41 | 9.370 | 1.260 | 20.06 | 5.990 |
| Elements | Type of Packaging | n | Mean | Median | Min | Max | Std.dev. |
|---|---|---|---|---|---|---|---|
| Al 396.152 | bottle | 9 | <LOQ | <LOQ | <LOQ | <LOQ | 0.000 |
| can | 3 | 0.302 | 0.317 | 0.040 | 0.550 | 0.255 |
| ZZB-H | ZZB-W | ZZB-L | ZZB-Z | Z-L | Z-H | Z-W | L-H | L-W | H-W |
|---|---|---|---|---|---|---|---|---|---|
| Ag; Cd; Co | Ag; Cd; Co | Cd; Co; Mg; S; Sb; Zn; pH | pH | Cd; K; Sn; Mg; P; Zn | Ca; K; Mg; Sn; Sr | Pb | Ca; Sb | Ca; K; Mg; P; S; Sb | Sr |
| Criterion | Parameters |
|---|---|
| Lager—Ale | Ag; Cd; Co; Ni; Mn; Pb; Zn; pH |
| Lager—Craft | Ag; Ca; Cd; Co; Cu; Ni; Mn; Pb; Zn |
| Ale—Craft | pH |
| Element | PTDI | Year | Reference |
|---|---|---|---|
| Al | 0.267 mg/kg bw | 2011 | WHO [36] |
| Ba | 0.200 mg/kg bw | 2012 | SCHER [37] |
| Cr | 0.300 mg/kg bw | 2014 | EFSA [38] |
| Cu | 0.500 mg/kg bw | 1982 | WHO [39] |
| Fe | 0.800 mg/kg bw | 2010 | EFSA, FAO/WHO [40] |
| Sr | 0.600 mg/kg bw | 2007 | US EPA [41] |
| Zn | 0.566 mg/kg bw | 2007 | US EPA [41] |
| Ag | 5.000 μg/kg bw | 2007 | US EPA [41] |
| Cd | 0.833 μg/kg bw | 2013 | WHO [42] |
| Co | 23.00 μg/kg bw | 2012 | EFSA [43] |
| Mn | 156.0 μg/kg bw | 2007 | HC1 [44] |
| Mo | 5.000 μg/kg bw | 2007 | US EPA [41] |
| Ni | 13.00 μg/kg bw | 2020 | EFSA [45] |
| Sb | 0.200 μg/kg bw | 2014 | Health Canada [46] |
| Sn | 600.0 μg/kg bw | 2007 | US EPA [41] |
| No. | ICP-MS | ICP-OES | |||||||||||||
|---|---|---|---|---|---|---|---|---|---|---|---|---|---|---|---|
| Mn | Co | Ni | Mo | Ag | Cd | Sn | Sb | Al | Ba | Cr | Cu | Fe | Sr | Zn | |
| 1 | 426 | 440 | 97.5 | 69.5 | - | 40.8 | 24347 | 116 | - | - | 466 | 1118 | 432 | 737 | 459 |
| 2 | 474 | 872 | 131 | 78.1 | 2454 | 57.7 | 39548 | 255 | - | - | 432 | 1022 | 708 | 702 | - |
| 3 | 327 | 110 | 40.7 | 76.0 | 39.5 | 41.4 | 18120 | 102 | - | 161 | 490 | 740 | 129 | 529 | 126 |
| 4 | 113 | 891 | 132 | 259 | 914 | 61.5 | 30992 | 253 | 1.86 | - | 1511 | 1113 | 316 | 576 | 512 |
| 5 | 117 | 1019 | 144 | 273 | 5260 | 61.1 | 40025 | 143 | 2.10 | 223 | - | 1216 | 362 | 483 | - |
| 6 | 116 | 1001 | 153 | 250 | 3291 | 86.4 | 42506 | 150 | 3.44 | - | - | 1390 | 503 | 575 | - |
| 7 | 160 | 1128 | 126 | 252 | 544 | 73.7 | 37497 | 11.9 | - | 416 | 476 | 1576 | 460 | 689 | - |
| 8 | 161 | 1325 | 126 | 213 | 137522 | 75.9 | 32841 | 11.7 | - | 33.4 | 536 | 1375 | 512 | 768 | - |
| 9 | 165 | 1044 | 119 | 232 | 323 | 76.6 | 37944 | 12.5 | - | - | 768 | 917 | 379 | 815 | - |
| 10 | 142 | 893 | 63.7 | 183 | 1195 | 48.4 | 57995 | 9.35 | 2.21 | 148 | 1689 | 1371 | 395 | 567 | - |
| 11 | 142 | 825 | 103 | 157 | 712 | 50.0 | 29635 | 10.2 | 2.42 | 204 | 1703 | 1101 | 336 | 505 | - |
| 12 | 148 | 826 | 117 | 164 | 557 | 49.3 | 37858 | 9.71 | 14.9 | - | 1702 | 1223 | 512 | 654 | - |
| 13 | 208 | 875 | 134 | 103 | - | 58.6 | 37188 | 107 | 2.90 | - | 1011 | 1391 | 149 | 601 | - |
| 14 | 225 | 810 | 123 | 107 | 2728 | 45.5 | 46061 | 115 | 2.34 | - | 879 | 1237 | 567 | 602 | - |
| 15 | 225 | 1008 | 147 | 106 | 22882 | 57.1 | 66233 | 194 | 4.17 | - | 999 | 1083 | 598 | 594 | - |
| 16 | 234 | 961 | 143 | 92.4 | 399 | 53.1 | 48064 | 122 | - | - | 1012 | 1113 | 650 | 662 | - |
| 17 | 287 | 1009 | 178 | 361 | 8705 | 59.0 | 61903 | 162 | - | - | 1194 | 1114 | 651 | 631 | - |
| 18 | 225 | 994 | 143 | 84.0 | 4495 | 56.6 | 66550 | 181 | - | - | 1013 | 1239 | 607 | 662 | 1314 |
| 19 | 107 | 1045 | 167 | 340 | 3402 | 58.2 | 59505 | 207 | - | - | 1014 | 1116 | 703 | 475 | - |
| 20 | 106 | 907 | 137 | 350 | - | 51.9 | 47839 | 168 | - | - | 1196 | 1395 | 588 | 493 | - |
| 21 | 101 | 904 | 121 | 314 | 1157 | 53.7 | 45868 | 146 | - | - | 1018 | 933 | 679 | 477 | - |
| 22 | 240 | 822 | 131 | 143 | 8066 | 51.7 | 38163 | 268 | - | - | 879 | 1391 | 586 | 530 | - |
| 23 | 244 | 851 | 121 | 167 | 7063 | 53.1 | 43477 | 217 | - | - | - | - | - | 531 | - |
| 24 | 249 | 1056 | 165 | 167 | - | 68.5 | 35862 | - | - | - | 1019 | 1868 | 571 | 534 | - |
| 25 | 291 | 453 | 155 | 168 | 264 | 22.5 | 120345 | 37.9 | - | - | 1021 | 1872 | 130 | 832 | 649 |
| 26 | 299 | 379 | 82.0 | 95.2 | 328 | 17.1 | 89943 | 24.8 | - | - | 703 | 1606 | 119 | 950 | 273 |
| 27 | 335 | 378 | 161 | 178 | 293 | 19.7 | 72492 | 29.5 | - | - | 1197 | 2235 | 123 | 1099 | 388 |
| 28 | 194 | 416 | 139 | 140 | 353 | 20.9 | 58051 | 10.4 | 6.35 | - | 1016 | 1096 | 608 | 780 | 355 |
| 29 | 333 | 387 | 161 | 189 | 311 | 18.3 | 79832 | 35.9 | 14.4 | - | 1197 | 1216 | 570 | 1099 | 2259 |
| 30 | 346 | 426 | 158 | 189 | 380 | 20.4 | 117420 | 38.6 | 29.7 | - | 1195 | 1214 | 651 | 1195 | 679 |
| 31 | 172 | 331 | 97.3 | 117 | 294 | 17.8 | 56199 | - | - | - | 1199 | 1399 | 837 | 829 | 246 |
| 32 | 186 | 418 | 111 | 125 | 308 | 21.0 | 73418 | 99.9 | - | - | 1193 | 1392 | 761 | 879 | 4848 |
| 33 | 169 | 334 | 96.0 | 115 | 129 | 18.5 | 64656 | 162 | - | - | 1195 | 1239 | 834 | 826 | 265 |
| 34 | 175 | 377 | 108 | 98.0 | 261 | 18.2 | 55872 | 129 | 3.99 | - | 1192 | 1391 | 795 | 734 | 4845 |
| 35 | 126 | 333 | 99.4 | 92.8 | 171 | 18.3 | 94179 | 113 | 5.91 | - | 1194 | 1393 | 155 | 778 | 644 |
| 36 | 95.9 | 276 | 57.6 | 317 | 155 | 15.2 | 56649 | 146 | 4.04 | - | 1199 | 1017 | 536 | 445 | 346 |
| 37 | 93.6 | 308 | 86.3 | 223 | 107 | 14.5 | 111252 | 206 | - | - | 1011 | 1011 | 701 | 776 | 195 |
| 38 | 107 | 297 | 119 | 352 | 210 | 16.0 | 113663 | 167 | - | - | 1187 | 852 | 1081 | 821 | 555 |
| 39 | 77.2 | 136 | 46.1 | 232 | 87.9 | 7.19 | 35419 | 97.5 | - | - | 793 | 947 | 500 | 452 | 71.6 |
| 40 | 99.9 | 154 | 59.9 | 251 | 102 | 7.86 | 61474 | - | - | - | 890 | 1252 | 771 | 609 | 116 |
| 41 | 102 | 182 | 62.3 | 354 | 125 | 8.80 | 74451 | 147 | - | - | 784 | 1248 | 802 | 514 | 104 |
| 42 | 183 | 135 | 55.7 | 104 | 91.0 | 7.71 | 43904 | 163 | - | - | 887 | 802 | 434 | 43.8 | 89.2 |
| 43 | 179 | 125 | 50.5 | 108 | 79.1 | 6.95 | 33187 | 217 | - | - | 780 | 1596 | 403 | 44.3 | 78.8 |
| 44 | 182 | 136 | 52.2 | 98.6 | 88.1 | 7.49 | 38329 | 142 | - | - | 888 | 1405 | 396 | 44.0 | 89.9 |
| 45 | 258 | 149 | 69.6 | 185 | 83.5 | 7.22 | 32254 | 204 | - | - | 908 | 885 | 479 | 1046 | 93.3 |
| 46 | 281 | 163 | 70.9 | 191 | 96.8 | 7.03 | 38098 | 178 | - | - | 897 | 1263 | 598 | 1033 | 117 |
| 47 | 270 | 142 | 61.3 | 190 | 82.4 | 6.98 | 30825 | 116 | - | - | 884 | 1018 | 706 | 1102 | 104 |
| 48 | 313 | 157 | 68.8 | 168 | 104 | 7.26 | 50096 | 183 | - | - | 1021 | 936 | 480 | 1021 | 122 |
| 49 | 313 | 149 | 63.4 | 168 | 97.2 | 7.28 | 40840 | 177 | - | - | 1027 | 1130 | 407 | 837 | 97.9 |
| 50 | 106 | 298 | 62.8 | 220 | 178 | 11.9 | 49138 | 129 | - | - | 780 | 860 | 536 | 828 | 76.4 |
| Brand code | H | L | W | Z | ZZ | C | JO | B | HM | |||||||||||||
|---|---|---|---|---|---|---|---|---|---|---|---|---|---|---|---|---|---|---|---|---|---|---|
| ZZB | ZZJ | ZZK | ||||||||||||||||||||
| Type of Packaging | C | B | C | B | C | B | C | B | C | B | C | B | C | B | C | B | C | B | C | B | C | B |
| n | 3 | 3 | 3 | 3 | 3 | 3 | 3 | 3 | 3 | 3 | 0 | 3 | 0 | 3 | 0 | 3 | 0 | 3 | 0 | 5 | 0 | 3 |
| Total | 6 | 6 | 6 | 6 | 6 | 3 | 3 | 3 | 3 | 5 | 3 | |||||||||||
| Beer Type | L | L | L | L | Ale | L | Ale | L | CR | CR | CR | |||||||||||
| Country of Origin | Poland | |||||||||||||||||||||
| Parameter and accessories | ICP OES | ICP MS |
|---|---|---|
| Number of replicates | 3 | 3 |
| Carrier gas | Argon | Argon |
| Plasma gas flow rate [L·min−1] | 12 | 10 |
| Auxiliary gas flow rate [L·min−1] | 0.5 | 0.76 |
| Nebulization gas flow rate [L·min−1] | 0.5 | 0.9 |
| Nebulization gas pressure [kPa] | 260 | 290 |
| Pump speed during the sampling [rmp] | 50 | 30 |
| Torch | Quartz | Quartz |
| Nebulizer | Concentric quartz | Concentric quartz |
| Generator power [W] | 1150 | 1317 |
| Internal standard | In | In |
| ICP-OES | CV [%] | |||||||
| Analyte | n | Equation | LOD [mg/L] | LOQ [mg/L] | CRM Values (TMDA 54.6, * NCS ZC 8100 2b) | |||
| Certified Value | Obtained Value | |||||||
| Al | 7 | 0.999 | 0.010 | 0.030 | 0.389 ± 0.028 mg/L | 0.372 ± 0.001 mg/L | 96 | |
| Ba | 7 | 1.000 | 0.013 | 0.039 | 0.324 ± 0.019 mg/L | 0.339 ± 0.001 mg/L | 105 | |
| Ca | 7 | 1.000 | 0.013 | 0.039 | * 1537 ± 68.00 μg/g | * 1592 ± 2.500 mg/L | 104 | |
| Cr | 7 | 1.000 | 0.006 | 0.018 | 0.421 ± 0.022 mg/L | 0.428 ± 0.002 mg/L | 102 | |
| Cu | 7 | 1.000 | 0.006 | 0.018 | 0.393 ± 0.026 mg/L | 0.392 ± 0.002 mg/L | 100 | |
| Fe | 7 | 1.000 | 0.033 | 0.099 | 0.367 ± 0.023 mg/L | 0.379 ± 0.001 mg/L | 103 | |
| K | 7 | 1.000 | 0.029 | 0.087 | * (14.40) μg/g | * 15.84 ± 2.000 μg/g | 110 | |
| Mg | 7 | 0.999 | 0.081 | 0.243 | * 248.0 ± 14.00 μg/g | * 251.6 ± 1.200 μg/g | 101 | |
| Na | 7 | 1.000 | 0.050 | 0.150 | * 445.0 ± 40.00 μg/g | * 468.7 ± 4.500 μg/g | 105 | |
| P | 3 | 1.000 | 0.012 | 0.036 | * 174.0 ± 43.00 μg/g | * 154.8 ± 0.011μg/g | 89 | |
| S | 3 | 0.999 | 0.040 | 0.120 | * (4.620) % | * 4.361 ± 0.006% | 94 | |
| Sr | 7 | 1.000 | 0.005 | 0.015 | 0.573 ± 0.031 mg/L | 0.610 ± 0.001 mg/L | 106 | |
| Ti | 3 | 1.000 | 0.003 | 0.009 | 0.032 ± 0.003 mg/L | 0.032 ± 0.001 mg/L | 100 | |
| Zn | 7 | 0.998 | 0.009 | 0.027 | 0.540 ± 0.035 mg/L | 0.557 + 0.006 mg/L | 103 | |
| ICP-MS | CV [%] | |||||||
| Analyte | n | Equation | LOD [μg/L] | LOQ [μg/L] | CRM Values (TMDA 54.6, *NCS ZC 8100 2b) | |||
| Certified Value | Obtained Value | |||||||
| Ag | 7 | 0.999 | 0.001 | 0.003 | 12.90 ± 1.100 μg/L | 13.01 ± 0.617 μg/L | 101 | |
| Cd | 7 | 0.999 | 0.001 | 0.003 | 156.0 ± 8.000 μg/L | 160.3 ± 7.481 μg/L | 103 | |
| Co | 7 | 0.999 | 0.025 | 0.075 | 305.0 ± 20.00 μg/L | 281.4 ± 0.392 μg/L | 92 | |
| Mn | 7 | 0.999 | 0.048 | 0.144 | 274.0 ± 13.00 μg/L | 238.8 ± 1.719 μg/L | 87 | |
| Mo | 7 | 0.999 | 0.039 | 0.117 | 292.0 ± 20.00 μg/L | 279.7 ± 7.016 μg/L | 96 | |
| Ni | 7 | 0.999 | 0.102 | 0.306 | 323.0 ± 19.00 μg/L | 297.0 ± 0.366 μg/L | 92 | |
| Pb | 7 | 0.999 | 0.096 | 0.288 | 490.0 ± 30.00 μg/L | 473.8 ± 22.75 μg/L | 97 | |
| Sb | 4 | 0.999 | 0.032 | 0.096 | * 120.0 ± 20.00 ng/g | * 132.03 ± 15.26 ng/g | 110 | |
| Sn | 4 | 0.999 | 0.002 | 0.006 | 45.30 ± 3.100 μg/L | 42.53 ± 1.360 μg/L | 94 | |
| Tl | 7 | 0.999 | 0.002 | 0.006 | 28.20 ± 1.900 μg/L | 28.51 ± 1.463 μg/L | 101 | |
Publisher’s Note: MDPI stays neutral with regard to jurisdictional claims in published maps and institutional affiliations. |
© 2022 by the authors. Licensee MDPI, Basel, Switzerland. This article is an open access article distributed under the terms and conditions of the Creative Commons Attribution (CC BY) license (https://creativecommons.org/licenses/by/4.0/).
Share and Cite
Gajek, M.; Wysocki, P.; Pawlaczyk, A.; Sać, Ł.; Szynkowska-Jóźwik, M.I. The Elemental Profile of Beer Available on Polish Market: Analysis of the Potential Impact of Type of Packaging Material and Risk Assessment of Consumption. Molecules 2022, 27, 2962. https://doi.org/10.3390/molecules27092962
Gajek M, Wysocki P, Pawlaczyk A, Sać Ł, Szynkowska-Jóźwik MI. The Elemental Profile of Beer Available on Polish Market: Analysis of the Potential Impact of Type of Packaging Material and Risk Assessment of Consumption. Molecules. 2022; 27(9):2962. https://doi.org/10.3390/molecules27092962
Chicago/Turabian StyleGajek, Magdalena, Piotr Wysocki, Aleksandra Pawlaczyk, Łucja Sać, and Małgorzata Iwona Szynkowska-Jóźwik. 2022. "The Elemental Profile of Beer Available on Polish Market: Analysis of the Potential Impact of Type of Packaging Material and Risk Assessment of Consumption" Molecules 27, no. 9: 2962. https://doi.org/10.3390/molecules27092962
APA StyleGajek, M., Wysocki, P., Pawlaczyk, A., Sać, Ł., & Szynkowska-Jóźwik, M. I. (2022). The Elemental Profile of Beer Available on Polish Market: Analysis of the Potential Impact of Type of Packaging Material and Risk Assessment of Consumption. Molecules, 27(9), 2962. https://doi.org/10.3390/molecules27092962