2.1. HPLC Conditions
Due to the complexity of chemical constituents in A. rupestris, it is crucial to separate the target components efficiently by optimizing chromatographic conditions.
The HPLC chromatographic peaks of
A. rupestris were most informative with the ultraviolet (UV) wavelength of detection set at 350 nm. Therefore, we chose 350 nm for the assay of the selected components. The mobile phase consisted of acetonitrile-0.2% phosphoric acid at 1.0 mL/min of flow rate. The gradient elution program used is described in
Section 3.5 and the favorable column temperature was set at 35 °C. The extraction solvent was ethanol-water (7:3,
v/v) solution, and samples were treated for 30 min by ultrasonic extraction. The samples of
A. rupestris, and the mixed standard solutions containing the 10 reference substances, were analyzed under the conditions described in
Section 3.5. The chromatographic peak position of the standard substances was determined as follows: chlorogenic acid, apigenin-C-6,8-pentoside-hexoside, apigenin-C-6,8-di-pentoside, luteolin, 3,4-dicaffeoylquinic acid, 3,5-dicaffeoylquinic acid, 4,5-dicaffeoylquinic acid, linarin, chrysosplenetin B, and sbsinthin (
Figure 1).
According to the retention time in the chromatogram of the sample and standard solution, peaks 1, 2, 3, 4, 5, 6, 7, 8, 9, and 10 were identified to be chlorogenic acid, apigenin-C-6,8-pentoside-hexoside, apigenin-C-6,8-di-pentoside, luteolin, 3,4-dicaffeoylquinic acid, 3,5-dicaffeoylquinic acid, 4,5-dicaffeoylquinic acid, linarin, chrysosplenetin B, and sbsinthin, respectively. In addition, each peak was well separated in the present HPLC system.
2.3. Fingerprints Analysis
Traditional Chinese medicine fingerprint is a comprehensive and quantifiable identification method, and is mainly used to evaluate the authenticity and the quality of traditional Chinese medicine and semi-finished products of traditional Chinese medicine preparations. For establishment of a novel method for multiple components from
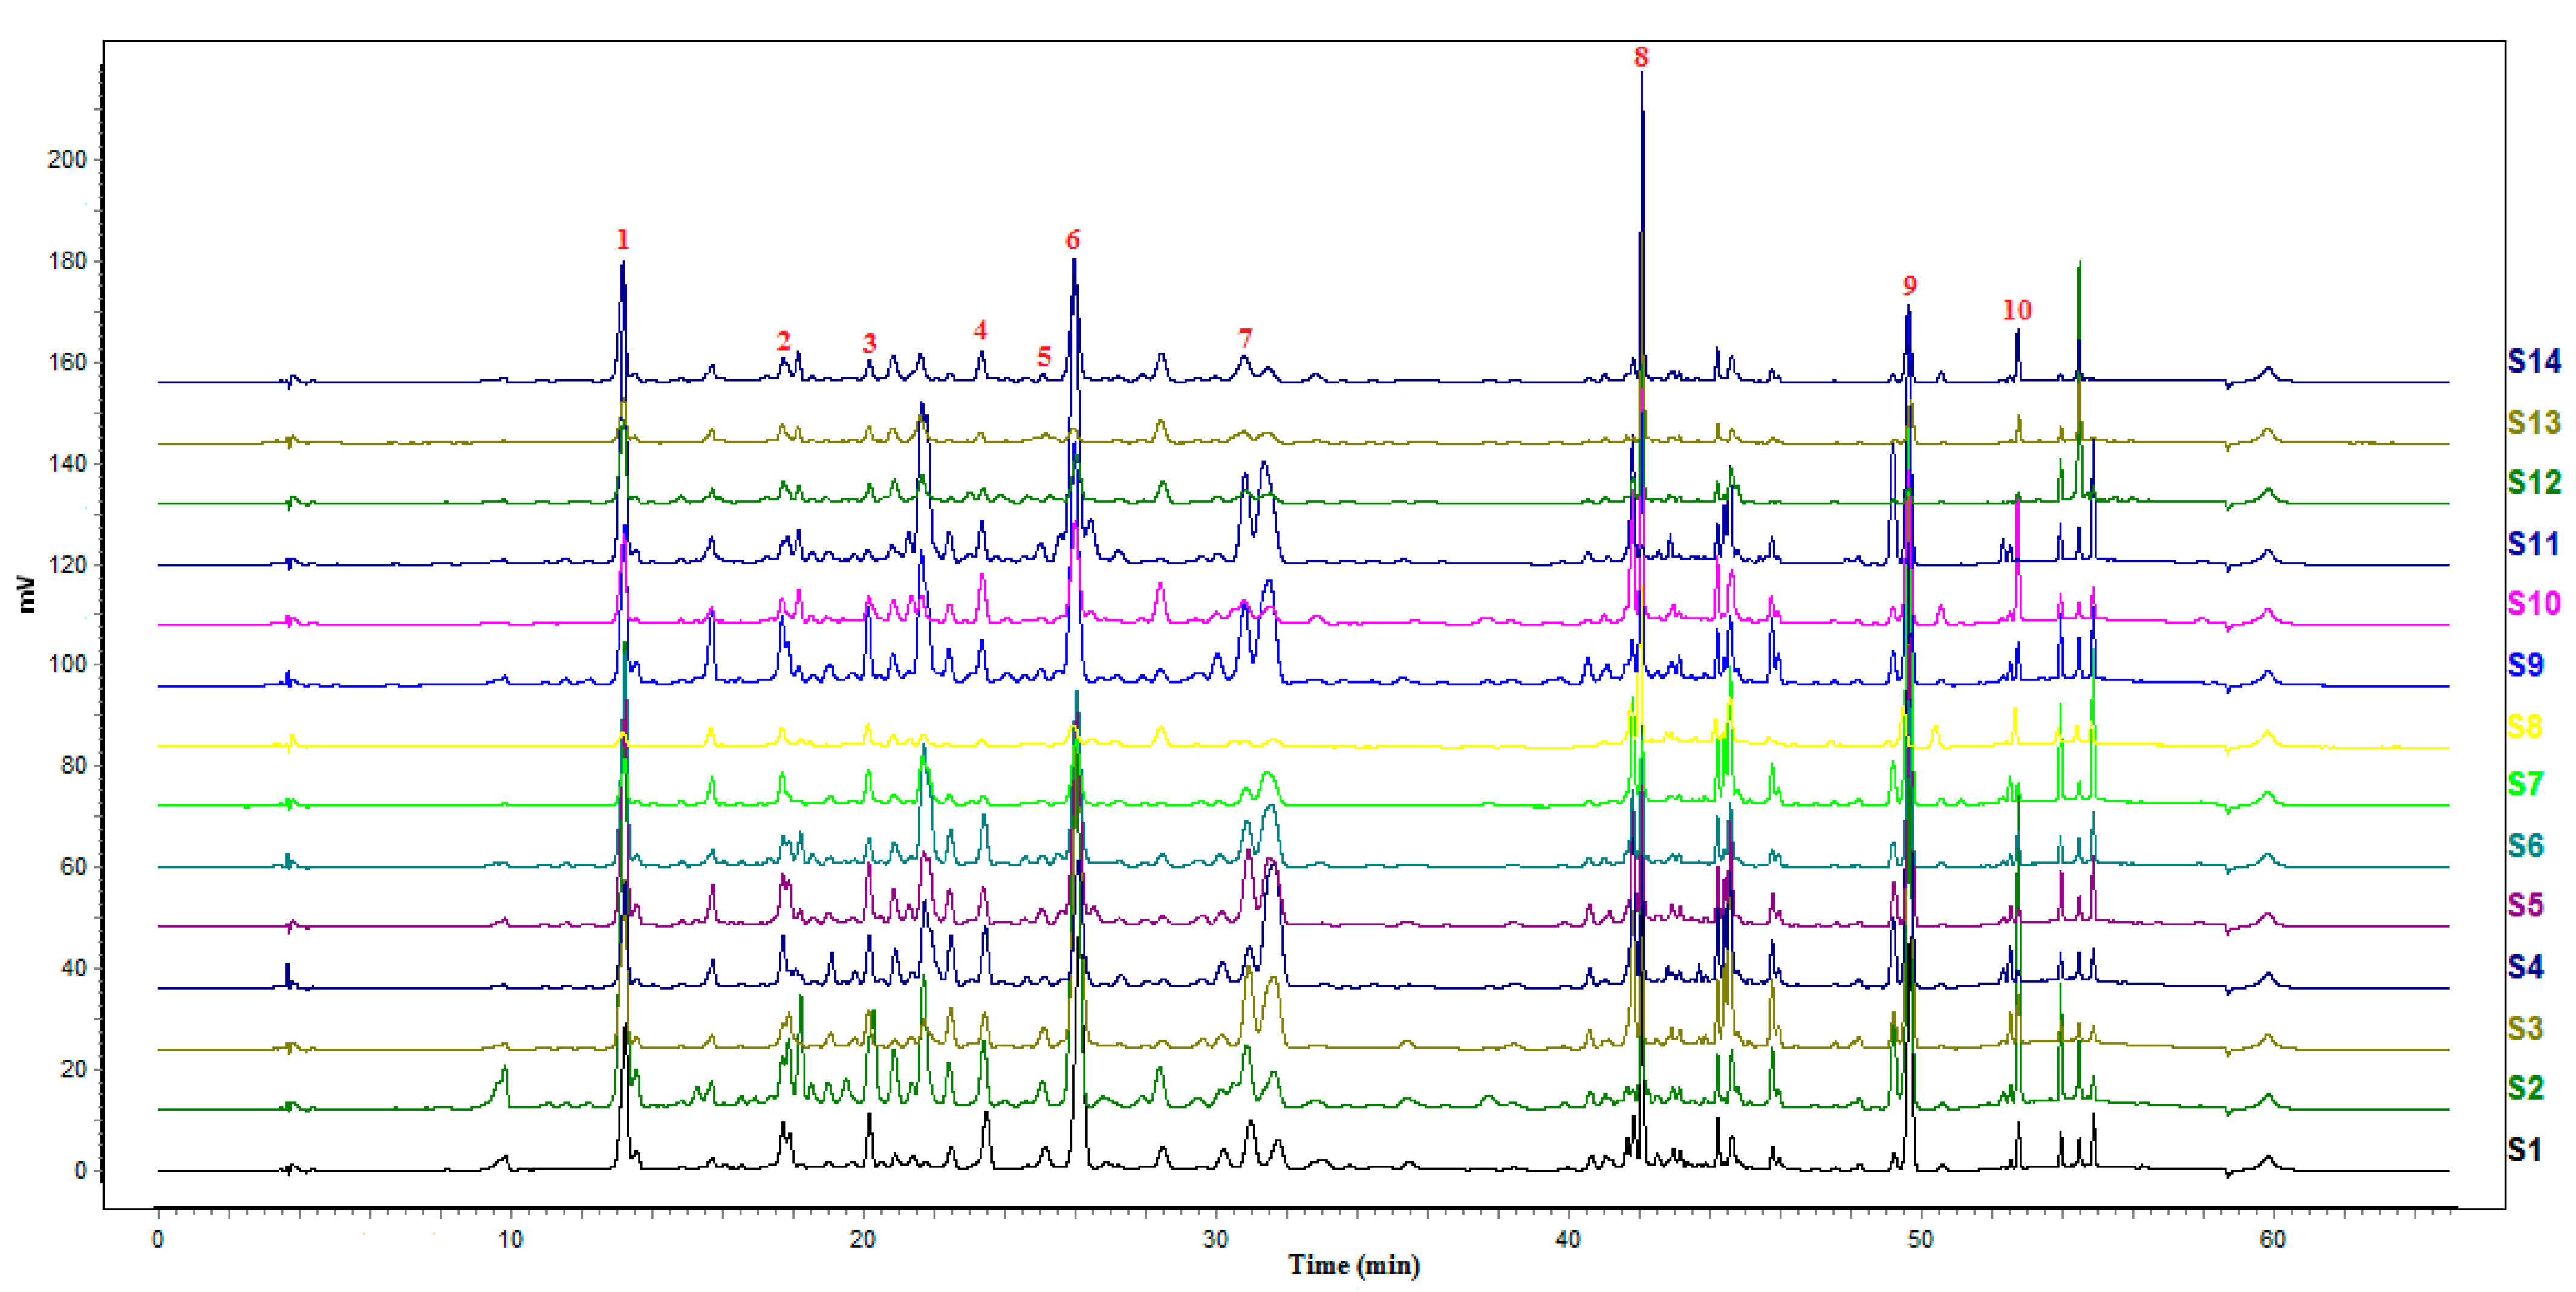
A. rupestris, high-performance liquid chromatograms of each sample were imported into the software recommended by SFDA, which was called chromatographic fingerprint similarity evaluation system for traditional Chinese medicine (version 2012a). Then, the chromatographic fingerprints were collected. Among the 14 samples, S1 was selected as the reference spectrum, while 18 common fingerprint peaks were recorded in the chromatograms (
Figure 2). Meanwhile, the similarity of the 14 batches of
A. rupestris samples was analyzed and obtained (
Table 3). S11 gave the lowest similarity among the samples, and the simiarity of S1, S2, S3, S5, S6, S10, S14 were all above 0.8. According to the software requirements, similarity greater than 0.9 is generally required. In the similarity analysis, only 3 batches of samples were greater than 0.9, which were S1, S2 and S5, suggesting that the quality of medicinal materials from different producing areas and growth conditions is quite different.
2.4. Quantitative Analysis by QAMS and ESM
Ten components were identified in the fingerprint with reference materials, including chlorogenic acid, apigenin-C-6,8-pentoside-hexoside, apigenin-C-6,8-di-pentoside, luteolin, 3,4-dicaffeoylquinic acid, 3,5-dicaffeoylquinic acid, 4,5-dicaffeoylquinic acid, linarin, chrysosplenetin B, and sbsinthin. ESM and QAMS were used to quantify the ten components in the sample to verify consistency between QAMS and ESM. In ESM, the mixed standard solution and sample solutions were analyzed by liquid chromatography, and the content of each component calculated according to the regression equations listed in
Table 1.
Choosing a suitable standard for internal reference using the QAMS method for analyzing multiple components in traditional Chinese medicinal substances is important. The component selected as internal reference should be selected on grounds of ease of acquisition, low price, and stable properties, and should be separable from the other compounds under chromatographic conditions [
25]. In the present study, chlorogenic acid and linarin were used as internal references for phenolic acids and flavonoids. respectively.
QAMS calculates the RCF between the component which was selected as internal reference and other components in medicinal materials. Furthermore, by calculating the amounts of other components through RCF, the simultaneous determination of multiple components [
24,
26] can be accomplished. The deviations (RE) between QAMS and ESM were calculated using the following formula (Equation (1)).
where A
s is the peak area of the internal reference substance, C
s is the concentration of the internal reference substance, A
i is the peak area of the component to be tested, and C
i is the concentration of the component to be tested.
To analyze the 10 components simultaneously in
A. rupestris by QAMS, the RCFs were calculated based on the ratio of peak area and corresponding concentration between internal references and the other analytes. The RCFs are shown in
Table 4 and
Table 5.
Overall, 14 batches of
A. rupestris samples from various production areas were analyzed using the validated ESM and QAMS methods. The deviations (RE) between QAMS and ESM were calculated using the following formula (Equation (1)).
The quantitative results of the 10 compounds in
A. rupestris calculated by ESM and QAMS methods are shown in
Table 6 and
Table 7. The REs were less than 5%, which is the requirement of Chinese Pharmacopoeia. It was indicated that there was no significant difference in the content results obtained by QAMS and ESM
Analysis of the 14 batches of A. rupestris samples revealed the contents of chlorogenic acid, apigenin-C-6,8-pentoside-hexoside, apigenin-C-6,8-di-pentoside, luteolin, 3,4-dicaffeoylquinic acid, 3,5-dicaffeoylquinic acid, 4,5-dicaffeoylquinic acid, linarin, chrysosplenetin B, and sbsinthin. The determination acquired by QAMS was consistent with that of ESM. Therefore, it was proven that the QAMS method for simultaneous quantitative analysis of the 10 components in A. rupestris was reliable and feasible.
Fingerprints analysis and quantitative data showed significant differences among various samples from different sources. According to the results in
Table 6 and
Table 7, it can be seen that the content of ten components fluctuates greatly between batches. It may be related to the production environment, planting methods, growth time and harvest season. Among phenolic acids, the contents of chlorogenic acid and 3,5-dicaffeoylquinic acid were relatively high, and there was positive correlation. Among the flavonoids, the contents of linarin and chrysosplenetin B were relatively high. Next, we studied the relationship between the content of each component and the related efficacy.


 and
and 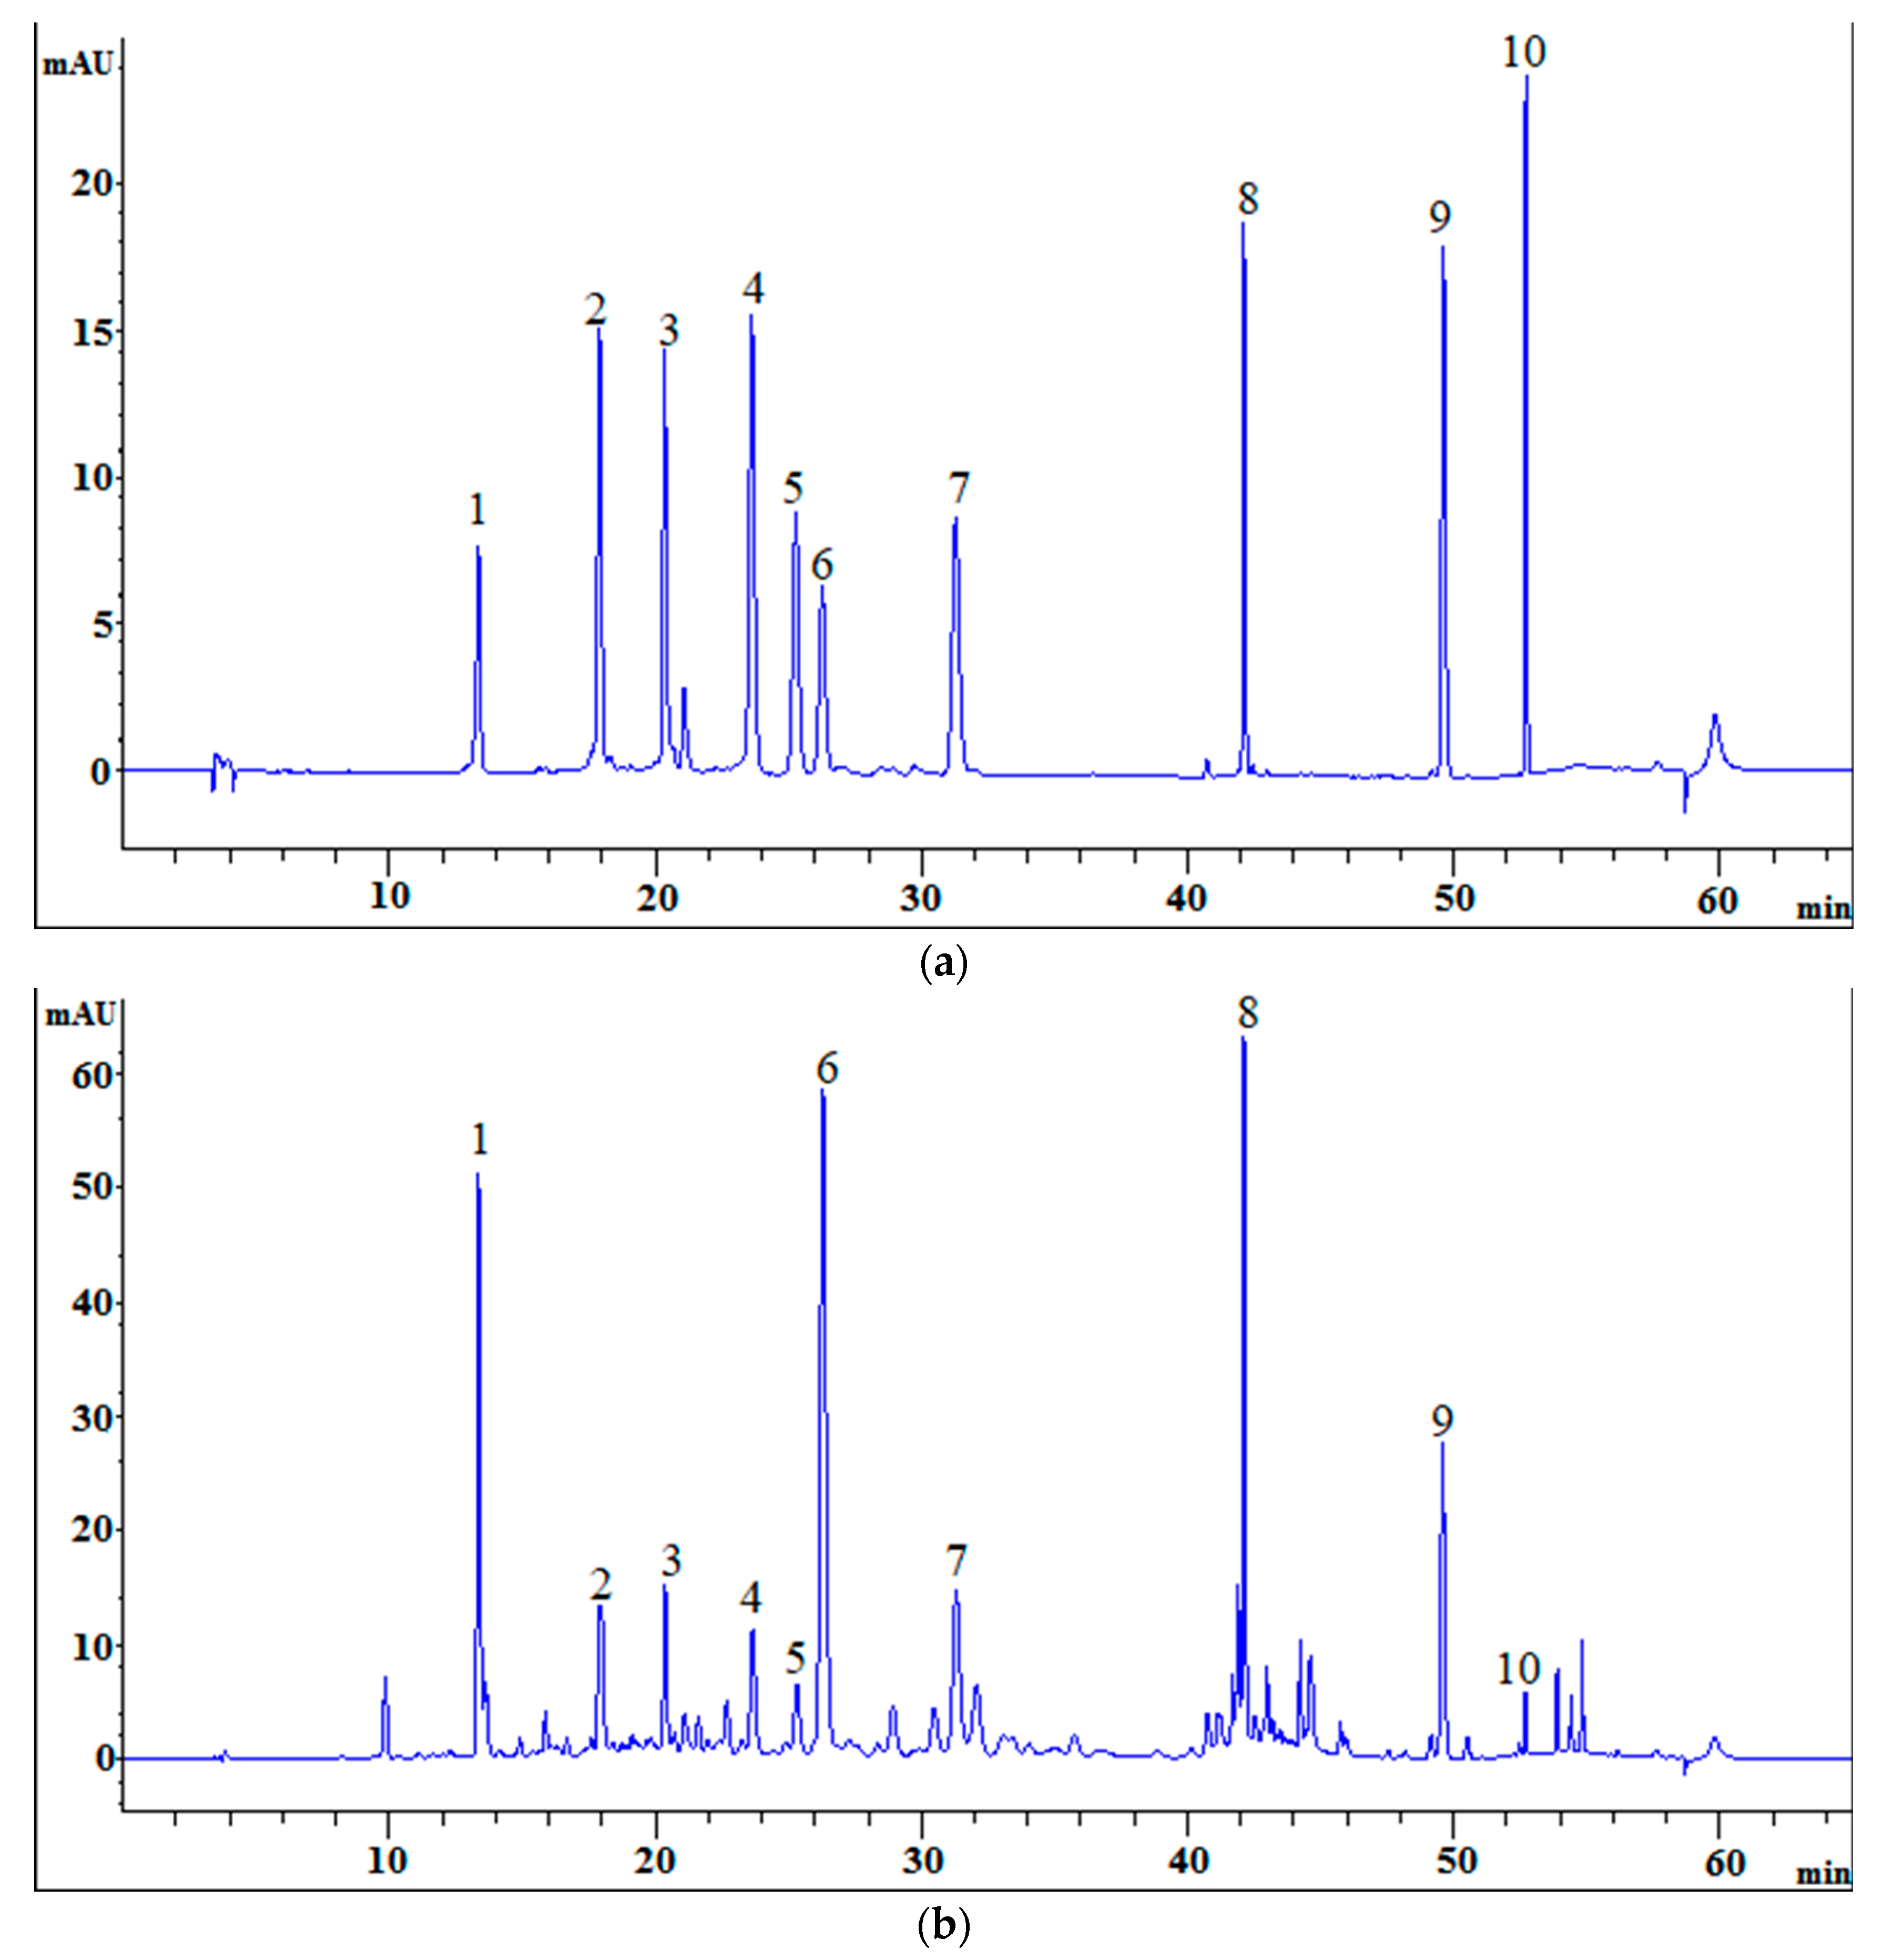
