Article

Relationship between Neuroprotective Effects and Structure of Procyanidins

Department of Food Science and Nutrition, Zhejiang University, Hangzhou 310000, China
*
Author to whom correspondence should be addressed.
Molecules 2022, 27(7), 2308; https://doi.org/10.3390/molecules27072308
Submission received: 16 March 2022 / Revised: 28 March 2022 / Accepted: 31 March 2022 / Published: 2 April 2022

Abstract

:
This study evaluated the relationship between the neuroprotective effects of procyanidins and their structural characteristics. In vitro, a rat pheochromocytoma cell line (PC12) was exposed to the grape seed-derived procyanidin monomers: catechin (C), epicatechin (EC), and epicatechin gallate (ECG); the procyanidin dimers: procyanidin B1 (B1), procyanidin B2 (B2), procyanidin B3 (B3), procyanidin B4 (B4), procyanidin B1-3-O-gallate (B1-G), and procyanidin B2-3-O-gallate (B2-G); and the procyanidin trimers: procyanidin C1 (C1) and N-acetyl-l-cysteine (NAC) for 24 h. Cells were then incubated with 200 μM H2O2 for 24 h. In vivo, zebrafish larvae (AB strain) 3 days post-fertilization were incubated with NAC or procyanidins (C, EC, ECG, B1, B2, B3, B4, B1-G, B2-G, C1) in 300 µM H2O2 for 4 days. Different grape seed procyanidins increased the survival of PC12 cells challenged with H2O2, improved the movement behavior disorder of zebrafish caused by H2O2, inhibited the increase of ROS and MDA and the decrease of GSH-Px, CAT, and SOD activities, and up-regulated the Nrf2/ARE pathway. The neuroprotective effects of the procyanidin trimer C1 treatment group were greater than the other treatment groups. These results suggest that the neuroprotective effect of procyanidins is positively correlated with their degree of polymerization.

1. Introduction

Neurodegenerative disease refers to disorders caused by chronic, progressive degeneration or deletion of neurons in the human brain [1], mainly characterized by protein accumulation and synaptic loss or dysfunction of neurons in the central nervous system [2]. Because neurons in the central nervous system do not regenerate, damage to these cells cannot be reversed. Consequently, once neurodegenerative diseases occur, the effects are permanent [3]. Therefore, the identification of effective methods for the prevention of neurodegenerative diseases is essential. Although the underlying mechanisms of neurodegenerative disease are not fully understood, there is evidence that oxidative damage caused by excessive production of reactive oxygen species (ROS), free radicals, and damage to the antioxidant defense system play a key role. Therefore, antioxidant supplementation may prevent or alleviate the onset of neurodegenerative disease [4,5,6]. Natural bioactive compounds are generally safe and cause minimal to no side effects. Therefore, identification of antioxidant compounds from natural resources that may aid in the prevention of neurodegenerative diseases is an important research focus.
Procyanidins are natural antioxidants with an antioxidant capacity stronger than that of vitamins C and E [7,8,9]. Previous research from our team has shown that procyanidins exhibit neuroprotective effects [10]. Interestingly, individual procyanidins have distinct effects, which may be due to differences in their structure such as the number of hydroxyl groups, the positioning of the hydroxyl groups, the degree of polymerization, and the type of flavane-3-alcohol unit bond [11]. The bioavailability of procyanidins is also affected by their degree of polymerization [12]. Currently, the effects of procyanidin structure on their neuroprotective effects remains clear.
Grape seed is one of the most abundant sources of procyanidins in nature, and most procyanidin products are derived from grape seed [13,14]. Grape seed procyanidins mainly include type B procyanidins connected by C4–C8 or C4–C6 bonds. Therefore, it is important to study the structure-activity relationship of procyanidins from grape seed. The higher the number of structural units and isomers, the more difficult it is to identify and separate procyanidins for analysis. In addition, due to a lack of effective analysis methods, it is also difficult to isolate pure procyanidin polymers that have a high degree of polymerization [15,16]. In the current study, monomer, dimer, and trimer procyanidins from grape seeds that could be isolated and purified were selected for study of the relationship between the neuroprotective effects of procyanidins and their structural characteristics.
The morphology, structure, and function of the rat pheochromocytoma cell line (PC12) are similar to that of human neuronal cells. Therefore, this is a widely used neuronal cell model [17,18,19,20,21]. Approximately 87% of zebrafish genes are homologous with human disease genes, and the neurobehavioral phenotypes (learning, sleep, and drug addiction) of zebrafish are comparable to human beings [22,23,24,25]. The neurotransmitter system of zebrafish (cholinergic, dopaminergic, and noradrenergic pathways) has been fully documented, and the suitability of this model for the study of nervous system diseases has been confirmed [26,27]. In addition, compared with mice, experiments with zebrafish require a shorter amount of time, which minimizes time and cost [28]. In this study, PC12 cells and the zebrafish model were used to study the relationship between the neuroprotective effects of procyanidins and their structural characteristics.

2. Materials and Methods

2.1. Chemical Compounds and Reagents

Cell Counting Kit-8 was obtained from Beyotime (Shanghai, China). Catechin (C), epicatechin (EC), epicatechin gallate (ECG), procyanidin B1 (B1), procyanidin B2 (B2), procyanidin B3 (B3), procyanidin B4 (B4), procyanidin B1-3-O-gallate (B1-G), procyanidin B2-3-O-gallate (B2-G), and procyanidin C1 (C1) were obtained from Caoyuankang Biotechnology. 2′,7′-Dichlorofluorescin diacetate, malondialdehyde (MDA), glutathione peroxidase (GSH-Px), superoxide dismutase (SOD), and catalase (CAT) diagnostic kits were obtained from Solarbio (Beijing, China). Nuclear factor-erythroid 2-related factor 2-siRNA (Nrf2-siRNA), control-siRNA, and Lipofectamine 2000 were obtained from GenePharma (Shanghai, China). The primary antibodies, Nrf2, heme oxygenase 1 (HO-1), NAD(P)H: quinone oxidoreductase 1 (NQO1), Lamin B, and GAPDH, as well as corresponding secondary antibodies, were obtained from Proteintech (Wuhan, China). RNAiso Plus, PrimeScript RT reagent Kit with gDNA Eraser, and SYBR Premix Ex Taq II were purchased from Takara (Takara, Shiga, Japan).

2.2. Cell Culture

PC12 cells were obtained from the National Collection of Authenticated Cell Cultures. Cells were maintained in DMEM supplemented with 10% fetal bovine serum and penicillin-streptomycin (100 U/mL; 100 μg/mL) in a humidified atmosphere incubator at 37 °C with 5% CO2.

2.3. Cell Viability Assay

PC12 cells were incubated with C, EC, ECG, B1, B2, B3, B4, B1-G, B2-G, C1 or N-acetyl-l-cysteine (NAC) (20 μM) for 24 h and then incubated with 1 H2O2 (200 μM) for 24 h. Cell Counting Kit-8 solution (10 μL) was added to each well and incubated for 1 h. The absorbance was measured at 450 nm.

2.4. Fish Maintenance

Zebrafish (wild-type AB strain) were maintained in a breeding environment at 28.0 °C, with a light cycle (light/dark) of 10 h/14 h. Fish were fed once every morning and evening. The day before egg retrieval, zebrafish were put into the mating box at a female to male ratio of 1:1. The next morning, the partition plate was removed. After the fish laid eggs, the eggs were collected and put into the incubator (28.5 °C). The ethics certificate approval No. for this study was zju20200125.

2.5. Zebrafish Experimental Group

The young fish (three days post-fertilization, normal development) were randomly divided into 6 groups: Control, blank control group; Model, H2O2 (300 μM); Positive control, NAC (30 μM) + H2O2 (300 μM); C, C (25 μM) + H2O2 (300 μM); EC, EC (25 μM) + H2O2 (300 μM); ECG, ECG (25 μM) + H2O2 (300 μM); B1, B1 (25 μM) + H2O2 (300 μM); B2, B2 (25 μM) + H2O2 (300 μM); B3, B3 (25 μM) + H2O2 (300 μM); B4, B4 (25 μM) + H2O2 (300 μM); B1-G, B1-G (25 μM) + H2O2 (300 μM); B2-G, B2-G (25 μM) + H2O2 (300 μM); C1, C1 (25 μM) + H2O2 (300 μM) and treated for 4 days.

2.6. ROS Measurement

PC12 cells or zebrafish were exposed to 10 μM 2′,7′-Dichlorofluorescin diacetate solution in dark conditions for 30 min; the dye solution was then removed, and cells or zebrafish were washed with phosphate-buffered saline three times. Images were obtained using an Olympus laser scanning confocal microscope.

2.7. Assessment of MDA, GSH-Px, SOD, and CAT

The activities of MDA, GSH-Px, SOD, and CAT in PC12 cells or zebrafish were measured using the assay kits following the manufacturers’ protocols.

2.8. Nrf2 siRNA Transfection

PC12 cells were inoculated into 6-well plates (2 × 10⁵/well). After the cells adhered to the plate, they were washed with serum-free and antibody free Opti MEM cell culture medium three times, and Opti MEM culture medium was added to each well. siRNA was prepared to a final concentration of 80 nM, diluted with Lipofectamine 2000, mixed well, and left to stand for 10 min. The transfection complex was added to the cells and incubated for 6 h. The transfected cells were treated with C, EC, ECG, B1, B2, B3, B4, B1-G, B2-G, or C1 for 24 h and then with H2O2 (200 μM) for 24 h. Then, cell survival was detected.

2.9. Western Blotting

Protein samples were resolved by SDS-PAGE and transferred to polyvinylidene difuoride (PVDF) membranes. The blots were exposed to appropriate primary antibodies: Nrf2, HO-1, NQO1, Lamin B, GAPDH, and peroxidase-conjugated secondary antibodies. Protein bands were visualized using ECL plus Western blotting detection reagents.

2.10. Behavioral Observation of Zebrafish

A young fish was placed in each well of a 24 well plate and allowed to adapt for 1 h. Then, the movement of each fish was recorded within 10 min and its movement track and distance were analyzed.

2.11. Total RNA Extraction, Reverse Transcription, and Quantitative Real-Time Polymerase Chain Reaction

RNA was extracted using RNAiso following the manufacturer’s instructions. RNA was reverse transcribed using a PrimeScript RT Kit with gDNA eraser following the manufacturer’s instructions. Quantitative real-time PCR was performed with an Applied Biosystems Vii-7 Real-Time PCR system using SYBR Premix Ex Taq II. β-actin was used as a reference gene, and relative gene expression was calculated using the 2−∆∆Ct method. The primer sequences utilized are listed in Table 1.

2.12. Statistical Analysis

The experimental results were statistically analyzed using one-way analysis of variance (ANOVA) and Duncan’s multiple range test; results are presented as means ± standard deviation (SD). A p < 0.05 was considered statistically significant. SPSS (version 20.0) was used for statistical analysis.

3. Results

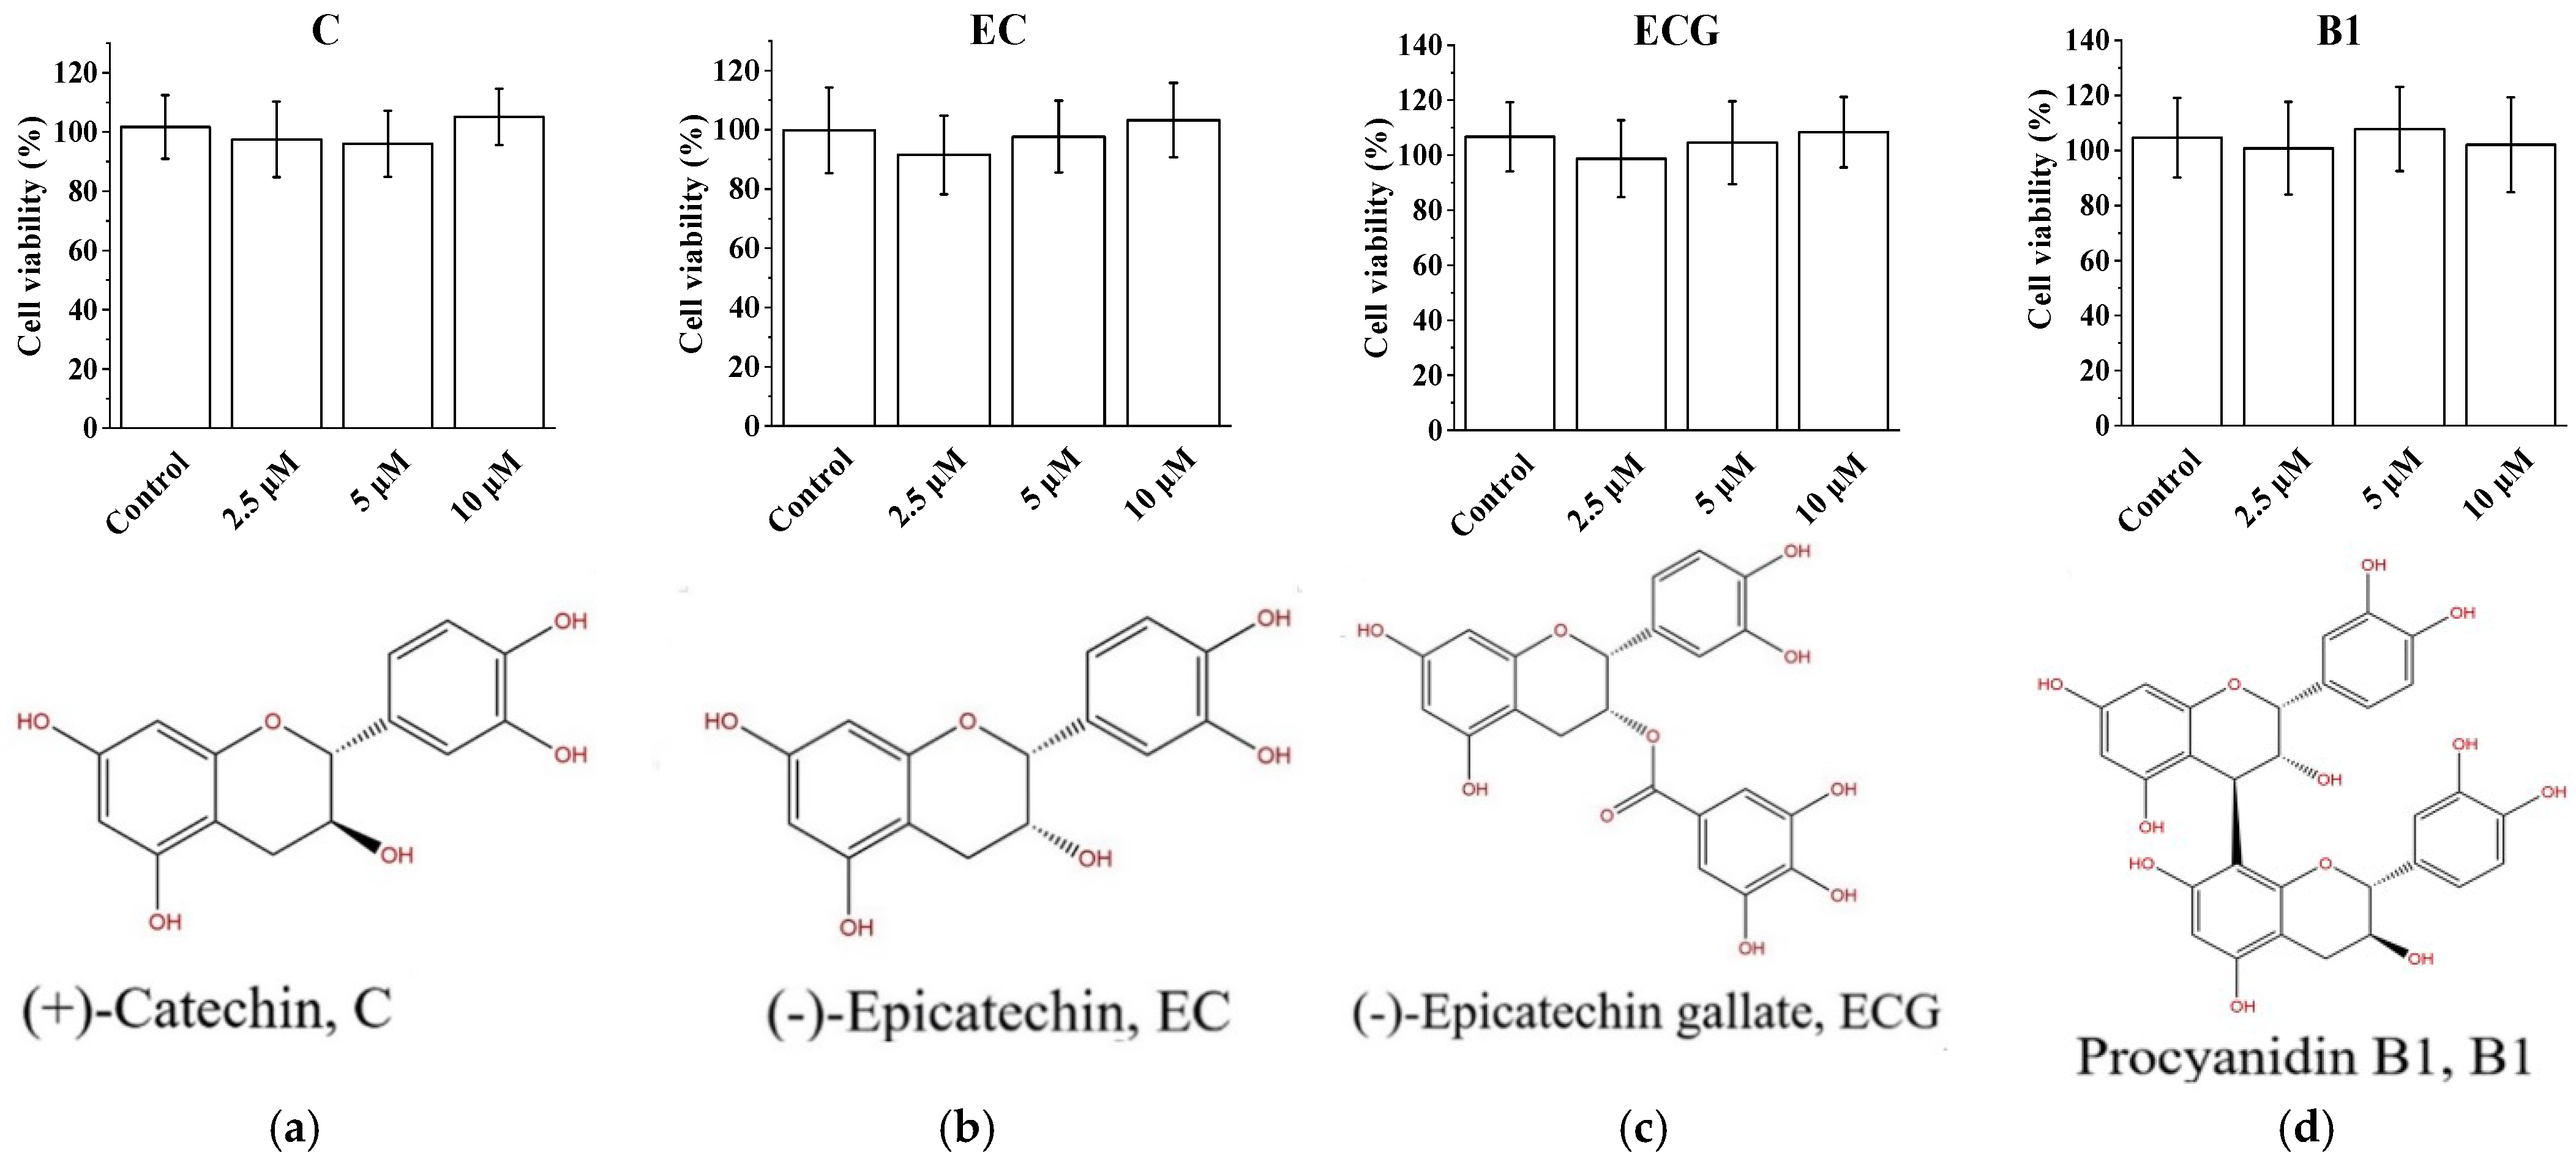
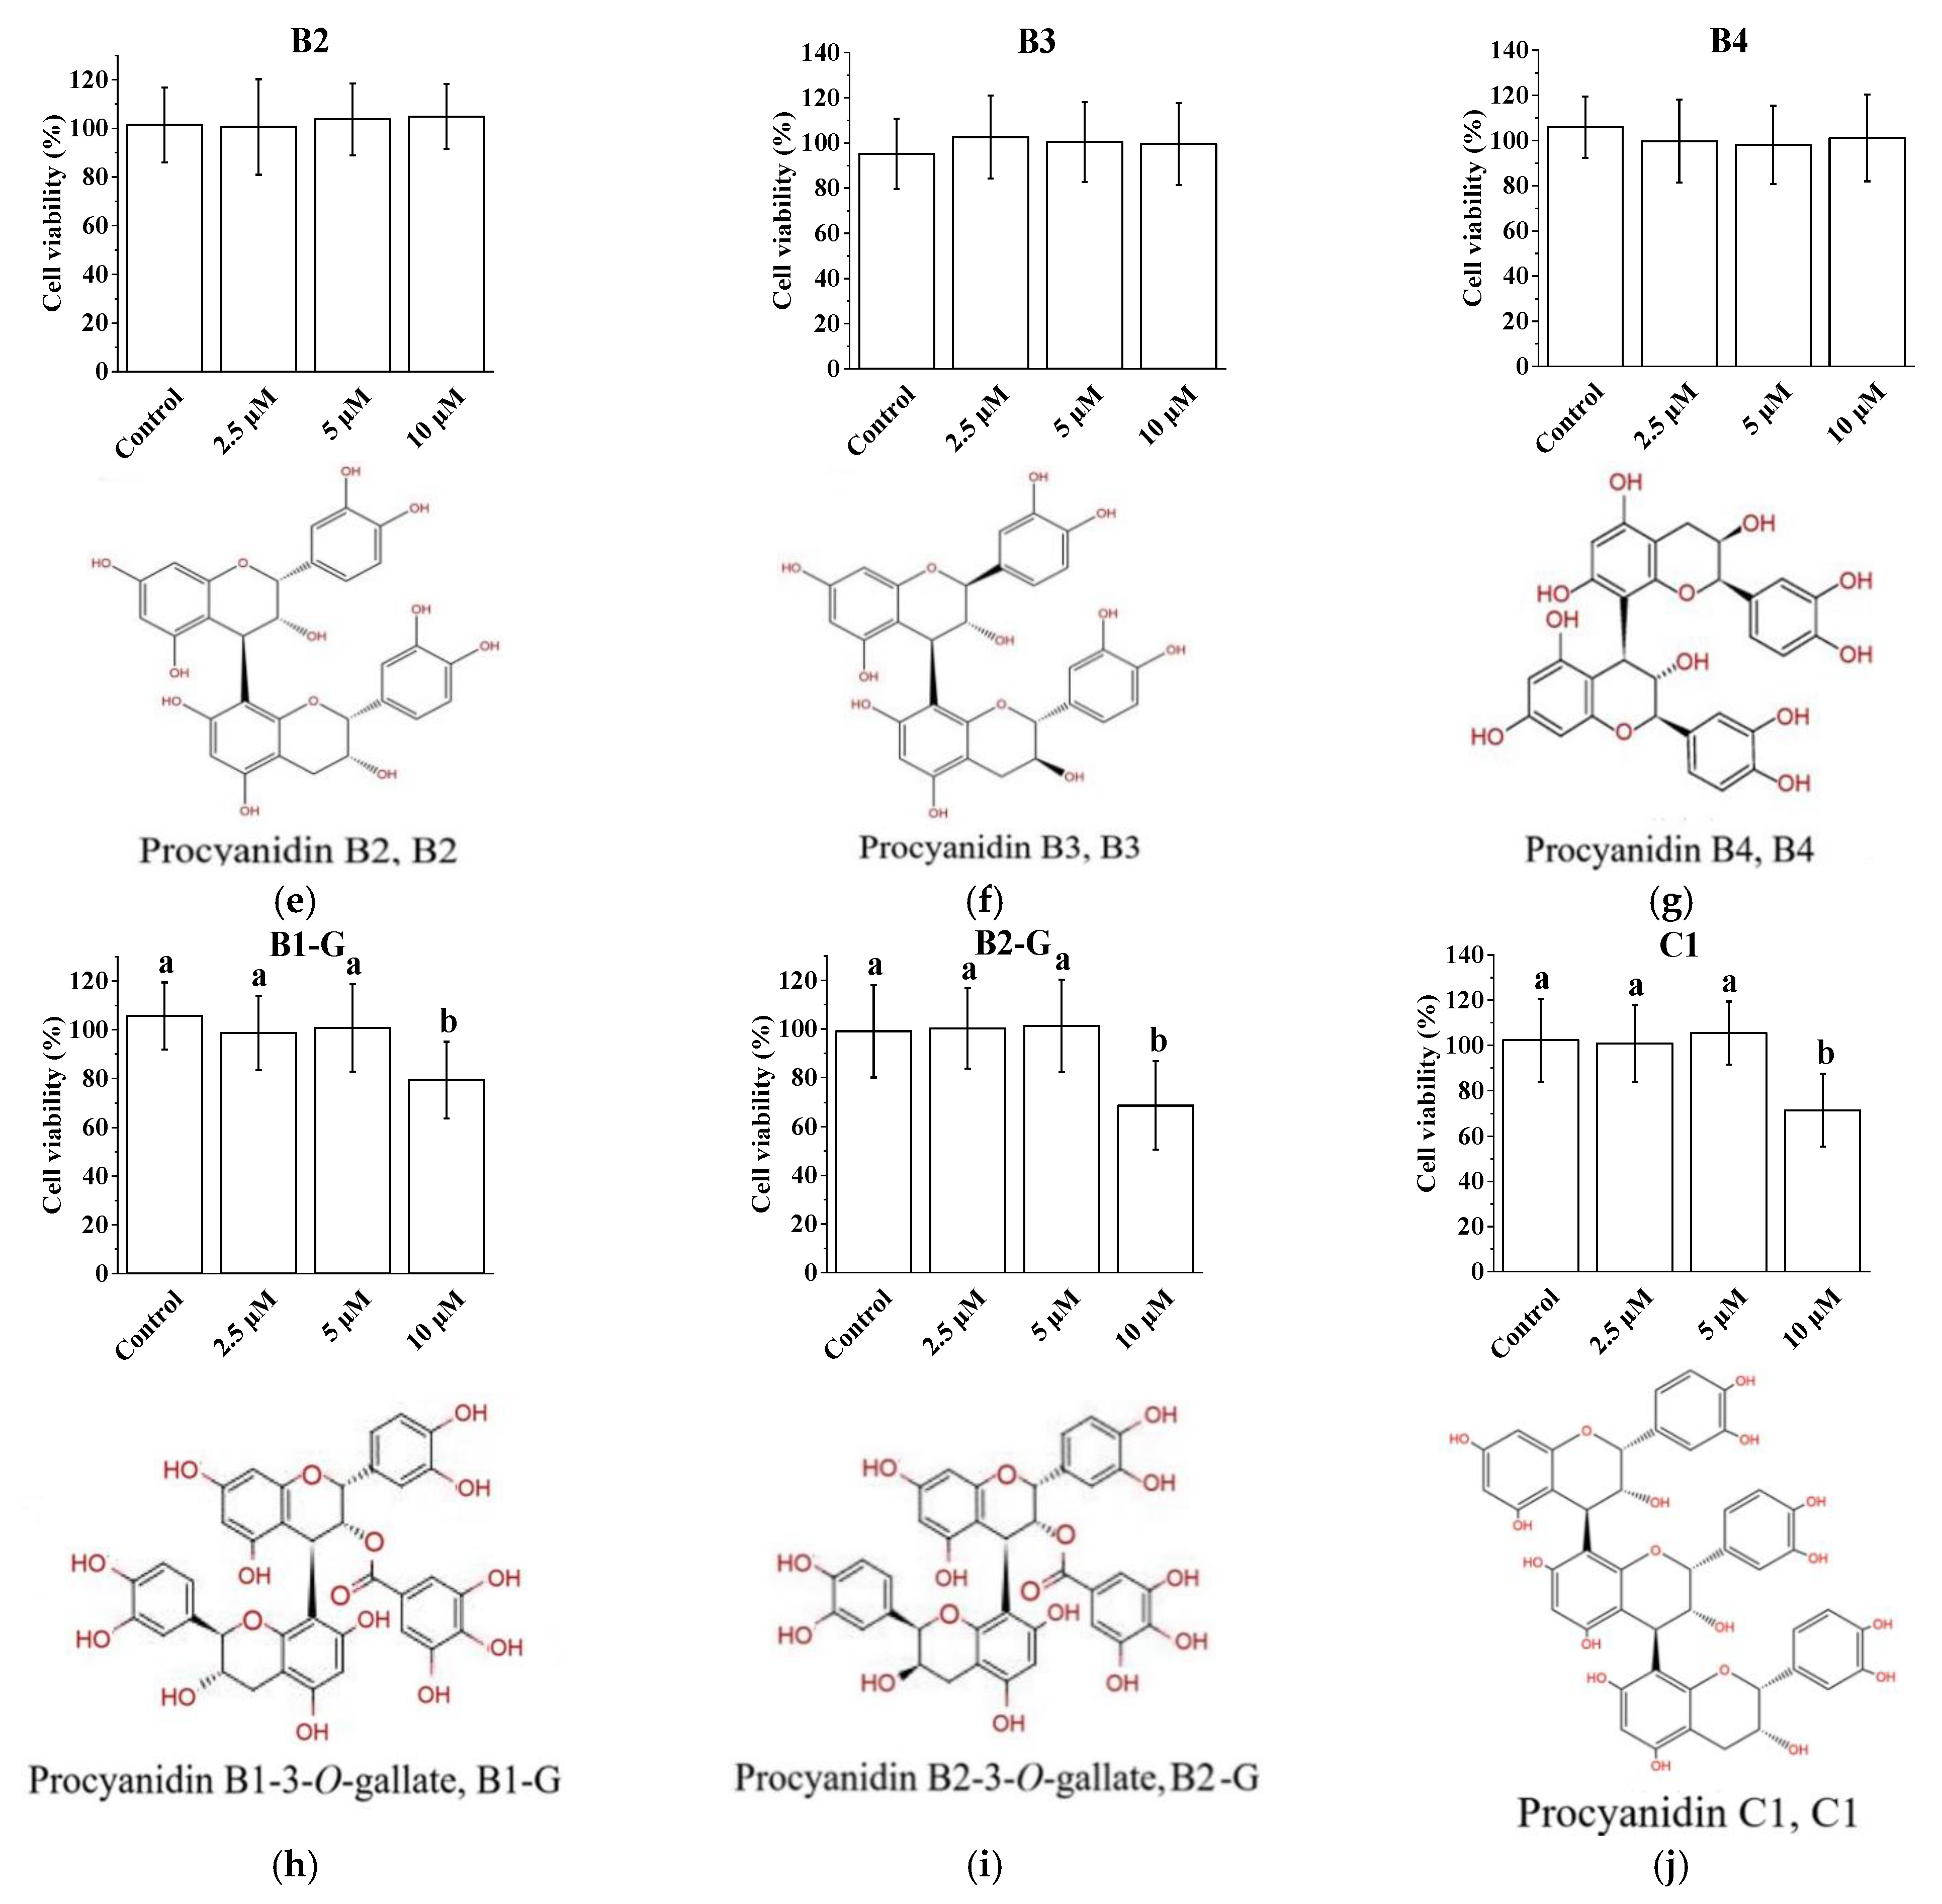
3.1. Cytotoxicity of Procyanidins with Different Structures in PC12 Cells

Ten procyanidins purified from grape seeds, including C, EC, and ECG; B1, B2, B3, B4, B1-G, and B2-G; and C1 (Figure 1), were selected for this study. Compared with the blank control group, procyanidins (C, EC, ECG, B1, B2, B3, B4, B1-G, B2-G and C1) at 2.5 μM and 5 μM had no significant effect on the survival of PC12 cells (Figure 1, p > 0.05). Procyanidins (C, EC, ECG, B1, B2, B3 and B4) at 10 μM also had no significant effect on the survival of PC12 cells (Figure 1, p > 0.05). However, the survival of PC12 cells treated with 10 μM B1-G, B2-G, and C1 was significantly lower than the blank control group (Figure 1, p < 0.05). Therefore, 2.5 μM and 5 μM of C, EC, ECG, B1, B2, B3, B4, B1-G, B2-G, and C1 were selected for further study.

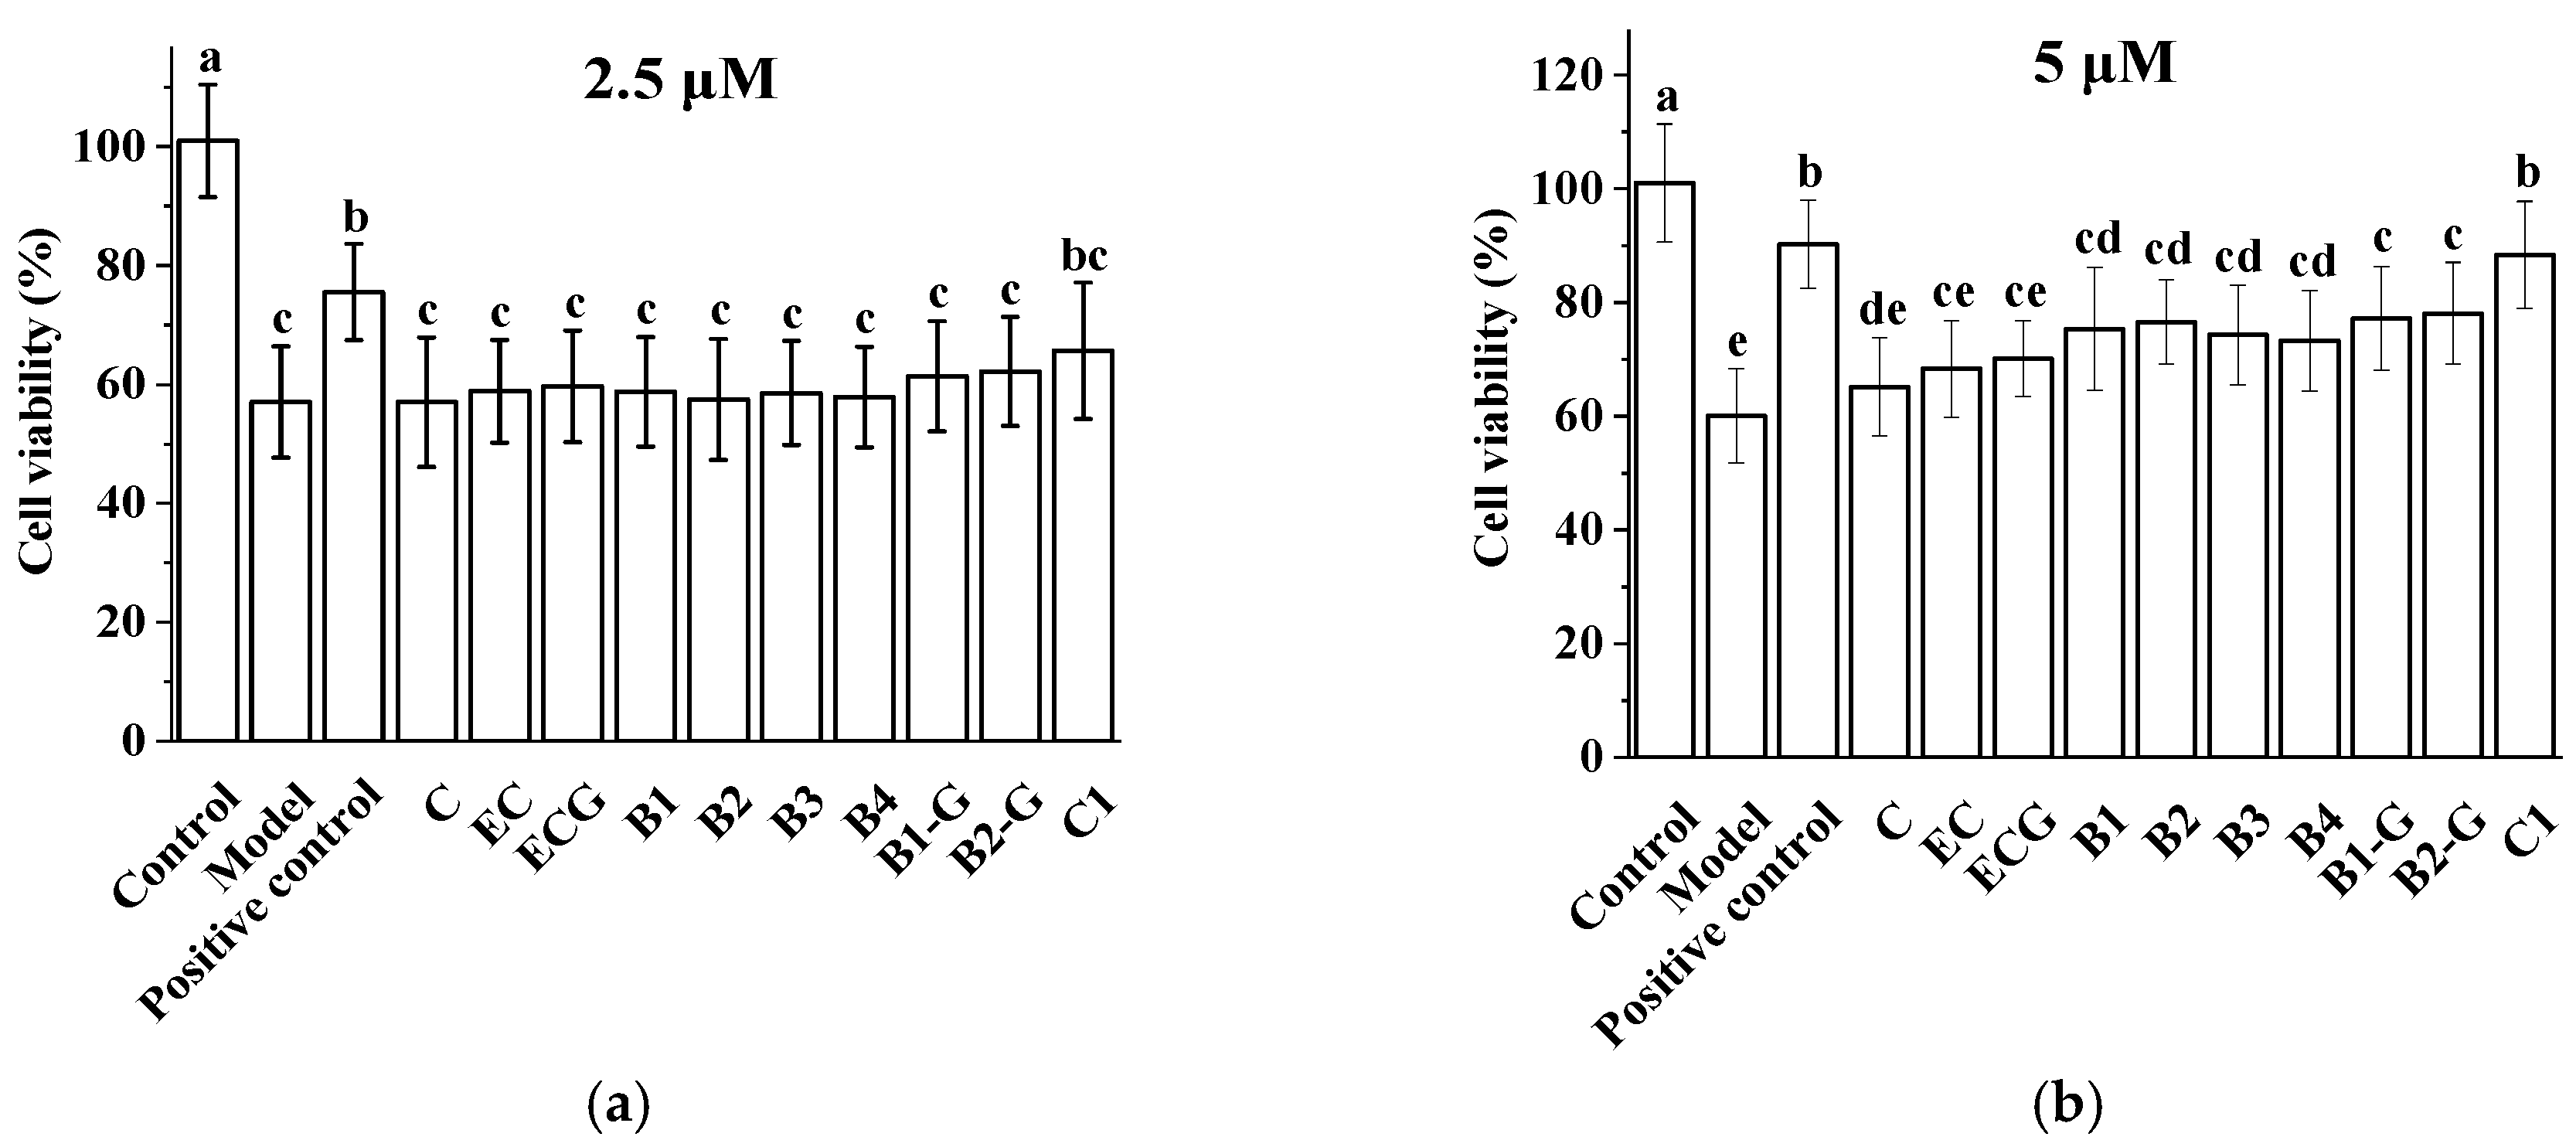
3.2. Effects of Procyanidins with Different Structures on H2O2-Induced Damage in PC12 Cells

The effects of grape seed procyanidins with different structures on the survival of PC12 cells induced by H2O2 were studied. Compared with the model group, 2.5 μM procyanidins (C, EC, ECG, B1, B2, B3, B4, B1-G, B2-G, and C1) had no significant protective effect on H2O2-induced PC12 cell injury (Figure 2a, p > 0.05), whereas 5 μM procyanidins (B1, B2, B3, B4, B1-G, B2-G, and C1) had significant protective effects on PC12 cell injury induced by H2O2 (Figure 2b, p < 0.05).

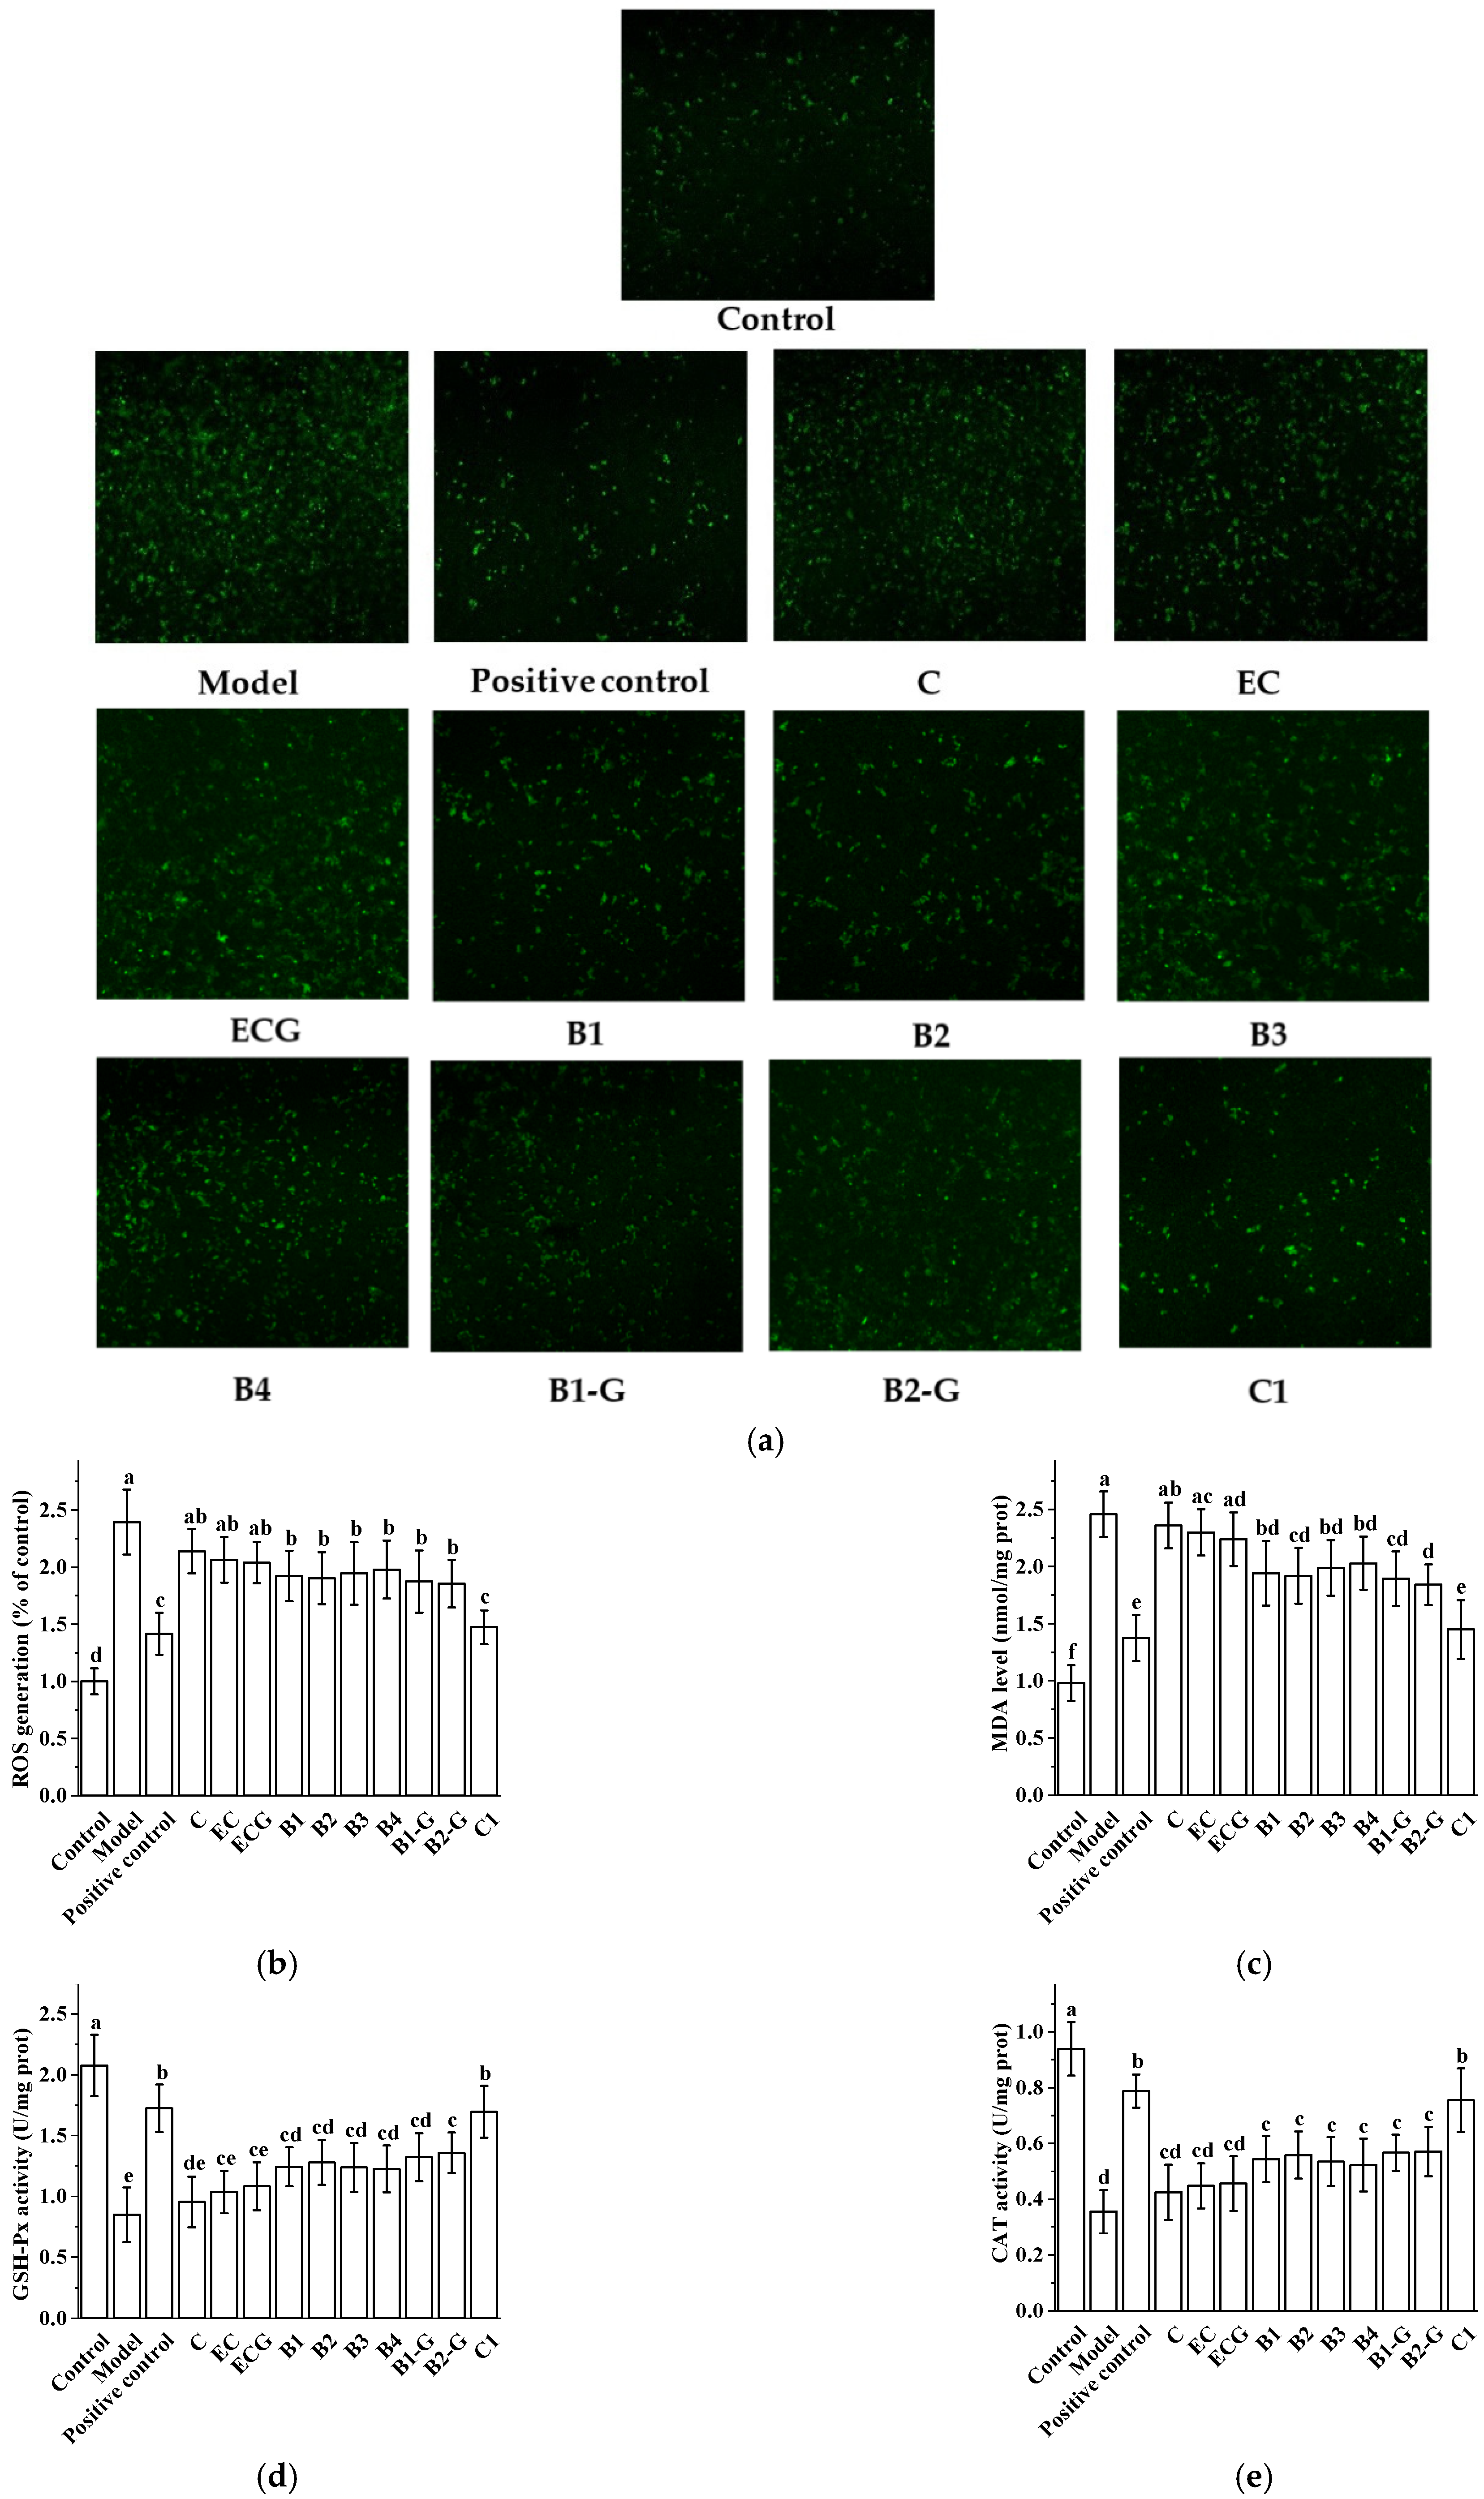
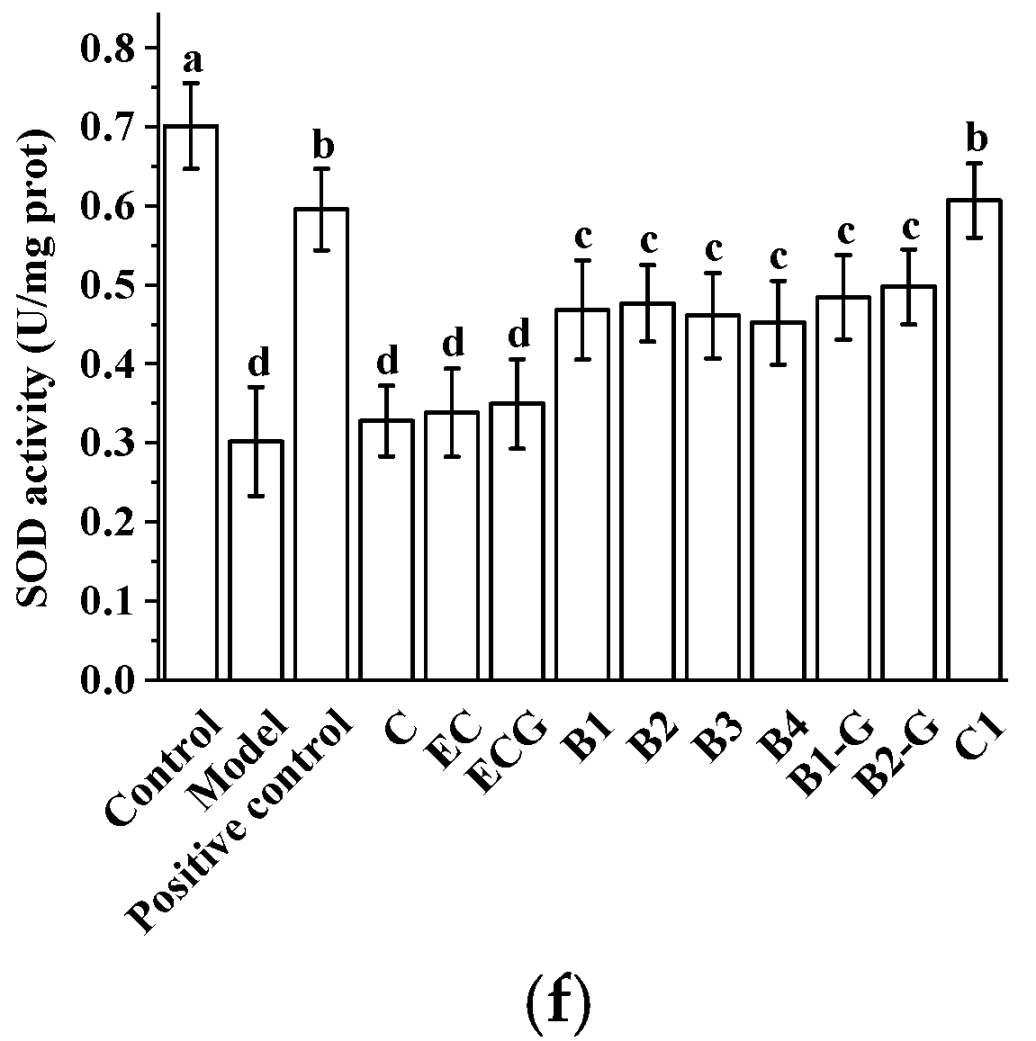
3.3. Effects of Procyanidins with Different Structures on Oxidative Stress in PC12 Cells Treated with H2O2

ROS and MDA content in cells is an index that directly reflects the level of oxidative stress [29,30,31]. GSH-Px, CAT, and SOD are important components of the antioxidant system, which can antagonize and block free radicals [32,33]. The higher the activity of GSH-Px, CAT, and SOD, the stronger the ability to scavenge oxygen free radicals [34]. Therefore, the antioxidant capacity of cells can be reflected by detecting the activities of GSH-Px, CAT, and SOD. Compared with the model group, treatment with different procyanidins inhibited H2O2-induced ROS and MDA levels and increased the activities of GSH-Px, CAT, and SOD in PC12 cells. The treatment effect of the procyanidin trimer C1 was greater than that of the procyanidin dimers (B1, B2, B3, B4, B1-G, and B2-G) (Figure 3, p < 0.05). The effect in the procyanidin monomers (C, EC, and ECG) treatment group was less than in the procyanidin dimers (B1, B2, B3, B4, B1-G, and B2-G) and procyanidin trimer C1 treatment groups (Figure 3).

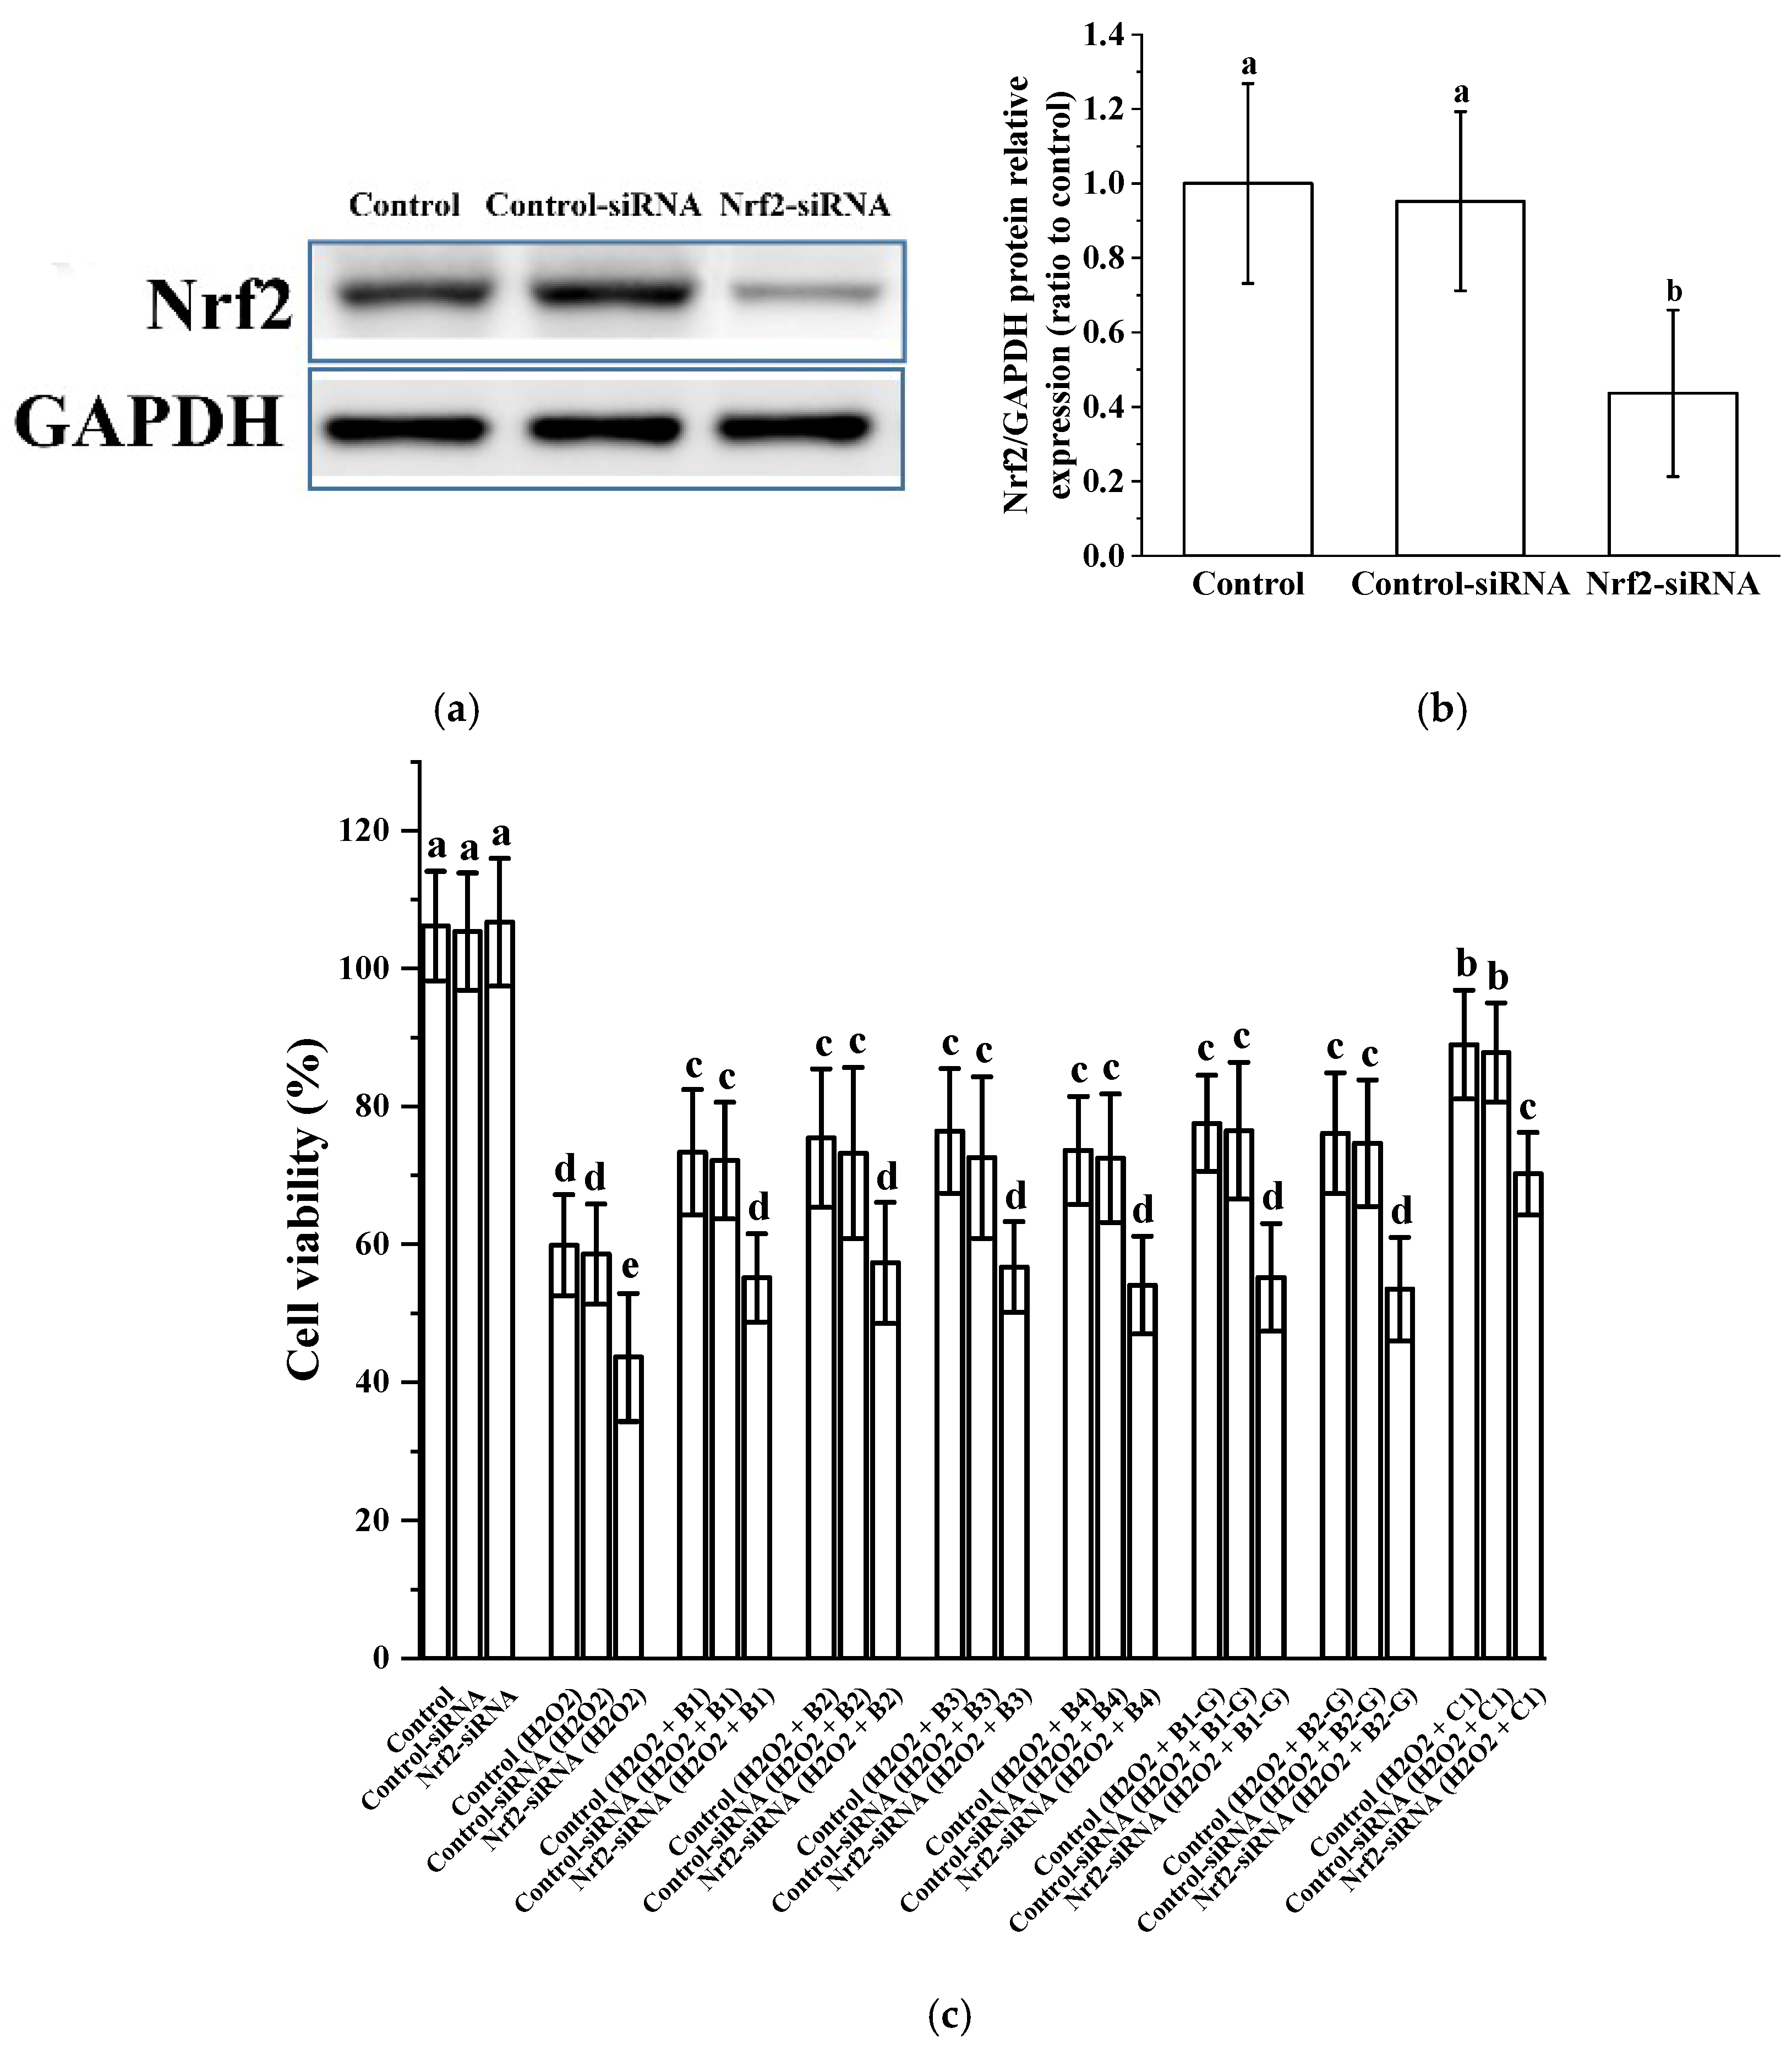
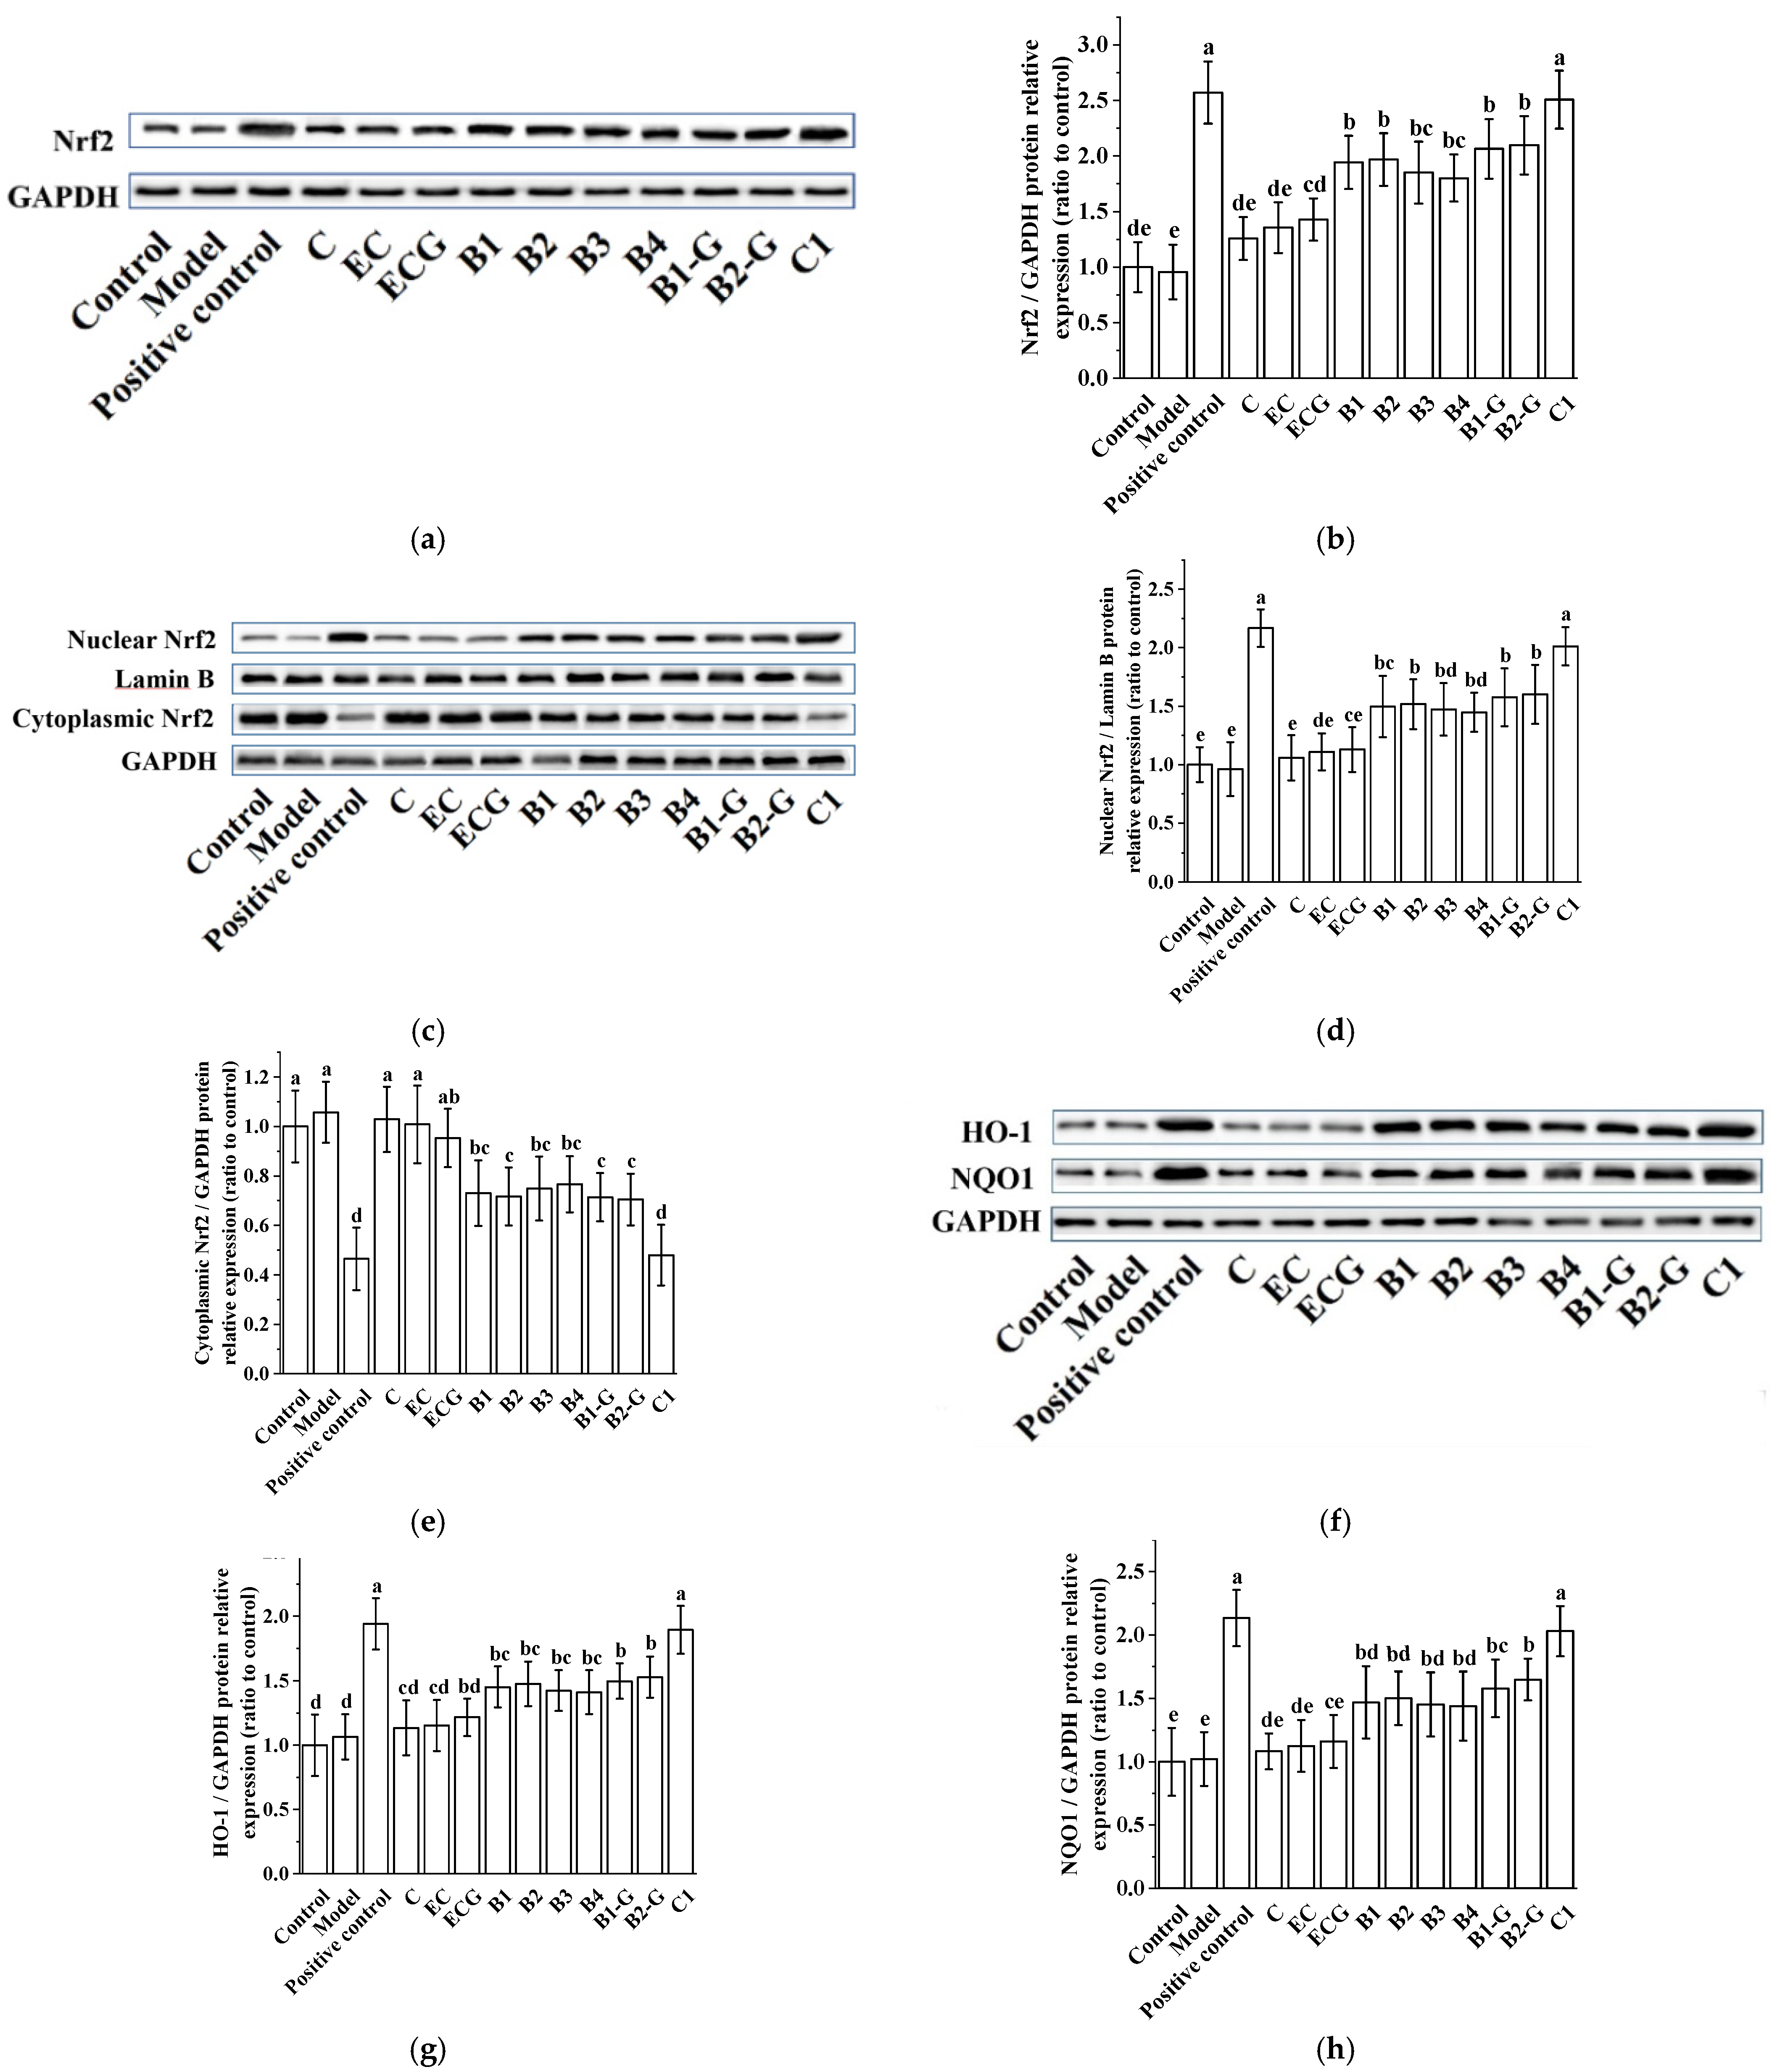
3.4. Effects of Procyanidins with Different Structures on the Nuclear Factor-Erythroid 2-Related Factor 2 (Nrf2)/Antioxidant Response Element (ARE) Pathway in PC12 Cells Treated with H2O2

The different structures of the procyanidin treatments may up-regulate the expression of the Nrf2 protein, leading to transfer from the cytoplasm to the nucleus and accumulation in the nucleus, thereby up-regulating the expression of NAD(P)H: quinone oxidoreductase 1 (NQO1) and heme oxygenase 1 (HO-1) in H2O2 injured PC12 cells. Our results showed significant differences between the procyanidin dimers (B1, B2, B3, B4, B1-G, and B2-G) and procyanidin trimer C1 treatment groups compared to the model group (Figure 4, p < 0.05).

3.5. Verification of the Effect of Nrf2 in the Protection of Cells Treated with Procyanidins

We further evaluated the role of Nrf2/ARE pathway activation in procyanidin-mediated neuroprotection. Results showed that the expression of Nrf2 in PC12 cells transfected with Nrf2 siRNA decreased significantly, blocking the protective effect of procyanidins in PC12 cells challenged with H2O2 (Figure 5). These results suggest that procyanidins (B1, B2, B3, B4, B1-G, B2-G, and C1) may protect neurons from oxidative stress by activating the Nrf2/ARE pathway.

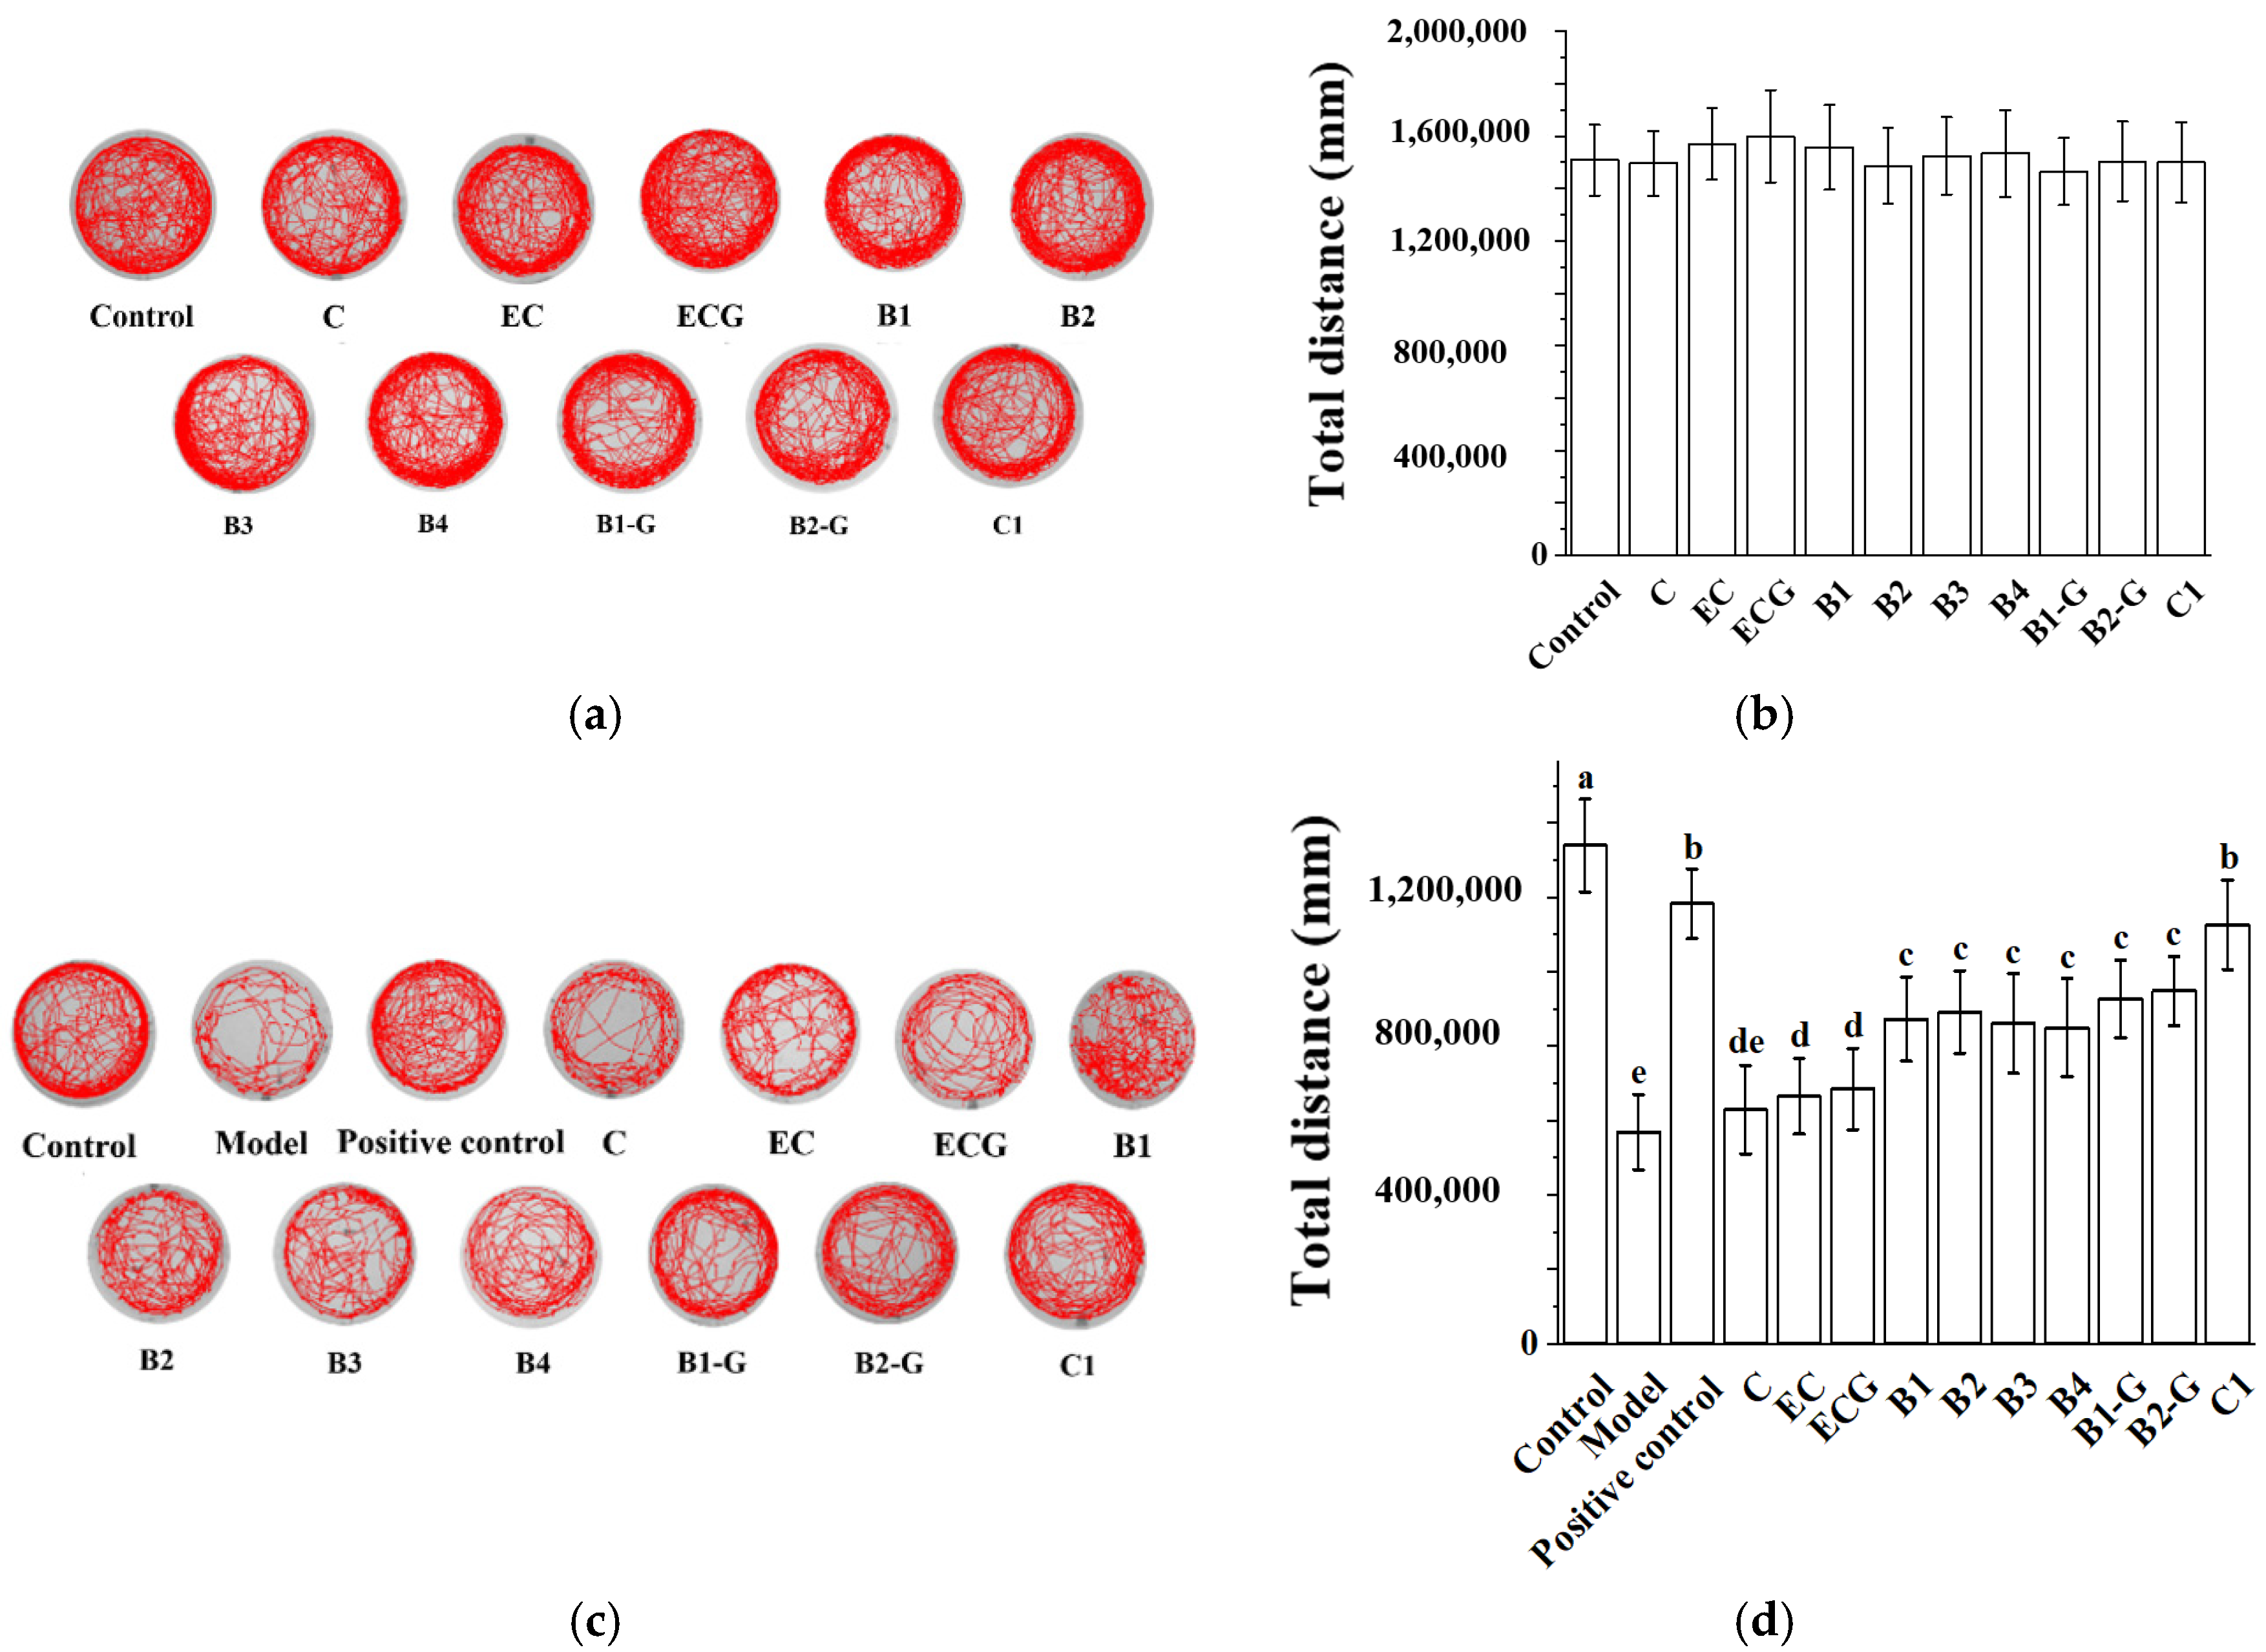
3.6. Effects of Procyanidins with Different Structures on Exercise Capacity in Zebrafish Treated with H2O2

Neurodegenerative diseases often exhibit symptoms of motor behavior disorders [35,36,37]. Therefore, this experiment studied the effects of different structures of procyanidins on exercise capacity of zebrafish treated with H2O2. Overall, 25 μM of procyanidins (C, EC, ECG, B1, B2, B3, B4, B1-G, B2-G, C1) did not decrease the exercise capacity of zebrafish (Figure 6a,b) and had a protective effect on zebrafish damaged by H2O2 (Figure 6 c,d). The protective effect of the procyanidin trimer C1 was better than that of the procyanidin dimers (B1, B2, B3, B4, B1-G, B2-G) (Figure 6c,d, p < 0.05). There was no significant difference between the procyanidin monomer (C, EC, ECG) treatment groups and the model group (Figure 6c,d, p > 0.05).

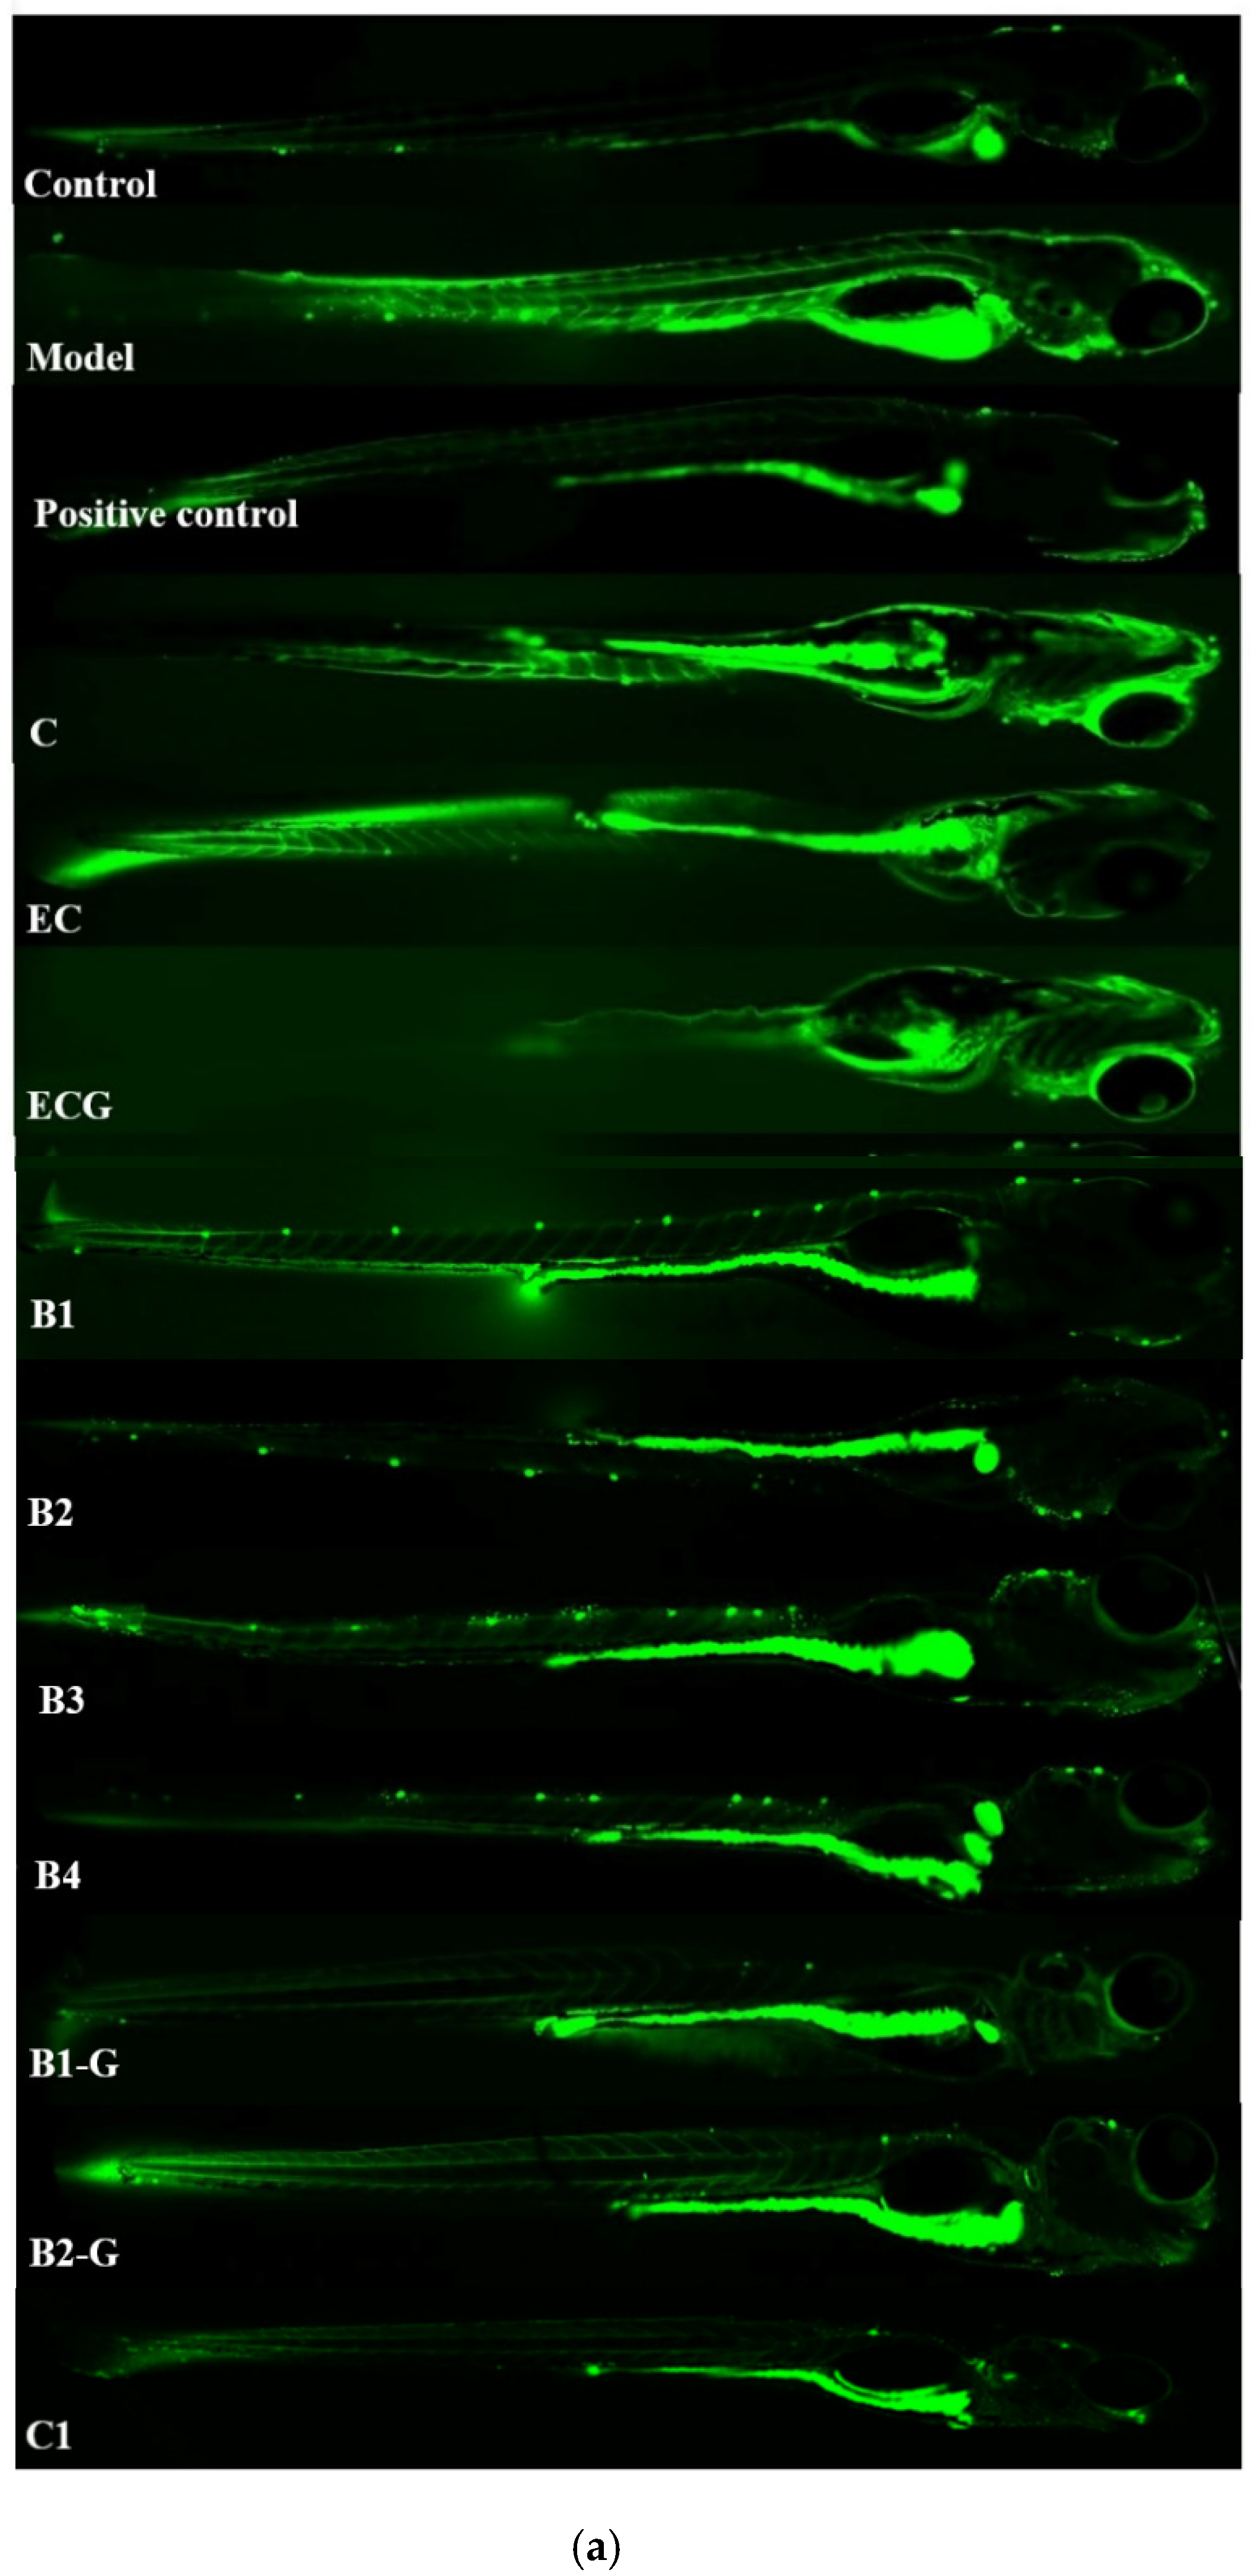
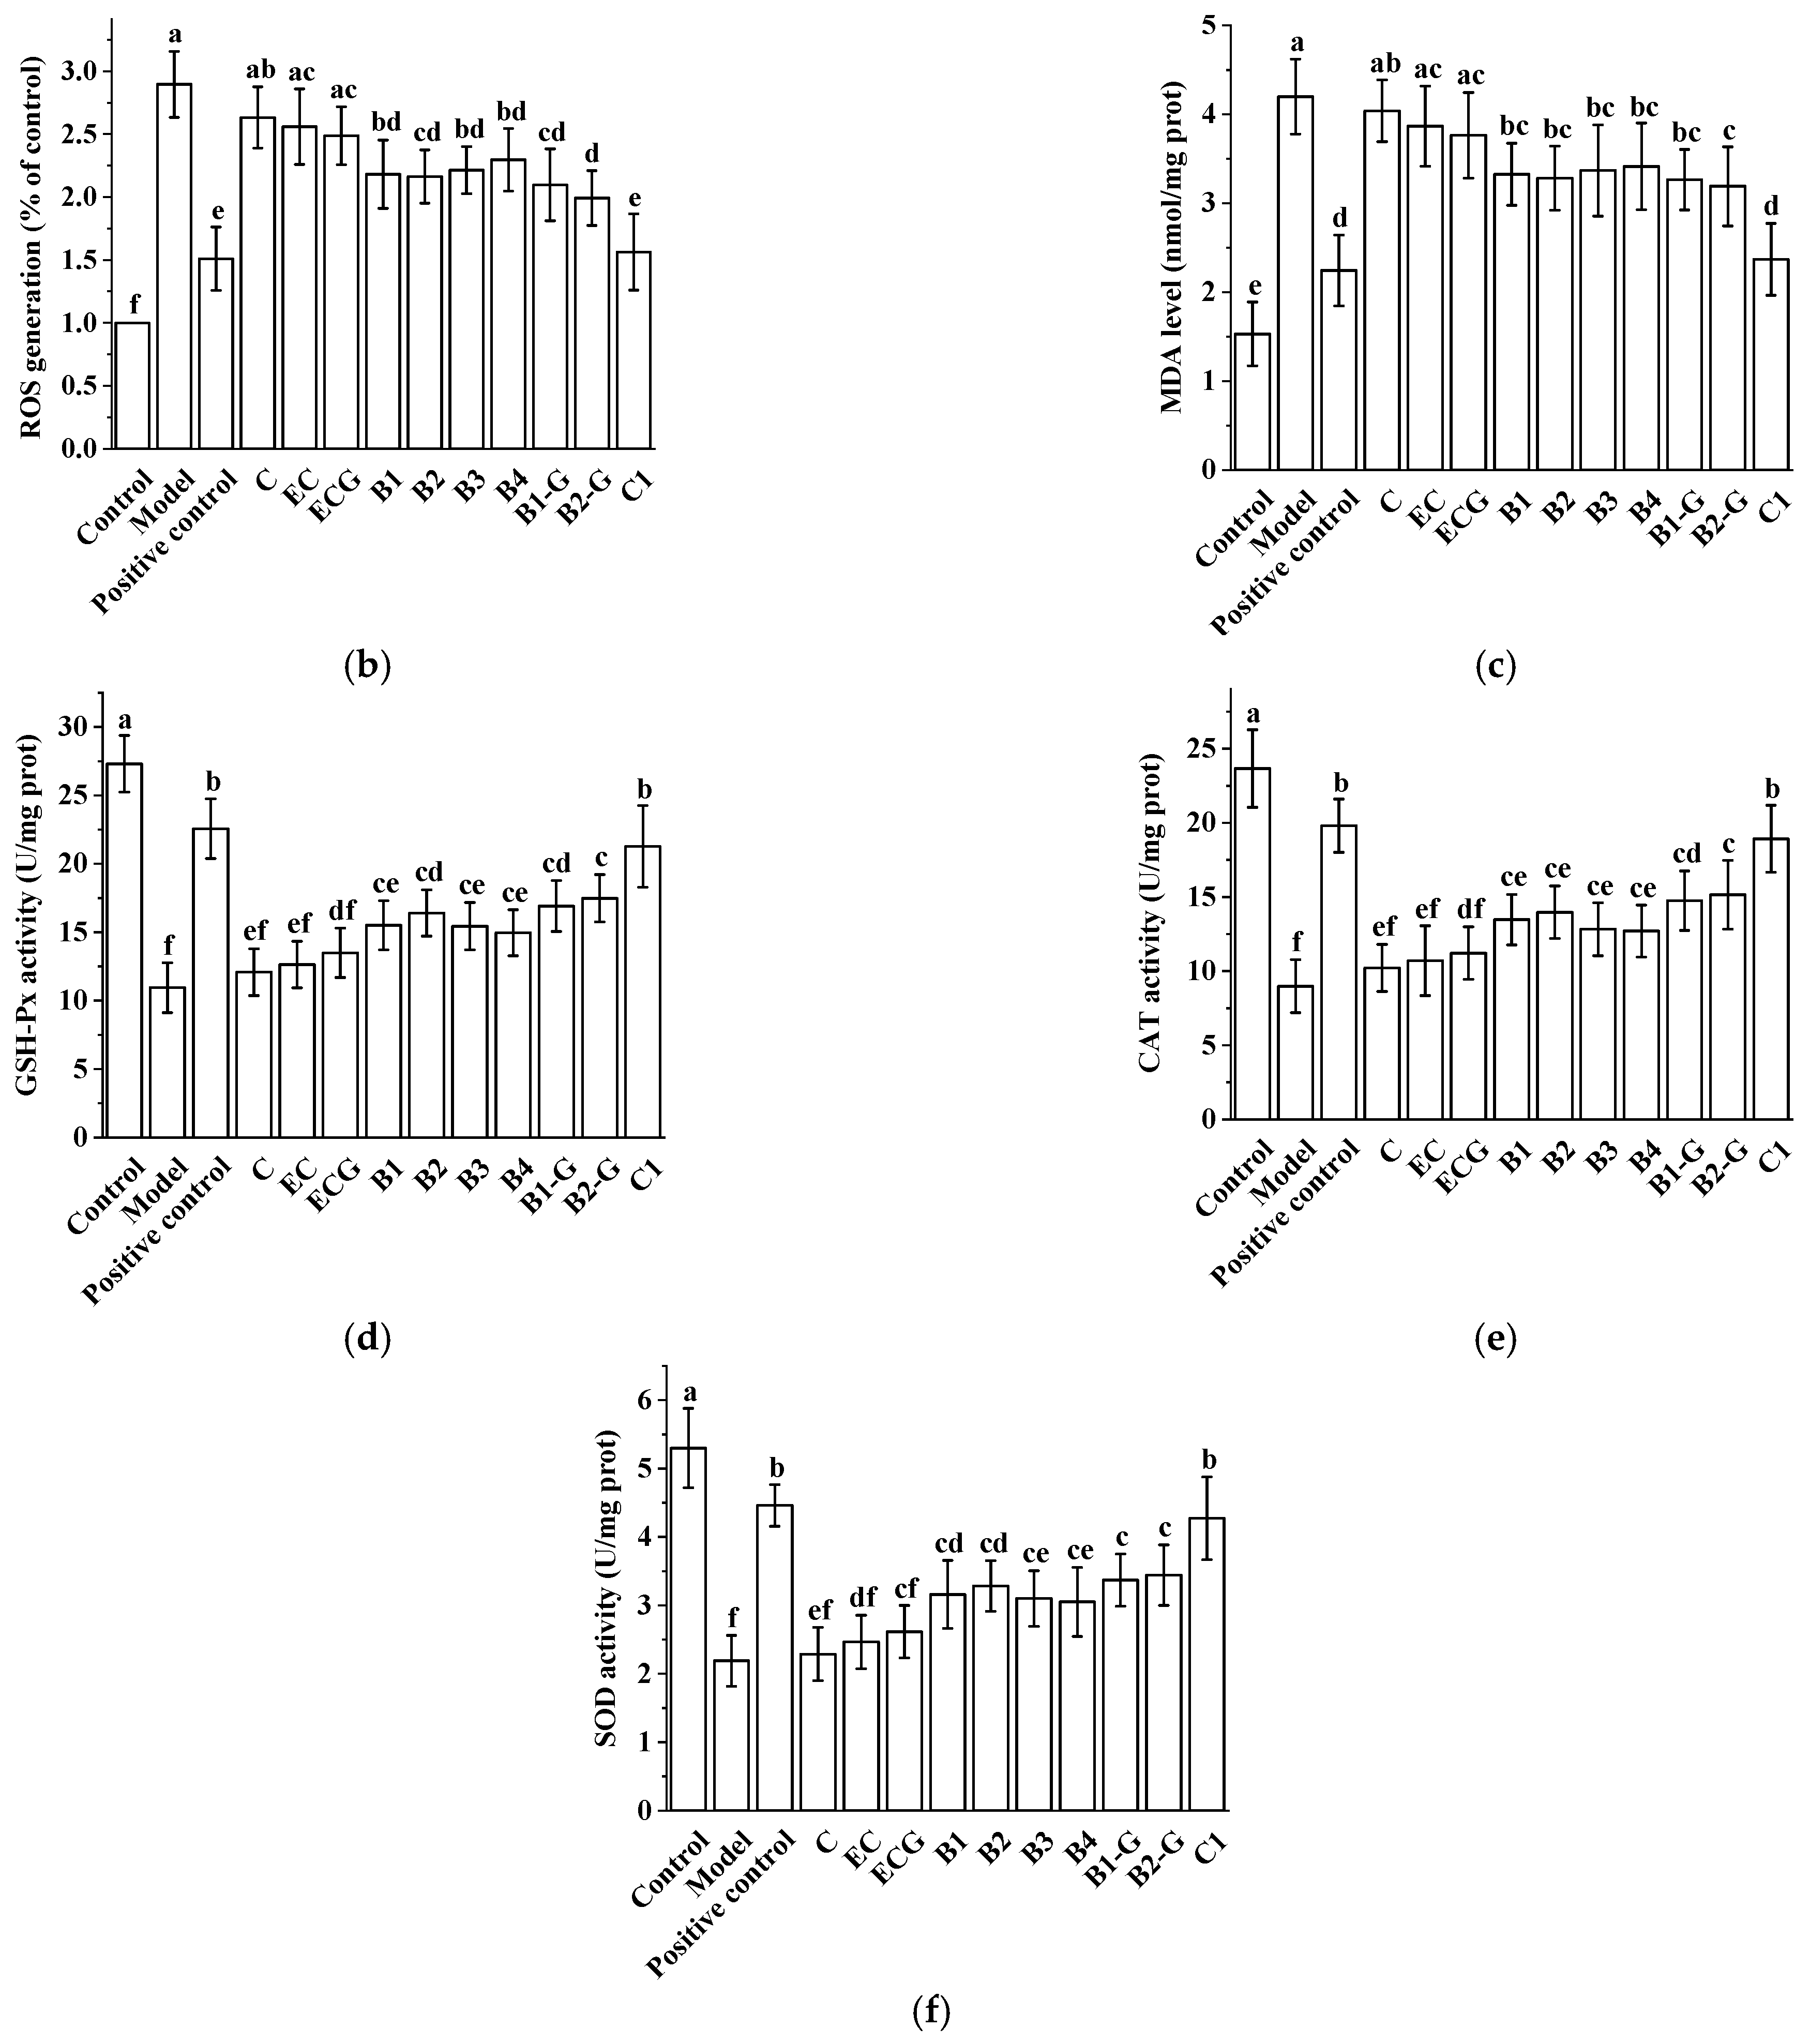
3.7. Effects of Procyanidins with Different Structures on Oxidative Stress in Zebrafish Treated with H2O2

The contents of ROS and MDA in different procyanidin treatment groups were lower than the model group, and the activities of antioxidant enzymes (GSH-Px, CAT, and SOD) were higher than the model group. There was no significant difference between the procyanidin monomer (C, EC, ECG) treatment groups and the model group (Figure 7, p > 0.05); however, there was a significant difference between the procyanidin dimer (B1, B2, B3, B4, B1-G, B2-G) treatment groups and the procyanidin trimer C1 treatment group and the model group (Figure 7, p < 0.05). The effect of the procyanidin trimer C1 treatment group on reducing the content of ROS and MDA and increasing the activity of antioxidant enzymes (GSH-Px, CAT, and SOD) was greater than that of the other treatment groups (Figure 7).

3.8. Effects of Procyanidins with Different Structures on the Nrf2/ARE Pathway in Zebrafish Treated with H2O2

Different procyanidin treatments can up-regulate the expression of Nrf2 and the related genes NQO1 and HO-1, which are downstream of the Nrf2/ARE pathway in H2O2-induced zebrafish. There was no significant difference between the procyanidin monomer (C, EC, ECG) treatment groups and the model group (Figure 8, p > 0.05); however, there was a significant difference between the procyanidin dimer (B1, B2, B3, B4, B1-G, B2-G) treatment groups and the procyanidin trimer C1 treatment group and the model group (Figure 8, p < 0.05). Up-regulation of the Nrf2, NQO1, and HO-1 genes in the procyanidin trimer C1 treatment group was greater than in the other treatment groups.

4. Discussion

Excessive production of ROS and oxidative damage caused by a damaged antioxidant defense system plays a key role in neurodegenerative diseases. Antioxidant supplementation may help to prevent or alleviate neurodegenerative diseases [4,5,6]. Procyanidin is a natural antioxidant with a stronger antioxidant capacity than vitamins C and E [7,8,9]. The bioavailability of procyanidins is affected by their structure, and different plants contain procyanidins with distinct structural types. Due to the large number of procyanidins, complex separation conditions, and difficulty with purification, previous studies have mainly focused on mixtures of procyanidins or individual procyanidins, and less on the structure–activity relationship of a variety of procyanidins [15,16]. Previous studies have found that procyanidins can play a neuroprotective role by regulating the Nrf2/ARE pathway, but the relationship between the neuroprotective effect of procyanidins and the structural characteristics of procyanidins is not clear [10]. Grape seed is one of the most abundant sources of procyanidins in nature [13]. Most procyanidin products are from grape seed [14]. H2O2 can penetrate the cell membrane and cause oxidative stress. This method can thus be used to establish an oxidative stress model. Therefore, 10 procyanidins from grape seeds were selected for study of the relationship between the neuroprotective effects of procyanidins and their structural characteristics using H2O2-damaged PC12 cells and zebrafish modeling.
This study evaluated the effects of 10 grape seed-derived procyanidins on the survival of PC12 cells and the motor capacity of zebrafish challenged with H2O2. The results showed that treatment with 5 μM procyanidins resulted in a protective effect on the survival of PC12 cells, and treatment with 25 μM procyanidins resulted in a protective effect on the motor capacity of zebrafish challenged with H2O2. There was no significant difference between procyanidin monomers (C, EC, ECG) and procyanidin dimers (B1, B2, B3, B4, B1-G, B2-G). Additionally, there was no significant difference between the procyanidin monomer (C, EC, ECG) treatment groups and the model group (p > 0.05). However, there was a significant difference between the procyanidin dimer (B1, B2, B3, B4, B1-G, B2-G) and the procyanidin trimer C1 treatment groups and the model group (p < 0.05). The protective effect of procyanidin trimer C1 treatment on the survival rate of PC12 cells and the motor capacity of zebrafish challenged with H2O2 was greater than that of the other treatment groups. This shows that the protective effect of procyanidins on the viability of PC12 cells damaged by H2O2, and the exercise ability of zebrafish damaged by H2O2, were positively correlated with the degree of procyanidin polymerization.
ROS is an indicator that directly reflects oxidative stress levels [29,30]. MDA is the end product of the peroxidation reaction of free radicals acting on membrane lipids under the catalysis of metal ions, which reflects the degree of oxidative damage [31]. We evaluated the effects of different procyanidins from grape seeds on the content of ROS and MDA in PC12 cells and zebrafish challenged with H2O2. Compared with the model group, procyanidin dimers (B1, B2, B3, B4, B1-G, B2-G) and the procyanidin trimer C1 significantly inhibited H2O2-induced increases in ROS and MDA in PC12 cells and zebrafish (p < 0.05). GSH-Px, CAT, and SOD are important components of the antioxidant system, which can antagonize and block free radicals [32,33]. The higher the activity of GSH-Px, CAT, and SOD, the stronger the ability to scavenge oxygen free radicals [34]. Therefore, the detection of GSH-Px, CAT, and SOD activity can reflect antioxidant capacity. Results showed that compared with the model group, procyanidin dimers (B1, B2, B3, B4, B1-G, B2-G) and the procyanidin trimer C1 increased the activity of GSH-Px, CAT, and SOD in PC12 cells and zebrafish treated with H2O2 (p < 0.05). Procyanidin monomers (C, EC, ECG) also exhibited a reversal effect on the decrease of GSH-Px, CAT, and SOD activities in PC12 cells and zebrafish treated with H2O2; however, there was no significant difference compared to the model group (p > 0.05). This shows that the ability of the procyanidin trimer to reduce ROS and MDA contents and increase the activity of GSH-Px, CAT, and SOD was better than that of the procyanidin dimers (B1, B2, B3, B4, B1-G, B2-G) and procyanidin monomers (C, EC, ECG).
The Nrf2/ARE pathway is an important antioxidant pathway [38]. Under normal conditions, Nrf2 binds to the inhibitory protein Keap1 in the cytoplasm [39]. When the cysteine residue at the terminus of Keap1 is damaged by oxidation, a redox reaction occurs and the conformation of Keap1 changes, causing it to separate from Nrf2. Once Nrf2 is activated, it moves from the cytoplasm to the nucleus, inducing the transcription of ARE-dependent antioxidant genes and enhancing antioxidant capacity [40,41,42,43,44,45]. Our results showed that after treatment with different procyanidins from grape seeds, expression of the Nrf2 gene was up-regulated in zebrafish. In PC12 cells, the expression of total Nrf2 protein increased, Nrf2 protein in the cytoplasm gradually decreased, and Nrf2 protein in the nucleus gradually increased. There were significant differences between the model group and the procyanidin dimer (B1, B2, B3, B4, B1-G, B2-G) and procyanidin trimer C1 groups. The presence of Nrf2 in the nucleus promotes its binding to ARE, catalyzing transcription and inducing the expression of the phase II detoxification enzyme genes NQO1 and HO-1. NQO1 is an antioxidant enzyme that uses NADH or NADPH as a reduction cofactor to participate in the two-electron reduction of endogenous quinones [46]. Chaperone HO-1 cooperates with cytochrome p450 to catalyze the degradation of heme to biliverdin, which is then converted to bilirubin. Both biliverdin and bilirubin exhibit antioxidant and immunomodulatory properties [47,48]. Our results showed that grape seed-derived procyanidin dimers (B1, B2, B3, B4, B1-G, B2-G) and procyanidin trimer C1 treatment in PC12 cells and zebrafish reversed the down-regulation of HO-1 and NQO1 expression induced by H2O2. Nrf2 siRNA treatment was used to further evaluate the role of Nrf2/ARE pathway activation in the procyanidin dimer (B1, B2, B3, B4, B1-G, B2-G) and procyanidin trimer C1 treatment groups. Results showed that the expression of Nrf2 in PC12 cells transfected with Nrf2 siRNA decreased significantly, and the protective effect of the procyanidin dimer (B1, B2, B3, B4, B1-G, B2-G) and procyanidin trimer C1 treatments in PC12 cells treated with H2O2 was blocked. This shows that procyanidins activated the Nrf2/ARE pathway, causing transfer of Nrf2 from the cytoplasm to the nucleus where it accumulated, and increased expression of the phase II detoxification enzymes HO-1 and NQO1, which are downstream of the Nrf2/ARE pathway. The regulatory effect of procyanidins on the Nrf2/ARE pathway was positively correlated with the degree of procyanidin polymerization.

5. Conclusions

Procyanidins from grape seeds protected PC12 cells from H2O2 induced decreases in cell viability, improved the movement behavior disorder of zebrafish caused by H2O2, reversed H2O2-induced increases in ROS and MDA and decreases in antioxidant enzyme (GSH-Px, CAT and SOD) activity, and regulated the Nrf2/ARE pathway. The neuroprotective effect in the procyanidin trimer C1 treatment group was greater than in the procyanidin dimer (B1, B2, B3, B4, B1-G, B2-G) treatment groups, and the neuroprotective effect of the procyanidin monomer (C, EC, ECG) treatment group was less than that of the procyanidin trimer C1 and procyanidin dimer (B1, B2, B3, B4, B1-G, B2-G) treatment groups. Procyanidins play a neuroprotective role through activation of the Nrf2/ARE pathway and its downstream detoxification enzymes (HO-1, NQO1) and antioxidant enzymes (GSH-Px, CAT, and SOD). The degree of procyanidin polymerization is an important factor affecting the neuroprotective effect of procyanidins.

Author Contributions

Conceptualization, J.C. and J.Z. (Jiawen Zhao); methodology, J.C.; software, Y.C.; validation, Y.Z., J.Z (Jiawen Zhao). and H.Y.; formal analysis, J.C.; investigation, Y.C.; resources, J.Z. (Jiajin Zhu); data curation, J.C.; writing—original draft preparation, J.C.; writing—review and editing, J.Z. (Jiajin Zhu); visualization, J.C.; supervision, J.Z. (Jiajin Zhu); project administration, J.Z. (Jiajin Zhu); funding acquisition, J.Z (Jiajin Zhu). All authors have read and agreed to the published version of the manuscript.

Funding

This research received no external funding.

Institutional Review Board Statement

The study was conducted according to the guidelines of the Declaration of Helsinki and approved by the Ethics Committee of Animal Conservation and Use Committee of the Experimental Animal Center at Zhejiang University (ZJU20200125).

Informed Consent Statement

Not applicable.

Data Availability Statement

Data is contained within the article.

Conflicts of Interest

The authors declare no conflict of interest.

References

  1. Brettschneider, J.; Del Tredici, K.; Lee, V.M.Y.; Trojanowski, J.Q. Spreading of pathology in neurodegenerative diseases: A focus on human studies. Nat. Rev. Neurosci. 2015, 16, 109–120. [Google Scholar] [CrossRef] [PubMed]
  2. Yang, Y.; Xu, C.; Liu, X.Y.; Xu, C.; Zhang, Y.Y.; Shen, L.; Vihinen, M.; Shen, B. NDDVD: An integrated and manually curated Neurodegenerative Diseases Variation Database. Database 2018, 2018, bay018. [Google Scholar] [CrossRef] [PubMed]
  3. Hannan, A.J. Trinucleotide-repeat expansions and neurodegenerative disease: A mechanism of pathogenesis. Clin. Exp. Pharmacol. Physiol. 1996, 23, 1015–1020. [Google Scholar] [CrossRef] [PubMed]
  4. Pisoschi, A.M.; Pop, A. The role of antioxidants in the chemistry of oxidative stress: A review. Eur. J. Med. Chem. 2015, 97, 55–74. [Google Scholar] [CrossRef] [PubMed]
  5. Wang, L.; Lee, W.W.; Cui, Y.R.; Ahn, G.; Jeon, Y.J. Protective effect of green tea catechin against urban fine dust particle-induced skin aging by regulation of NF-κB, AP-1, and MAPKs signaling pathways. Environ. Pollut. 2019, 252, 1318–1324. [Google Scholar] [CrossRef] [PubMed]
  6. Wang, L.; Lee, W.W.; Oh, J.Y.; Cui, Y.R.; Ryu, B.M.; Jeon, Y.J. Protective effect of sulfated polysaccharides from celluclast-assisted extract of hizikia fusiforme against ultraviolet b-induced skin damage by regulating NF-κB, AP-1, and MAPKs signaling pathways in vitro in human dermal fibroblasts. Mar. Drugs 2018, 16, 239. [Google Scholar] [CrossRef] [Green Version]
  7. Terra, X.; Fernández-Larrea, J.; Pujadas, G.; Ardèvol, A.; Bladé, C.; Salvadó, J.; Arola, L.; Blay, M.T. Inhibitory effects of grape seed procyanidins on foam cell formation in vitro. J. Agric. Food Chem. 2009, 57, 2588–9254. [Google Scholar] [CrossRef]
  8. Gu, L.W.; Kelm, M.A.; Hammerstone, J.F.; Beecher, G.; Holden, J.; Haytowitz, D.; Gebhardt, S.; Prior, R.L. Concentrations of proanthocyanidins in common foods and estimations of normal consumption. J. Nutr. 2004, 134, 613–617. [Google Scholar] [CrossRef]
  9. Bagchi, D.; Garg, A.; Krohn, R.L.; Bagchi, M.; Tran, M.X.; Stohs, S.J. Oxygen free radical scavenging abilities of vitamins C and E, and a grape seed proanthocyanidin extract in vitro. Res. Commun. Mol. Pathol. Pharmacol. 1997, 95, 179–189. [Google Scholar]
  10. Chen, J.; Chen, Y.X.; Zheng, Y.F.; Zhao, J.W.; Yu, H.L.; Zhu, J.J.; Li, D. Neuroprotective effects and mechanisms of procyanidins in vitro and in vivo. Molecules 2021, 26, 2963. [Google Scholar] [CrossRef]
  11. Luo, L.X.; Bai, R.F.; Zhao, Y.Q.; Li, J.; Wei, Z.M.; Wang, F.; Sun, B. Protective effect of grape seed procyanidins against H2O2-induced oxidative stress in PC-12 neuroblastoma cells: Structure-activity relationships. J. Food Sci. 2018, 83, 2622–2628. [Google Scholar] [CrossRef] [PubMed]
  12. White, B.L.; Howard, L.R.; Prior, R.L. Release of bound procyanidins from cranberry pomace by alkaline hydrolysis. J. Agric. Food Chem. 2010, 58, 7572–7579. [Google Scholar] [CrossRef] [PubMed]
  13. Ricardo da Silva, J.M.; Rigaud, J.; Cheynier, V.; Cheminat, A.; Moutounet, M. Procyanidin dimers and trimers from grape seeds. Phytochemistry 1991, 30, 1259–1264. [Google Scholar] [CrossRef]
  14. Spranger, I.; Sun, B.; Mateus, A.M.; Freitas, V.D.; Ricardo-da-Silva, J.M. Chemical characterization and antioxidant activities of oligomeric and polymeric procyanidin fractions from grape seeds. Food Chem. 2008, 108, 519–532. [Google Scholar] [CrossRef] [PubMed] [Green Version]
  15. Gu, L.W.; Kelm, M.; Hammerstone, J.F.; Beecher, G.; Cunningham, D.; Vannozzi, S.; Prior, R.L. Fractionation of polymeric procyanidins from lowbush blueberry and quantification of procyanidins in selected foods with an optimized normal-phase HPLC−MS fluorescent detection method. J. Agric. Food Chem. 2002, 50, 4852–4860. [Google Scholar] [CrossRef]
  16. Labarbe, B.; Cheynier, V.; Brossaud, F.; Souquet, J.-M.; Moutounet, M. Quantitative fractionation of grape proanthocyanidins according to their degree of polymerization. J. Agric. Food Chem. 1999, 47, 2719–2723. [Google Scholar] [CrossRef]
  17. Santos, S.D.M.; Verveer, P.J.; Bastiaens, P.I.H. Growth factor-induced MAPK network topology shapes Erk response determining PC-12 cell fate. Nat. Cell Biol. 2007, 9, 324–330. [Google Scholar] [CrossRef]
  18. Greenberg, D.A.; Jin, K. From angiogenesis to neuropathology. Nature 2005, 438, 954–959. [Google Scholar] [CrossRef]
  19. Shui, G.; Bao, Y.M.; Bo, J.; An, L.J. Protective effect of protocatechuic acid from Alpinia oxyphylla on hydrogen peroxide-induced oxidative PC12 cell death. Eur. J. Pharmacol. 2006, 538, 73–79. [Google Scholar] [CrossRef]
  20. Cheng, X.; Zhang, L.; Hu, J.; Sun, L.; Du, G. Neuroprotective effects of tetramethylpyrazine on hydrogen peroxide-induced apoptosis in PC12 cells. Cell Biol. Int. 2007, 31, 438–443. [Google Scholar] [CrossRef]
  21. Jiang, B. Hydrogen peroxide-induced apoptosis in PC12 cells and the protective effect of puerarin. Cell Biol. Int. 2003, 27, 1025–1031. [Google Scholar] [CrossRef] [PubMed]
  22. Ellett, F.; Lieschke, G.J. Zebrafish as a model for vertebrate hematopoiesis. Curr. Opin. Pharmacol. 2010, 10, 563–570. [Google Scholar] [CrossRef] [PubMed]
  23. Cahill, G.M. Clock mechanisms in zebrafish. Cell Tissue Res. 2002, 309, 27–34. [Google Scholar] [CrossRef] [PubMed]
  24. Guo, S. Linking genes to brain, behavior and neurological diseases: What can we learn from zebrafish? Genes Brain Behav. 2004, 3, 63–74. [Google Scholar] [CrossRef]
  25. Ninkovic, J.; Bally-Cuif, L. The zebrafish as a model system for assessing the reinforcing properties of drugs of abuse. Methods 2006, 39, 262–274. [Google Scholar] [CrossRef]
  26. Rink, E.; Wullimann, M.F. Connections of the ventral telencephalon (subpallium) in the zebrafish (Danio rerio). Brain Res. 2004, 1011, 206–220. [Google Scholar] [CrossRef]
  27. Wullimann, M.F.; Mueller, T. Teleostean and mammalian forebrains contrasted: Evidence from genes to behavior. J. Comp. Neurol. 2004, 475, 143–162. [Google Scholar] [CrossRef]
  28. Kalueff, A.V.; Stewart, A.M.; Gerlai, R. Zebrafish as an emerging model for studying complex brain disorders. Trends Pharmacol. Sci. 2014, 35, 63–75. [Google Scholar] [CrossRef] [Green Version]
  29. Tabei, Y.; Murotomi, K.; Umeno, A.; Horie, M.; Tsujino, Y.; Masutani, B.; Yoshida, Y.; Nakajima, Y. Antioxidant properties of 5-hydroxy-4-phenyl-butenolide via activation of Nrf2/ARE signaling pathway. Food Chem. Toxicol. 2017, 107, 129–137. [Google Scholar] [CrossRef]
  30. Wang, Y.; Wu, Y.P.; Wang, Y.B.; Fu, A.K.; Gong, L.; Li, W.F.; Li, Y. Bacillus amyloliquefaciens SC06 alleviates the oxidative stress of IPEC-1 via modulating Nrf2/Keap1 signaling pathway and decreasing ROS production. Appl. Microbiol. Biotechnol. 2017, 101, 3015–3026. [Google Scholar] [CrossRef]
  31. Pei, J.J.; Guo, S.; Zhang, C.L.; Zhu, Z.P.; Yu, L.H.; Xie, K.Q.; Zhao, X. Effects of tea polyphenols on the activity of GSH-Px and NOS, and the content of MDA and NO in rats fed with high methionine diet. J. Hyg. Res. 2011, 40, 750–752. [Google Scholar]
  32. Gadea, J.N.; Sellés, E.; Marco, M.A.; Coy, P.; Matás, C.; Romar, R.; Ruiz, S. Decrease in glutathione content in boar sperm after cryopreservation: Effect of the addition of reduced glutathione to the freezing and thawing extenders. Theriogenology 2004, 62, 690–701. [Google Scholar] [CrossRef] [PubMed]
  33. Chen, Q.; Zhang, R.; Li, W.M.; Niu, Y.J.; Guo, H.C.; Liu, X.H.; Hou, Y.-C.; Zhao, L.-J. The protective effect of grape seed procyanidin extract against cadmium-induced renal oxidative damage in mice. Environ. Toxicol. Pharmacol. 2013, 36, 759–768. [Google Scholar] [CrossRef] [PubMed]
  34. MatÉs, J.M.; Pérez-Gómez, C.; De Castro, I.N. Antioxidant enzymes and human diseases. Clin. Biochem. 1999, 32, 595–603. [Google Scholar] [CrossRef]
  35. Moreira, P.I.; Santos, M.S.; Oliveira, C.R.; Shenk, J.C.; Nunomura, A.; Smith, M.A.; Zhu, X. Alzheimer Disease and the Role of Free Radicals in the Pathogenesis of the Disease. CNS Neurol. Disord. Drug Targets 2008, 7, 3–10. [Google Scholar]
  36. Mucke, L. NEUROSCIENCE Alzheimer’s disease. Nature 2009, 461, 895–897. [Google Scholar] [CrossRef]
  37. Hallett, P.J.; Engelender, S.; Isacson, O. Lipid and immune abnormalities causing age-dependent neurodegeneration and Parkinson’s disease. J. Neuroinflamm. 2019, 16, 153. [Google Scholar] [CrossRef] [Green Version]
  38. Yu, M.; Li, H.; Liu, Q.M.; Liu, F.; Tang, L.J.; Li, C.Y.; Yuan, Y.; Zhan, Y.; Xu, W.; Li, W.; et al. Nuclear factor p65 interacts with Keap1 to repress the Nrf2-ARE pathway. Cell. Signal. 2011, 23, 883–892. [Google Scholar] [CrossRef]
  39. Hybertson, B.M.; Gao, B.; Bose, S.K.; McCord, J.M. Oxidative stress in health and disease: The therapeutic potential of Nrf2 activation. Mol. Aspects Med. 2011, 32, 234–246. [Google Scholar] [CrossRef]
  40. Sun, Z.; Zhang, S.; Chan, J.Y.; Zhang, D.D. Keap1 controls postinduction repression of the Nrf2-mediated antioxidant response by escorting nuclear export of Nrf2. Mol. Cell. Biol. 2007, 27, 6334–6349. [Google Scholar] [CrossRef] [Green Version]
  41. Schmidlin, C.J.; Dodson, M.B.; Madhavan, L.; Zhang, D.D. Redox regulation by NRF2 in aging and disease. Free Radic. Biol. Med. 2019, 134, 702–707. [Google Scholar] [CrossRef] [PubMed]
  42. Li, M.Q.; Xu, T.; Zhou, F.; Wang, M.M.; Song, H.X.; Xiao, X.; Lu, B. Neuroprotective effects of four phenylethanoid glycosides on H2O2-induced apoptosis on PC12 cells via the Nrf2/ARE pathway. Int. J. Mol. Sci. 2018, 19, 1135. [Google Scholar] [CrossRef] [PubMed] [Green Version]
  43. Itoh, K.; Igarashi, K.; Hayashi, N.; Nishizawa, M.; Yamamoto, M. Cloning and characterization of a novel erythroid cell-derived CNC family transcription factor heterodimerizing with the small Maf family proteins. Mol. Cell. Biol. 1995, 15, 4184–4193. [Google Scholar] [CrossRef] [PubMed] [Green Version]
  44. Peng, S.J.; Hou, Y.N.; Yao, J.; Fang, J.G. Activation of Nrf2-driven antioxidant enzymes by cardamonin confers neuroprotection of PC12 cells against oxidative damage. Food Funct. 2017, 8, 997–1007. [Google Scholar] [CrossRef]
  45. Mi, Y.S.; Zhang, W.T.; Tian, H.Y.; Li, R.N.; Huang, S.X.; Li, X.Y.; Qi, G. EGCG evokes Nrf2 nuclear translocation and dampens PTP1B expression to ameliorate metabolic misalignment under insulin resistance condition. Food Funct. 2018, 9, 1510–1523. [Google Scholar] [CrossRef]
  46. Iyanagi, T.; Yamazaki, I. One-electron-transfer reactions in biochemical systems V. Difference in the mechanism of quinone reduction by the NADH dehydrogenase and the NAD(P)H dehydrogenase (DT-diaphorase). Biochim. Biophys. Acta Bioenerg. 1970, 216, 282–294. [Google Scholar] [CrossRef]
  47. Dore, S.; Snyder, S.H. Neuroprotective action of bilirubin against oxidative stress in primary hippocampal cultures. Ann. N. Y. Acad. Sci. 1999, 890, 167–172. [Google Scholar] [CrossRef]
  48. Stocker, R.; Yamamoto, Y.; McDonagh, A.F.; Glazer, A.N.; Ames, B.N. Bilirubin is an antioxidant of possible physiological importance. Science 1987, 235, 1043–1046. [Google Scholar] [CrossRef]
Figure 1. Cytotoxicity of different procyanidins in PC12 cells. (a) Survival of PC12 cells in the C treatment group; (b) Survival rate of PC12 cells in the EC treatment group; (c) Survival rate of PC12 cells in the ECG treatment group; (d) Survival rate of PC12 cells in the B1 treatment group; (e) Survival rate of PC12 cells in the B2 treatment group; (f) Survival rate of PC12 cells in the B3 treatment group; (g) Survival rate of PC12 cells in the B4 treatment group; (h) Survival rate of PC12 cells in the B1-G treatment group; (i) Survival rate of PC12 cells in the B2-G treatment group; (j) Survival rate of PC12 cells in the C1 treatment group. Data are expressed as the mean ± SD. All experiments were conducted six times. Values with different letters above each bar represent significant differences (p < 0.05, one-way ANOVA). PC12, rat pheochromocytoma cell line; EC, epicatechin; ECG, epicatechin gallate; B1, procyanidin B1; B2, procyanidin B2; B3, procyanidin B3; B4, procyanidin B4; B1-G, procyanidin B1-3-O-gallate; B2-G: procyanidin B2-3-O-gallate; C1: procyanidin C1; SD, standard deviation; ANOVA, one-way analysis of variance.
Molecules 27 02308 g001aMolecules 27 02308 g001b
Figure 2. Effect of different procyanidins on the survival of PC12 cells induced by H2O2. (a) Effect of 2.5 μM procyanidins on the survival of PC12 cells induced by H2O2; (b) Effect of 5 μM procyanidins on the survival of PC12 cells induced by H2O2. Control, Blank control group; Model. H2O2 (200 μM); Positive control, NAC (20 μM) + H2O2 (200 μM); C, C + H2O2 (200 μM); EC, EC + H2O2 (200 μM); ECG, ECG + H2O2 (200 μM); B1, B1 + H2O2 (200 μM); B2, B2 + H2O2 (200 μM); B3, B3 + H2O2 (200 μM); B4, B4 + H2O2 (200 μM); B1-G, B1-G + H2O2 (200 μM); B2-G, B2-G + H2O2 (200 μM); C1, C1 + H2O2 (200 μM). Data are expressed as the mean ± SD. All experiments were conducted six times. Values with different letters above each bar represent significant differences (p < 0.05, one-way ANOVA). NAC, N-acetyl-l-cysteine.
Molecules 27 02308 g002
Figure 3. Effects of procyanidins with different structures on oxidative stress in PC12 cells treated with H2O2. (a) Representative fluorescence photomicrographs of PC12 cells; (b) ROS levels; (c) MDA levels; (d) GSH-Px activity; (e) CAT activity; (f) SOD activity. Data are expressed as the mean ± SD. Control, Blank control group; Model, H2O2 (200 μM); Positive control, NAC (20 μM) + H2O2 (200 μM); C, C (5 μM) + H2O2 (200 μM); EC, EC (5 μM) + H2O2 (200 μM); ECG, ECG (5 μM) + H2O2 (200 μM); B1, B1 (5 μM) + H2O2 (200 μM); B2, B2 (5 μM) + H2O2 (200 μM); B3, B3 (5 μM) + H2O2 (200 μM); B4, B4 (5 μM) + H2O2 (200 μM); B1-G, B1-G (5 μM) + H2O2 (200 μM); B2-G, B2-G (5 μM) + H2O2 (200 μM); C1, C1 (5 μM) + H2O2 (200 μM). All experiments were conducted three times. Values with different letters are significantly different (p < 0.05, one-way ANOVA). ROS, reactive oxygen species; MDA, malondialdehyde; GSH-Px, glutathione peroxidase; CAT, catalase; SOD, superoxide dismutase.
Molecules 27 02308 g003aMolecules 27 02308 g003b
Figure 4. Effects of procyanidins with different structures on the Nrf2/ARE pathway in PC12 cells treated with H2O2. (a) Protein levels of Nrf2, as determined by Western blotting; (b) Relative Nrf2/GAPDH protein expression (ratio to control); (c) Protein expression levels of nuclear Nrf2 and cytoplasmic Nrf2, as determined by Western blotting; (d) Relative nuclear Nrf2/Lamin B protein expression (ratio to control); (e) Relative cytoplasmic Nrf2/GAPDH protein expression (ratio to control); (f) Protein levels of HO-1 and NQO1, as determined by Western blotting; (g) Relative HO-1/GAPDH protein expression (ratio to control); (h) Relative NQO1/GAPDH protein expression (ratio to control). Data are expressed as the mean ± SD. Control, Blank control group; Model, H2O2 (200 μM); Positive control, NAC (20 μM) + H2O2 (200 μM); C, C (5 μM) + H2O2 (200 μM); EC, EC (5 μM) + H2O2 (200 μM); ECG, ECG (5 μM) + H2O2 (200 μM); B1, B1 (5 μM) + H2O2 (200 μM); B2, B2 (5 μM) + H2O2 (200 μM); B3, B3 (5 μM) + H2O2 (200 μM); B4, B4 (5 μM) + H2O2 (200 μM); B1-G, B1-G (5 μM) + H2O2 (200 μM); B2-G, B2-G (5 μM) + H2O2 (200 μM); C1, C1 (5 μM) + H2O2 (200 μM). All experiments were conducted three times. Values with different letters are significantly different (p < 0.05, one-way ANOVA). Nrf2, nuclear factor-erythroid 2-related factor 2; ARE, antioxidant response element; HO-1, heme oxygenase 1; NQO1, NAD(P)H: quinone oxidoreductase 1.
Molecules 27 02308 g004
Figure 5. Verification of the role of Nrf2 in the protective effect of procyanidins with different structures. (a) Knockout efficiency was confirmed by determination of Nrf2 protein expression using Western blotting; (b) Relative Nrf2/GAPDH protein expression (ratio to control); (c) Cell viability. Data are shown as the mean ± SD. All experiments were conducted three times. Values with different letters are significantly different (p < 0.05, one-way ANOVA).
Molecules 27 02308 g005
Figure 6. Effects of procyanidins with different structures on exercise ability in zebrafish treated with H2O2. (a) Swimming traces of zebrafish in each group; (b) Average total distance of zebrafish in each group; (c) Swimming traces of zebrafish in each group; (d) Average total distance of zebrafish in each group. Data are expressed as the mean ± SD. Control, Blank control group; Model, H2O2 (300 μM); Positive control, NAC (30 μM) + H2O2 (300 μM); C, C (25 μM) + H2O2 (300 μM); EC, EC (25 μM) + H2O2 (300 μM); ECG, ECG (25 μM) + H2O2 (300 μM); B1, B1 (25 μM) + H2O2 (300 μM); B2, B2 (25 μM) + H2O2 (300 μM); B3, B3 (25 μM) + H2O2 (300 μM); B4, B4 (25 μM) + H2O2 (300 μM); B1-G, B1-G (25 μM) + H2O2 (300 μM); B2-G, B2-G (25 μM) + H2O2 (300 μM); C1, C1 (25 μM) + H2O2 (300 μM). All experiments were conducted three times. Values with different letters are significantly different (p < 0.05, one-way ANOVA).
Molecules 27 02308 g006
Figure 7. Effects of procyanidins with different structures on oxidative stress in zebrafish treated with H2O2. (a) Representative fluorescence photomicrographs of zebrafish; (b) ROS levels; (c) MDA levels; (d) GSH-Px activity; (e) CAT activity; (f) SOD activity. Data are expressed as the mean ± SD. Control, Blank control group; Model, H2O2 (300 μM); Positive control, NAC (30 μM) + H2O2 (300 μM); C, C (25 μM) + H2O2 (300 μM); EC, EC (25 μM) + H2O2 (300 μM); ECG, ECG (25 μM) + H2O2 (300 μM); B1, B1 (25 μM) + H2O2 (300 μM); B2, B2 (25 μM) + H2O2 (300 μM); B3, B3 (25 μM) + H2O2 (300 μM); B4, B4 (25 μM) + H2O2 (300 μM); B1-G, B1-G (25 μM) + H2O2 (300 μM); B2-G, B2-G (25 μM) + H2O2 (300 μM); C1, C1 (25 μM) + H2O2 (300 μM). All experiments were conducted three times. Values with different letters are significantly different (p < 0.05, one-way ANOVA).
Molecules 27 02308 g007aMolecules 27 02308 g007b
Figure 8. Effects of procyanidins with different structures on the Nrf2/ARE pathway in zebrafish treated with H2O2. (a) Nrf2 levels; (b) NQO1 levels; (c) HO-1 levels. Data are expressed as the mean ± SD. Control, Blank control group; Model, H2O2 (300 μM); Positive control, NAC (30 μM) + H2O2 (300 μM); C, C (25 μM) + H2O2 (300 μM); EC, EC (25 μM) + H2O2 (300 μM); ECG, ECG (25 μM) + H2O2 (300 μM); B1, B1 (25 μM) + H2O2 (300 μM); B2, B2 (25 μM) + H2O2 (300 μM); B3, B3 (25 μM) + H2O2 (300 μM); B4, B4 (25 μM) + H2O2 (300 μM); B1-G, B1-G (25 μM) + H2O2 (300 μM); B2-G, B2-G (25 μM) + H2O2 (300 μM); C1, C1 (25 μM) + H2O2 (300 μM). All experiments were conducted three times. Values with different letters are significantly different (p < 0.05, one-way ANOVA).
Molecules 27 02308 g008
Table 1. Sequences of primers for quantitative real-time PCR.
GenesForward PrimerReverse Primer
β-ActinCACTGAGGCTCCCCTGAATCGGGTCACACCATCACCAGAG
Nrf2CTGCTGTCACTCCCAGAGTTGCCGTAGTTTTGGGTTGGTG
HO-1AAGAGCTGGACAGAAACGCAAGAAGTGCTCCAAGTCCTGC
NQO1AAGCCTCTGTCCTTTGCTCCTGCTGTGGTAATGCCGTAGG
Nrf2: nuclear factor-erythroid 2-related factor 2; HO-1: heme oxygenase 1; NQO1: quinone oxidoreductase 1.
Publisher’s Note: MDPI stays neutral with regard to jurisdictional claims in published maps and institutional affiliations.

