
Potential Therapeutic Target Protein Tyrosine Phosphatase-1B for Modulation of Insulin Resistance with Polyphenols and Its Quantitative Structure–Activity Relationship

 ,
,  , ,
, ,  , ,
, ,  ,
,  ,
,
Abstract
: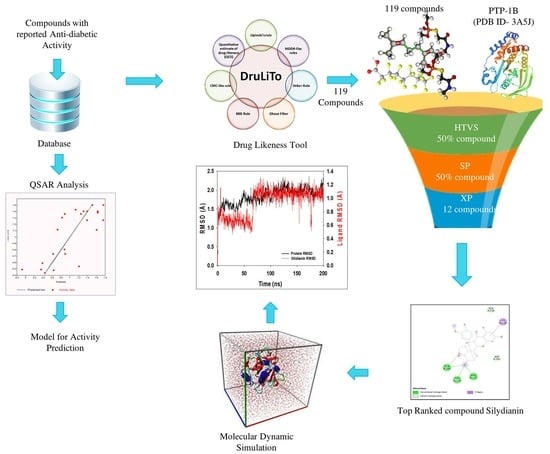
1. Introduction
2. Results
2.1. QSAR Model Analysis
× (nrot) + 0.1516 × (naro) + 0.442 × (TPSA) + −1.807 × (LogP)
2.2. Lipinski’s Rule of Five
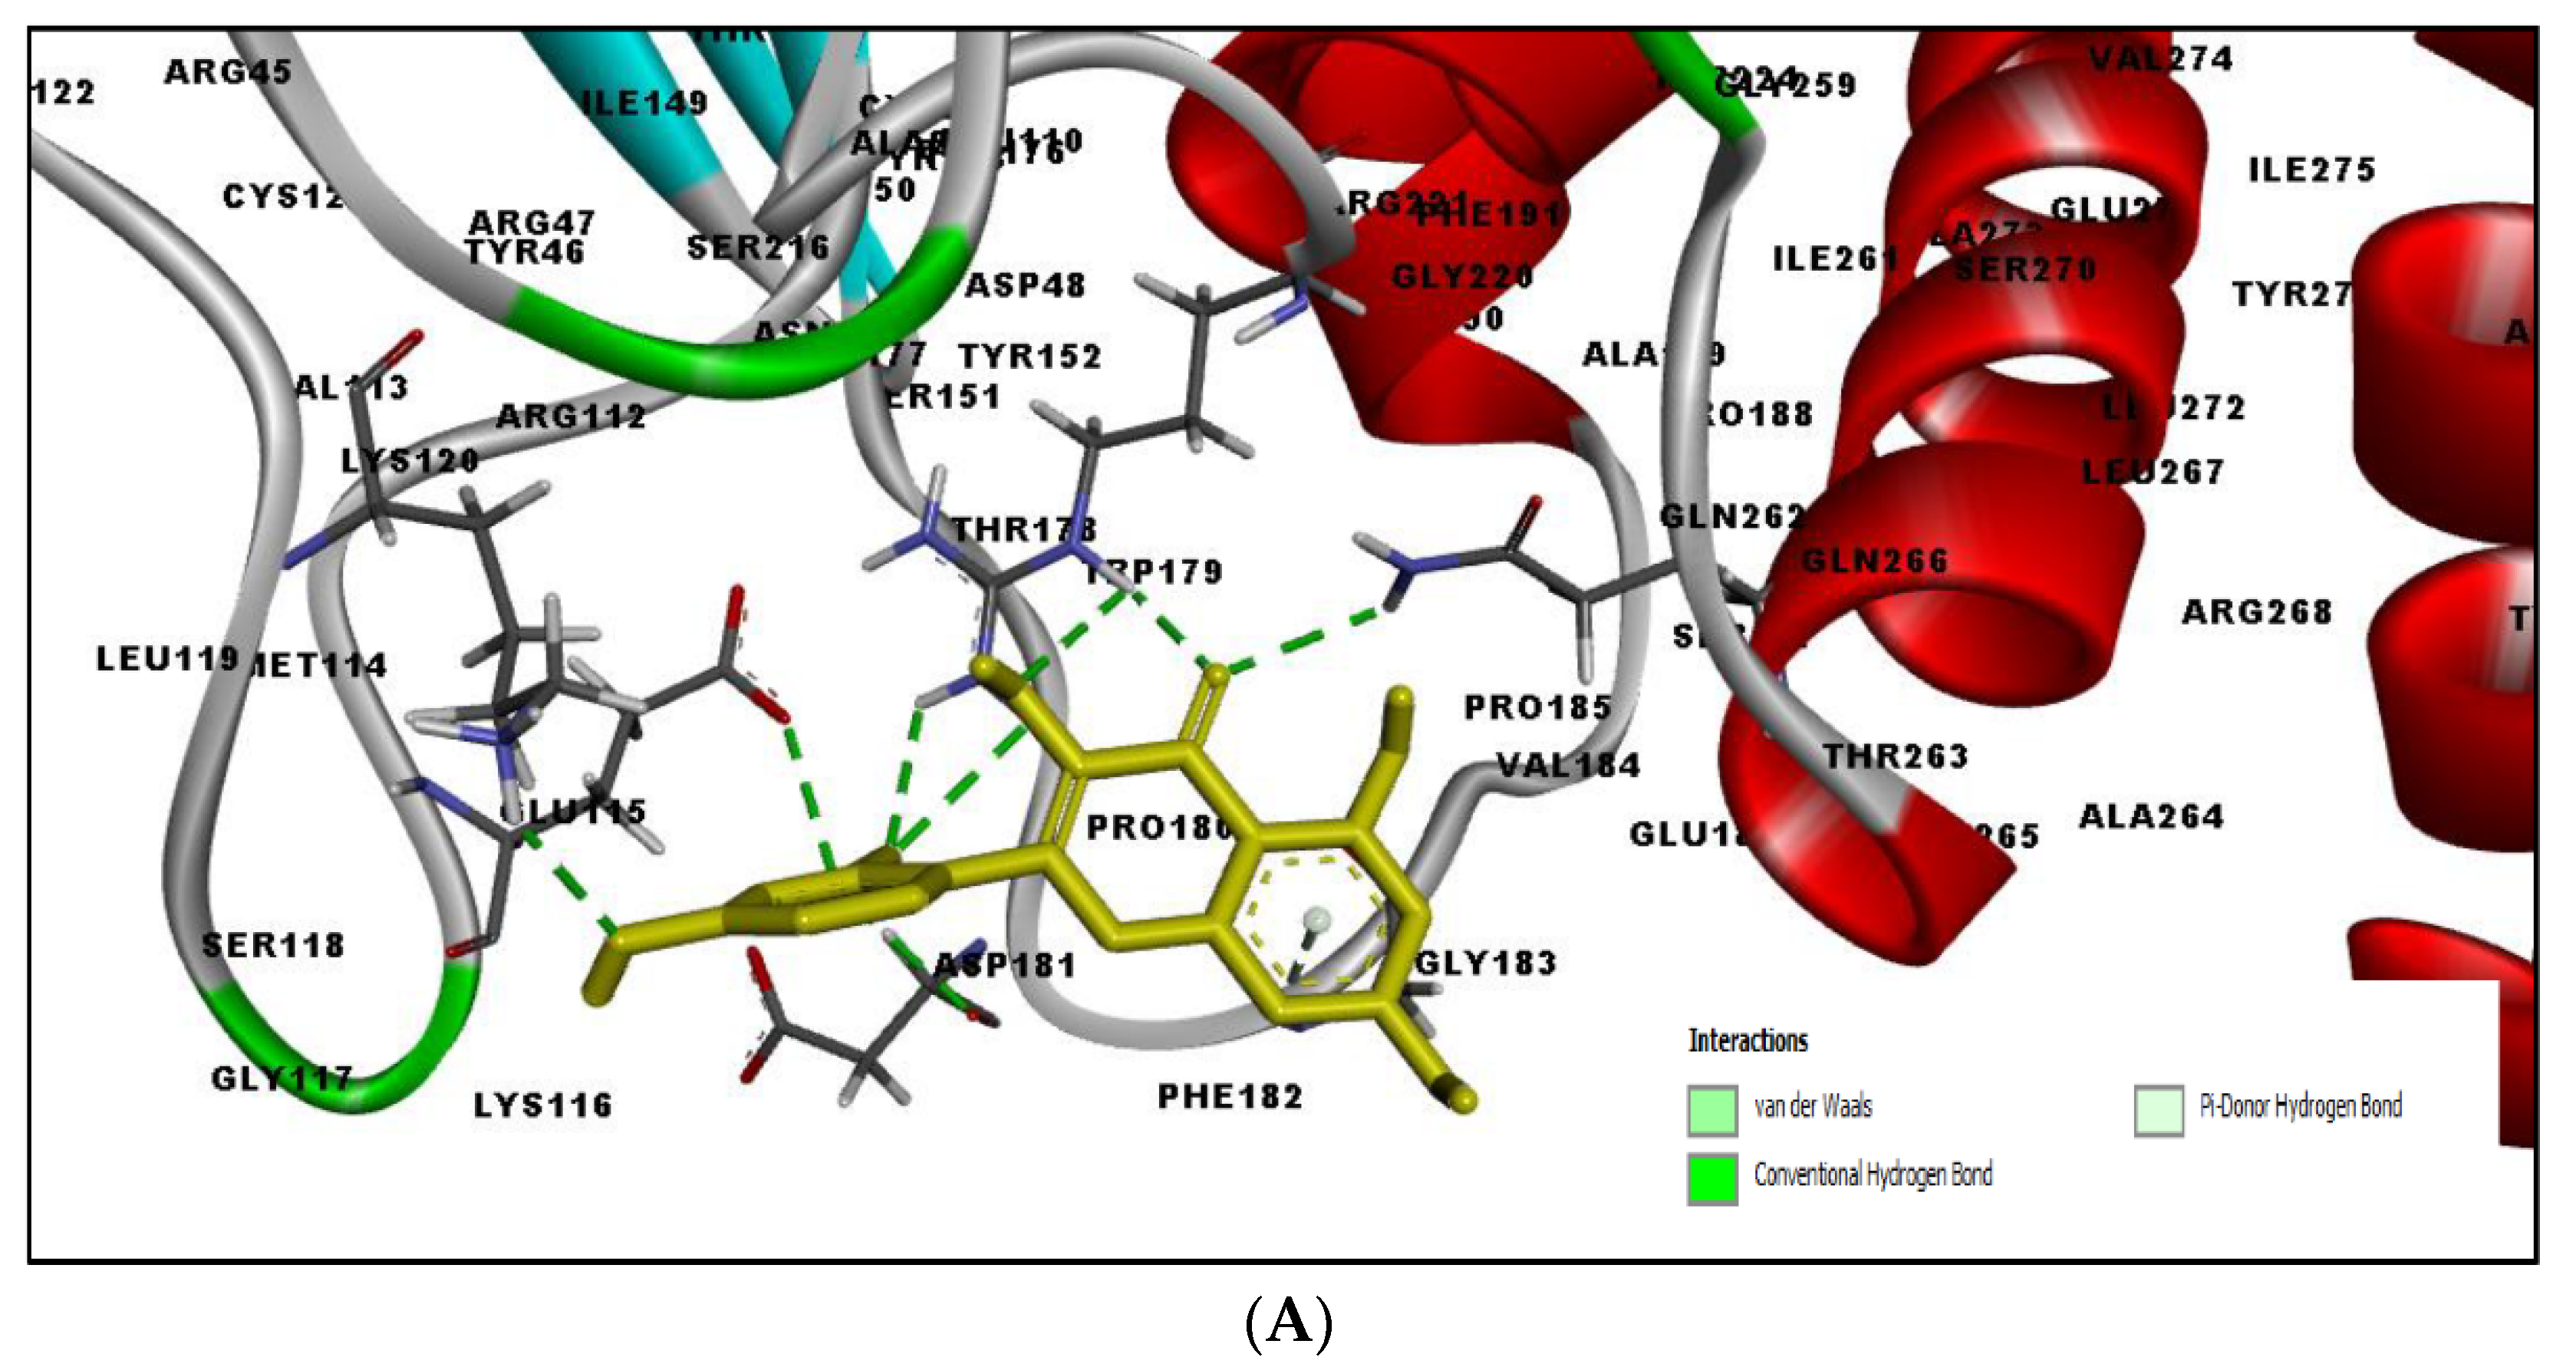
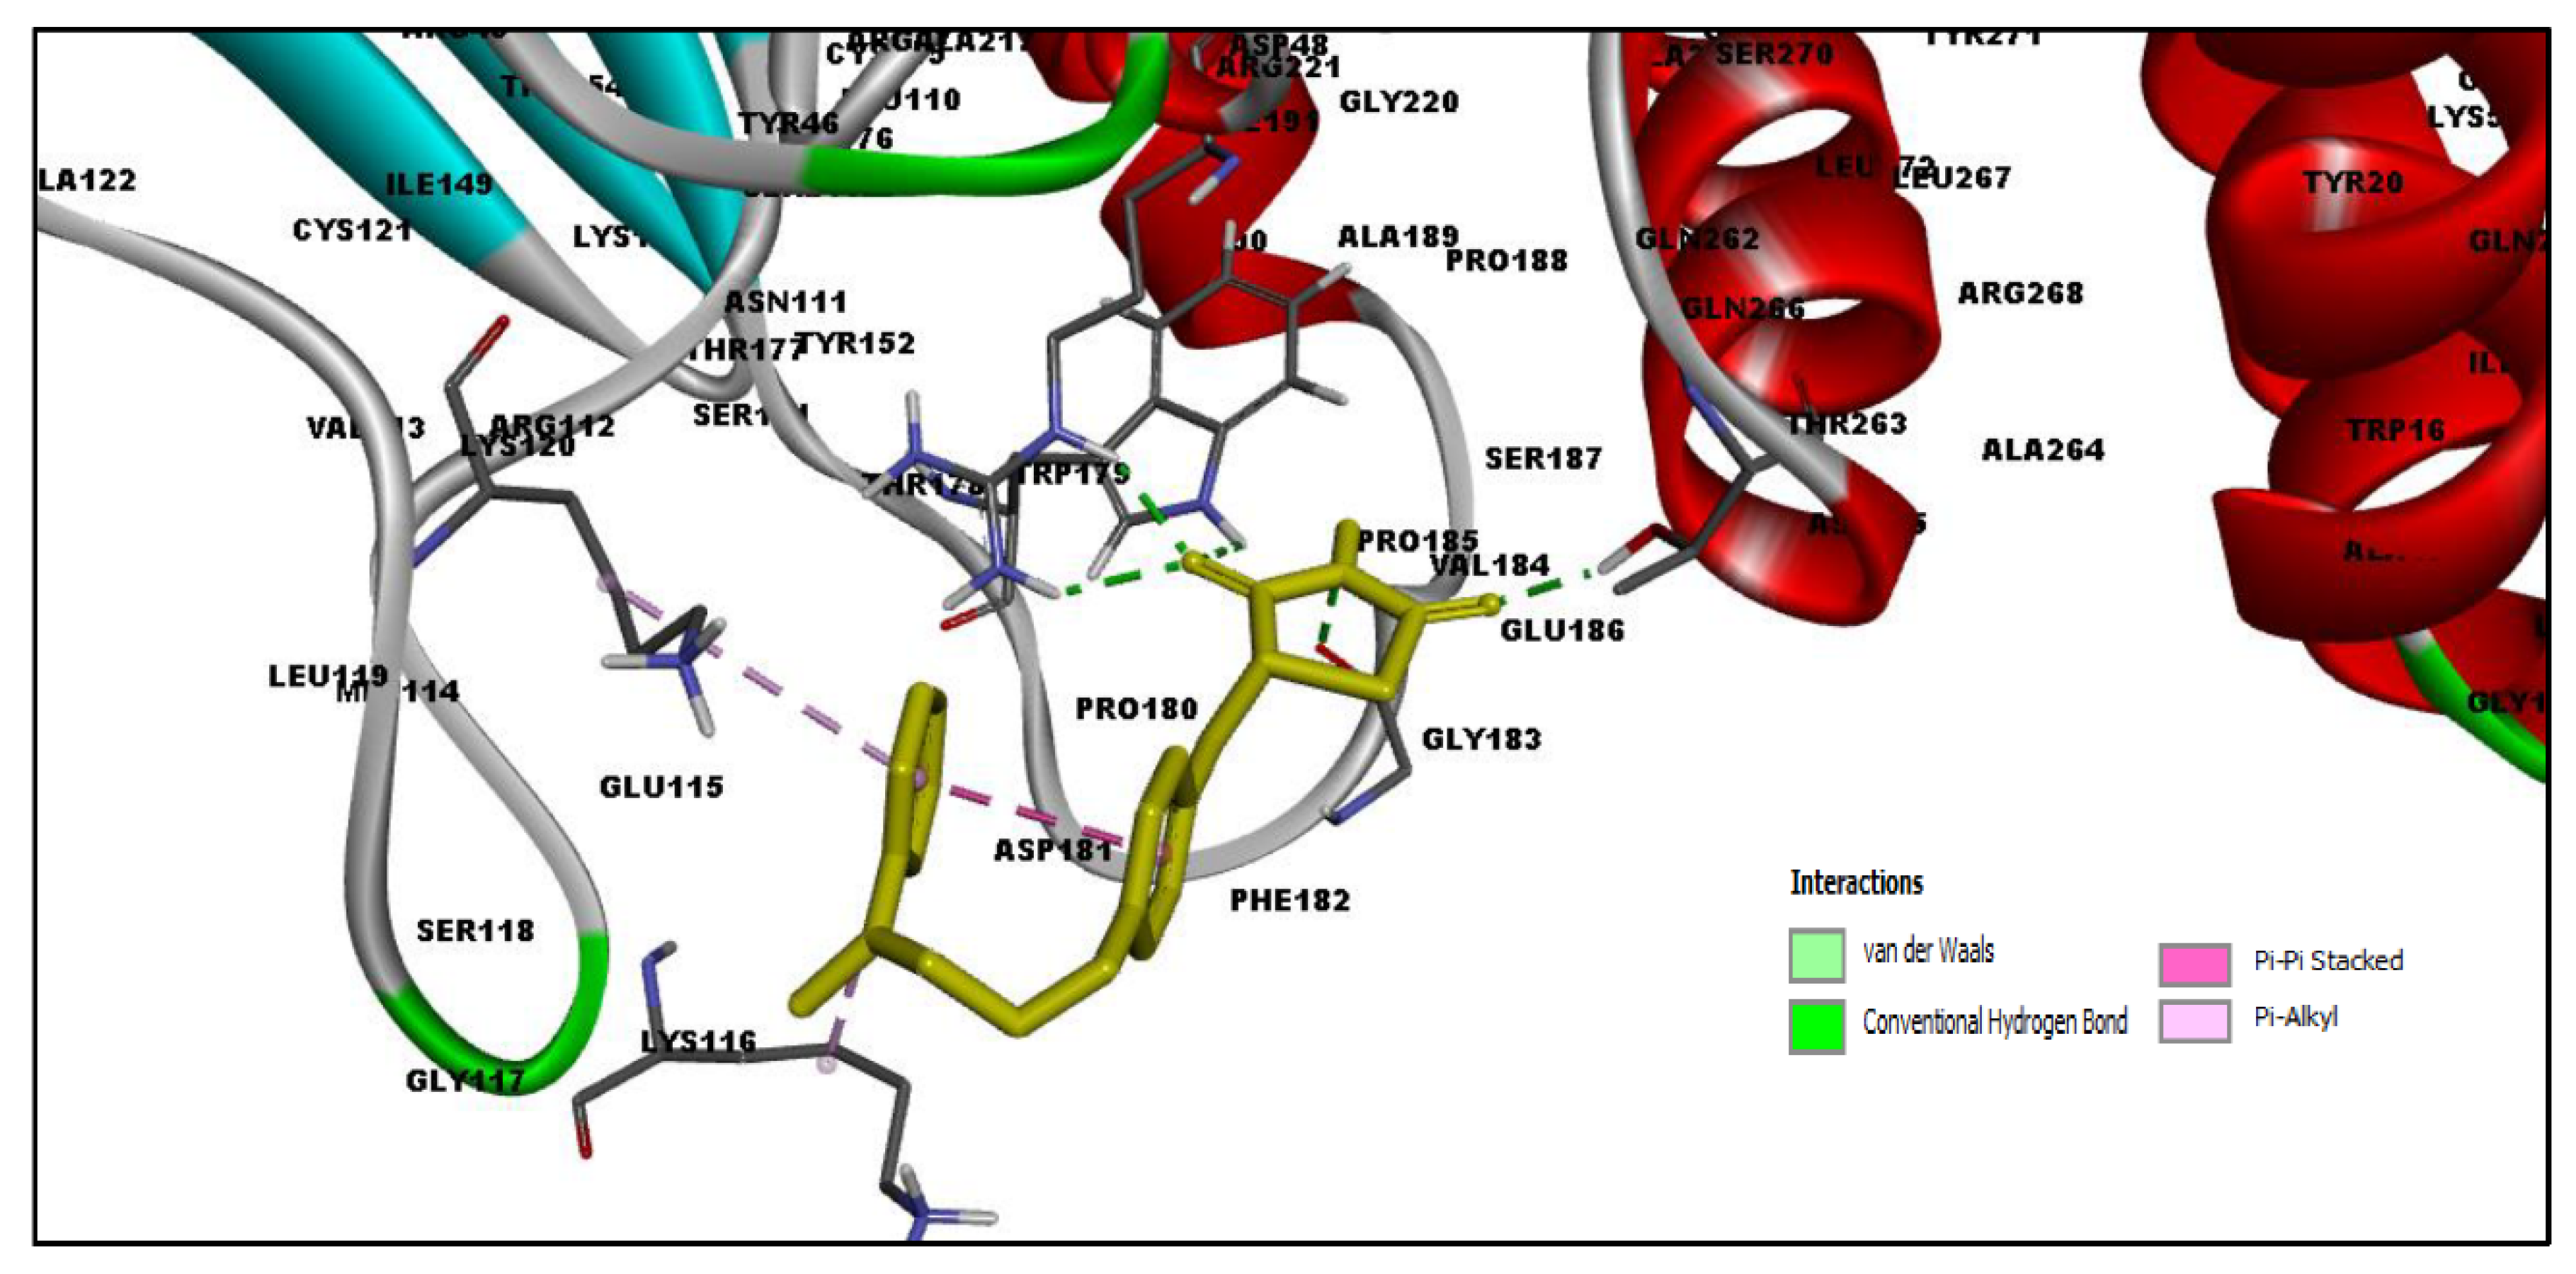
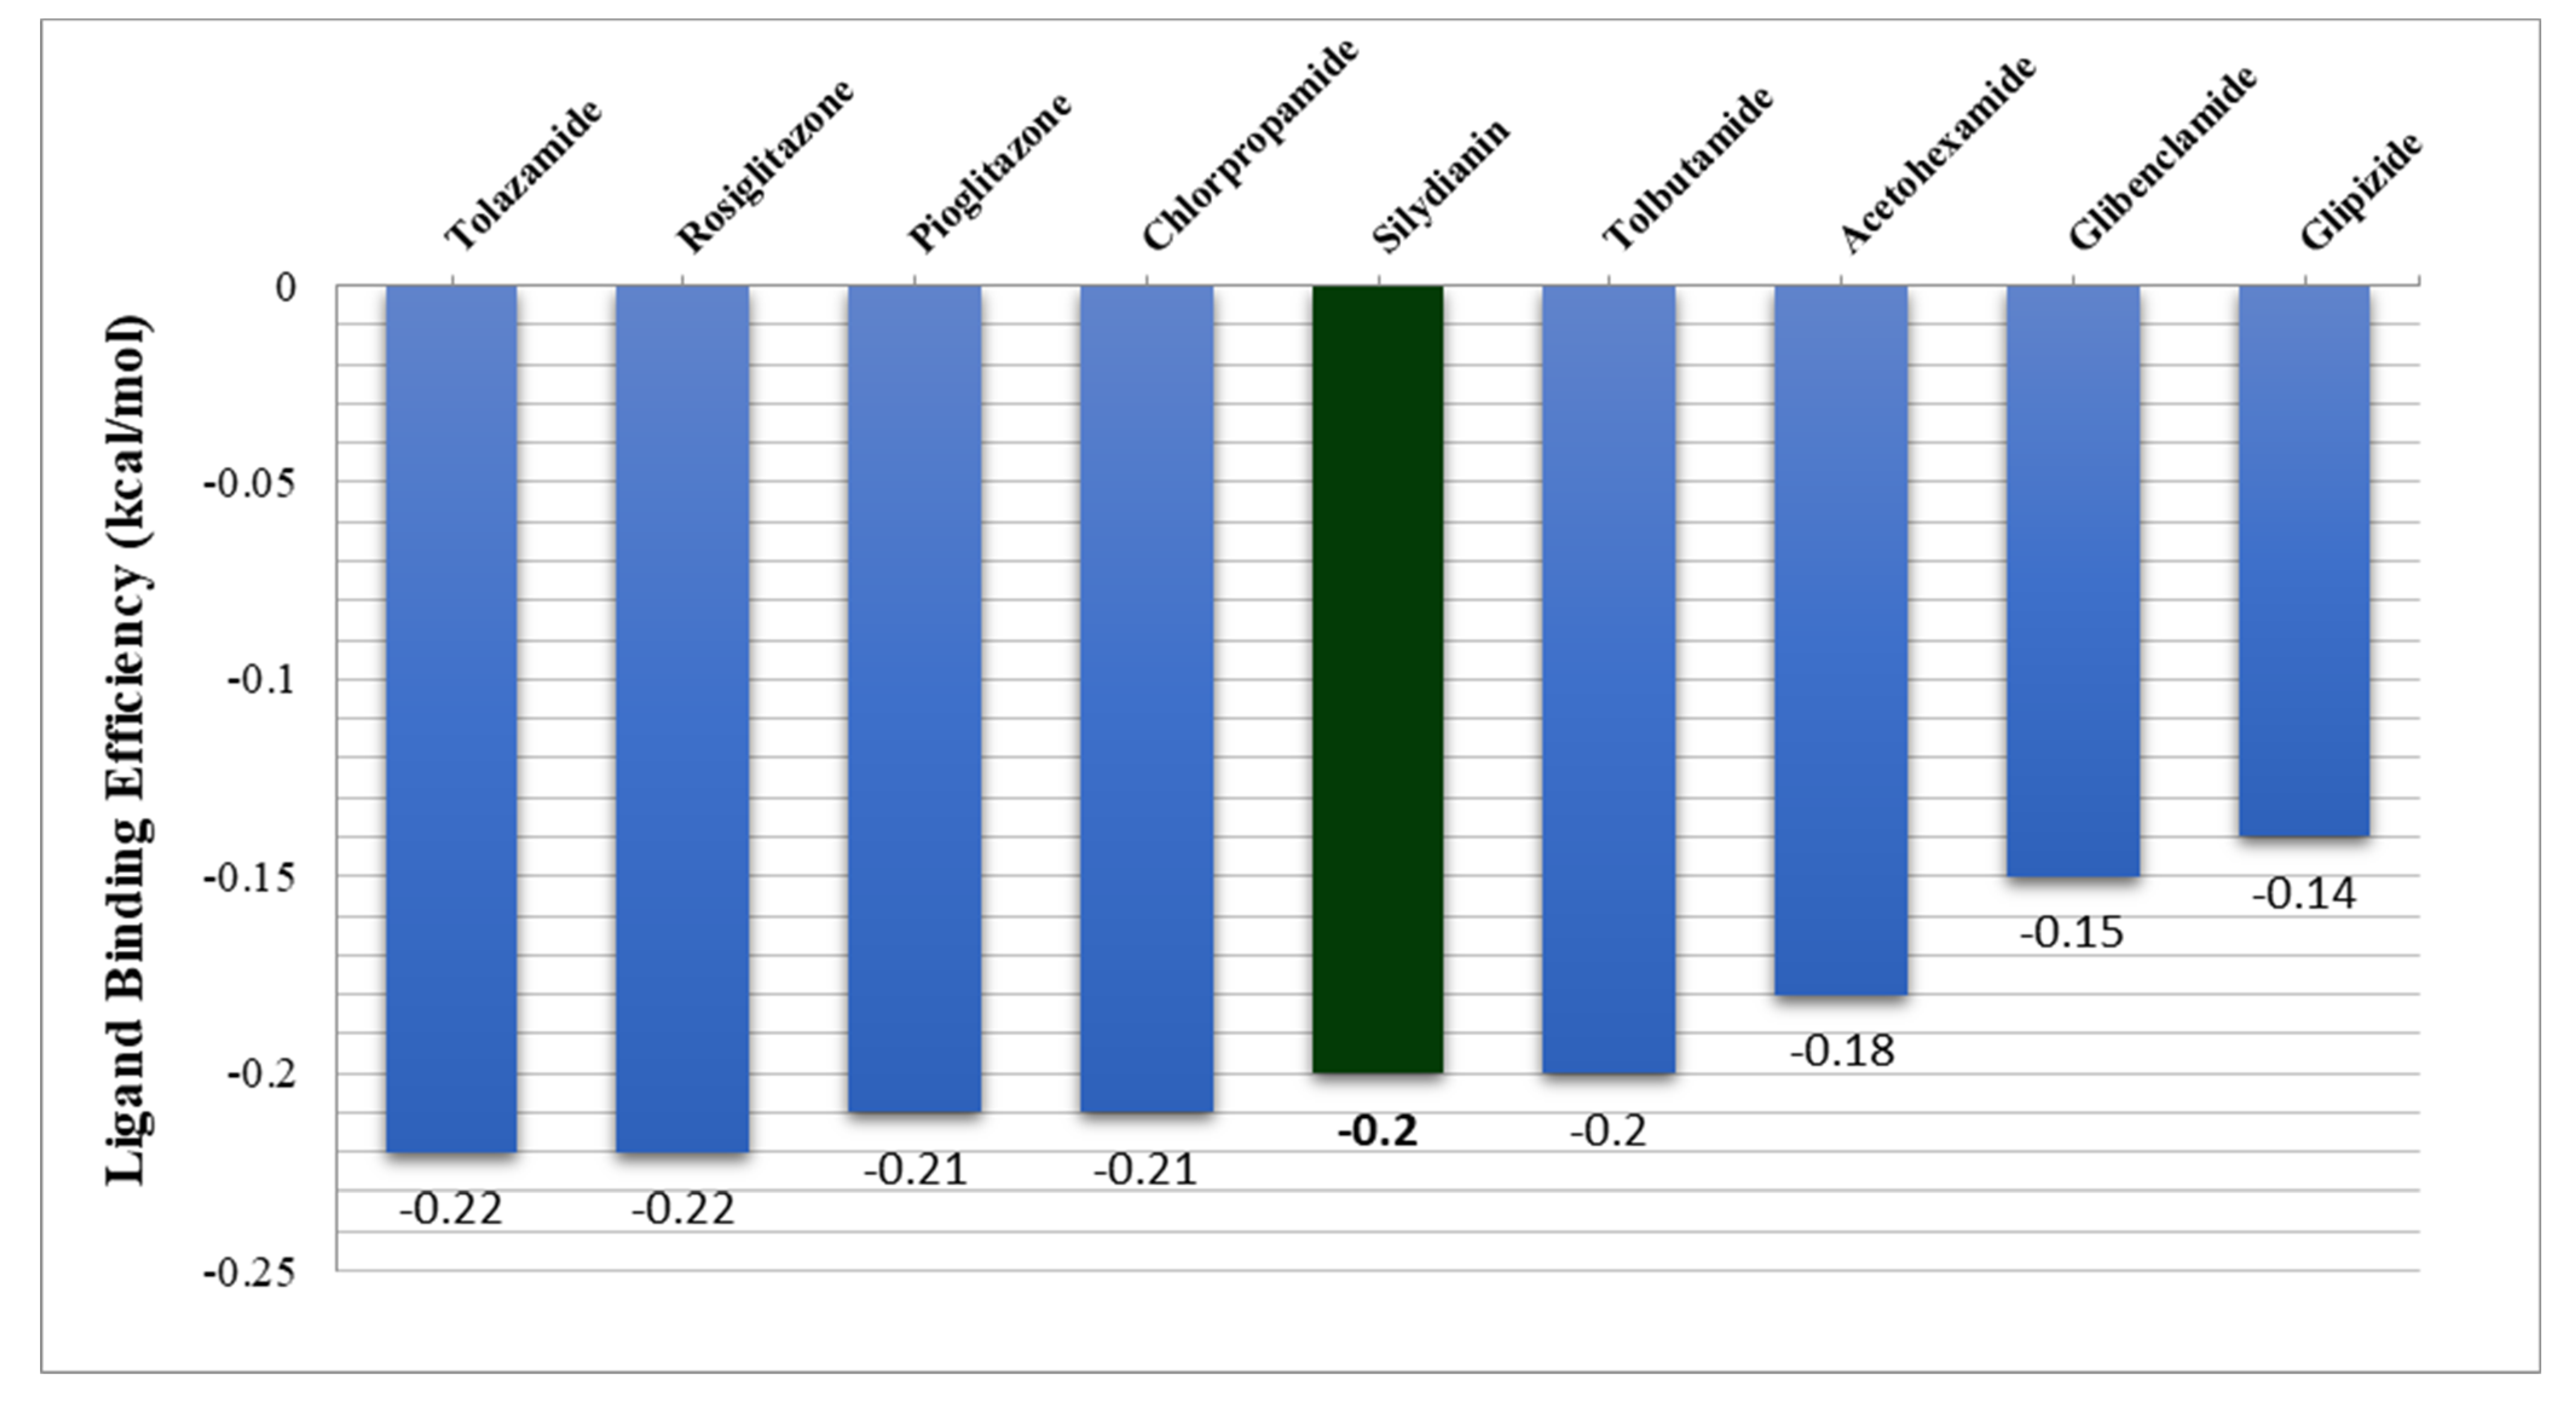
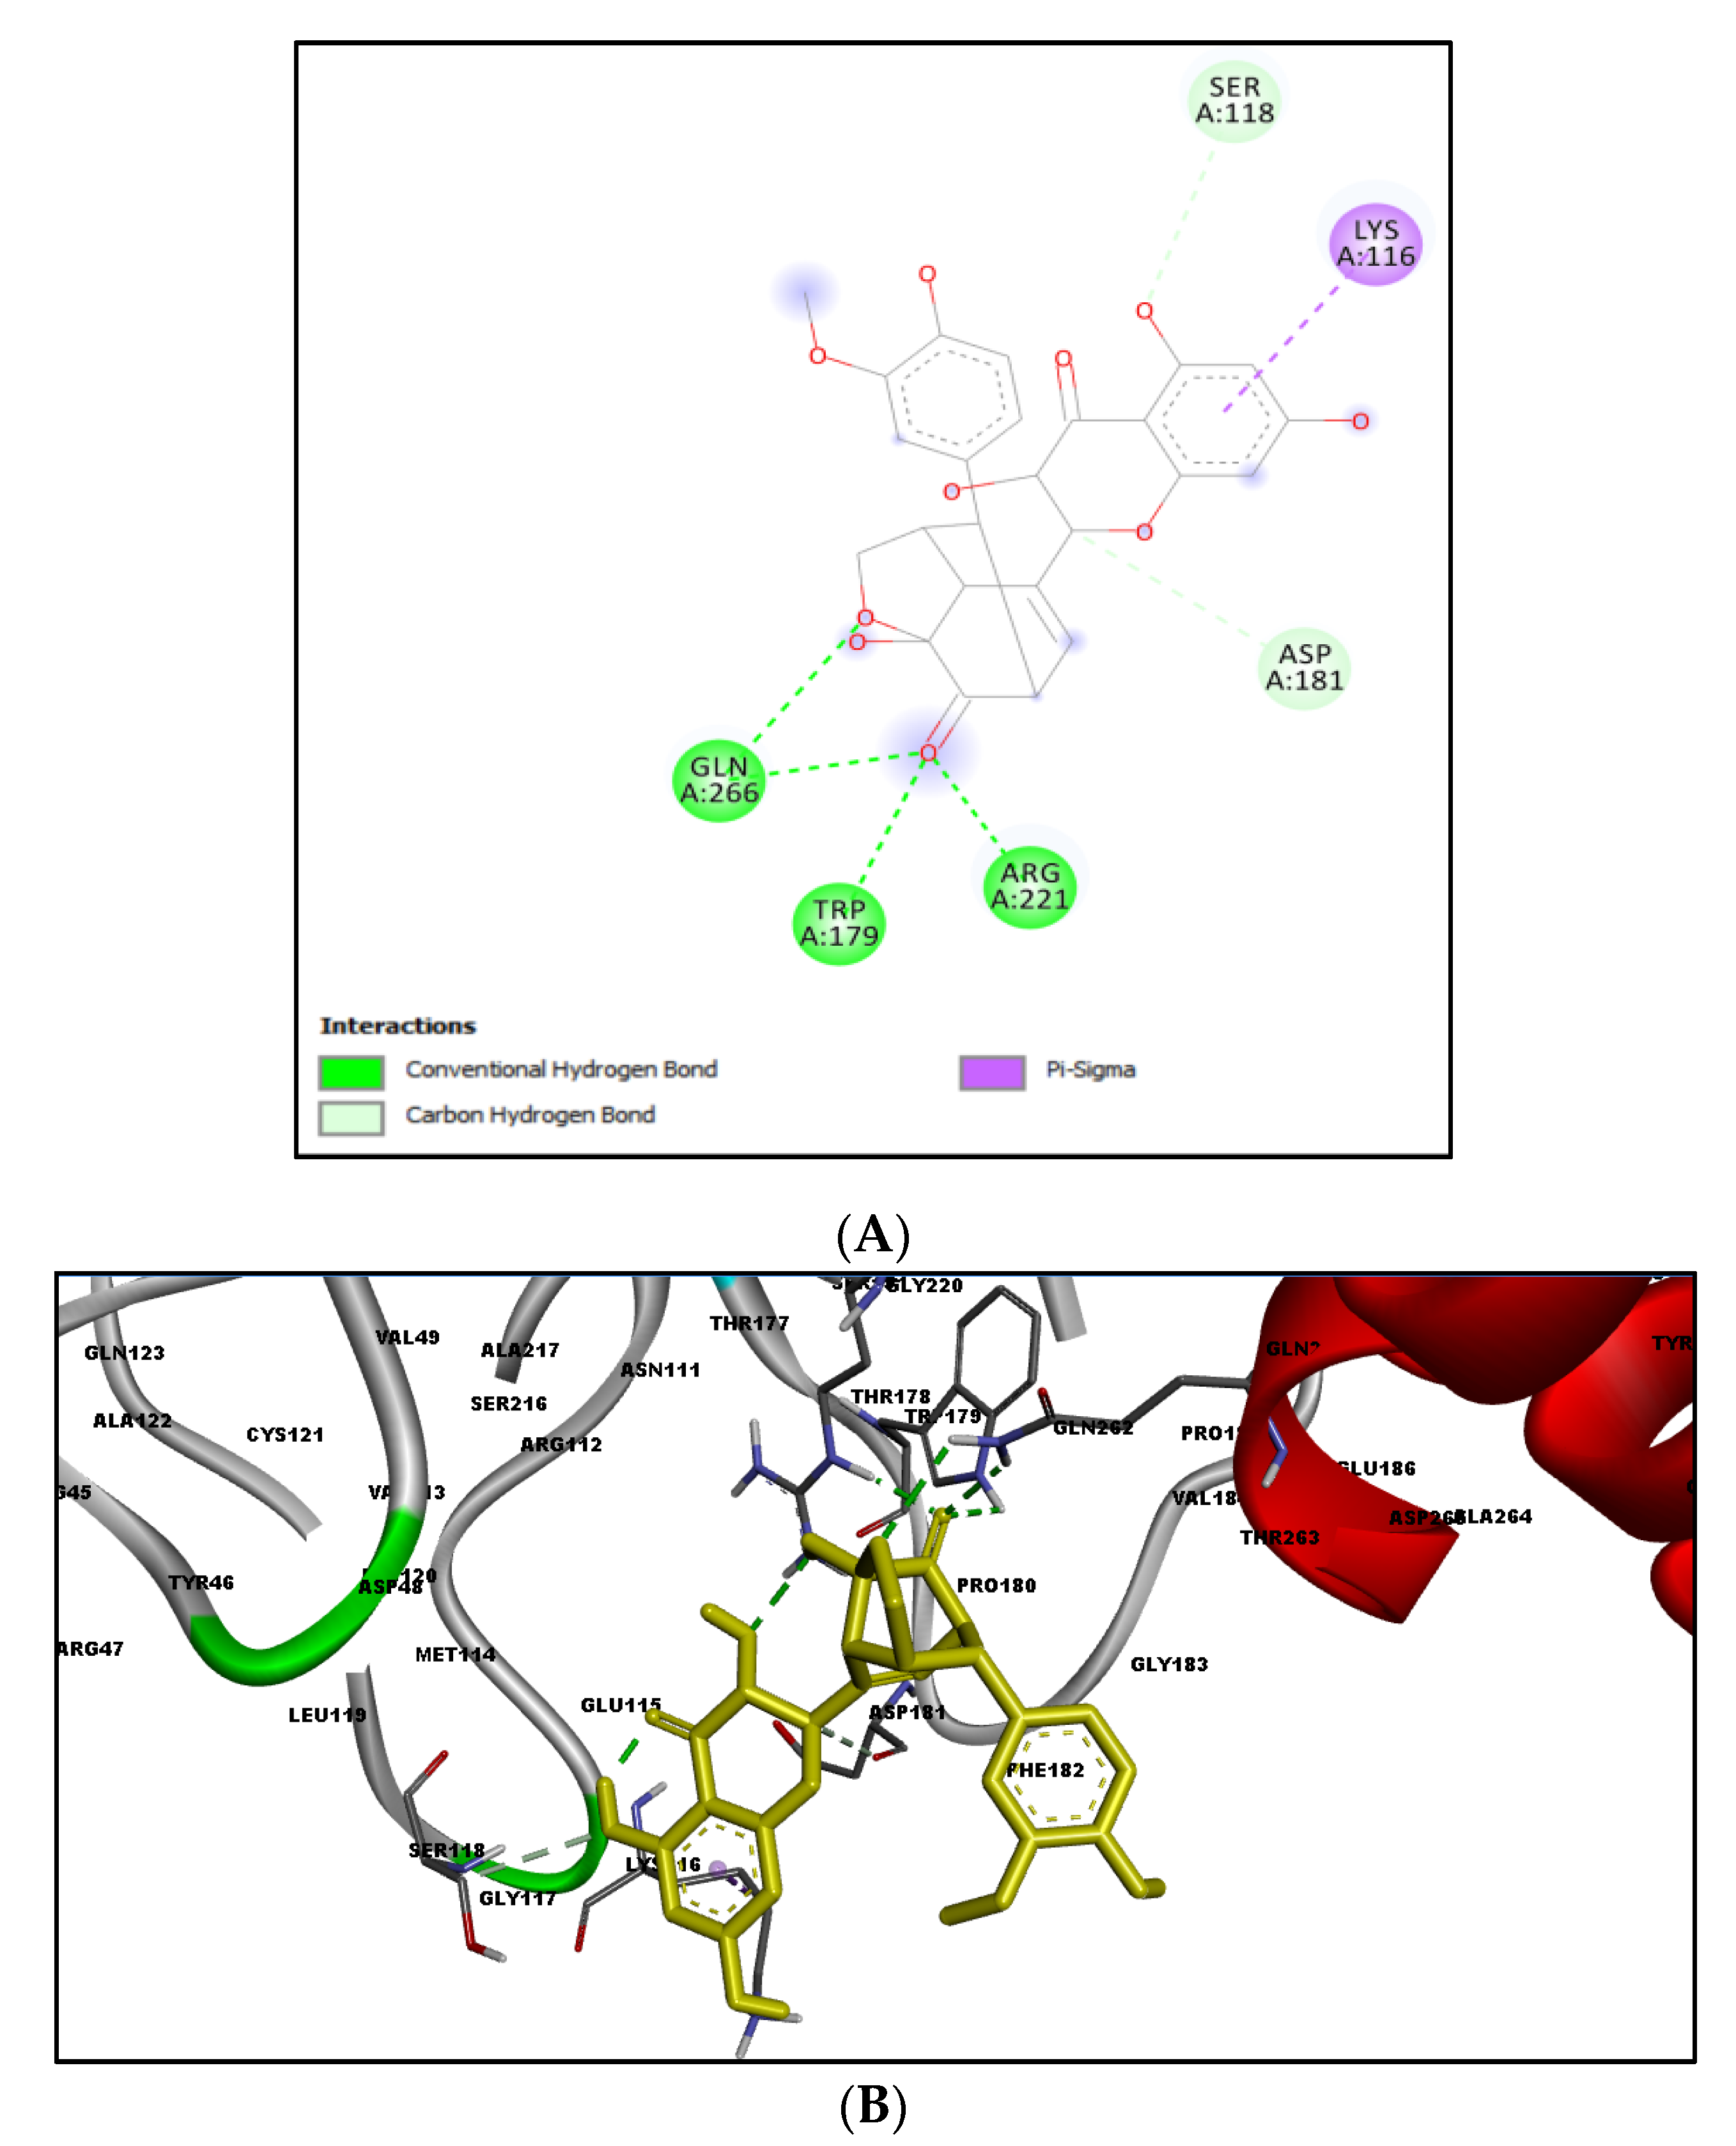
2.3. Docking Results
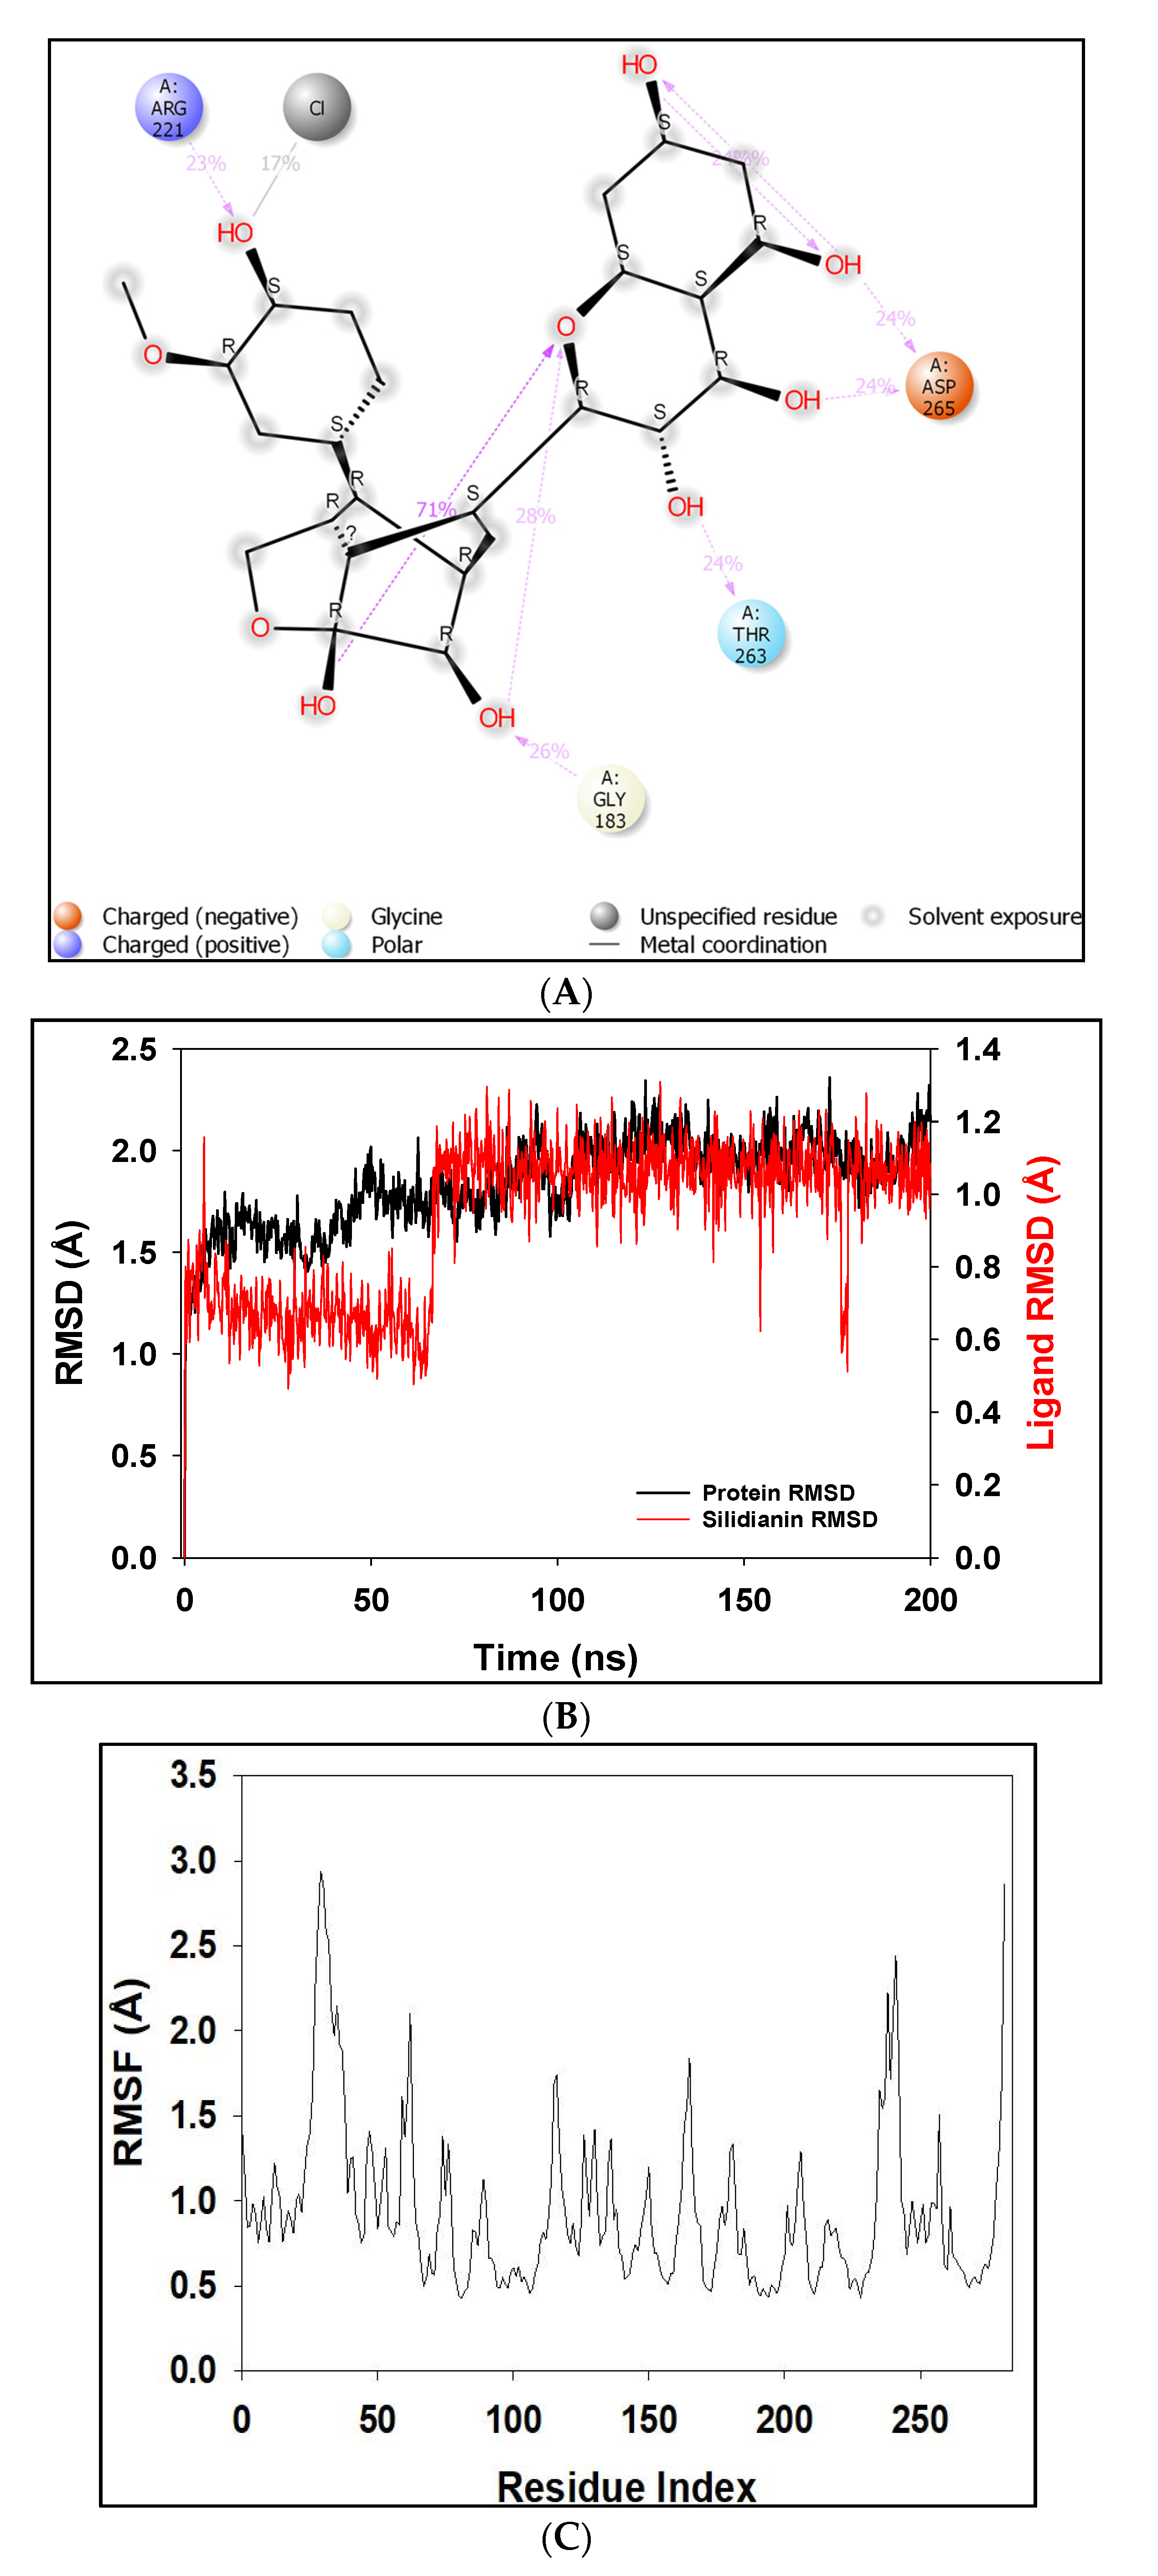
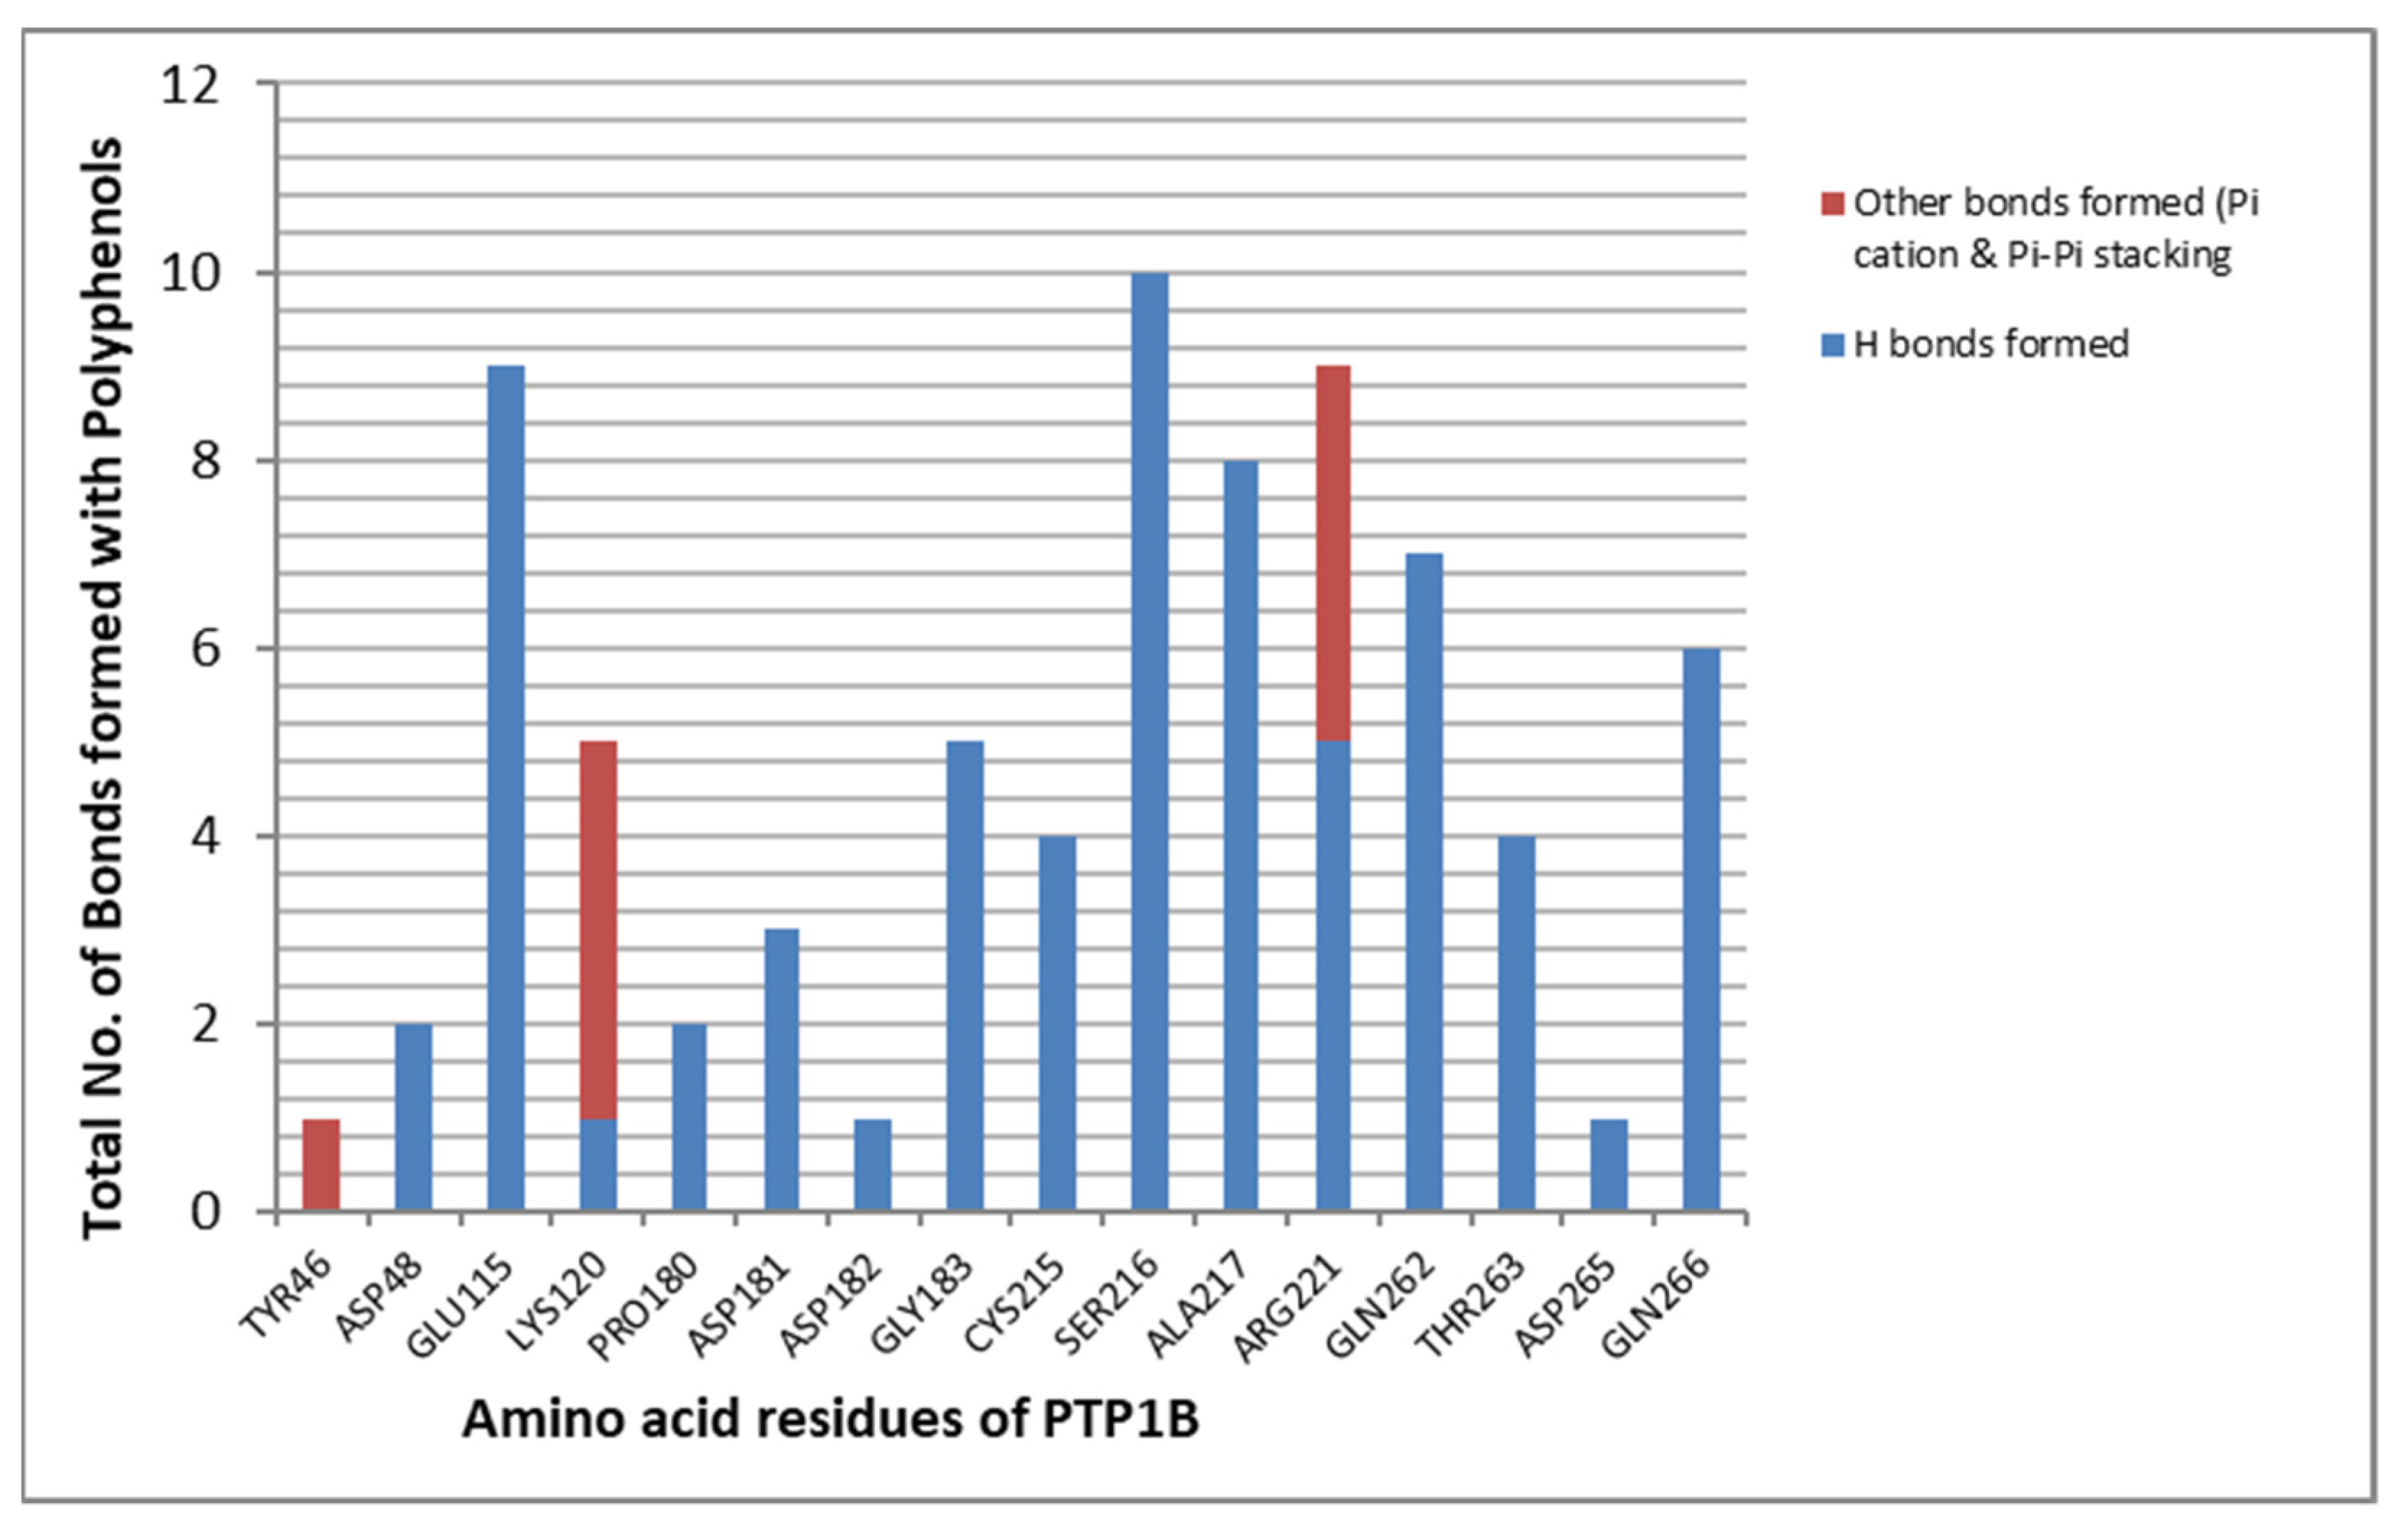
2.4. MD Simulation Results
2.5. Free Energy of Binding Analysis
3. Discussion
4. Materials and Methods
4.1. QSAR Model Analysis
4.2. Database Generation and Ligand Preparation
4.3. Evaluation of Drug-Likeness
4.4. Preparation for Target Protein
4.4.1. Preparation of Receptor PTP1B Protein
4.4.2. Identification of Active Site and Preparation of Grid Box
4.5. Docking Using Schrödinger Suite
4.6. Molecular Dynamics and Simulation of Silydianin and PTP1B Complex
5. Conclusions
Author Contributions
Funding
Institutional Review Board Statement
Informed Consent Statement
Data Availability Statement
Acknowledgments
Conflicts of Interest
Abbreviations
| GLUT-4 | Glucose transport channel 4 |
| HBA | Hydrogen bond acceptor |
| HBD | Hydrogen bond donor |
| IR | Insulin receptors |
| IRS | Insulin receptor substrates |
| PDB | Protein data bank |
| PTP1B | Protein tyrosine phosphatase 1B |
| RMSD | Root mean square deviation |
| T2DM | Type 2 diabetes mellitus |
References
- Koren, S.; Fantus, I.G. Inhibition of the protein tyrosine phosphatase PTP1B: Potential therapy for obesity, insulin resistance and type-2 diabetes mellitus. Best Pract. Res. Clin. Endocrinol. Metab. 2007, 21, 621–640. [Google Scholar] [CrossRef] [PubMed]
- White, M.F.; Kahn, C.R. The insulin signaling system. J. Biol. Chem. 1994, 269, 1–4. [Google Scholar] [CrossRef]
- Johnson, T.O.; Ermolieff, J.; Jirousek, M.R. Protein tyrosine phosphatase 1B inhibitors for diabetes. Nat. Rev. Drug Discov. 2002, 1, 696–709. [Google Scholar] [CrossRef] [PubMed]
- Taniguchi, C.M.; Emanuelli, B.; Kahn, C.R. Critical nodes in signalling pathways: Insights into insulin action. Nat. Rev. Mol. Cell Biol. 2006, 7, 85–96. [Google Scholar] [CrossRef]
- Knighton, D.R.; Zheng, J.; Ten Eyck, L.F.; Xuong, N.H.; Taylor, S.S.; Sowadski, J.M. Structure of a peptide inhibitor bound to the catalytic subunit of cyclic adenosine monophosphate-dependent protein kinase. Science 1991, 253, 414–420. [Google Scholar] [CrossRef] [PubMed]
- Fu, H.; Park, J.; Pei, D. Peptidyl aldehydes as reversible covalent inhibitors of protein tyrosine phosphatases. Biochemistry 2002, 41, 10700–10709. [Google Scholar] [CrossRef] [PubMed]
- Kamerlin, S.C.L.; Rucker, R.; Boresch, S. A targeted molecular dynamics study of WPD loop movement in PTP1B. Biochem. Biophys. Res. Commun. 2006, 345, 1161–1166. [Google Scholar] [CrossRef] [PubMed]
- Jia, Z.; Barford, D.; Flint, A.J.; Tonks, N.K. Structural basis for phosphotyrosine peptide recognition by protein tyrosine phosphatase 1B. Science 1995, 268, 1754–1758. [Google Scholar] [CrossRef]
- Klaman, L.D.; Boss, O.; Peroni, O.D.; Kim, J.K.; Martino, J.L.; Zabolotny, J.M.; Moghal, N.; Lubkin, M.; Kim, Y.-B.; Sharpe, A.H.; et al. Increased Energy Expenditure, Decreased Adiposity, and Tissue-Specific Insulin Sensitivity in Protein-Tyrosine Phosphatase 1B-Deficient Mice. Mol. Cell. Biol. 2000, 20, 5479–5489. [Google Scholar] [CrossRef] [Green Version]
- Elchebly, M.; Payette, P.; Michaliszyn, E.; Cromlish, W.; Collins, S.; Loy, A.L.; Normandin, D.; Cheng, A.; Himms-Hagen, J.; Chan, C.C.; et al. Increased insulin sensitivity and obesity resistance in mice lacking the protein tyrosine phosphatase-1B gene. Science 1999, 283, 1544–1548. [Google Scholar] [CrossRef]
- Jin, T.; Yu, H.; Huang, X.F. Selective binding modes and allosteric inhibitory effects of lupane triterpenes on protein tyrosine phosphatase 1B. Sci. Rep. 2016, 6, 20766. [Google Scholar] [CrossRef] [PubMed] [Green Version]
- Zhang, X.; Jiang, H.; Li, W.; Wang, J.; Cheng, M. Computational Insight into Protein Tyrosine Phosphatase 1B Inhibition: A Case Study of the Combined Ligand- and Structure-Based Approach. Comput. Math. Methods Med. 2017, 2017, 245613. [Google Scholar] [CrossRef] [PubMed]
- Zhang, S.; Zhang, Z.Y. PTP1B as a drug target: Recent developments in PTP1B inhibitor discovery. Drug Discov. Today 2007, 12, 373–381. [Google Scholar] [CrossRef] [PubMed]
- Iversen, L.F.; Møller, K.B.; Pedersen, A.K.; Peters, G.H.; Petersen, A.S.; Andersen, H.S.; Branner, S.; Mortensen, S.B.; Møller, N.P.H. Structure determination of T cell protein-tyrosine phosphatase. J. Biol. Chem. 2002, 277, 19982–19990. [Google Scholar] [CrossRef] [Green Version]
- Barr, A.J. Protein tyrosine phosphatases as drug targets: Strategies and challenges of inhibitor development. Future Med. Chem. 2010, 2, 1563–1576. [Google Scholar] [CrossRef]
- Egawa, K.; Maegawa, H.; Shimizu, S.; Morino, K.; Nishio, Y.; Bryer-Ash, M.; Cheung, A.T.; Kolls, J.K.; Kikkawa, R.; Kashiwagi, A. Protein-tyrosine Phosphatase-1B Negatively Regulates Insulin Signaling in L6 Myocytes and Fao Hepatoma Cells. J. Biol. Chem. 2001, 276, 10207–10211. [Google Scholar] [CrossRef] [Green Version]
- Venable, C.L.; Frevert, E.U.; Kim, Y.B.; Fischer, B.M.; Kamatkar, S.; Neel, B.G.; Kahn, B.B. Overexpression of protein-tyrosine phosphatase-1B in adipocytes inhibits insulin-stimulated phosphoinositide 3-kinase activity without altering glucose transport or Akt/protein kinase B activation. J. Biol. Chem. 2000, 275, 18318–18326. [Google Scholar] [CrossRef] [Green Version]
- Chen, H.; Wertheimer, S.J.; Lin, C.H.; Katz, S.L.; Amrein, K.E.; Burn, P.; Quon, M.J. Protein-tyrosine phosphatases PTP1B and Syp are modulators of insulin- stimulated translocation of GLUT4 in transfected rat adipose cells. J. Biol. Chem. 1997, 272, 8026–8031. [Google Scholar] [CrossRef] [Green Version]
- Zinker, B.A.; Rondinone, C.M.; Trevillyan, J.M.; Gum, R.J.; Clampit, J.E.; Waring, J.F.; Xie, N.; Wilcox, D.; Jacobson, P.; Frost, L.; et al. PTP1B antisense oligonucleotide lowers PTP1B protein, normalizes blood glucose, and improves insulin sensitivity in diabetic mice. Proc. Natl. Acad. Sci. USA 2002, 99, 11357–11362. [Google Scholar] [CrossRef] [Green Version]
- Figueiredo, A.; Leal, E.C.; Carvalho, E. Protein tyrosine phosphatase 1B inhibition as a potential therapeutic target for chronic wounds in diabetes. Pharmacol. Res. 2020, 159, 104977. [Google Scholar] [CrossRef]
- Owen, C.; Lees, E.K.; Grant, L.; Zimmer, D.J.; Mody, N.; Bence, K.K.; Delibegović, M. Inducible liver-specific knockdown of protein tyrosine phosphatase 1B improves glucose and lipid homeostasis in adult mice. Diabetologia 2013, 56, 2286–2296. [Google Scholar] [CrossRef] [PubMed] [Green Version]
- Sun, J.; Qu, C.; Wang, Y.; Huang, H.; Zhang, M.; Li, H.; Zhang, Y.; Wang, Y.; Zou, W. PTP1B, A Potential Target of Type 2 Diabetes Mellitus. Diabetes Mellitus. Mol. Biol. 2016, 5, 174. [Google Scholar] [CrossRef]
- Bhattarai, B.R.; Kafle, B.; Hwang, J.S.; Khadka, D.; Lee, S.M.; Kang, J.S.; Ham, S.W.; Han, I.O.; Park, H.; Cho, H. Thiazolidinedione derivatives as PTP1B inhibitors with antihyperglycemic and antiobesity effects. Bioorganic Med. Chem. Lett. 2009, 19, 6161–6165. [Google Scholar] [CrossRef] [PubMed]
- Liu, Z.; Chai, Q.; Li, Y.Y.; Shen, Q.; Ma, L.P.; Zhang, L.N.; Wang, X.; Sheng, L.; Li, J.Y.; Li, J.; et al. Discovery of novel PTP1B inhibitors with antihyperglycemic activity. Acta Pharmacol. Sin. 2010, 31, 1005–1012. [Google Scholar] [CrossRef] [PubMed] [Green Version]
- Henry, S.P.; Johnson, M.; Zanardi, T.A.; Fey, R.; Auyeung, D.; Lappin, P.B.; Levin, A.A. Renal uptake and tolerability of a 2’-O-methoxyethyl modified antisense oligonucleotide (ISIS 113715) in monkey. Toxicology 2012, 301, 13–20. [Google Scholar] [CrossRef]
- Combs, A.P. Recent advances in the discovery of competitive protein tyrosine phosphatase 1B inhibitors for the treatment of diabetes, obesity, and cancer. J. Med. Chem. 2010, 53, 2333–2344. [Google Scholar] [CrossRef] [PubMed]
- Wang, L.J.; Jiang, B.; Wu, N.; Wang, S.Y.; Shi, D.Y. Natural and semisynthetic protein tyrosine phosphatase 1B (PTP1B) inhibitors as anti-diabetic agents. RSC Adv. 2015, 5, 48822–48834. [Google Scholar] [CrossRef]
- Wiese, J.; Aldemir, H.; Schmaljohann, R.; Gulder, T.A.M.; Imhoff, J.F.; Kerr, R. Asperentin B, a new inhibitor of the protein tyrosine phosphatase 1B. Mar. Drugs 2017, 15, 191. [Google Scholar] [CrossRef]
- Sun, W.; Zhang, B.; Li, X.; Dong, Y.; Xiu, Z.; Zheng, H.; Lu, X.; Zheng, Z.; Zhuang, C.; Quan, C. Trivaric acid, a new inhibitor of PTP1b with potent beneficial effect on diabetes. Life Sci. 2017, 169, 52–64. [Google Scholar] [CrossRef]
- Ramírez-Espinosa, J.J.; Rios, M.Y.; López-Martínez, S.; López-Vallejo, F.; Medina-Franco, J.L.; Paoli, P.; Camici, G.; Navarrete-Vázquez, G.; Ortiz-Andrade, R.; Estrada-Soto, S. Antidiabetic activity of some pentacyclic acid triterpenoids, role of PTP-1B: In vitro, in silico, and in vivo approaches. Eur. J. Med. Chem. 2011, 46, 2243–2251. [Google Scholar] [CrossRef]
- Sánchez-Quesada, C.; López-Biedma, A.; Warleta, F.; Campos, M.; Beltrán, G.; Gaforio, J.J. Bioactive properties of the main triterpenes found in olives, virgin olive oil, and leaves of Olea europaea. J. Agric. Food Chem. 2013, 61, 12173–12182. [Google Scholar] [CrossRef] [PubMed]
- Choi, Y.H.; Zhou, W.; Oh, J.; Choe, S.; Kim, D.W.; Lee, S.H.; Na, M. Rhododendric acid A, a new ursane-type PTP1B inhibitor from the endangered plant Rhododendron brachycarpum G. Don. Bioorg. Med. Chem. Lett. 2012, 22, 6116–6119. [Google Scholar] [CrossRef] [PubMed]
- Qin, N.; Sasaki, T.; Li, W.; Wang, J.; Zhang, X.; Li, D.; Li, Z.; Cheng, M.; Hua, H.; Koike, K. Identification of flavonolignans from Silybum marianum seeds as allosteric protein tyrosine phosphatase 1B inhibitors. J. Enzyme Inhib. Med. Chem. 2018, 33, 1283–1291. [Google Scholar] [CrossRef] [PubMed] [Green Version]
- Ahmed Laskar, M.; Dutta Choudhury, M. Resveratrol A Potent Angiotensin Converting Enzyme Inhibitor: A Computational Study in Relevance to Cardioprotective Activity. Res. J. Pharm. Biol. Chem. Sci. 2014, 5, 1109–1115. [Google Scholar]
- Lipinski, C.A. Lead- and drug-like compounds: The rule-of-five revolution. Drug Discov. Today Technol. 2004, 1, 337–341. [Google Scholar] [CrossRef]
- Goodwin, R.J.A.; Bunch, J.; McGinnity, D.F. Mass Spectrometry Imaging in Oncology Drug Discovery. Adv. Cancer Res. 2017, 134, 133–171. [Google Scholar]
- Lipinski Rule of Five. Available online: http://www.scfbio-iitd.res.in/software/drugdesign/lipinski.jsp (accessed on 15 February 2020).
- Gu, S.; Smith, M.S.; Yang, Y.; Irwin, J.J.; Shoichet, B.K. Ligand Strain Energy in Large Library Docking. bioRxiv 2021, 61, 4331–4341. [Google Scholar] [CrossRef] [PubMed]
- Sriramulu, D.K.; Wu, S.; Lee, S.G. Effect of ligand torsion number on the AutoDock mediated prediction of protein-ligand binding affinity. J. Ind. Eng. Chem. 2020, 83, 359–365. [Google Scholar] [CrossRef]
- Jiménez, J.; Škalič, M.; Martínez-Rosell, G.; Fabritiis, G. De KDEEP: Protein–Ligand Absolute Binding Affinity Prediction via 3D-Convolutional Neural Networks. J. Chem. Inf. Model. 2018, 58, 287–296. [Google Scholar] [CrossRef]
- Luan, F.; Xu, X.; Liu, H.T.; Cordeiro, M.N.D.S.; Zhang, X.Y. QSAR Studies of PTP1B Inhibitors: Recent Advances and Perspectives. Curr. Med. Chem. 2012, 19, 4208–4217. [Google Scholar] [CrossRef]
- Zargari, F.; Lotfi, M.; Shahraki, O.; Nikfarjam, Z.; Shahraki, J. Flavonoids as potent allosteric inhibitors of protein tyrosine phosphatase 1B: Molecular dynamics simulation and free energy calculation. J. Biomol. Struct. Dyn. 2017, 36, 4126–4142. [Google Scholar] [CrossRef]
- Tsao, R. Chemistry and biochemistry of dietary polyphenols. Nutrients 2010, 2, 1231–1246. [Google Scholar] [CrossRef] [PubMed]
- Brglez Mojzer, E.; Knez Hrnčič, M.; Škerget, M.; Knez, Ž.; Bren, U. Polyphenols: Extraction Methods, Antioxidative Action, Bioavailability and Anticarcinogenic Effects. Molecules 2016, 21, 901. [Google Scholar] [CrossRef] [PubMed]
- Kumar, N.; Goel, N. Phenolic acids: Natural versatile molecules with promising therapeutic applications. Biotechnol. Reports 2019, 24, e00370. [Google Scholar] [CrossRef]
- Proença, C.; Freitas, M.; Ribeiro, D.; Sousa, J.L.C.; Carvalho, F.; Silva, A.M.S.; Fernandes, P.A.; Fernandes, E. Inhibition of protein tyrosine phosphatase 1B by flavonoids: A structure - activity relationship study. Food Chem. Toxicol. 2018, 111, 474–481. [Google Scholar] [CrossRef] [PubMed]
- Zhao, B.T.; Nguyen, D.H.; Le, D.D.; Choi, J.S.; Min, B.S.; Woo, M.H. Protein tyrosine phosphatase 1B inhibitors from natural sources. Arch. Pharm. Res. 2018, 41, 130–161. [Google Scholar] [CrossRef] [PubMed]
- Chen, R.M.; Hu, L.H.; An, T.Y.; Li, J.; Shen, Q. Natural PTP1B inhibitors from Broussonetia papyrifera. Bioorganic Med. Chem. Lett. 2002, 12, 3387–3390. [Google Scholar] [CrossRef]
- Ji, S.; Li, Z.; Song, W.; Wang, Y.; Liang, W.; Li, K.; Tang, S.; Wang, Q.; Qiao, X.; Zhou, D.; et al. Bioactive Constituents of Glycyrrhiza uralensis (Licorice): Discovery of the Effective Components of a Traditional Herbal Medicine. J. Nat. Prod. 2016, 79, 281–292. [Google Scholar] [CrossRef]
- Corchete, P. Silybum marianum (L.) Gaertn: The Source of Silymarin. In Bioactive Molecules and Medicinal Plants; Springer: Berlin/Heidelberg, Germany, 2008; pp. 123–148. [Google Scholar]
- Dvořák, Z.; Kosina, P.; Walterová, D.; Šimánek, V.; Bachleda, P.; Ulrichová, J. Primary cultures of human hepatocytes as a tool in cytotoxicity studies: Cell protection against model toxins by flavonolignans obtained from Silybum marianum. Toxicol. Lett. 2003, 137, 201–212. [Google Scholar] [CrossRef]
- Sherikar, A.; Siddique, M.U.M.; More, M.; Goyal, S.N.; Milivojevic, M.; Alkahtani, S.; Alarifi, S.; Hasnain, M.S.; Nayak, A.K. Preparation and Evaluation of Silymarin-Loaded Solid Eutectic for Enhanced Anti-Inflammatory, Hepatoprotective Effect: In Vitro: In Vivo Prospect. Oxid. Med. Cell. Longev. 2021, 2021, 1818538. [Google Scholar] [CrossRef]
- Soleimani, V.; Delghandi, P.S.; Moallem, S.A.; Karimi, G. Safety and toxicity of silymarin, the major constituent of milk thistle extract: An updated review. Phytother. Res. 2019, 33, 1627–1638. [Google Scholar] [CrossRef]
- Gwaltney-Brant, S.M. Nutraceuticals in Hepatic and Pancreatic Diseases. Nutraceuticals Vet. Med. 2019, 29, 437–446. [Google Scholar] [CrossRef]
- Ala, P.J.; Gonneville, L.; Hillman, M.C.; Becker-Pasha, M.; Wei, M.; Reid, B.G.; Klabe, R.; Yue, E.W.; Wayland, B.; Douty, B.; et al. Structural Basis for Inhibition of Protein-tyrosine Phosphatase 1B by Isothiazolidinone Heterocyclic Phosphonate Mimetics. J. Biol. Chem. 2006, 281, 32784–32795. [Google Scholar] [CrossRef] [Green Version]
- Bellomo, E.; Birla Singh, K.; Massarotti, A.; Hogstrand, C.; Maret, W. The metal face of protein tyrosine phosphatase 1B. Coord. Chem. Rev. 2016, 327–328, 70–83. [Google Scholar] [CrossRef] [PubMed] [Green Version]
- Verma, S.K.; Thareja, S. Molecular docking assisted 3D-QSAR study of benzylidene-2,4-thiazolidinedione derivatives as PTP-1B inhibitors for the management of Type-2 diabetes mellitus. RSC Adv. 2016, 6, 33857–33867. [Google Scholar] [CrossRef]
- Zhang, X.; Tian, J.; Li, J.; Huang, L.; Wu, S.; Liang, W.; Zhong, L.; Ye, J.; Ye, F. A novel protein tyrosine phosphatase 1B inhibitor with therapeutic potential for insulin resistance. Br. J. Pharmacol. 2016, 173, 1939–1949. [Google Scholar] [CrossRef] [PubMed] [Green Version]
- Deshpande, T.A.; Isshak, M.; Priefer, R. PTP1B Inhibitors as Potential Target for Type II Diabetes. Curr. Res. Diabetes Obes. J. 2020, 14, 555876. [Google Scholar] [CrossRef]
- Guo, X.; Shen, K.; Wang, F.; Lawrence, D.; Zhang, Z. Probing the molecular basis for potent and selective protein-tyrosine phosphatase 1B inhibition. J. Biol. Chem. 2002, 277, 41014–41022. [Google Scholar] [CrossRef] [Green Version]
- Punthasee, P.; Laciak, A.R.; Cummings, A.H.; Ruddraraju, K.V.; Lewis, S.M.; Hillebrand, R.; Singh, H.; Tanner, J.J.; Gates, K.S. Covalent Allosteric Inactivation of Protein Tyrosine Phosphatase 1B (PTP1B) by an Inhibitor–Electrophile Conjugate. Biochemistry 2017, 56, 2051–2060. [Google Scholar] [CrossRef]
- Wilson, D.P.; Wan, Z.-K.; Xu, W.-X.; Kirincich, S.J.; Follows, B.C.; Joseph-McCarthy, D.; Foreman, K.; Moretto, A.; Wu, J.; Zhu, M.; et al. Structure-Based Optimization of Protein Tyrosine Phosphatase 1B Inhibitors: From the Active Site to the Second Phosphotyrosine Binding Site. J. Med. Chem. 2007, 50, 4681–4698. [Google Scholar] [CrossRef]
- Reddy, M.; Ghadiyaram, C.; Panigrahi, S.; Krishnamurthy, N.; Hosahalli, S.; Chandrasekharappa, A.; Manna, D.; Badiger, S.; Dubey, P.; Mangamoori, L. X-ray structure of PTP1B in complex with a new PTP1B inhibitor. Protein Pept. Lett. 2014, 21, 90–93. [Google Scholar] [CrossRef]
- Shen, K.; Keng, Y.F.; Wu, L.; Guo, X.L.; Lawrence, D.S.; Zhang, Z.Y. Acquisition of a Specific and Potent PTP1B Inhibitor from a Novel Combinatorial Library and Screening Procedure. J. Biol. Chem. 2001, 276, 47311–47319. [Google Scholar] [CrossRef] [PubMed] [Green Version]
- Barford, D.; Flint, A.J.; Tonks, N.K. Crystal structure of human protein tyrosine phosphatase 1B. Science 1994, 263, 1397–1404. [Google Scholar] [CrossRef] [PubMed]
- Bhusan, K.K. QSAR for Beginners (Free Software for Drug Designing and QSAR): EasyQSAR: A Beginners Tool for QSAR in Drug Designing (Free Software for Drug Designing and QSAR). 2009. Available online: http://easyqsar.blogspot.com/2009/09/easyqsar-beginners-tool-for-qsar-in.html (accessed on 5 May 2020).
- Uddin, Z.; Song, Y.H.; Ulla, M.; Li, Z.; Kim, J.Y.; Park, K.H. Isolation and characterization of protein tyrosine phosphatase 1B (PTP1B) inhibitory polyphenolic compounds from Dodonaea viscosa and their kinetic analysis. Front. Chem. 2018, 6, 40. [Google Scholar] [CrossRef]
- Choi, J.S.; Islam, M.N.; Ali, M.Y.; Kim, Y.M.; Park, H.J.; Sohn, H.S.; Jung, H.A. The effects of C-glycosylation of luteolin on its antioxidant, anti-Alzheimer’s disease, anti-diabetic, and anti-inflammatory activities. Arch. Pharm. Res. 2014, 37, 1354–1363. [Google Scholar] [CrossRef] [PubMed]
- Moon, H.E.; Islam, M.N.; Ahn, B.R.; Chowdhury, S.S.; Sohn, H.S.; Jung, H.A.; Choi, J.S. Protein Tyrosine Phosphatase 1B and-Glucosidase Inhibitory Phlorotannins from Edible Brown Algae, Ecklonia stolonifera and Eisenia bicyclis. Biosci. Biotechnol. Biochem. 2011, 75, 1472–1480. [Google Scholar] [CrossRef] [PubMed] [Green Version]
- Numonov, S.; Edirs, S.; Bobakulov, K.; Qureshi, M.N.; Bozorov, K.; Sharopov, F.; Setzer, W.N.; Zhao, H.; Habasi, M.; Sharofova, M.; et al. Evaluation of the Antidiabetic Activity and Chemical Composition of Geranium collinum Root Extracts—Computational and Experimental Investigations. Molecules 2017, 22, 983. [Google Scholar] [CrossRef] [PubMed]
- Sawant, L.; Singh, V.K.; Dethe, S.; Balachandran, A.B.; Mundkinajeddu, D.; Agarwal, A. Aldose reductase and protein tyrosine phosphatase 1B inhibitory active compounds from Syzygium cumini seeds. Pharm. Biol. 2014, 53, 1176–1182. [Google Scholar] [CrossRef] [Green Version]
- Yousof Ali, M.; Jannat, S.; Mizanur Rahman, M. Investigation of C-glycosylated apigenin and luteolin derivatives’ effects on protein tyrosine phosphatase 1B inhibition with molecular and cellular approaches. Comput. Toxicol. 2021, 17, 100141. [Google Scholar] [CrossRef]
- Jang, J.P.; Na, M.K.; Thuong, P.T.; Njamen, D.; Mbafor, J.T.; Fomum, Z.T.; Woo, E.R.; Oh, W.K. Prenylated flavonoids with PTP1B inhibitory activity from the root bark of Erythrina mildbraedii. Chem. Pharm. Bull. 2008, 56, 85–88. [Google Scholar] [CrossRef] [Green Version]
- Seo, C.; Yim, J.H.; Lee, H.K.; Oh, H. PTP1B inhibitory secondary metabolites from the Antarctic lichen Lecidella carpathica. Mycology 2011, 2, 18–23. Available online: http://mc.manuscriptcentral.com/tmyc (accessed on 10 March 2022). [CrossRef]
- Song, Y.H.; Uddin, Z.; Jin, Y.M.; Li, Z.; Curtis-Long, M.J.; Kim, K.D.; Cho, J.K.; Park, K.H. Inhibition of protein tyrosine phosphatase (PTP1B) and α-glucosidase by geranylated flavonoids from Paulownia tomentosa. J. Enzyme Inhib. Med. Chem. 2017, 32, 1195. [Google Scholar] [CrossRef] [Green Version]
- Zhang, L.B.; Lei, C.; Gao, L.X.; Li, J.Y.; Li, J.; Hou, A.J. Isoprenylated Flavonoids with PTP1B Inhibition from Macaranga denticulata. Nat. Products Bioprospect. 2016, 6, 25–30. [Google Scholar] [CrossRef] [Green Version]
- To, D.C.; Hoang, D.T.; Tran, M.H.; Pham, M.Q.; Huynh, N.T.; Nguyen, P.H. PTP1B Inhibitory Flavonoids From Orthosiphon stamineus Benth. and Their Growth Inhibition on Human Breast Cancer Cells. Nat. Prod. Commun. 2020, 15, 1–9. [Google Scholar] [CrossRef]
- Perez-Gutierrez, R.M. Inhibition of Protein Tyrosine Phosphatase 1B by Lutein Derivatives isolated from Mexican Oregano (Lippia graveolens). Phytothérapie 2019, 17, 134–139. [Google Scholar] [CrossRef]
- Silydianin. Phosphatase Inhibitor. MedChemExpress. Available online: https://www.medchemexpress.com/silydianin.html (accessed on 2 March 2022).
- Ranjan, A.; Ghosh, S.; Chauhan, A.; Jindal, T. Molecular docking and site directed mutagenic approach to investigate the role of Trp86 of human acetylcholinesterase with organophosphates. Int. J. Pharm. Sci. Res. 2016, 7, 3802. [Google Scholar]
- Drug Likeness Tool (DruLiTo) Drug Likeness Tool (DruLiTo) Tutorial. Available online: http://www.niper.gov.in/pi_dev_tools/DruLiToWeb/DruLiTo_index.html (accessed on 25 February 2020).
- Chow, E.; Rendleman, C.A.; Bowers, K.J.; Dror, R.O.; Hughes, D.H.; Gullingsrud, J.; Sacerdoti, F.D.; Shaw, D.E. DE Shaw Research Technical Report; DESRES/TR-2008-01; D. E. Shaw Research: New York, NY, USA, 2008. [Google Scholar]
- Bowers, K.J.; Chow, E.; Xu, H.; Dror, R.O.; Eastwood, M.P.; Gregersen, B.A.; Klepeis, J.L.; Kolossvary, I.; Moraes, M.A.; Sacerdoti, F.D.; et al. Scalable algorithms for molecular dynamics simulations on commodity clusters. In Proceedings of the SC ’06: 2006 ACM/IEEE Conference on Supercomputing, Tampa, FL, USA, 11–17 November 2006; p. 43. [Google Scholar]
- Ertl, P.; Rohde, B.; Selzer, P. Fast calculation of molecular polar surface area as a sum of fragment-based contributions and its application to the prediction of drug transport properties. J. Med. Chem. 2000, 43, 3714–3717. [Google Scholar] [CrossRef]
- Shivakumar, D.; Williams, J.; Wu, Y.; Damm, W.; Shelley, J.; Sherman, W. Prediction of Absolute Solvation Free Energies using Molecular Dynamics Free Energy Perturbation and the OPLS Force Field. J. Chem. Theory Comput. 2010, 6, 1509–1519. [Google Scholar] [CrossRef]
- Jorgensen, W.L.; Maxwell, D.S.; Tirado-Rives, J. Development and Testing of the OPLS All-Atom Force Field on Conformational Energetics and Properties of Organic Liquids. J. Am. Chem. Soc. 1996, 118, 11225–11236. [Google Scholar] [CrossRef]
- Martyna, G.J.; Klein, M.L.; Tuckerman, M. Nosé–Hoover chains: The canonical ensemble via continuous dynamics. J. Chem. Phys. 1992, 97, 2635–2643. [Google Scholar] [CrossRef]
- Martyna, G.J.; Tobias, D.J.; Klein, M.L. Constant pressure molecular dynamics algorithms. J. Chem. Phys. 1994, 101, 4189. [Google Scholar] [CrossRef]


| Training Set (Increase in Number of Aromatic Bonds) | |||
|---|---|---|---|
| Ratio | R2 | Adjusted R2 | R2–Adjusted R2 |
| 50:50 | 19.89% | −17.50% | 37.39 |
| 70:30 | 32.67% | 13.03% | 19.64 |
| 75:25 | 36.11% | 18.91% | 17.20 |
| 25:75 | 93.25% | 81.43% | 11.82 |
| Test Set (Increase in Number of Aromatic Bonds) | |||
| Ratio | R2 | Adjusted R2 | R2–Adjusted R2 |
| 50:50 | 19.49% | −15.51% | 35.00% |
| 70:30 | 30.74% | 13.21% | 17.53% |
| 75:25 | 33.04% | 19.44% | 13.60% |
| 25:75 | 91.12% | 81.40% | 9.72% |
| (A) Virtual Screening Workflow Docking | ||||||
|---|---|---|---|---|---|---|
| S. No. | Ligands | Structure | Present in | Docking Score (kcal/mol) | XPGScore (kcal/mol) | MMSGBA (kcal/mol) |
| 1 | Silydianin |  | Silybum marianum | −7.23 | −7.26 | −63.42 |
| 2 | Morin |  | Morus alba | −6.73 | −6.98 | −47.10 |
| 3 | Cianidanol |  | Punica granatum | −6.21 | −6.21 | −46.93 |
| 4 | Rosmarinic acid |  | Lamiaceae | −6.14 | −6.14 | −46.72 |
| 5 | Leucopelargonidin |  | Ficus bengalensis | −6.03 | −6.03 | −48.25 |
| 6 | (-)-Epicatechin | 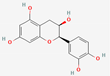 | Pterocarpus marsupium | −6.00 | −6.00 | −46.57 |
| 7 | Apigenin | 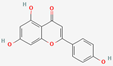 | Matricaria recutita | −5.84 | −5.88 | −38.81 |
| 8 | Wogonin | 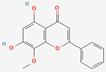 | Scutellaria baicalensis | −5.78 | −5.82 | −40.49 |
| 9 | Malic acid |  | Syzygium cumini | −5.78 | −5.78 | −28.17 |
| 10 | Luteolin |  | Capsicum | −5.51 | −5.55 | −38.73 |
| 11 | Rosiglitazone (drug) |  | −5.43 | −5.99 | −47.24 | |
| 12 | Cajanin |  | Cajanus cajan | −5.34 | −5.34 | −56.52 |
| (B) Extra Precision Docking | ||||||
| S. No. | Ligands | Structure | Present in | XP Score (kcal/mol) | ||
| 1 | Rosmarinic acid |  | Lamiaceae | −8.21 | ||
| 2 | Ellagic acid |  | Syzygium cumini | −7.36 | ||
| 3 | Morin |  | Morus alba | −7.23 | ||
| 4 | Silydianin |  | Silybum marianum | −7.17 | ||
| 5 | Salacinol |  | Salacia reticulate | −6.96 | ||
| 6 | Curcumin |  | Curcuma longa | −6.84 | ||
| 7 | Baicalein |  | Scutellaria baicalensis | −6.67 | ||
| 8 | Miglitol (drug) |  | −6.67 | |||
| S. No. | Ligands | Mol. Weight g/mol | pKd (Std.) | ΔG kcal/mol (Std.) | Ligand-Binding Efficiency kcal/mol (Std.) |
|---|---|---|---|---|---|
| 1 | Catechol | 110.04 | 3.62 (0.17) | −4.89 (−0.24) | −0.61 (−0.03) |
| 2 | Metformin | 129.10 | 3.56 (0.49) | −4.81 (−0.66) | −0.53 (0.07) |
| 3 | (-)-Epicatechin | 290.08 | 6.01 (0.40) | −8.12 (−0.54) | −0.39 (−0.03) |
| 4 | Cianidanol | 290.08 | 5.75 (0.20) | −7.76 (−0.27) | −0.37(−0.01) |
| 5 | Salacinol | 334.04 | 5.28 (0.71) | −7.13 (−0.95) | −0.36 (−0.05) |
| 6 | Luteolin | 286.05 | 5.38 (0.40) | −7.26 (−0.54) | −0.35(−0.03) |
| 7 | Topiramate | 339.10 | 5.52 (0.56) | −7.46 (−0.76) | −0.34 (−0.03) |
| 8 | Baicalein | 270.05 | 5.00 (0.45) | −6.75 (−0.06) | −0.34 (−0.03) |
| 9 | Morin | 302.04 | 5.46 (0.36) | −7.37 (−0.48) | −0.34 (−0.02) |
| 10 | Ellagic acid | 302.01 | 5.24 (0.78) | −7.08 (−1.06) | −0.32 (−0.05) |
| 11 | Cajanin | 300.06 | 5.07 (0.28) | −6.85 (−0.37) | −0.31 (−0.02) |
| 12 | Apigenin | 270.05 | 4.54 (0.47) | −6.13 (−0.64) | −0.31 (−0.03) |
| 13 | Leucopelargonidin | 290.08 | 4.85 (0.43) | −6.55 (−0.58) | −0.31 (−0.03) |
| 14 | Wogonin | 284.07 | 4.62 (0.46) | −6.24 (−0.62) | −0.30 (−0.03) |
| 15 | Malic acid | 134.02 | 1.95 (0.39) | −2.64 (−0.53) | −0.29 (−0.06) |
| 16 | Rosmarinic acid | 360.08 | 5.41 (0.66) | −7.30 (−0.90) | −0.28 (−0.03) |
| 17 | Curcumin | 368.13 | 5.43 (0.76) | −7.33 (−1.02) | −0.27 (−0.04) |
| 18 | Brevifolin carboxylic acid | 292.02 | 3.42 (0.44) | −4.61 (−0.60) | −0.22 (−0.03) |
| 19 | Tolazamide | 311.13 | 3.40 (0.49) | −4.59 (−0.66) | −0.22 (−0.03) |
| 20 | Rosiglitazone | 357.11 | 4.16 (0.57) | −5.62 (−0.77) | −0.22 (−0.03) |
| 21 | Pioglitazone | 356.12 | 3.87 (0.48) | −5.23 (−0.64) | −0.21 (−0.03) |
| 22 | Chlorpropamide | 276.03 | 2.65 (0.17) | −3.57 (−0.23) | −0.21 (−0.01) |
| 23 | Silydianin | 482.12 | 5.20 (0.35) | −7.02 (−0.47) | −0.20 (−0.01) |
| 24 | Tolbutamide | 270.10 | 2.70 (0.24) | −3.64 (−0.32) | −0.20 (−0.02) |
| 25 | Acetohexamide | 324.11 | 2.88 (0.42) | −3.89 (−0.57) | −0.18 (−0.03) |
| 26 | Glibenclamide | 493.14 | 3.61 (0.43) | −4.87 (−0.58) | −0.15 (−0.02) |
| 27 | Glipizide | 445.18 | 3.31 (0.38) | −4.47 (−0.51) | −0.14 (−0.02) |
| S. No. | Compound Name | IC50 (μM) | LogIC50 | Mol. Wt. | Hydrogen Bond Acceptor/HBA (Naccr) | Hydrogen Bond Donor/HBD (Ndonr) | No. of Rotatable Bonds (Nrot) | No. of Aromatic Bonds (Naro) | Topological Polar Surface Area (TPSA) | LogP | References |
|---|---|---|---|---|---|---|---|---|---|---|---|
| 1 | Viscosol | 13.5 | 1.13 | 388.246 | 7 | 2 | 6 | 17 | 98.36 | 4.406 | [67] |
| 2 | Penduletin | 57.9 ± 0.6 | 1.762 | 328.191 | 7 | 2 | 4 | 17 | 98.36 | 2.897 | [67] |
| 3 | 5,6-Dihydroxy-3,4′,7-trimethoxyflavone | 32.2 ± 0.8 | 1.507 | 328.191 | 7 | 2 | 4 | 17 | 98.36 | 2.897 | [67] |
| 4 | Kaempferol 3-O-rutinoside | 20.5 ± 0.8 | 1.311 | 564.282 | 15 | 9 | 6 | 17 | 249.2 | −1.393 | [67] |
| 5 | Isorhamnetin3-O-robinobioside | 42.9 ± 0.4 | 1.632 | 592.292 | 16 | 9 | 7 | 17 | 258.43 | −1.384 | [67] |
| 6 | Erybraedin A | 2.4 ± 0.7 | 0.38 | 364.271 | 4 | 2 | 4 | 12 | 58.92 | 5.725 | [27] |
| 7 | Luteolin | 6.70 ± 0.03 | 0.826 | 276.159 | 6 | 4 | 1 | 17 | 111.13 | 2.282 | [68] |
| 8 | 2′-Methoxykurarinone | 5.26 ± 0.24 | 0.72 | 420.291 | 6 | 2 | 8 | 12 | 85.22 | 5.913 | [68] |
| 9 | Mulberrofuran D | 4.3 ± 0.5 | 0.633 | 412.315 | 4 | 3 | 8 | 16 | 73.83 | 7.961 | [69] |
| 10 | Mulberrofuran W | 2.7 ± 0.3 | 0.431 | 412.315 | 4 | 3 | 9 | 16 | 73.83 | 8.178 | [69] |
| 11 | Catechin | 2.245 | 0.351 | 276.159 | 6 | 5 | 1 | 12 | 110.38 | 1.546 | [70] |
| 12 | Epicatechin | 0.832 | −0.079 | 276.159 | 6 | 5 | 1 | 12 | 110.38 | 1.546 | [70] |
| 13 | Trans-resveratrol | 16.1 ± 1.1 | 1.206 | 216.151 | 3 | 3 | 2 | 12 | 60.69 | 2.974 | [71] |
| 14 | Apigenin | 24.76 | 1.393 | 260.16 | 5 | 3 | 1 | 17 | 90.9 | 2.577 | [71] |
| 15 | Isovitexin | 17.76 | 1.249 | 412.221 | 10 | 7 | 3 | 17 | 181.05 | 0.092 | [72] |
| 16 | Vitexin | 7.62 | 0.881 | 412.221 | 10 | 7 | 3 | 17 | 181.05 | 0.092 | [72] |
| 17 | Isoorientin | 24.54 | 1.389 | 428.22 | 11 | 8 | 3 | 17 | 201.28 | −0.203 | [72] |
| 18 | Orientin | 57.11 | 1.756 | 428.22 | 11 | 8 | 3 | 17 | 201.28 | −0.203 | [72] |
| 19 | abyssinin II/5′-Prenylhomoeriodictyol | 40.5 ± 1.9 | 1.607 | 348.225 | 6 | 3 | 4 | 12 | 96.22 | 4.027 | [73] |
| 20 | Parvisoflavone B | 42.6 ± 2.4 | 1.629 | 336.214 | 6 | 3 | 1 | 17 | 100.13 | 3.761 | [73] |
| 21 | Neorautenol | 7.6 ± 0.9 | 0.88 | 304.216 | 4 | 1 | 0 | 12 | 47.92 | 4.186 | [69] |
| 22 | Erybreadin D | 4.2 ± 0.2 | 0.623 | 364.271 | 4 | 1 | 2 | 12 | 47.92 | 5.695 | [27] |
| 23 | Erybreadin B | 7.8 ± 0.5 | 0.892 | 364.271 | 4 | 1 | 2 | 12 | 47.92 | 5.695 | [27] |
| 24 | Folitenol | 6.4 ± 0.6 | 0.806 | 364.271 | 4 | 1 | 2 | 12 | 47.92 | 5.695 | [74] |
| 25 | Erysubin E | 8.8 ± 0.5 | 0.944 | 380.27 | 5 | 2 | 2 | 12 | 68.15 | 4.799 | [74] |
| 26 | Erybreadin C | 7.3 ± 0.1 | 0.863 | 364.271 | 4 | 2 | 4 | 12 | 58.92 | 5.725 | [74] |
| 27 | Licoagrone | 6.0 | 0.778 | 700.485 | 10 | 5 | 10 | 24 | 170.82 | 8.71 | [27] |
| 28 | Erythraddison III | 4.6 ± 0.1 | 0.662 | 332.226 | 5 | 2 | 4 | 12 | 75.99 | 3.974 | [27] |
| 29 | Erysubin F | 7.8 ± 0.5 | 0.892 | 364.271 | 4 | 2 | 5 | 17 | 70.67 | 5.889 | [27] |
| 30 | 2′-Methoxykurarinone | 5.26 ± 0.24 | 0.72 | 420.291 | 6 | 2 | 8 | 12 | 85.22 | 5.913 | [27] |
| 31 | Mimulone/ Bonannione A | 1.9 ± 0.1 | 0.278 | 380.27 | 5 | 3 | 6 | 12 | 86.99 | 5.745 | [75] |
| 32 | 3′-O-Methyldiplacone | 3.9 ± 0.3 | 0.591 | 408.28 | 6 | 3 | 7 | 12 | 96.22 | 5.754 | [75] |
| 33 | 6-geranyl-3′,5,5′,7-Tetrahydroxy-4′-methoxyflavanone | 5.9 ± 0.4 | 0.77 | 424.279 | 7 | 4 | 7 | 12 | 116.45 | 5.459 | [75] |
| 34 | 4′-O-methyldiplacone | 7.8 ± 0.6 | 0.892 | 408.28 | 6 | 3 | 7 | 12 | 96.22 | 5.754 | [75] |
| 35 | 3′-O-methyldiplacol | 4.9 ± 0.5 | 0.69 | 424.279 | 7 | 4 | 7 | 12 | 116.45 | 4.725 | [75] |
| 36 | 4′-O-methyldiplacol | 8.2 ± 0.6 | 0.913 | 424.279 | 7 | 4 | 7 | 12 | 116.45 | 4.725 | [75] |
| 37 | 6-geranyl-3,3′,5,5′,7-Pentahydroxy-4′-methoxyflavane | 6.6 ± 0.5 | 0.819 | 424.279 | 7 | 5 | 7 | 12 | 119.61 | 4.79 | [75] |
| 38 | Laxichalcone | 20.7 ± 5.3 | 1.315 | 380.27 | 5 | 2 | 3 | 12 | 75.99 | 5.362 | [76] |
| 39 | Macarangin | 22.7 ± 4.6 | 1.356 | 396.269 | 6 | 4 | 6 | 17 | 111.13 | 5.518 | [76] |
| 40 | Bonanniol A | 15.2 ± 2.8 | 1.181 | 396.269 | 6 | 4 | 6 | 12 | 107.22 | 4.716 | [76] |
| 41 | 7,4′-Dimethylkaempferol/3,5-Dihydroxy-7-methoxy-2-(4-methoxyphenyl)-4H-chromen-4-one | 16.92 ± 2.12 | 1.228 | 300.181 | 6 | 2 | 3 | 17 | 89.13 | 2.888 | [76] |
| 42 | 2S-5,6,7,3′,4′-Pentamethoxyflavanone | 6.88 ± 0.76 | 0.837 | 352.213 | 7 | 0 | 6 | 12 | 72.45 | 3.436 | [77] |
| 43 | 3′-Hydroxy-3,5,7,4′-tetramethoxyflavone | 22.25 ± 1.70 | 1.347 | 340.202 | 7 | 1 | 5 | 17 | 87.36 | 3.2 | [77] |
| 44 | 3,5-Dihydroxy-7,3′,4′-trimethoxyflavone | 52.64 ± 4.12 | 1.721 | 328.191 | 7 | 2 | 4 | 17 | 98.36 | 2.897 | [77] |
| 45 | Lutein | 13.691 | 1.136 | 512.438 | 2 | 2 | 10 | 1 | 40.46 | 10.403 | [78] |
| 46 | Silydianin | 17.38 | 1.24 | 460.265 | 10 | 5 | 3 | 12 | 162.98 | 0.99 | [79] |
| Total Compounds = 46 | |||
|---|---|---|---|
| S. No. | Sorting and Division Methods | Training Set Compounds | Test Set Compounds |
| 1 | Random Sorting:- I (50:50) | 1–23 | 24–46 |
| II (70:30) | 1–32 | 33–46 | |
| III(75:25) | 1–34 | 35–46 | |
| IV(25:75) | 1–12 | 13–46 | |
| 2 | Increasing Mol. Weight:- I(50:50) | 13, 14, 7, 11, 12, 41, 21, 2, 3, 44, 28, 20, 43, 19, 42, 6, 22, 23, 24, 26, 29, 25, 31 | 38, 1, 39, 40, 32, 34, 15, 16, 9, 10, 8, 30, 33, 35, 36, 37, 17, 18, 46, 45, 4, 5, 27 |
| II (70:30) | 13, 14, 7, 11, 12, 41, 21, 2, 3, 44, 28, 20, 43, 19, 42, 6, 22, 23, 24, 26, 29, 25, 31, 38, 1, 39, 40, 32, 34, 15, 16, 9 | 10, 8, 30, 33, 35, 36, 37, 17, 18, 46, 45, 4, 5, 27 | |
| III(75:25) | 13, 14, 7, 11, 12, 41, 21, 2, 3, 44, 28, 20, 43, 19, 42, 6, 22, 23, 24, 26, 29, 25, 31, 38, 1, 39, 40, 32, 34, 15, 16, 9, 10, 8 | 30, 33, 35, 36, 37, 17, 18, 46, 45, 4, 5, 27 | |
| IV(25:75) | 13, 14, 7, 11, 12, 41, 21, 2, 3, 44, 28, 20 | 43, 19, 42, 6, 22, 23, 24, 26, 29, 25, 31, 38, 1, 39, 40, 32, 34, 15, 16, 9, 10, 8, 30, 33, 35, 36, 37, 17, 18, 46, 45, 4, 5, 27 | |
| 3 | Increasing H-bond Acceptor (HBA) (naccr):- I(50:50) | 45, 13, 6, 9, 10, 21, 22, 23, 24, 26, 29, 14, 25, 28, 31, 38, 7, 8, 11,12, 19, 20, 30 | 32, 34, 39, 40, 41, 1, 2, 3, 33, 35, 36, 37, 42, 43, 44, 15, 16, 27, 46, 17, 18, 4, 5 |
| II (70:30) | 45, 13, 6, 9, 10, 21, 22, 23, 24, 26, 29, 14, 25, 28, 31, 38, 7, 8, 11,12, 19, 20, 30, 32, 34, 39, 40, 41, 1, 2, 3, 33 | 35, 36, 37, 42, 43, 44, 15, 16, 27, 46, 17, 18, 4, 5 | |
| III (75:25) | 45, 13, 6, 9, 10, 21, 22, 23, 24, 26, 29, 14, 25, 28, 31, 38, 7, 8, 11,12, 19, 20, 30, 32, 34, 39, 40, 41, 1, 2, 3, 33, 35, 36 | 37, 42, 43, 44, 15, 16, 27, 46, 17, 18, 4, 5 | |
| IV (25:75) | 45, 13, 6, 9, 10, 21, 22, 23, 24, 26, 29, 14 | 25, 28, 31, 38, 7, 8, 11,12, 19, 20, 30, 32, 34, 39, 40, 41, 1, 2, 3, 33, 35, 36, 37, 42, 43, 44, 15, 16, 27, 46, 17, 18, 4, 5 | |
| 4 | Increasing H-bond Donor (HBD) (ndonr):- I(50:50) | 42, 21, 22, 23, 24, 43, 1, 2, 3, 6, 8, 25, 26, 28, 29, 30, 38, 41, 44, 45, 9, 10, 13 | 14, 19, 20, 31, 32, 34, 7, 33, 35, 36, 39, 40, 11, 12, 27, 37, 46, 15, 16, 17, 18, 4, 5 |
| II (70:30) | 42, 21, 22, 23, 24, 43, 1, 2, 3, 6, 8, 25, 26, 28, 29, 30, 38, 41, 44, 45, 9, 10, 13, 14, 19, 20, 31, 32, 34, 7, 33, 35 | 36, 39, 40, 11, 12, 27, 37, 46, 15, 16, 17, 18, 4, 5 | |
| III (75:25) | 42, 21, 22, 23, 24, 43, 1, 2, 3, 6, 8, 25, 26, 28, 29, 30, 38, 41, 44, 45, 9, 10, 13, 14, 19, 20, 31, 32, 34, 7, 33, 35, 36, 39 | 40, 11, 12, 27, 37, 46, 15, 16, 17, 18, 4, 5 | |
| IV (25:75) | 42, 21, 22, 23, 24, 43, 1, 2, 3, 6, 8, 25 | 26, 28, 29, 30, 38, 41, 44, 45, 9, 10, 13, 14, 19, 20, 31, 32, 34, 7, 33, 35, 36, 39, 40, 11, 12, 27, 37, 46, 15, 16, 17, 18, 4, 5 | |
| 5 | Increasing No. of Rotatable Bonds (nrot):- I(50:50) | 21, 7, 11, 12, 14, 20, 13, 22, 23, 24, 25, 15, 16, 17, 18, 38, 41, 46, 2, 3, 6, 19, 26 | 28, 44, 29, 43, 1, 4, 31, 39, 40, 42, 5, 32, 33, 34, 35, 36, 37, 8, 9, 30, 10, 27, 45 |
| II (70:30) | 21, 7, 11, 12, 14, 20, 13, 22, 23, 24, 25, 15, 16, 17, 18, 38, 41, 46, 2, 3, 6, 19, 26, 28, 44, 29, 43, 1, 4, 31, 39, 40 | 42, 5, 32, 33, 34, 35, 36, 37, 46, 8, 9, 30, 10, 27, 45 | |
| III (75:25) | 21, 7, 11, 12, 14, 20, 13, 22, 23, 24, 25, 15, 16, 17, 18, 38, 41, 46, 2, 3, 6, 19, 26, 28, 44, 29, 43, 1, 4, 31, 39, 40, 42, 5 | 32, 33, 34, 35, 36, 37, 46, 8, 9, 30, 10, 27, 45 | |
| IV (25:75) | 21, 7, 11, 12, 14, 20, 13, 22, 23, 24, 25, 15, | 16, 17, 18, 38, 41, 46, 2, 3, 6, 19, 26, 28, 44, 29, 43, 1, 4, 31, 39, 40, 42, 5, 32, 33, 34, 35, 36, 37, 46, 8, 9, 30, 10, 27, 45 | |
| 6 | Increasing No. of Aromatic Bonds (naro):- I(50:50) | 45, 6, 8, 11, 12, 13, 19, 21, 22, 23, 24, 25, 26, 28, 30, 31, 32, 33, 34, 35, 36, 37, 38 | 40, 42, 46, 9, 10, 1, 2, 3, 4, 5, 7, 14, 15, 16, 17, 18, 20, 29, 39, 41, 43, 44, 27 |
| II (70:30) | 45, 6, 8, 11, 12, 13, 19, 21, 22, 23, 24, 25, 26, 28, 30, 31, 32, 33, 34, 35, 36, 37, 38, 40, 42, 46, 9, 10, 1, 2, 3, 4 | 5, 7, 14, 15, 16, 17, 18, 20, 29, 39, 41, 43, 44, 27 | |
| III (75:25) | 45, 6, 8, 11, 12, 13, 19, 21, 22, 23, 24, 25, 26, 28, 30, 31, 32, 33, 34, 35, 36, 37, 38, 40, 42, 46, 9, 10, 1, 2, 3, 4, 5, 7 | 14, 15, 16, 17, 18, 20, 29, 39, 41, 43, 44, 27 | |
| IV (25:75) | 45, 6, 8, 11, 12, 13, 19, 21, 22, 23, 24, 25 | 26, 28, 30, 31, 32, 33, 34, 35, 36, 37, 38, 40, 42, 46, 9, 10, 1, 2, 3, 4, 5, 7, 14, 15, 16, 17, 18, 20, 29, 39, 41, 43, 44, 27 | |
| 7 | Increasing Topological Polar Surface Area (TPSA):- I(50:50) | 45, 21, 22, 23, 24, 6, 26, 13, 25, 29, 42, 9, 10, 28, 38, 8, 30, 31, 43, 41, 14, 19, 32 | 34, 1, 2, 3, 44, 20, 40, 11, 12, 7, 39, 33, 35, 36, 37, 46, 27, 15, 16, 17, 18, 4, 5 |
| II (70:30) | 45, 21, 22, 23, 24, 6, 26, 13, 25, 29, 42, 9, 10, 28, 38, 8, 30, 31, 43, 41, 14, 19, 32, 34, 1, 2, 3, 44, 20, 40, 11, 12 | 7, 39, 33, 35, 36, 37, 46, 27, 15, 16, 17, 18, 4, 5 | |
| III (75:25) | 45, 21, 22, 23, 24, 6, 26, 13, 25, 29, 42, 9, 10, 28, 38, 8, 30, 31, 43, 41, 14, 19, 32, 34, 1, 2, 3, 44, 20, 40, 11, 12, 7, 39 | 33, 35, 36, 37, 46, 27, 15, 16, 17, 18, 4, 5 | |
| IV (25:75) | 45, 21, 22, 23, 24, 6, 26, 13, 25, 29, 42, 9 | 10, 28, 38, 8, 30, 31, 43, 41, 14, 19, 32, 34, 1, 2, 3, 44, 20, 40, 11, 12, 7, 39, 33, 35, 36, 37, 46, 27, 15, 16, 17, 18, 4, 5 | |
| 8 | Increasing LogP:- I(50:50) | 4, 5, 17, 18, 15, 16, 46, 11, 12, 7, 14, 41, 2, 3, 44, 13, 43, 42, 20, 28, 19, 21, 1 | 40, 35, 36, 37, 25, 38, 33, 39, 22, 23, 24, 6, 26, 31, 32, 34, 39, 8, 30, 9, 10, 27, 45 |
| II (70:30) | 4, 5, 17, 18, 15, 16, 46, 11, 12, 7, 14, 41, 2, 3, 44, 13, 43, 42, 20, 28, 19, 21, 1, 40, 35, 36, 37, 25, 38, 33, 39, 22 | 23, 24, 6, 26, 31, 32, 34, 39, 8, 30, 9, 10, 27, 45 | |
| III (75:25) | 4, 5, 17, 18, 15, 16, 46, 11, 12, 7, 14, 41, 2, 3, 44, 13, 43, 42, 20, 28, 19, 21, 1, 40, 35, 36, 37, 25, 38, 33, 39, 22, 23, 24 | 6, 26, 31, 32, 34, 39, 8, 30, 9, 10, 27, 45 | |
| IV (25:75) | 4, 5, 17, 18, 15, 16, 46, 11, 12, 7, 14, 41 | 2, 3, 44, 13, 43, 42, 20, 28, 19, 21, 1, 40, 35, 36, 37, 25, 38, 33, 39, 22, 23, 24, 6, 26, 31, 32, 34, 39, 8, 30, 9, 10, 27, 45 |
Publisher’s Note: MDPI stays neutral with regard to jurisdictional claims in published maps and institutional affiliations. |
© 2022 by the authors. Licensee MDPI, Basel, Switzerland. This article is an open access article distributed under the terms and conditions of the Creative Commons Attribution (CC BY) license (https://creativecommons.org/licenses/by/4.0/).
Share and Cite
Rath, P.; Ranjan, A.; Ghosh, A.; Chauhan, A.; Gurnani, M.; Tuli, H.S.; Habeeballah, H.; Alkhanani, M.F.; Haque, S.; Dhama, K.; et al. Potential Therapeutic Target Protein Tyrosine Phosphatase-1B for Modulation of Insulin Resistance with Polyphenols and Its Quantitative Structure–Activity Relationship. Molecules 2022, 27, 2212. https://doi.org/10.3390/molecules27072212
Rath P, Ranjan A, Ghosh A, Chauhan A, Gurnani M, Tuli HS, Habeeballah H, Alkhanani MF, Haque S, Dhama K, et al. Potential Therapeutic Target Protein Tyrosine Phosphatase-1B for Modulation of Insulin Resistance with Polyphenols and Its Quantitative Structure–Activity Relationship. Molecules. 2022; 27(7):2212. https://doi.org/10.3390/molecules27072212
Chicago/Turabian StyleRath, Prangya, Anuj Ranjan, Arabinda Ghosh, Abhishek Chauhan, Manisha Gurnani, Hardeep Singh Tuli, Hamza Habeeballah, Mustfa F. Alkhanani, Shafiul Haque, Kuldeep Dhama, and et al. 2022. "Potential Therapeutic Target Protein Tyrosine Phosphatase-1B for Modulation of Insulin Resistance with Polyphenols and Its Quantitative Structure–Activity Relationship" Molecules 27, no. 7: 2212. https://doi.org/10.3390/molecules27072212
APA StyleRath, P., Ranjan, A., Ghosh, A., Chauhan, A., Gurnani, M., Tuli, H. S., Habeeballah, H., Alkhanani, M. F., Haque, S., Dhama, K., Verma, N. K., & Jindal, T. (2022). Potential Therapeutic Target Protein Tyrosine Phosphatase-1B for Modulation of Insulin Resistance with Polyphenols and Its Quantitative Structure–Activity Relationship. Molecules, 27(7), 2212. https://doi.org/10.3390/molecules27072212