Article

Protective Effect of Quercetin 3-O-Glucuronide against Cisplatin Cytotoxicity in Renal Tubular Cells

by
Daniel Muñoz-Reyes
1,2,3,
Alfredo G. Casanova
1,2,3,4,5,
Ana María González-Paramás
6,
Ángel Martín
7,
Celestino Santos-Buelga
6,
Ana I. Morales
1,2,3,4,5,
Francisco J. López-Hernández
2,3,4,5,* and
Marta Prieto
1,2,3,4,5
1
Toxicology Unit, Universidad de Salamanca, 37007 Salamanca, Spain
2
Department of Physiology and Pharmacology, Universidad de Salamanca, 37007 Salamanca, Spain
3
Group of Translational Research on Renal and Cardiovascular Diseases (TRECARD), 37007 Salamanca, Spain
4
Institute of Biomedical Research of Salamanca (IBSAL), 37007 Salamanca, Spain
5
National Network for Kidney Research REDINREN, RD016/0009/0025, Instituto de Salud Carlos III, 28029 Madrid, Spain
6
Polyphenols Research Group (GIP-USAL), Nutrition and Bromatology Unit, Faculty of Pharmacy, Universidad de Salamanca, 37007 Salamanca, Spain
7
High Pressure Processes Group, BioEcoUVa, Bioeconomy Research Institute, Department of Chemical Engineering and Environmental Technology, Universidad de Valladolid, 47011 Valladolid, Spain
*
Author to whom correspondence should be addressed.
Molecules 2022, 27(4), 1319; https://doi.org/10.3390/molecules27041319
Submission received: 19 January 2022 / Revised: 11 February 2022 / Accepted: 12 February 2022 / Published: 15 February 2022

Abstract

:
Quercetin, a flavonoid with promising therapeutic potential, has been shown to protect from cisplatin nephrotoxicity in rats following intraperitoneal injection, but its low bioavailability curtails its prospective clinical utility in oral therapy. We recently developed a micellar formulation (P-quercetin) with enhanced solubility and bioavailability, and identical nephroprotective properties. As a first aim, we herein evaluated the oral treatment with P-quercetin in rats, which displayed no nephroprotection. In order to unravel this discrepancy, quercetin and its main metabolites were measured by HPLC in the blood and urine after intraperitoneal and oral administrations. Whilst quercetin was absorbed similarly, the profile of its metabolites was different, which led us to hypothesize that nephroprotection might be exerted in vivo by a metabolic derivate. Consequently, we then aimed to evaluate the cytoprotective capacity of quercetin and its main metabolites (quercetin 3-O-glucoside, rutin, tamarixetin, isorhamnetin and quercetin 3-O-glucuronide) against cisplatin toxicity, in HK-2 and NRK-52E tubular cell lines. Cells were incubated for 6 h with quercetin, its metabolites or vehicle (pretreatment), and subsequently 18 h in cotreatment with 10–300 μM cisplatin. Immediately after treatment, cell cultures were subject to the MTT technique as an index of cytotoxicity and photographed under light microscopy for phenotypic assessment. Quercetin afforded no direct cytoprotection and quercetin-3-O-glucuronide was the only metabolite partially preventing the effect of cisplatin in cultured tubule cells. Our results identify a metabolic derivative of quercetin contributing to its nephroprotection and prompt to further explore exogenous quercetin-3-O-glucuronide in the prophylaxis of tubular nephrotoxicity.

1. Introduction

Cisplatin (cis-diaminnedichloroplatin (II)) is an inorganic compound with antineoplastic activity. Its pharmacological mechanism of action is based on the formation of a covalent bond with nitrogen 7 in purine bases, blocking cell division and inducing apoptosis [1]. As a chemotherapeutic drug, the use of cisplatin is curtailed by its toxicity, with nephrotoxicity posing the limiting effect [2]. The incidence of cisplatin nephrotoxicity is high, occurring in one in every three patients under treatment [3]. This nephrotoxicity is due to the drug accumulation in the kidney, since its elimination from the body is carried out through this organ by glomerular filtration and tubular secretion, without being metabolized. The copper transporter 1 (Ctr1) and the organic cation transporter 2 (OCT2) are mainly responsible for the entry of cisplatin into tubular renal cells, since they have a high affinity for the drug. In this way, its concentration in the epithelial cells of the proximal tubule is around 5 times higher than in plasma [4].
Several molecular mechanisms of cisplatin tubular cytotoxicity have been described, including: (a) direct DNA damage from adducts formations [5], (b) alteration of cellular transporters [6], (c) mitochondrial dysfunction and oxidative stress [5], (d) MAP kinase activation [7,8], (e) induction of apoptosis [3], and (f) inflammation [9]. These mechanisms constitute potential pharmacological targets for the prevention and alleviation of cisplatin nephrotoxicity [6].
Quercetin is a flavonoid found naturally in many fruits and vegetables. It has a wide variety of biological properties, among which its antioxidant, antiobesity, antiviral, antibacterial and anti-inflammatory effects stand out. Furthermore, quercetin is of special interest in the treatment of certain cancers, since it inhibits the proliferation of cancer cells and limits their growth [10].
In natural media, quercetin is usually found in glycosylated form. Quercetin glycosides can be partially hydrolyzed in saliva [11] and further in the small intestine by the enzyme lactase-phlorizin hydrolase in the intestinal epithelium releasing the aglycone that may be subsequently absorbed [12]. Efficient glucuronidation of quercetin can already occur in the small intestine by the action of UDP-glucuronyltransferases, as well as methylation by the action of catechol O-methyltransferases. Later, they are transported to the liver through the portal vein, where secondary metabolism occurs in the form of methylation, sulfation and conjugation with glucuronide. Conjugation of quercetin with sulfate is carried out by sulfotransferases. Thus, the circulating forms able to reach the biological targets are quercetin metabolites, which activity can differ from the original compound [13]. Once in the bloodstream, the metabolites bind to plasma proteins, such as albumin [10]. Finally, they accumulate in some organs, such as the kidney, which is involved in their excretion [14].
In the kidney, more than 90% of quercetin is in its conjugated form. Tubular cells have the enzymatic capacity to carry out a third biotransformation of quercetin. The metabolic conversions that occur include a complex combination of metabolite deconjugation followed by immediate sulfation, glucuronidation, methylation, and glucosylation [12].
We have previously demonstrated that quercetin protects against cisplatin nephrotoxicity in an in vivo model, without compromising the antineoplasic activity of the drug [3,15]. However, in our model, quercetin was administered intraperitoneally (i.p.), due to the low oral bioavailability of quercetin. The poor absorption and bioavailability of quercetin are mainly due to its limited solubility in aqueous fluids, which compromises the therapeutic application of the flavonoid. In order to improve its bioavailability, we have developed a micellar formulation (P-quercetin), which increases quercetin solubility approximately 10 times. Our results showed that this formulation, administered i.p., increased the plasma concentration of quercetin compared to the dose-equivalent administration of the unformulated flavonoid, and maintained the nephroprotective capacity when it was coadministered with cisplatin [16].
Since the i.p. via is not useful from a clinical point of view, and therefore the intended via of administration in humans is the oral one (p.o.), our first aim with this work was to verify whether P-quercetin protects against the nephrotoxicity of cisplatin by that via. However, the nephroprotection afforded by P-quercetin via i.p. was not observed following the administration of the same dosage through the oral via (see Section 2.1). In view of this result, a pilot study has been carried out to check whether the absorption of P-quercetin p.o. was lower than by the i.p., which might explain the absence of nephroprotection of the oral administration. With this objective, the presence of quercetin and its metabolites in biological samples (plasma and urine) was analyzed by HPLC, after the administration of the same dosage of P-quercetin by both routes. We found that P-quercetin was similarly absorbed via i.p. and p.o., whereas the profile of the metabolites found was slightly different between both vias (see Section 2.2). Our hypothesis in relation to these results is that quercetin in vivo protection may be related to the activity of some of its metabolite(s), and not to quercetin, at least partially. Thus, the pharmacokinetics after intraperitoneal administration would favor renal accumulation of the active metabolite/s to a greater extent than oral administration. So, the second aim of this study was to evaluate the cytoprotective capacity of quercetin and its main metabolites against cisplatin toxicity in renal tubular cells.

2. Results

2.1. Nephroprotection Study with Oral P-quercetin

In our in vivo model, renal function was heavily damaged by cisplatin. However, this effect was not ameliorated by oral P-quercetin, as was the case with intraperitoneal administration of the formulation in our previous experiments [16]. Rats in the cisplatin (CP) group experienced an acute kidney injury (AKI), as they showed a progressive increase in their plasma creatinine (Crpl) and urea levels compared to those of the controls (Figure 1a). AKI is defined and diagnosed according to elevations in Crpl concentration [17,18,19], an indirect marker of glomerular filtration rate (GFR). On the other hand, plasma urea concentration is a marker of azotemia [20]. These biomarkers also increased in the CP+PQor (cisplatin + oral P-quercetin) group, even slightly more extensive than in the CP group. In accordance with these data, cisplatin induced a severe drop in creatinine clearance (CrCl), a standard method for GFR measurement [21]. Oral P-quercetin also was unable of mitigate the drop in CrCl produced by cisplatin (Figure 1b). Finally, a significant increase in proteinuria was detected in both groups, CP and CP+PQor, on day 7. Although proteinuria may have glomerular origin, in the case of cisplatin nephrotoxicity it arise from defective tubular reabsorption due to tubular injury [22]. Oral P-quercetin also did not reverse in our model the excess urinary excretion of proteins produced by cisplatin (Figure 1b). The same pattern was found when twice the dose of P-quercetin was administered and the number of days of flavonoid administration prior to cisplatin was increased to 10 days (data not shown).

2.2. Metabolites Distribution in Plasma and Urine after P-quercetin Administration

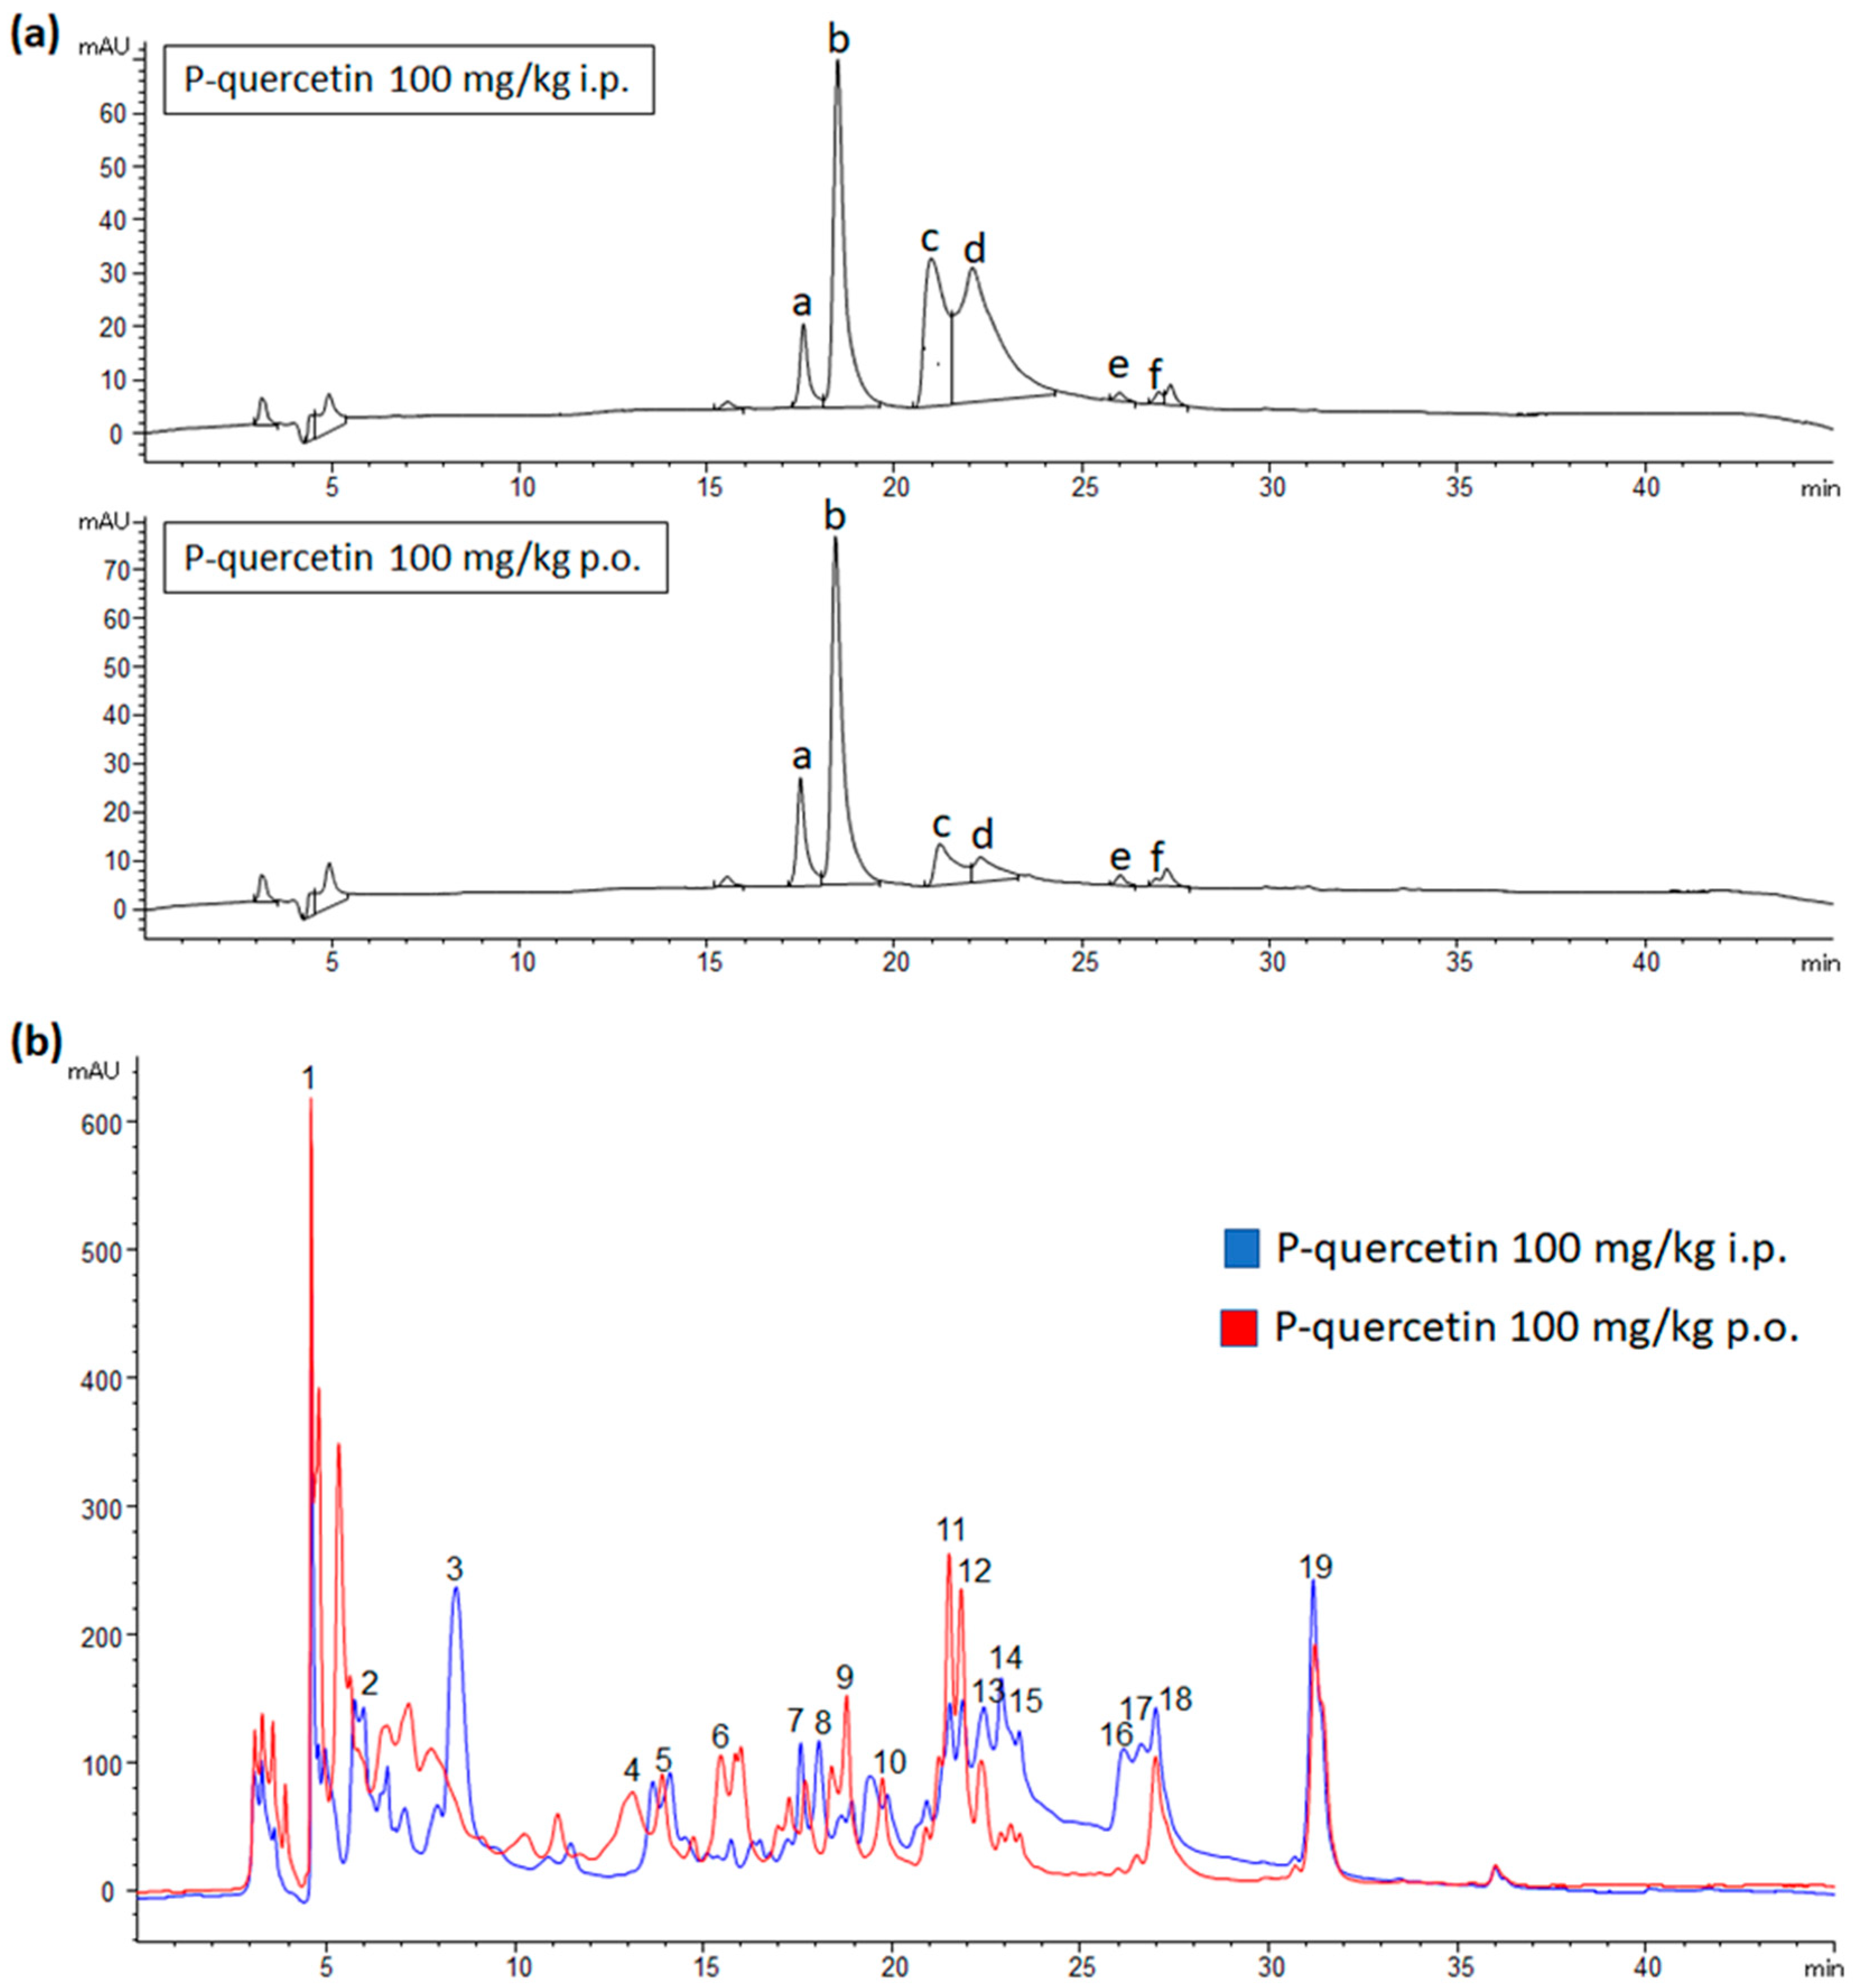
The distribution of quercetin and its metabolites was analyzed in the plasma and urine of rats that had been administered 3 doses of P-quercetin, i.p. or p.o. In the case of plasma samples, a fairly similar profile in the chromatogram was obtained after flavonoid administration for each of the vias. This fact indicates that absorption occurred by both vias. However, differences were observed in the levels of some metabolites, namely methylquercetin glucuronide sulfate and quercetin sulfate, which appeared in higher concentrations after i.p. than after oral administration (Figure 2a). The metabolites profile found in urine samples was more complex than the one observed in plasma, with a greater number of quercetin metabolites detected. In this case, differences, mainly quantitative, were observed in some metabolites depending on the via of administration (Figure 2b), but also on the individuals.

2.3. Evaluation of the Protective Capacity of Quercetin and Its Metabolites against Cisplatin Cytotoxicity in HK-2 Cells

2.3.1. Titration of Cisplatin in HK-2 Cells

Cisplatin cytotoxicity was determined in HK-2 cells, a cell line of human proximal tubule cells [23].
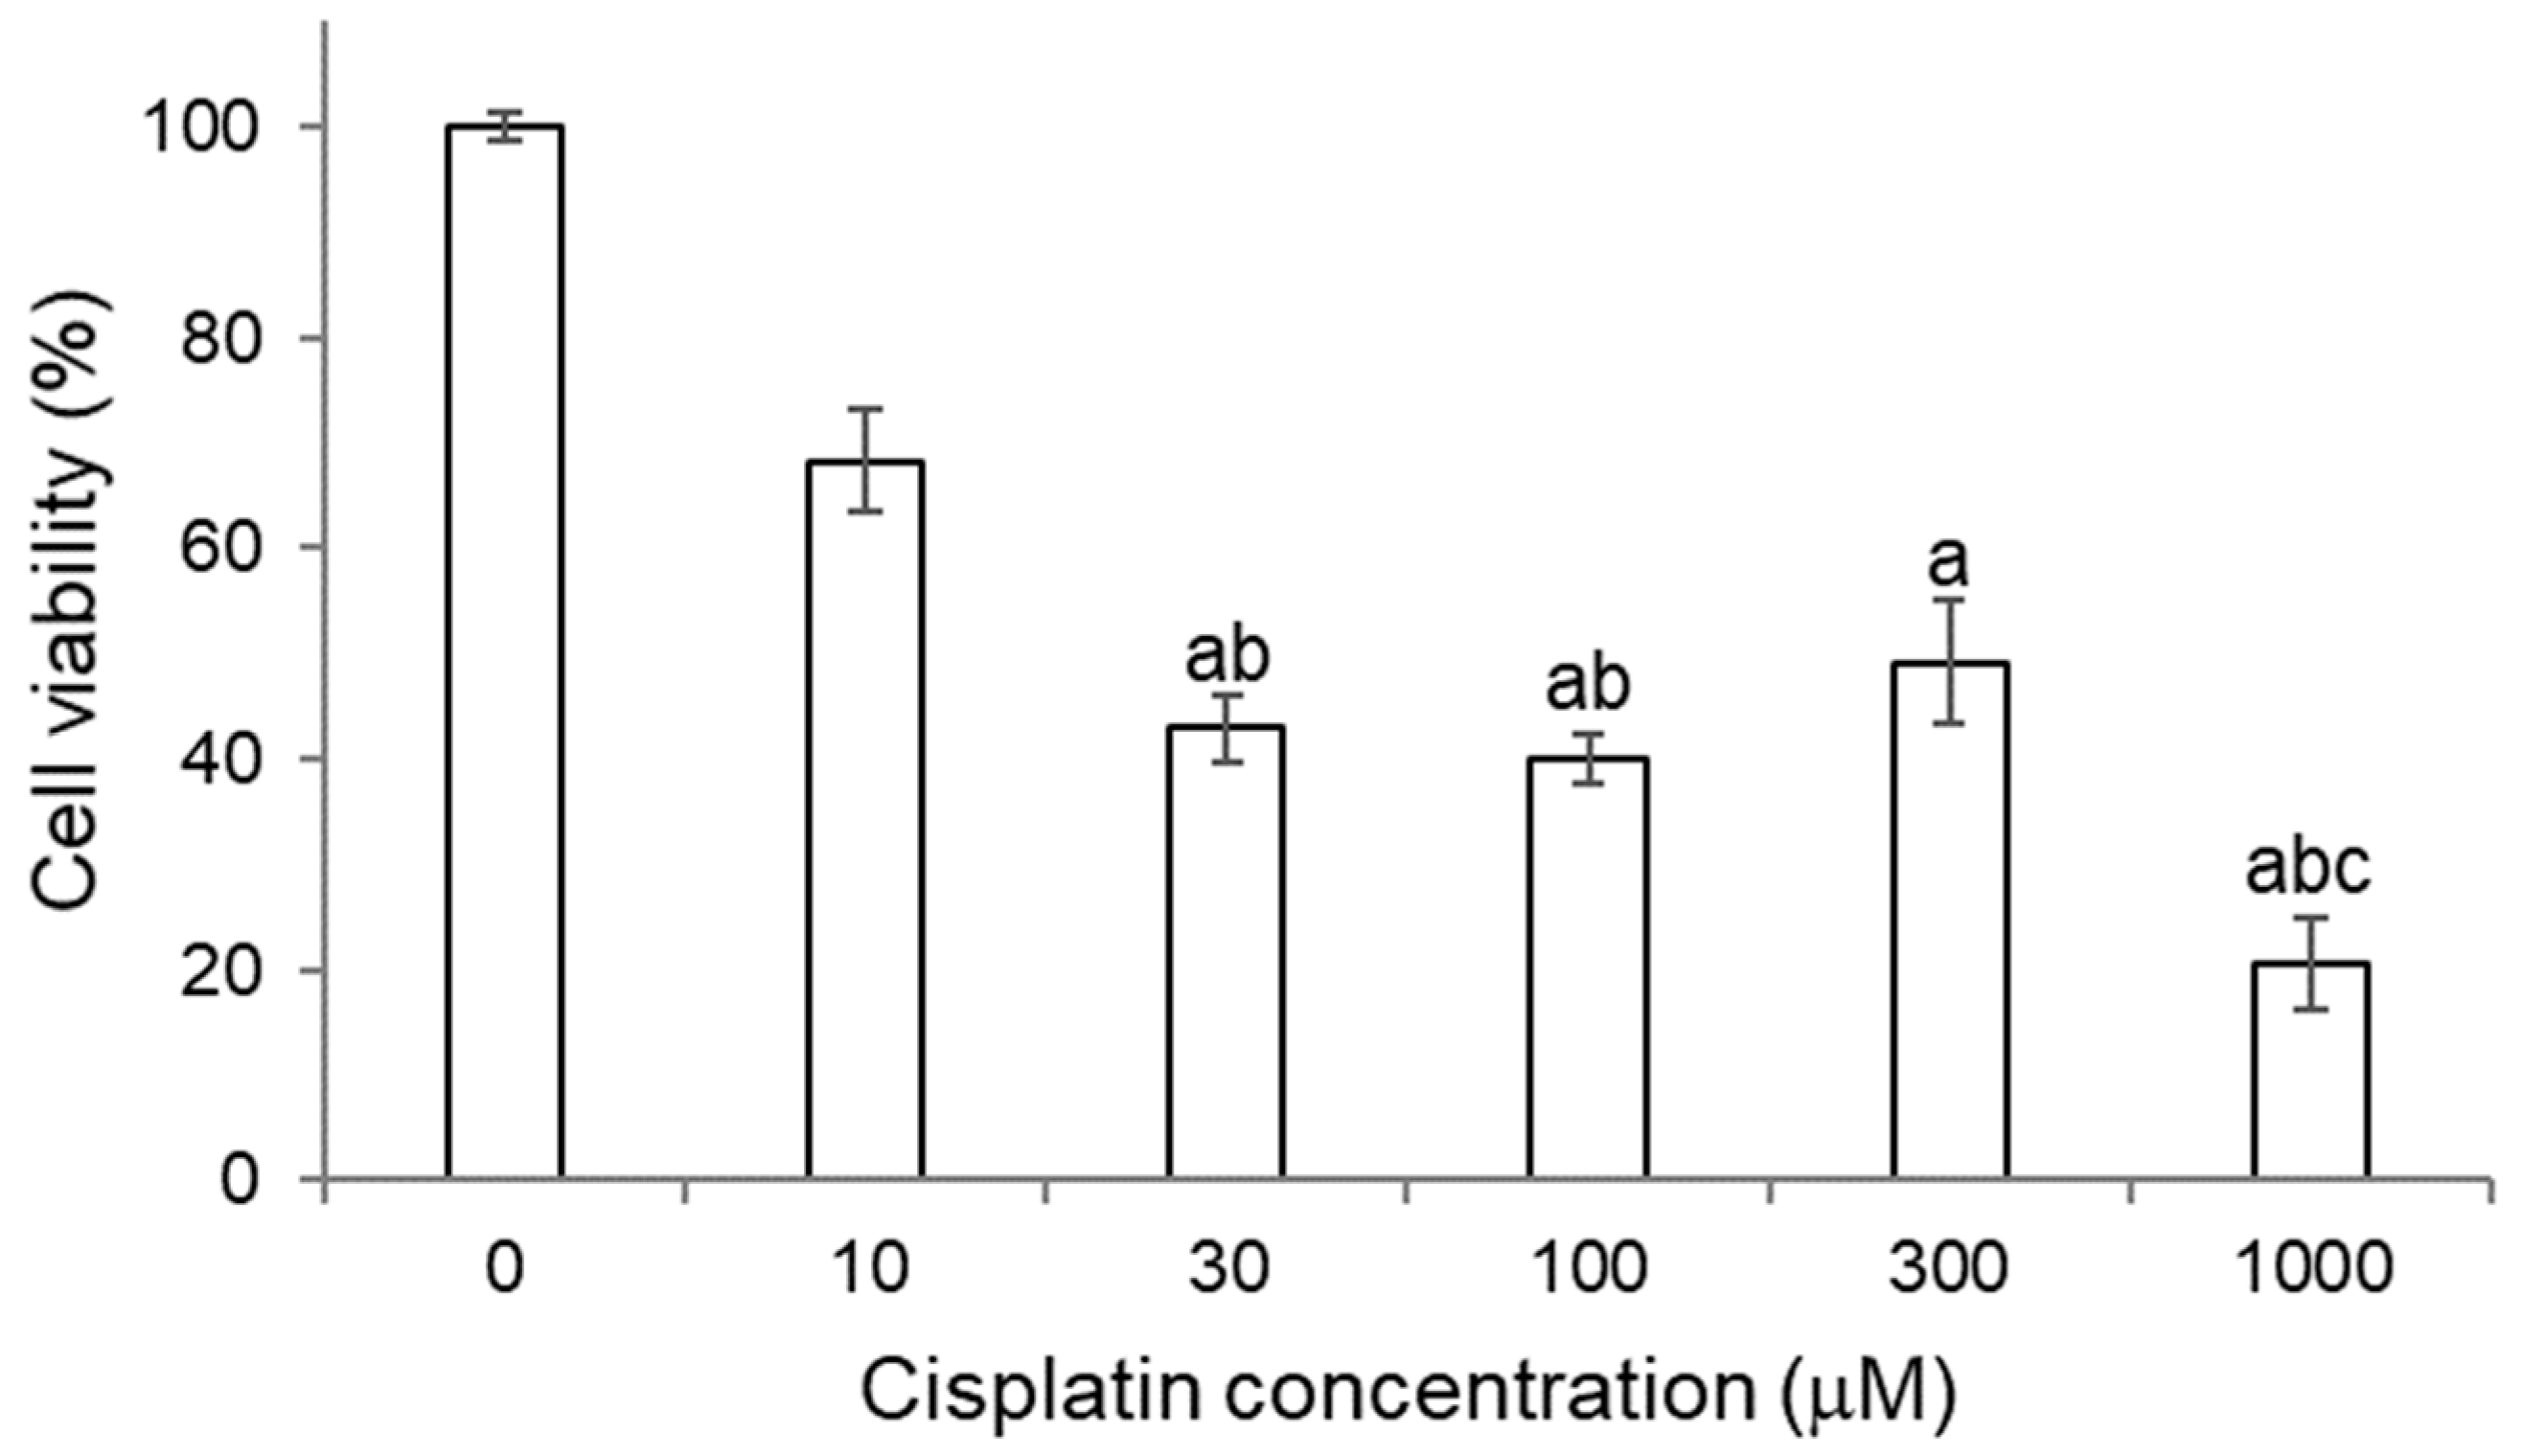
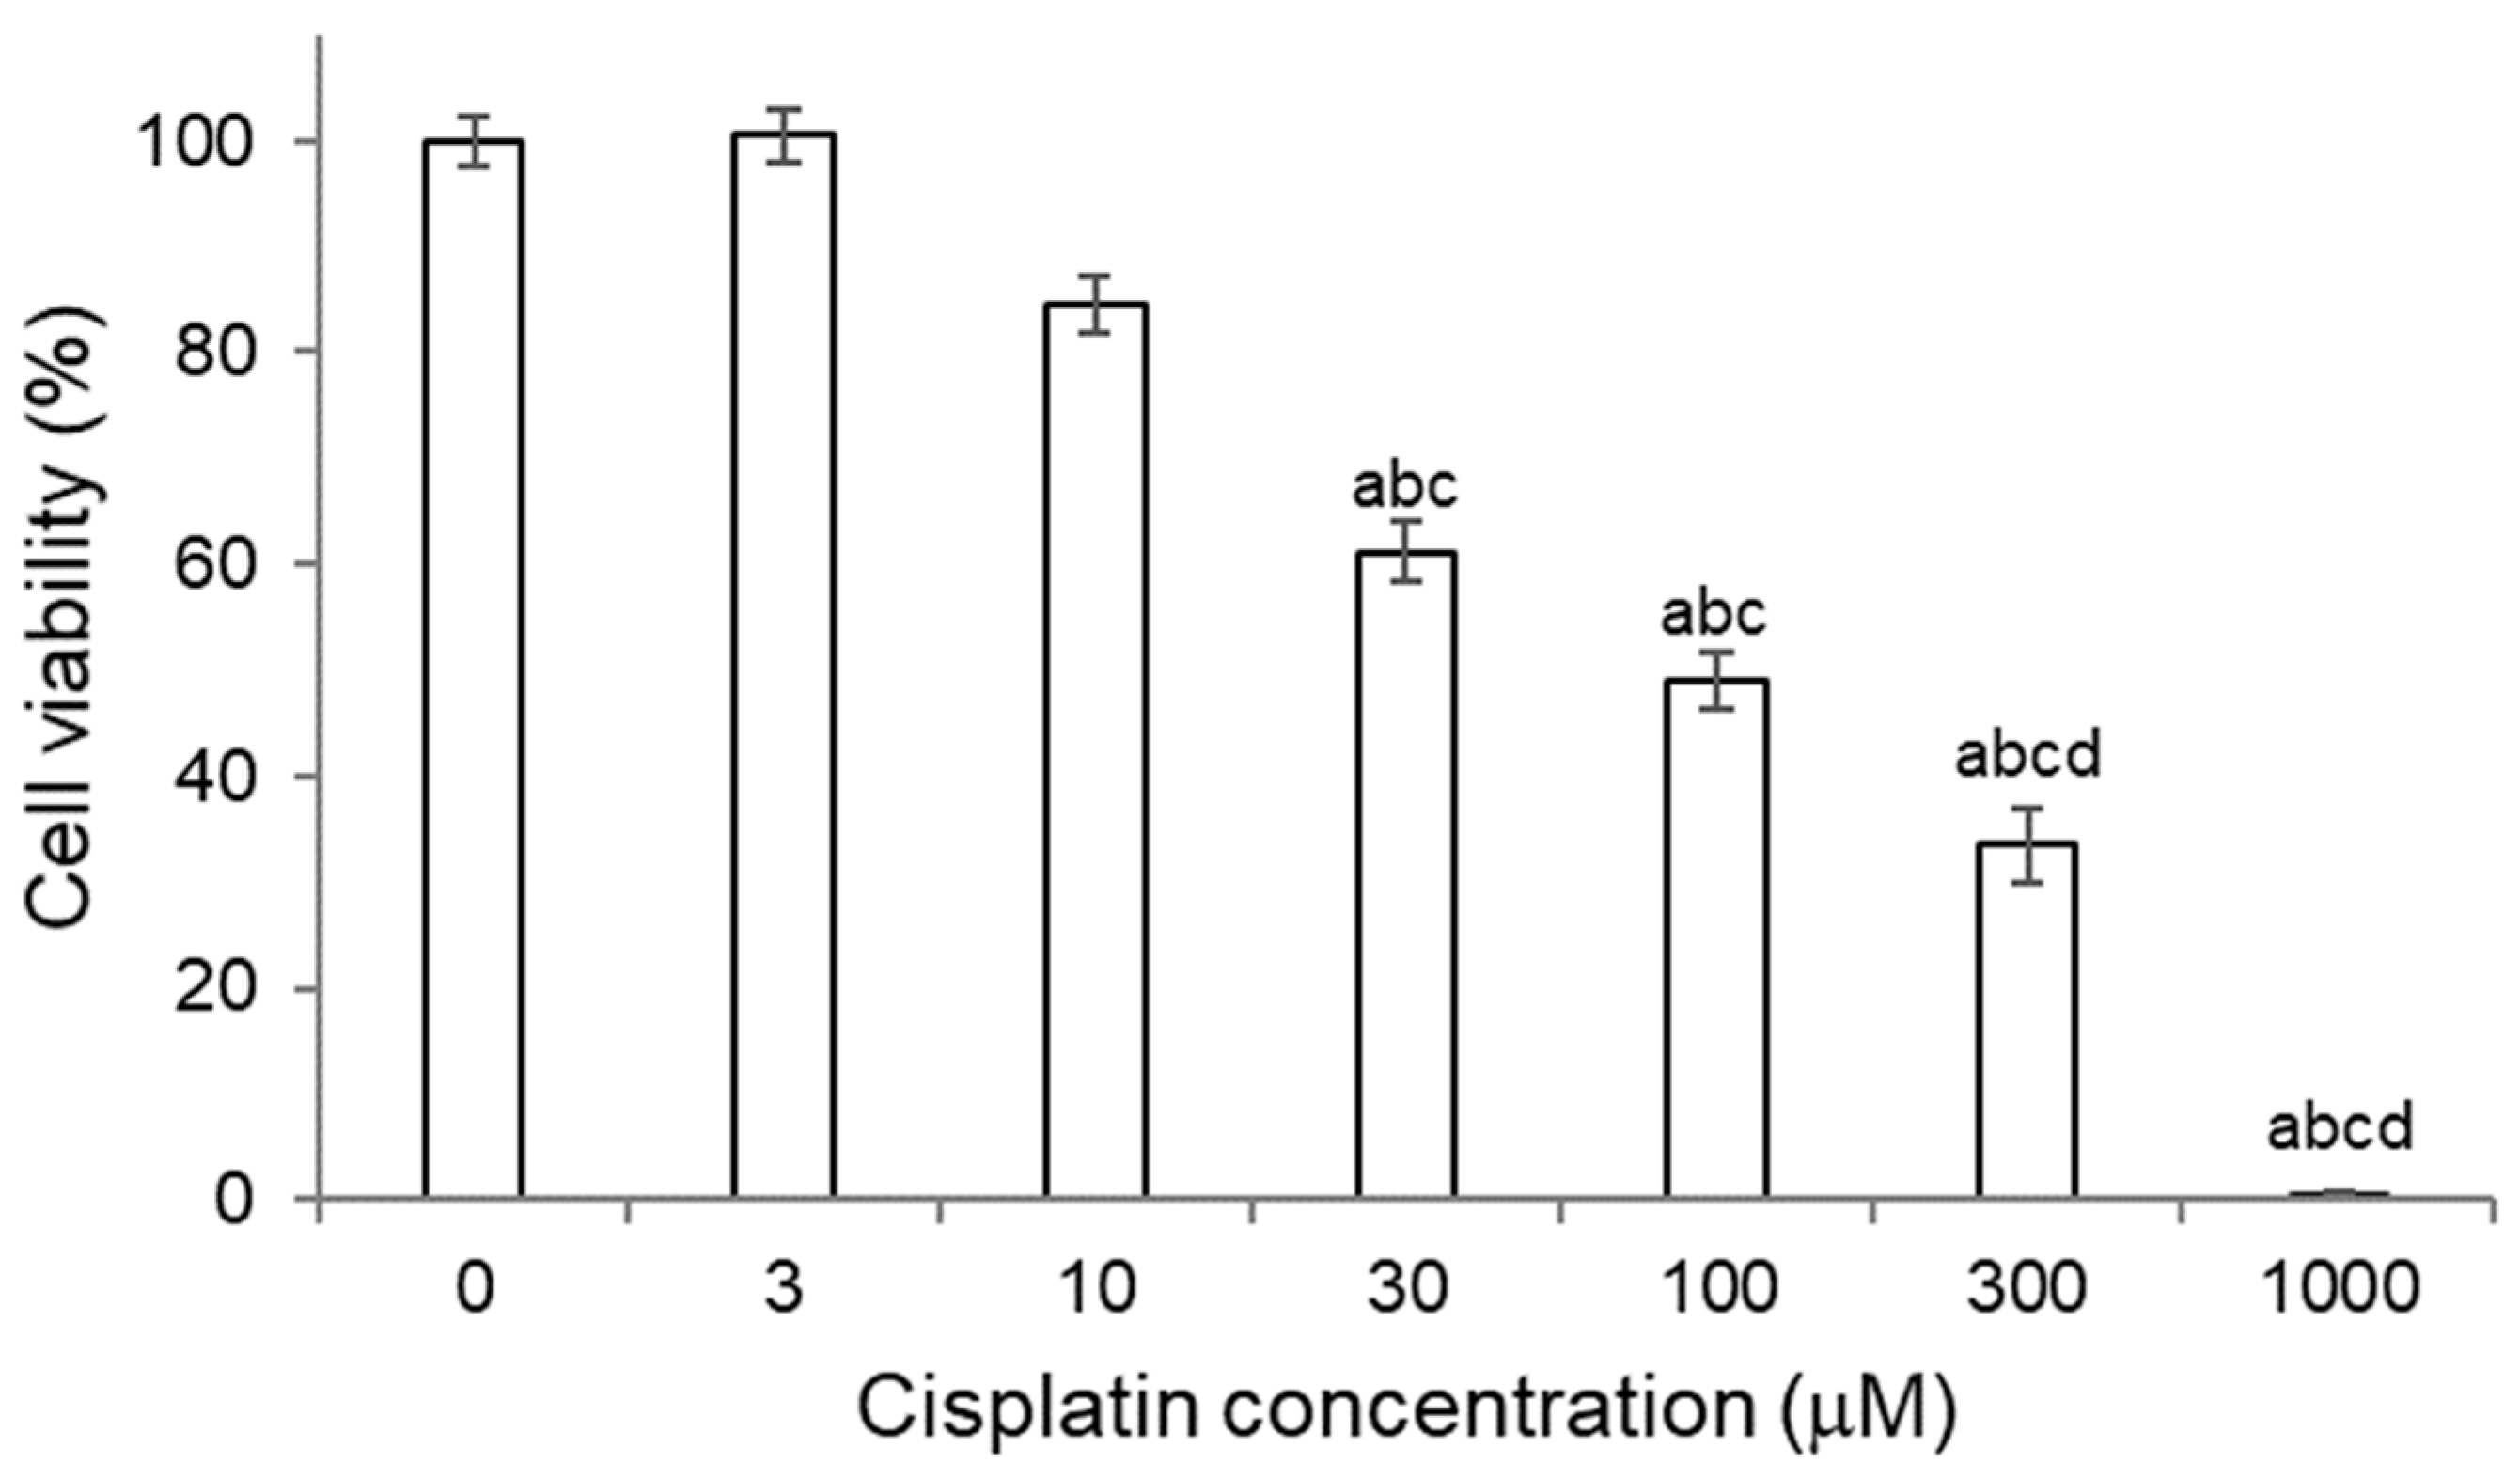
As it can be observed in Figure 3, a decrease in the cell viability of HK-2 cells was produced as the concentration of cisplatin increased. At 10 μM, a decrease in cell viability of approximately 30% was already observed compared to cells without treatment, but the difference was not statistically significant. From a concentration of 30 μM, a statistically significant decrease in cell viability was observed, indicating the presence of cell damage at such concentrations of cisplatin for HK-2 cells.
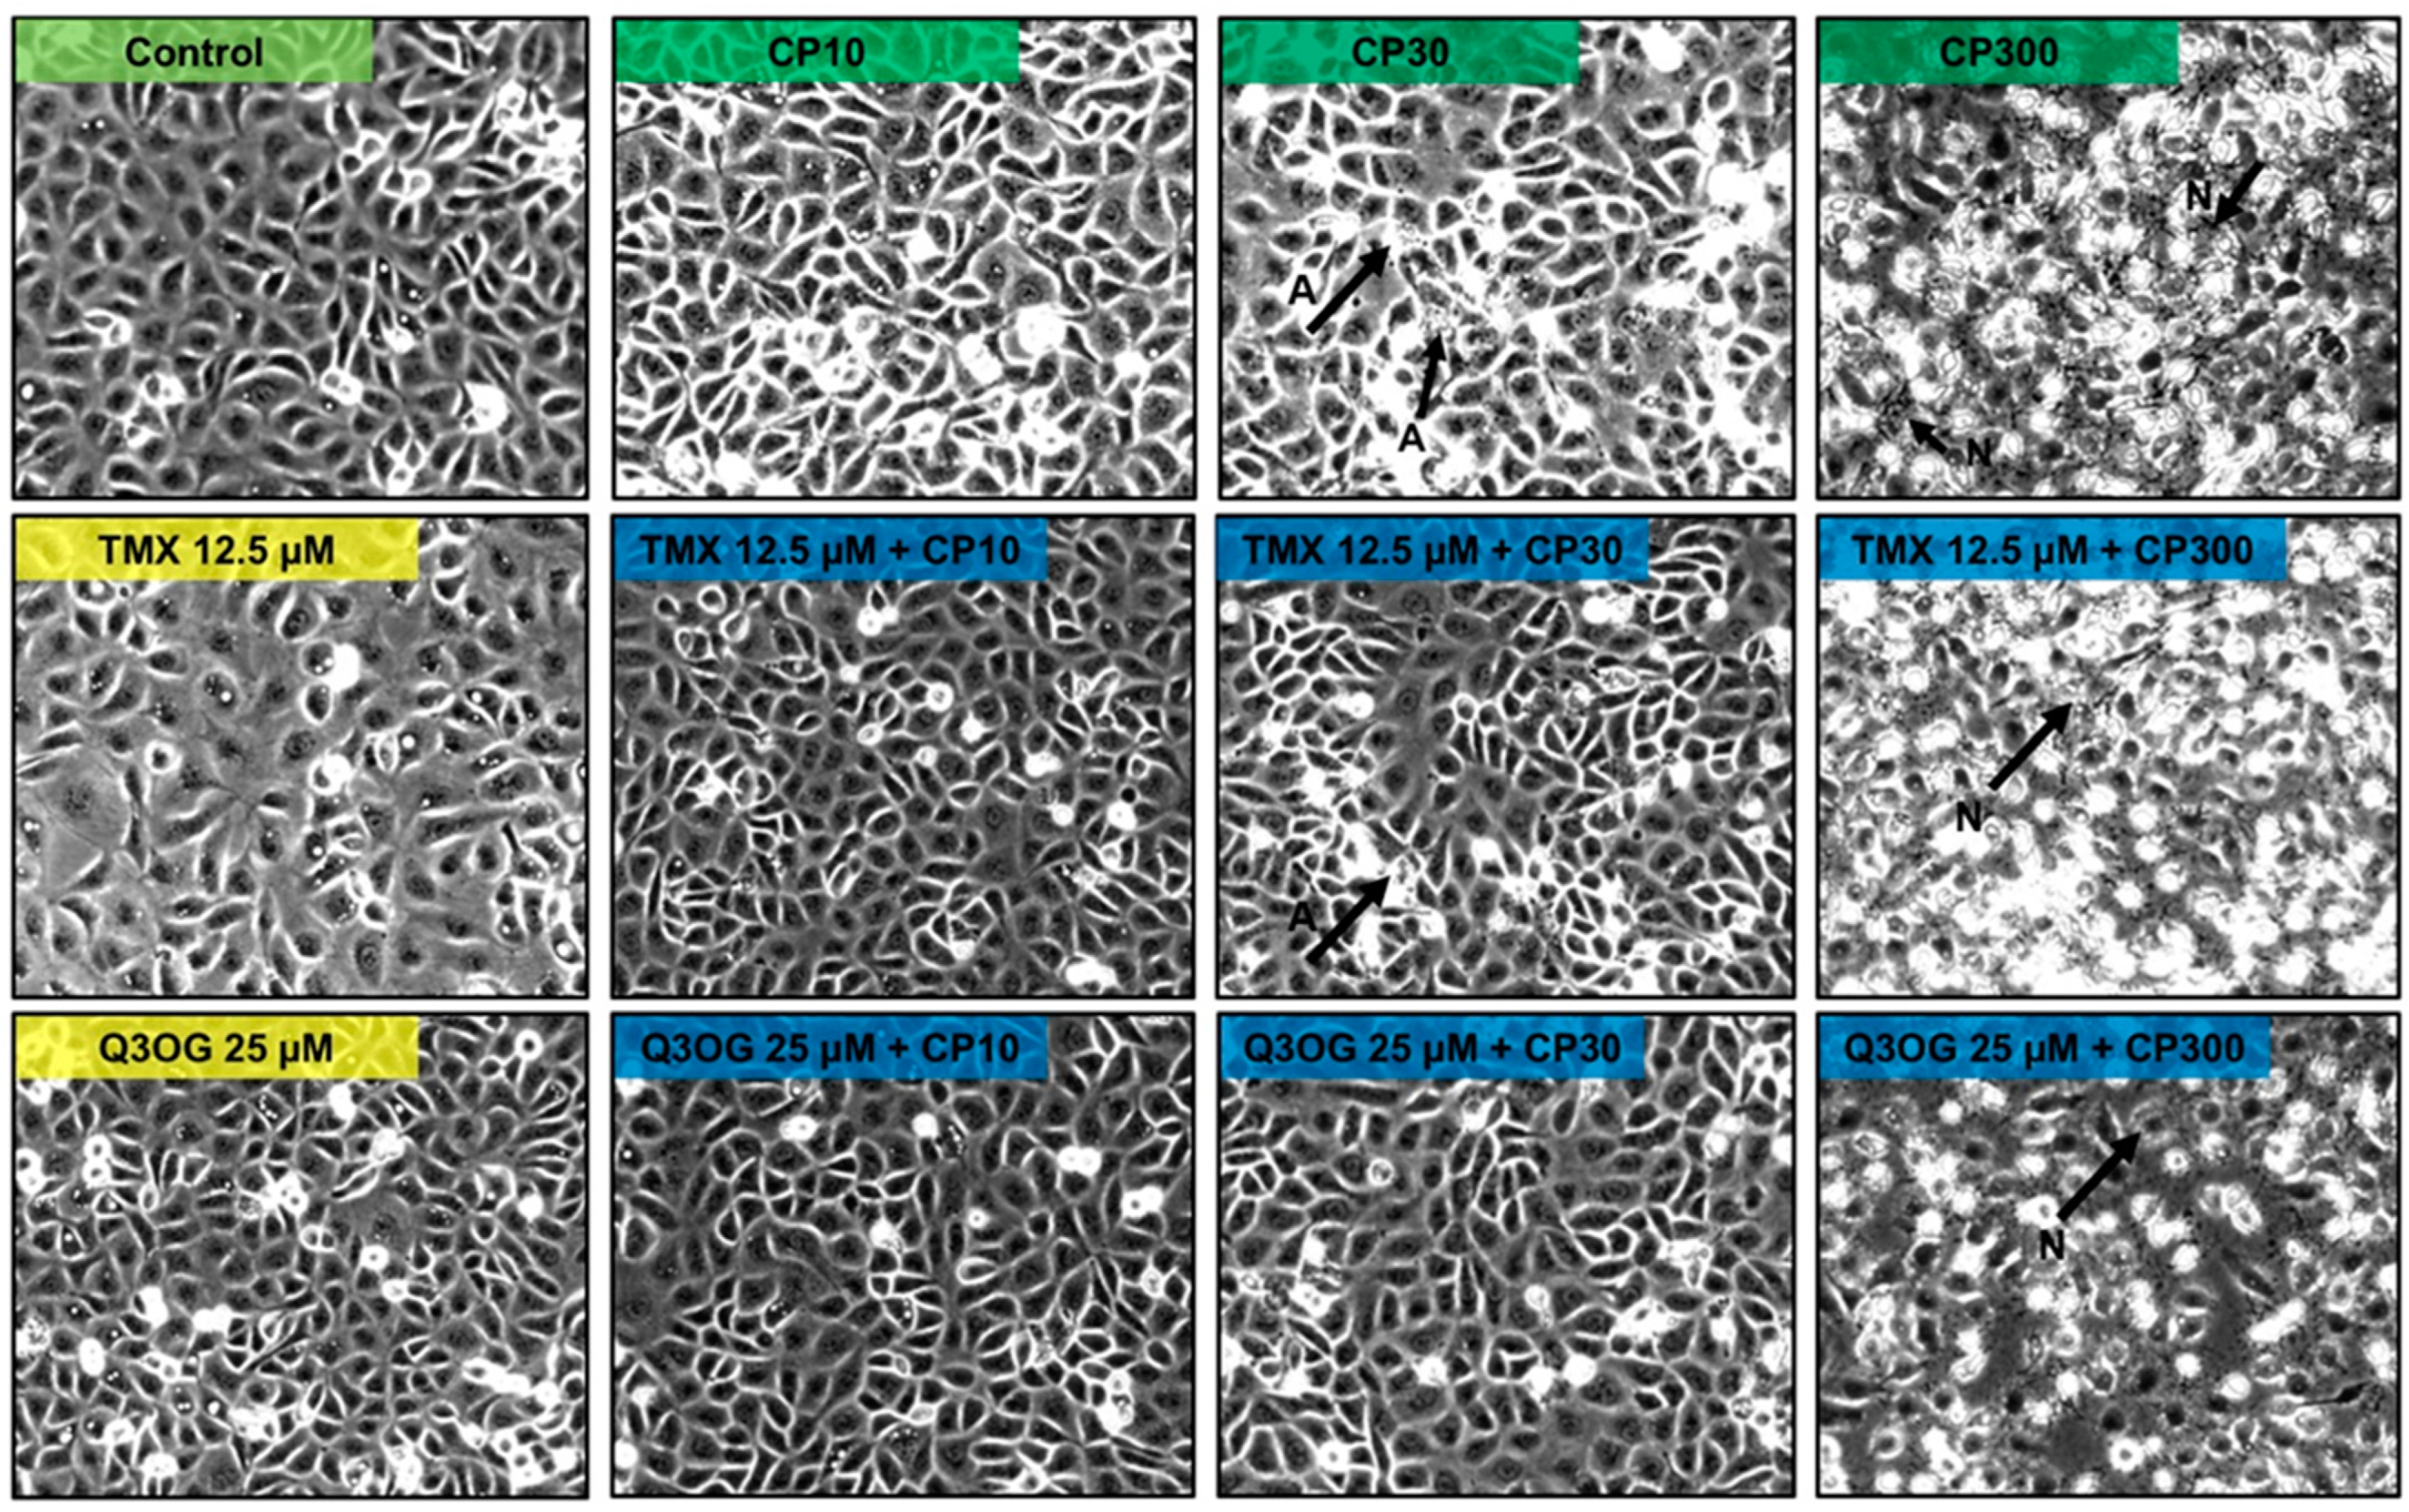
Microscopic images of HK-2 cells treated with different doses of cisplatin confirmed the presence of cell damage, as manifested in cell viability assays (MTT). Compared with the Control group, at a concentration of 10 μM of cisplatin, no cell damage was observed, so this concentration seems to exert an antiproliferative effect (according to MTT). At a concentration of 30 μM of cisplatin, apoptotic bodies and cisplatin-induced changes in cell morphology began to be detected. On the other hand, at 300 μM, necrosis was observed. The cellular phenotype after cisplatin treatment can be a key when evaluating the possible cytoprotection of quercetin metabolites. These results confirm those previously obtained by Sancho-Martínez et al. [5].

2.3.2. Titration of Quercetin and Its Metabolites in HK-2 Cells

In order to know the highest non-toxic concentrations for quercetin and its metabolites, the corresponding cell safety experiments were performed. Concentrations between 0.4–200 μM (Figure S1, Supplementary Material) were tested. The results are summarized in Table 1.
Our results indicated that the highest metabolite concentration not toxic to cells is different among compounds of the same group, such as rutin and quercetin 3-O-glucoside, which are glycosylated compounds. Furthermore, quercetin 3-O-glucoside was the most toxic metabolite of those tested. On the other hand, rutin and quercetin 3-O-glucuronide were the compounds with a greater safety margin, being the concentration of 25 μM, in both cases, the highest non-toxic.

2.3.3. Protection Assays of Quercetin and Its Metabolites against Cisplatin Cytotoxicity in HK-2 Cells

Next, experiments were carried out to test the efficacy of quercetin and its metabolites against the damage of cisplatin. Cytotoxic concentrations of the drug were used according to the viability experiments and the images obtained in the light microscope (see Section 2.3.1): antiproliferative (10 μM), apoptotic (30 μM) and necrotic (300 μM) effect. On the other hand, the highest non-toxic concentration of each metabolite was used for cotreatment with cisplatin, according to Table 1.
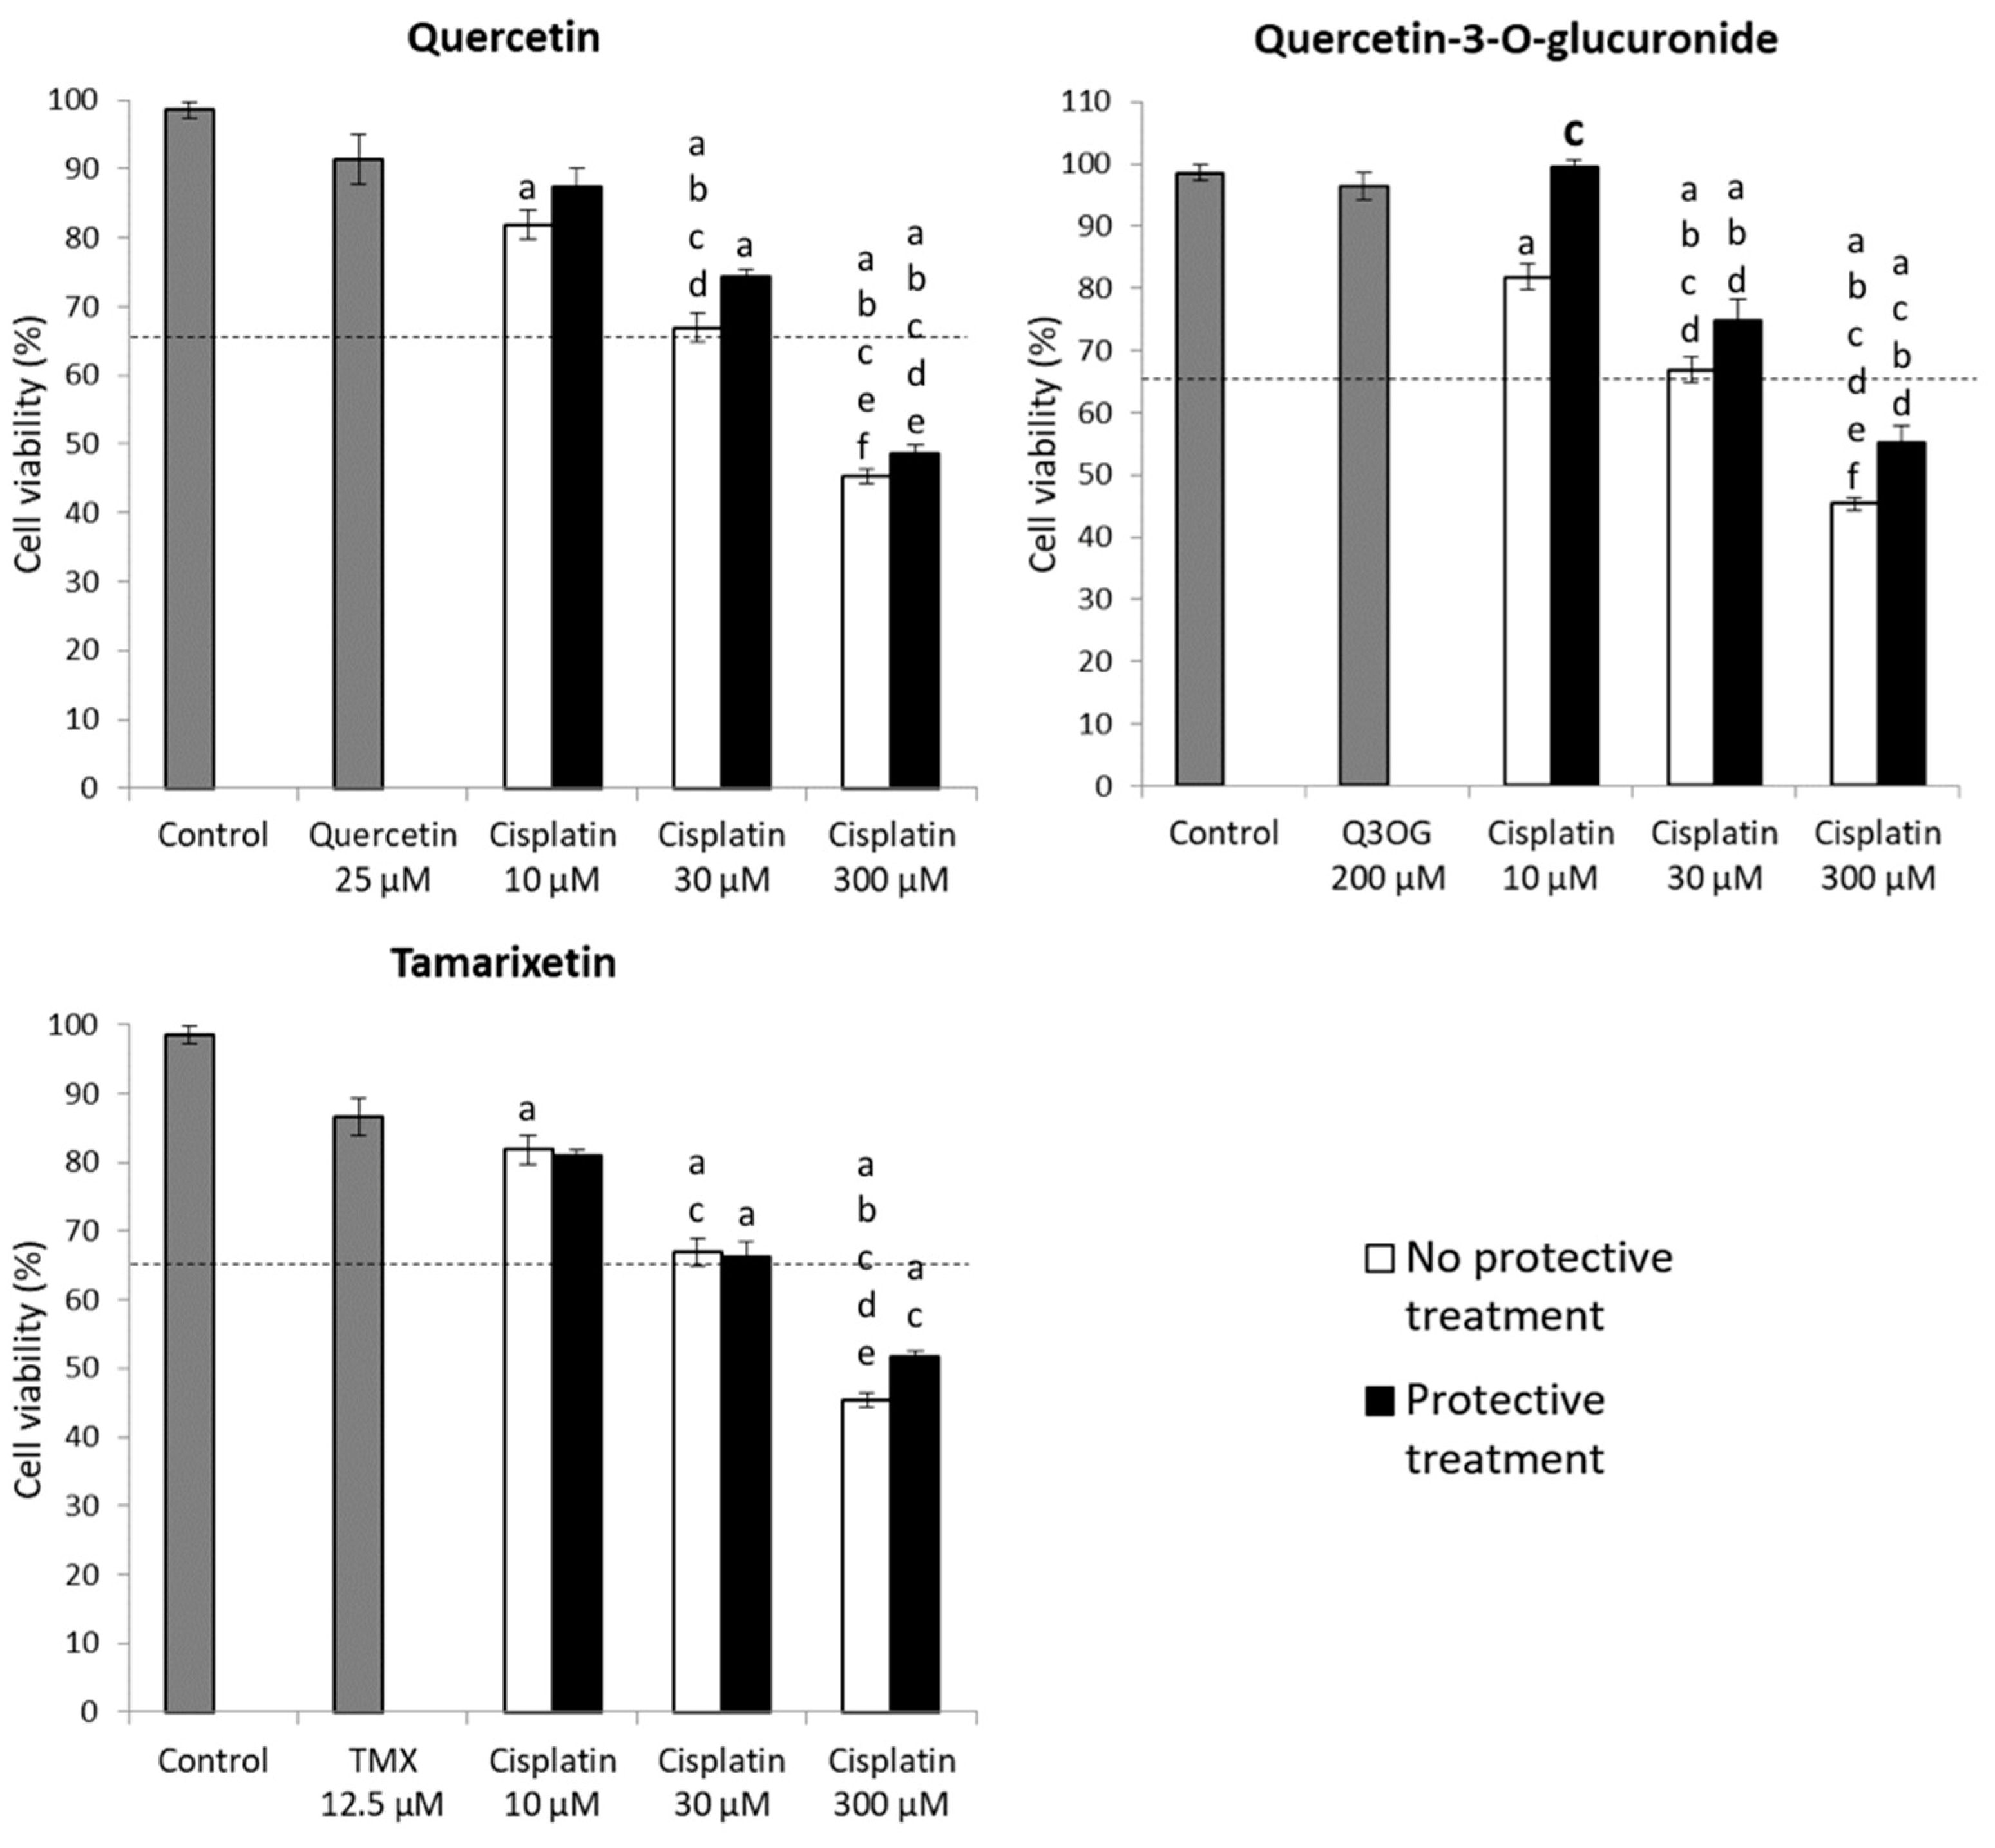
HK-2 cells were subjected to 6-h pretreatments with quercetin/quercetin metabolites and then 18-h cotreatment with cisplatin and the corresponding metabolite. The results obtained for quercetin, quercetin 3-O-glucuronide and tamarixetin are shown in Figure 4. The results for the rest of the metabolites (quercetin 3-O-glucoside, isorhamnetin and rutin) can be consulted in Figure S2 (Supplementary Material).
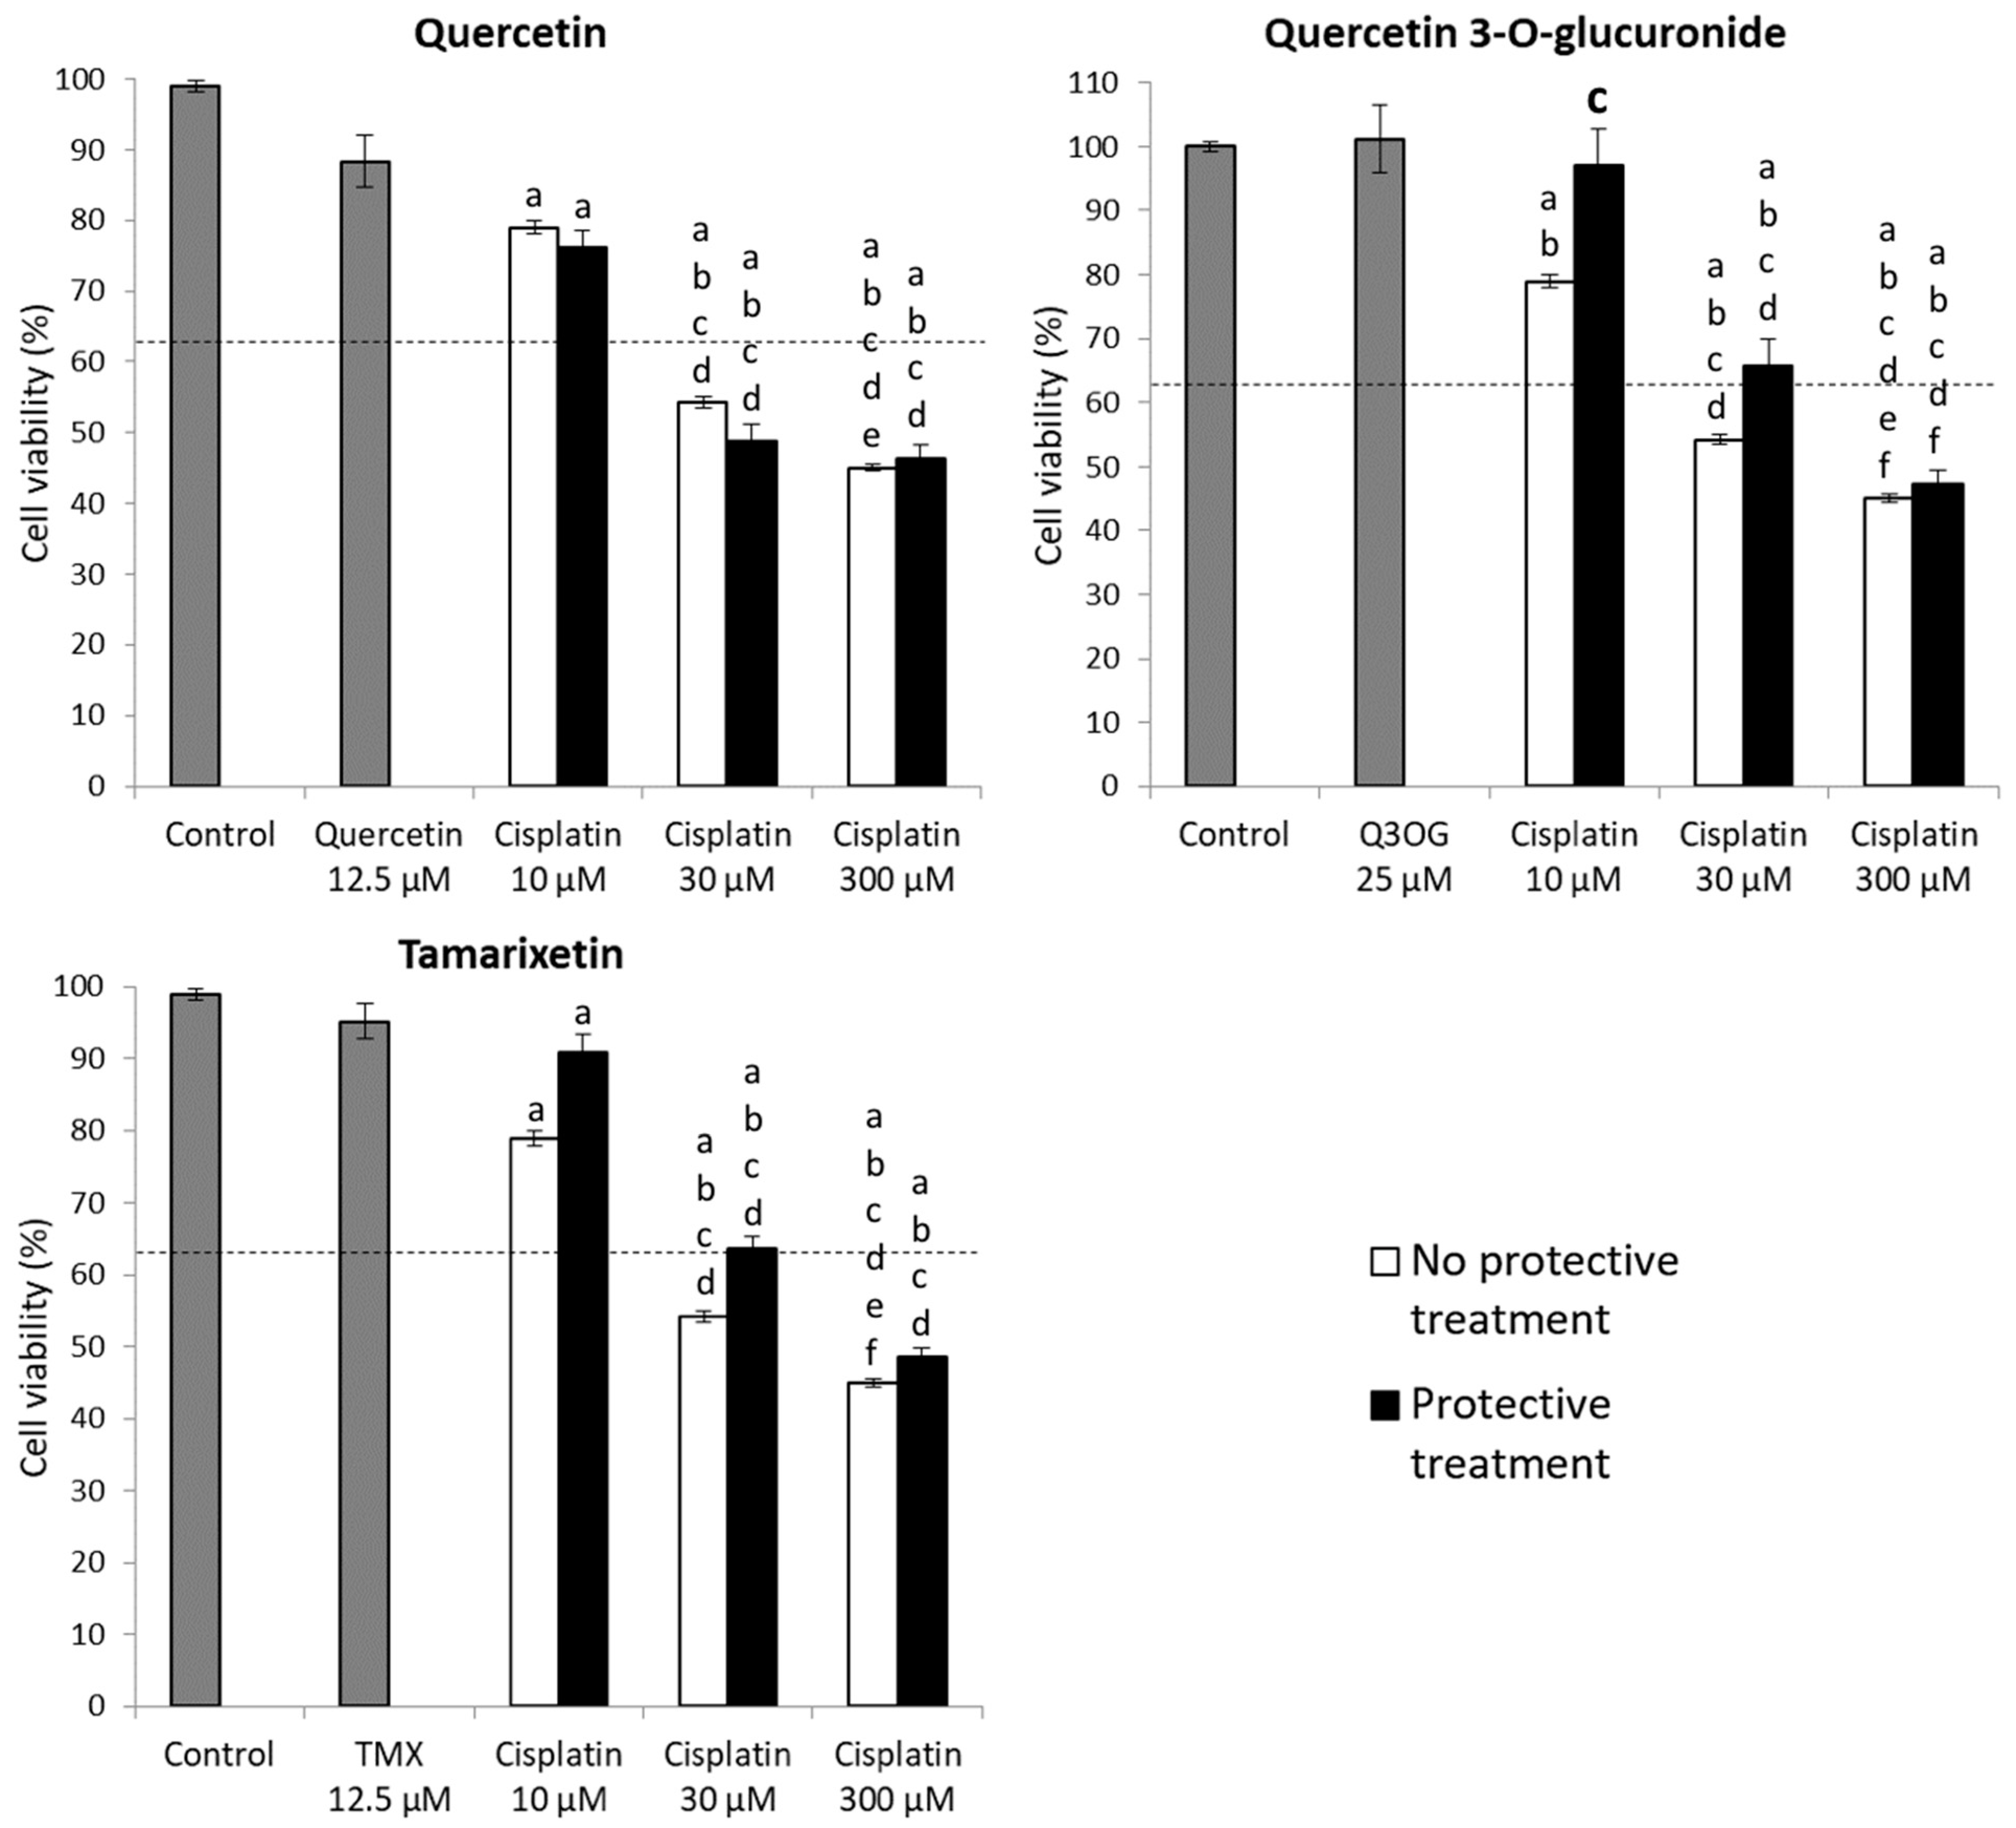
Quercetin, at the dose tested (12.5 μM), did not affect the viability of HK-2 cells. However, its cotreatment with cisplatin was not effective in reversing the decrease in the number of viable cells caused by the drug. Therefore, according to our results, quercetin does not prevent the cytotoxicity of cisplatin in HK-2 cells (Figure 4).
Regarding the action of the glycosylated metabolites, quercetin 3-O-glucoside (0.8 μM) and rutin (25 μM), in cotreatment with cisplatin, no differences were observed with respect to the treatments only with cisplatin at any of the doses tested for the cytotoxic agent (Figure S2).
Regarding the methylated metabolites, the cotreatment of the cells with tamarixetin (12.5 μM) originated an increment on the cell viability profile in cells treated with cisplatin at the three doses tested. Moreover, photos of the cell culture were taken under light microscope, showing that cells cotreated with tamarixetin and cisplatin at doses 10 and 30 μM presented a better status than those treated with the same dose of cisplatin itself (Figure 5). However, these differences were not significant with respect to the single antineoplastic treatment at each of the concentrations (Figure 4). Instead, cotreatment with isorhamnetin (1.56 μM) did not protect from the decrease in cell viability produced by cisplatin; by contrast, an enhancing effect of isorhamnetin on the cytotoxicity of cisplatin was even observed, although the data were not statistically significant (Figure S2).
When the cells were pretreated with quercetin-3-O-glucuronide and, subsequently, cotreated with the metabolite and cisplatin at doses of 10 and 30 μM, an increase in cell viability of, respectively, 20 and 10% was observed, compared to treatments with cisplatin without metabolite (Figure 4). This result indicates that cotreatment with quercetin 3-O-glucuronide induces cellular protection, thus avoiding or reducing the damage caused by cisplatin. In fact, photos of the cell culture showed that cells cotreated with quercetin 3-O-glucuronide and cisplatin, at the three doses tested, presented a better status than those treated with the same dose of cisplatin itself (Figure 5). However, in the second case (cotreatment with cisplatin 30 μM) the results were not statistically significant, although a cytotoprotection profile was observed.

2.4. Evaluation of the Protective Capacity of Quercetin and Its Metabolites against Cisplatin Cytotoxicity in NRK-52E Cells

Considering the results obtained in HK-2 cells for quercetin 3-O-glucuronide (see Section 2.3), it was decided to corroborate the cytoprotective effect of the metabolite in a different tubular cell line. Thus, the NRK-52E cell line was used for several reasons: first of all, they are cells from rats, which allowed us to evaluate the effect of quercetin 3-O-glucuronide in a different species (HK-2 cells come from human kidney). Second, they are renal epithelial cells [24], so they have a less specific origin than HK-2 cells, which are defined as proximal tubule cells [23].
The experiments with NRK-52E cells were carried out with only three compounds: quercetin (reference molecule in our experiments), quercetin 3-O-glucuronide and tamarixetin. The latter was introduced based on the good cytoprotective tendency observed in the experiments with HK-2 cells (see Section 2.3.3).

2.4.1. Titration of Cisplatin in NRK-52E Cells

In the same way, the cytotoxicity of cisplatin was determined in NRK-52E cells. The aim was to find the cisplatin concentrations that gave rise to the same phenotypes found in HK-2 cells (antiproliferative, apoptotic and necrotic effects) via MTT assay and light microscope photos, to subsequently perform cytoprotection experiments with these concentrations.
A decrease in the viability of NRK-52E cells was observed (Figure 6) as the cisplatin concentration increased, quite similar to what we had previously observed for HK-2 cells (see Section 2.3.1). At the 10 μM concentration of cisplatin, a decrease in cell viability of approximately 20% compared to cells without treatment was found, but the difference was not statistically significant compared to the control. From 30 µM, a statistically significant decrease in cell viability was observed, indicating the presence of cell damage at such concentrations of cisplatin for NRK-52E cells.
The images of NRK-52E cells treated with different doses of cisplatin confirmed the presence of cellular damage, observing a similar phenotype to that of HK-2 cells at the same doses: cisplatin 10 μM concentration did not produce apparent changes in cell morphology, for which it seems to exert an antiproliferative effect according to MTT, while at a concentration of 30 μM of cisplatin, the formation of apoptotic bodies began to be observed. At 300 μM, death by necrosis was observed.

2.4.2. Titration of Quercetin and Its Metabolites in NRK-52E

In order to know the highest non-toxic concentrations for each metabolite in NRK-52E cells, cell safety experiments were assessed. Doses between 0.4–200 μM (Figure S3, Supplementary Material) were tested for each metabolite. The results are summarized in Table 2.
The data indicated that tamarixetin was the most toxic metabolite of those tested, while quercetin had an intermediate cellular safety range. On the other hand, quercetin 3-O-glucuronide was the compound that revealed the highest safety range, being 200 μM the highest non-toxic concentration of those evaluated. It is noteworthy that the safety range of the glucuronide was 4 times higher than in HK-2 cells.

2.4.3. Protection Assays of Quercetin and Its Metabolites against Cisplatin Cytotoxicity in NRK-52E Cells

Efficacy experiments were carried out in NRK-52E cells to check whether quercetin metabolites had a protective effect against cisplatin damage. Cytotoxic cisplatin concentrations were used according to the viability experiments (MTT) and the images obtained under the light microscope: antiproliferative (10 μM), apoptotic (30 μM) and necrotic (300 μM) effect. On the other hand, the highest non-toxic concentration of each metabolite was used for cotreatment with cisplatin, according to Table 2.
A 6-h pretreatment with quercetin/quercetin metabolite was performed, followed by an 18-h cotreatment with cisplatin and the corresponding compound. The results are presented in Figure 7 and Figure 8.
Cotreatment with quercetin 25 μM and cisplatin resulted in a mild increase in cell viability for the three concentrations of cisplatin tested, compared to the single treatment with the drug, although the differences were not significant. On the other hand, cotreatment with tamarixetin and cisplatin made no difference compared to treatment without the metabolite. Therefore, tamarixetin does not appear to protect against drug-induced damage in our experiments with NRK-52E cells (Figure 7).
As with HK-2 cells, in NRK-52E cells the most interesting results were found with quercetin 3-O-glucuronide. When cells are pretreated and subsequently cotreated with the metabolite in combination with cisplatin at concentrations of 10, 30 and 300 μM, an increase in cell viability of 20, 10 and 10%, respectively, was observed, in comparison with treatments without metabolite. This result indicates that glucuronide cotreatment at a concentration of 200 μM induces cellular protection, thus avoiding or reducing the damage caused by cisplatin. Nevertheless, the results were not statistically significant for the cotreatment with cisplatin 30 and 300 μM and glucuronide. Therefore, it can be stated that quercetin 3-O-glucuronide, according to our results, protects against cisplatin damage partially (Figure 7 and Figure 8).

3. Discussion

In our experiments, quercetin 3-O-glucuronide induced cellular protection in the two tubular cell lines assessed, HK-2 and NRK-52E, since it was able to palliate the cytotoxic effect of cisplatin. In fact, the drug produced an antiproliferative effect at 10 μM concentration, which was reversed by the cotreatment with the quercetin metabolite. In contrast, at higher cisplatin concentrations (30 and 300 μM), no statistically significant results were obtained, although a cytoprotective trend was also observed at these concentrations. Therefore, the glucuronide appears to exert a moderate cytoprotective effect, preventing the cytotoxic effect caused by cisplatin at antiproliferative drug concentrations, and reducing the cell death caused by the drug at higher concentrations partially.
Based on those results, quercetin 3-O-glucuronide could be responsible, at least in part, for the nephroprotective effect of quercetin against cisplatin damage observed in vivo [3,15]. Furthermore, the protective effect of the metabolite could explain our in vivo results regarding to the absence of protection of oral P-quercetin, when the same formulation has previously been shown to be effective intraperitoneally [16]. The differences observed between the administration of P-quercetin by the intraperitoneal and oral vias cannot be explained by its absorption, since it seems to be very similar for both routes. However, plasma concentration of some quercetin metabolites was different, which might be explained by possible pharmacokinetic differences between both vias [25]. After i.p. administration, metabolism in enterocytes does not take place [12], while a first-pass effect occurs via p.o., with the compound being biotransformed before entering systemic circulation [26]. Therefore, the nephroprotection of quercetin against cisplatin could be related to the concentrations reached in the kidney by quercetin itself or its metabolites, which could be different depending on the administration route of the flavonoid. A relevant metabolite could be quercetin 3-O-glucuronide, according to our in vitro results.
Quercetin 3-O-glucuronide is one of the most common quercetin metabolites produced by phase II biotransformation in small intestine and liver cells, besides sulfated and methylated derivatives [27]. Once in the kidney, the entry of quercetin metabolites in tubular cells takes place mainly through influx transporters in the basolateral membrane and transporters in the apical membrane via tubular reabsorption [28]. It has been reported that glucuronide conjugates, such as quercetin 3’-O-glucuronide, have a high affinity for OAT3, whereas quercetin 3-O-glucuronide and quercetin 7-O-glucuronide are weak substrates of OAT1 and OAT3 [29]. Thus, it can be speculated that the use of quercetin 3’-O-glucuronide might still improve the cytoprotective effect observed for quercetin 3-O-glucuronide in the present work. It has also been suggested that these metabolites could be involved in the induction of antioxidant defense mechanisms through inducing the expression of antioxidant enzymes [12]. In addition, some published studies have demonstrated therapeutic effects of glucuronide metabolites [30,31]. In the kidney, an organ where metabolites accumulate to be eliminated, some glucuronides have been shown to have a biological effect. For example, they can reduce oxidative stress [32] or hypoxia signals in kidney cells [33]. On the other hand, other glucuronides behave as active compounds, increasing the prodrug toxicity [34,35]. Therefore, the biological activity of some glucuronide metabolites has been previously demonstrated. All in all, quercetin 3-O-glucuronide would reach kidney tissue through systemic distribution [36], and could exert a cytoprotective effect at the tubular level as indicated by our results. Nonetheless, the mechanisms by which the glucuronide exerts its protective effects from cisplatin toxicity must still be unveiled.
Cotreatment of quercetin aglycone, glycosylated derivatives (quercetin 3-O-glucoside and rutin), or methylated derivatives (tamarixetin and isorhamnetin) with cisplatin did not protect against drug cytotoxicity in our experiments. However, quercetin glycosides are present in human urine samples after ingesting foods rich in quercetin, whereas they are not present in plasma. This implies that they are formed in the kidney in situ based on local metabolism [12]. It should not be ruled out that glycosides are involved in nephroprotection, perhaps by action on other renal cells.
It either cannot be ruled out that aglycone could be responsible for the cytoprotective effect, since there are deconjugation processes in the tubular cell to give rise to aglycone [10]. Indeed, it has been reported that conjugation is a reversible process and glucuronides, but not sulfates, can be deconjugated at tissue level, yielding the parent aglycone, which could be the actual active form [37,38]. In fact, the tubular cells present all the enzymatic machinery to carry out a third biotransformation of quercetin in the kidney, which may contribute to the final concentrations reached in the kidney of quercetin and its metabolites. The high β-glucuronidase activity in tubular epithelial cells can, thus, be responsible for the deconjugation of glucuronides, to give rise to quercetin aglycone [12]. However, it has also been described that this deglucuronidation could be followed by instantaneous sulfation, and subsequent reglucuronidation [10]. This is consistent with the idea that glucuronide derivatives (and specifically quercetin 3-O-glucuronide) can be responsible, at least in part, for the protective effects of quercetin in the tubular cell.
The obtained results are very similar in both tubular cell lines, HK-2 and NRK-52E, despite the fact that, theoretically, there are some differences between them. HK-2 are defined as proximal tubule cells, while NRK-52E are renal epithelial cells, so they have a less specific origin. These differences could explain the results obtained with tamarixetin, a metabolite that seems to exert a certain cytoprotective action in the proximal tubule (HK-2), while this effect could be masked when carrying out the experiments with NRK-52E. However, this hypothesis needs to be analyzed more deeply.
Taking into account that the cytoprotective effect observed for quercetin 3-O-glucuronide in our experiments is partial and that quercetin metabolism is very complex [12], it is conceivable that the nephroprotective effect of quercetin observed in vivo could be the result of the joint action of several metabolites and on other targets in addition to the tubular cell. In fact, besides tubular protection, beneficial effects of quercetin have also been demonstrated at the hemodynamic level [39,40], which contribute to the blood supply of the kidney and the maintenance of the glomerular filtration rate when the flavonoid is coadministered with cisplatin [3]. In addition, according to in vitro studies, vasodilator effect can be exerted by both quercetin and isorhamnetin [41,42], which supports the idea that the metabolites could contribute to the in vivo effects of quercetin.
A strategy for future nephroprotection experiments could consist of administrating quercetin 3-O-glucuronide p.o. The administration of the glucuronide metabolite would facilitate access to the tubular cell, as well as its renal metabolism and accumulation. Although we are aware that quercetin glucuronide has shown a moderate cytoprotective effect, this strategy could be a further advance in the nephroprotective application of quercetin.

4. Materials and Methods

4.1. Animals and Bioethics

All procedures were approved by the Bioethics Committee of the University of Salamanca and the Regional Government of Castile and Leon, Ministry of Agriculture and Livestock (code: 0000075, 29 April 2016). Animals were handled according to the guidelines of the European Community Council Directive 2010/63/UE and to the current Spanish legislation for experimental animal use and care (RD 53/2013, 1 February 2013). Male Wistar rats (200–250 g) were maintained under controlled environmental conditions, with free access to water and standard chow.

4.2. Nephroprotection Study with Oral P-quercetin

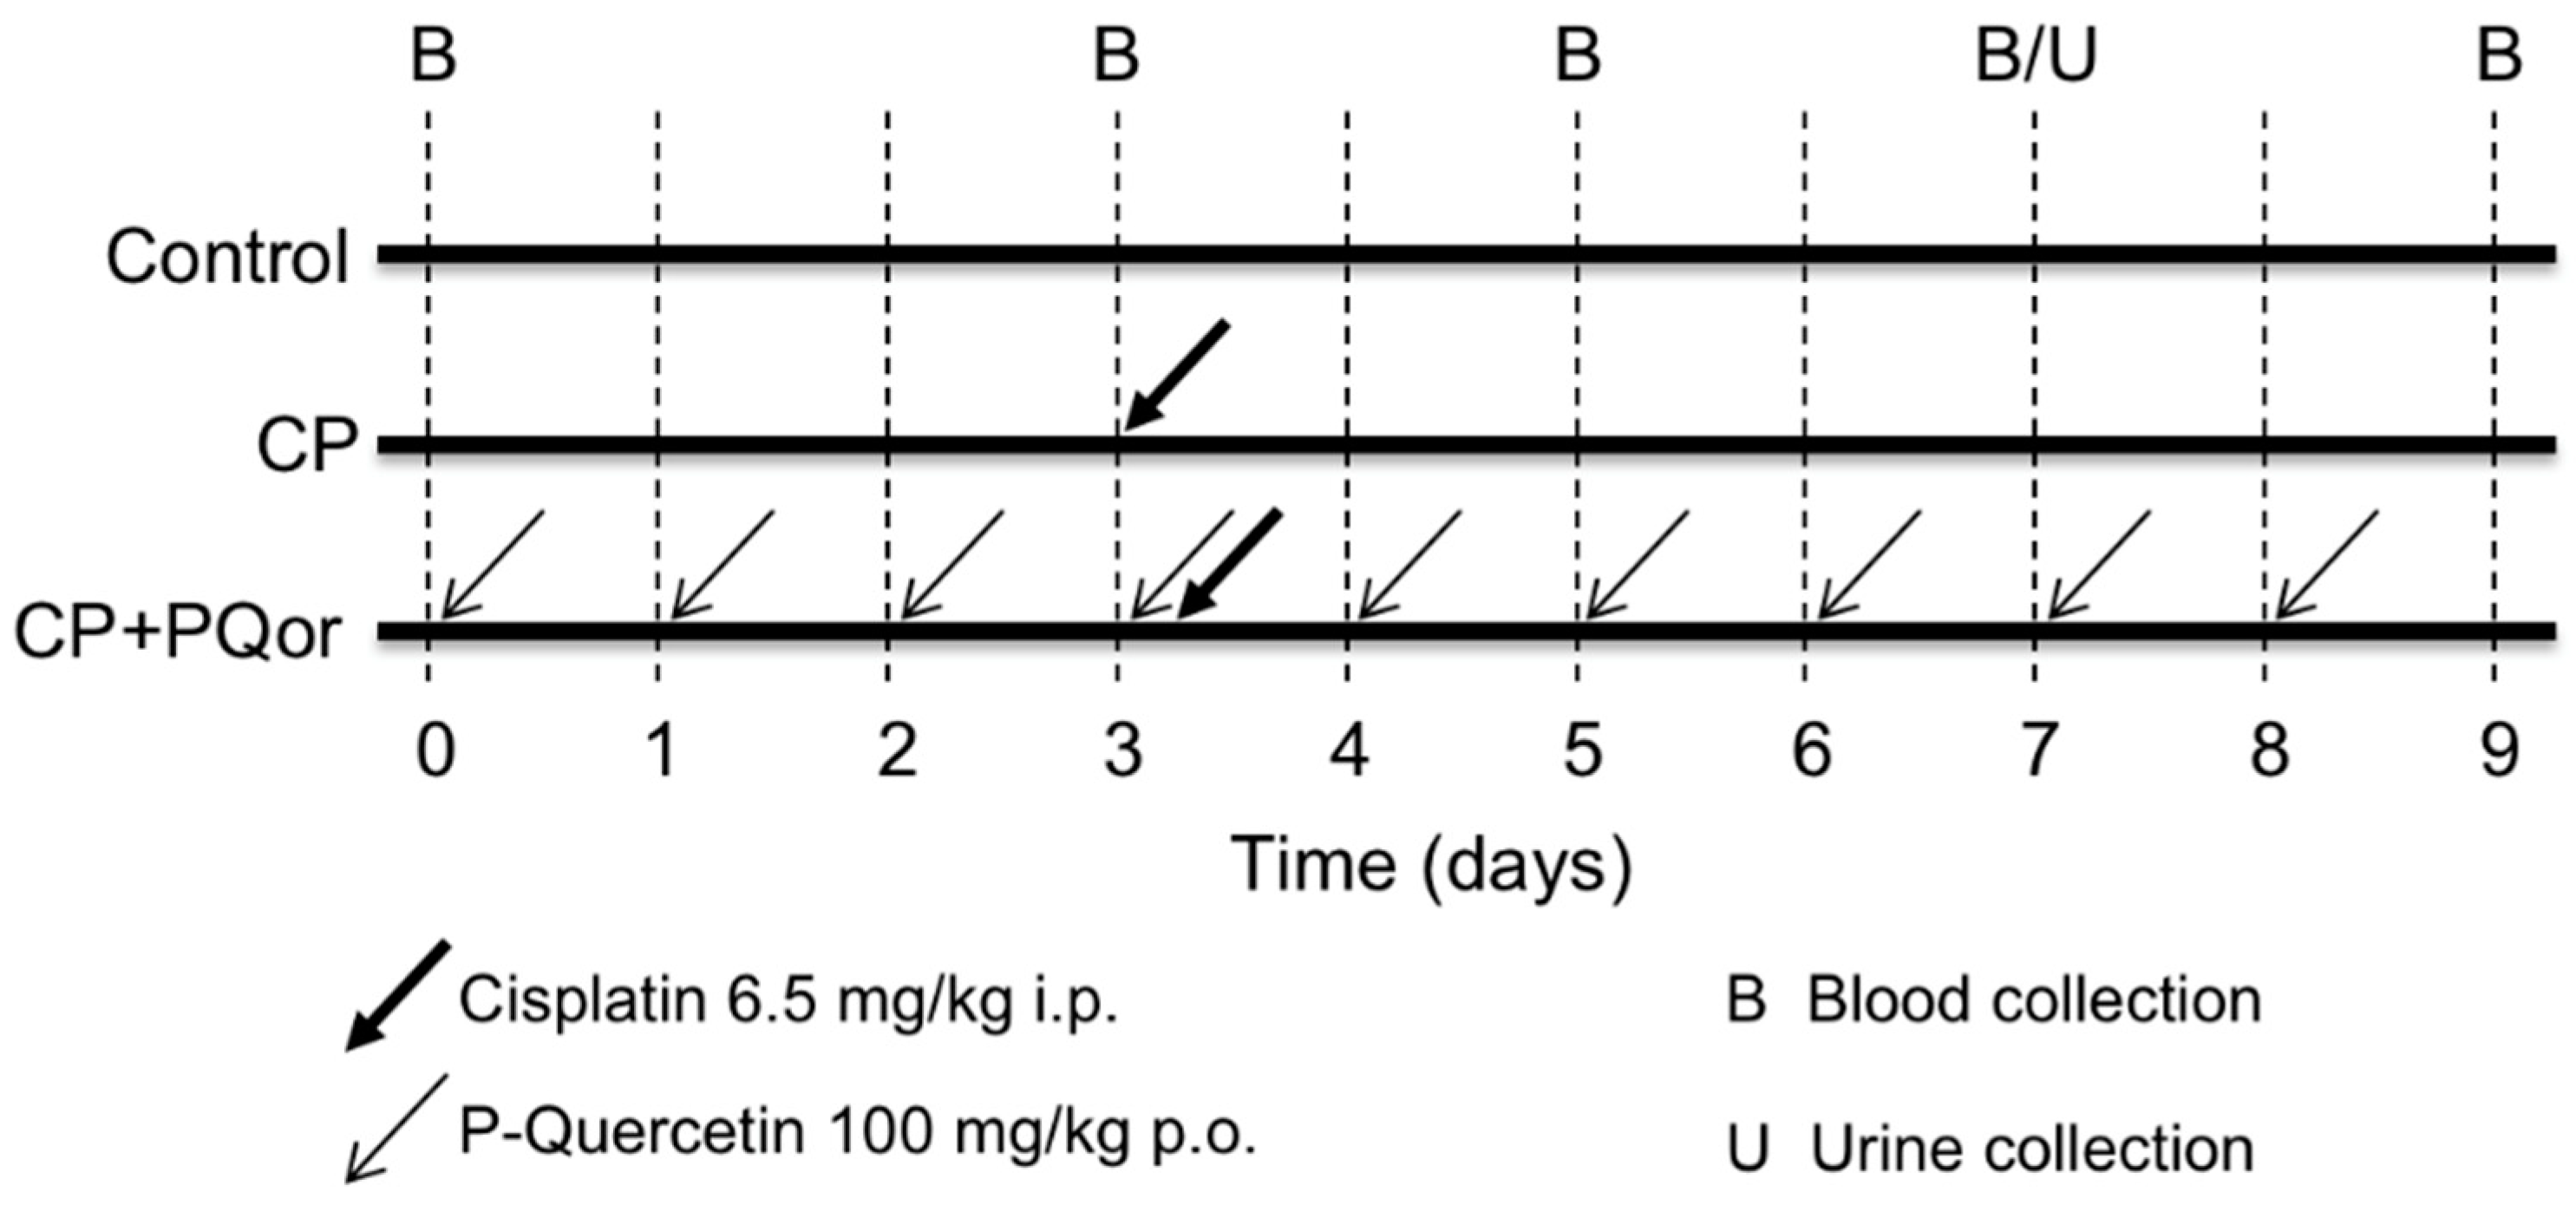
A cisplatin nephrotoxicity model previously developed in our laboratory was used [16]. Rats were divided into three experimental groups (Figure 9): Control (n = 3), animals received vehicle (water) orally through a intragastric gavage (p.o.) for 9 days; CP (n = 5), animals received water p.o. for 9 days and a single nephrotoxic dose of cisplatin in NaCl 0.9% (6.5 mg/kg, i.p.) (Merck, Darmstadt, Germany) on day 3 of the experiment; and CP+PQor (n = 6) animals received a daily dose of P-quercetin (100 mg/kg, p.o., through a intragastric gavage (i.e., containing 50 mg/kg quercetin)) for 9 days and a dose of cisplatin in NaCl 0.9% (6.5 mg/kg, i.p.) on day 3. P-quercetin is a micellar formulation of quercetin, prepared as described previously [43].
Blood samples (150 μL) were collected on days 0, 3, 5, 7 and 9 in heparinized capillaries from a small incision in the tail tip. Plasma was separated by centrifugation (11,000 rpm for 3 min) and kept at −80 °C. On day 7 (time of maximum nephrotoxicity), 24 h urine was collected in metabolic cages, cleared by centrifugation (2000× g for 9 min) and stored at −80 °C. At the end of the experiment (day 9), rats were anesthetized and sacrificed by exsanguination.

4.3. Analysis of Quercetin and Its Metabolites in Blood and Urine Samples

A pilot assay was carried out in order to analyze the presence of quercetin and its metabolites in biological samples after the administration of P-quercetin orally and i.p. Two rats were treated with P-quercetin, p.o, at the dose of 100 mg/kg/day, for 3 days. Two other rats were simultaneously treated with the same dose, but administering the formulation i.p. On the fourth day, blood and urine (24 h) samples were collected and the rats were sacrificed by exsanguination. Blood and urine samples were processed as described in Section 4.2.
For HPLC analysis, 100 μL of plasma was taken and 300 μL of methanol was added. It was vortexed for one minute and centrifuged at 12,000 rpm for 10 min. Subsequently, the supernatant was collected, brought to dryness in the speedvac and the residue was redissolved in 120 μL of acetonitrile: 0.1% formic acid (20:80). In the case of urine samples, the protocol proposed by Mullen et al. [44] was followed, based on direct urine analysis. 200 μL of urine was taken and 10 μL of methanol was added in order to precipitate proteins. The samples were then shaken, centrifuged and injected into the HPLC system. Analysis were carried out by HPLC-DAD-ESI-MS as described elsewhere [45]. A Hewlett-Packard 1200 chromatograph (Agilent Technologies, Waldbronn, Germany) connected to an API 3200 138 Qtrap (Applied 139 Biosystems, Darmstadt, Germany) mass spectrometer was used. For detection, 280, 330 and 370 nm were selected as preferred wavelengths for the DAD and the MS was operated in the negative ion mode, spectra were recorded between m/z 100 and m/z 1500. The phenolic metabolites were identified by using data reported from literature and by comparison with our database library. All samples were analyzed in duplicate.

4.4. Renal Cells

Kidney tubular cells were used: HK-2 cells (human kidney 2), it is an immortalized proximal tubule cell line obtained from healthy human kidney (Ref: ATCC, CRL-2190), and NRK-52E (normal rat kidney), is an immortalized cell line of epithelial origin obtained from the rat (Ref: ATCC, CRL-1571). The culture medium for the HK-2 used was RPMI-1640 (Merck, Darmstadt, Germany), supplemented with fetal bovine serum (FBS) (10%) (ThermoFisher, Waltham, MA, USA), L-glutamine (1 mM) (Merck, Darmstadt, Germany) and penicillin-streptomycin (500 U/mL) (Merck, Darmstadt, Germany). For the NRK-52E, a DMEM medium was used: F12 with HEPES, glucose and L-glutamine (Lonza, Basel, Switzerland), supplemented with FBS (10%) and penicillin-streptomycin (500 U/mL).
All cell culture procedures were performed in a laminar flow hood using sterile material. The cells were incubated at 37 °C in a humid atmosphere, with 5% CO2.

4.5. Quercetin Metabolites

Quercetin and its metabolites isorhamnetin, tamarixetin, quercetin 3-O-glucoside, rutin and quercetin 3-O-glucuronide (Figure 10), were used in the experiments carried out. All compounds were from Merck (Darmstadt, Germany) with the exception of quercetin (Acros Organics, Madrid, Spain) and tamarixetin (Cymit Química, Barcelona, Spain).
All of them were dissolved in dimethylsulfoxide (DMSO) and stored at −80 °C, in order to have a 0.1 M stock solution.

4.6. Design of Experiments In Vitro

24-well plates (15.6 mm diameter) were used to carry out the experiments. After trypsinize and counting the cells, 35,000 cells were seeded per well. Once they had adhered and were at 70% confluence, the experiments were started. The final volume in each well was 500 µL. In each experiment, four duplicates (wells) were made for each experimental condition.

4.6.1. Titration of Cisplatin

Cisplatin (Merck, Darmstadt, Germany) titration in both cell types was performed as previously described [5]. Three experiments were performed for each tested cisplatin concentration (0–1000 µM). For the preparation of the solutions at different concentrations, a 1 M stock solution was started, and subsequently serial dilutions were made. After 18 h of treatment, the MTT test was carried out to determine cell viability (see Section 4.6).

4.6.2. Titration of Quercetin and Its Metabolites

In order to establish the highest non-toxic concentration of each metabolite, four titration experiments were carried out for each cell type and metabolite, adjusting the concentrations according to the results that were obtained. For the preparation of solutions at different concentrations of each metabolite, a 0.1 M stock solution (in DMSO) was started, and serial dilutions were made. The highest concentration tested for each metabolite was 200 µM. After 24 h of treatment, the 3-(4,5-dimethylthiazol-2-yl)-2,5-diphenyltetrazolium bromide (MTT) test was carried out to determine cell viability (see Section 4.6).
In the case of NRK-52E cells, the metabolites to be tested were selected based on the results obtained in HK-2 cells.
In each experiment, a plate of cells was seeded to which the MTT assay was performed at the time of starting the treatments (time 0).

4.6.3. Efficacy Experiments of Quercetin and Its Metabolites against Cisplatin Cytotoxicity

To check whether quercetin and/or its metabolites protected against the cytotoxicity of cisplatin, three concentrations of the drug were used: 10, 30 and 300 μM. These concentrations were chosen based on the results obtained in the titration experiments. Regarding quercetin and its metabolites, the highest non-toxic doses were selected for each cell type. Four experiments were performed for each cell type and metabolite.
A 6-h pretreatment was carried out with the quercetin metabolites and then, without removing the medium, cisplatin was added for 18 h. Once the incubations had elapsed, images were obtained by light microscope of each experimental condition and, subsequently, the MTT protocol was followed (see Section 4.6).

4.7. MTT Assay

As an index of cell viability, the MTT test was carried out. To each well was added, without removing the medium, 50 μL of MTT, (0.5 mg/mL) (Merck, Darmstadt, Germany) for 4 h at 37 °C (MTT concentration in the well 0.05 mg/mL). Subsequently, 500 µL of 10% SDS in 0.01 M HCl was added to dissolve the formed formazan crystals and the plates were kept overnight at 37 °C, 5% CO2 and in the dark. The next day the absorbance of each well was measured at 595 nm. From this, 100% cell viability was considered that of the negative control (cells without treatment).

4.8. Statistical Analysis

Data are presented as mean ± standard error of the mean (SEM) of n animals/wells performed. Normal distribution of the data was evaluated using the Shapiro–Wilk (n < 50) or Kolmogorov–Smirnov (n ≥ 50) test. Comparisons between groups were assessed by an ANOVA–Scheffé or a Kruskal–Wallis test. A value of p < 0.05 was considered significant. Statistical analysis was performed using IBM SPSS Statistics 20.0 software (International Business Machines, Armonk, NY, USA). Microsoft Office Excel and PowerPoint 2016 (Microsoft, Redmond, WA, USA) were used to create the artwork and illustrations.

5. Conclusions

P-quercetin protects against cisplatin damage via intraperitoneal, but not by the oral one, even though the formulation is absorbed by both routes. The nephroprotection of quercetin against cisplatin could be related to the concentration of some of its metabolites as they pass through the kidney. In our cytoprotection experiments, the compounds quercetin, quercetin 3-O-glucoside, rutin and isorhamnetin did not appear to protect against cisplatin cytotoxicity in tubular cells. More experiments are needed for tamarixetin to check the cytoprotection profile observed. In contrast, quercetin 3-O-glucuronide exerts a moderate cytoprotective effect, preventing the cytotoxicity and antiproliferative effect of cisplatin in renal tubular cells, therefore being a possible candidate for future nephroprotection strategies in vivo.

Supplementary Materials

The following are available online, Figure S1: Quercetin metabolites safety assays in HK-2 cells for 24 h of treatment, Figure S2: Isorhamnetin, quercetin 3-O-glucoside and rutin efficacy assays in HK-2 cells for 24 h against the cytotoxicity of cisplatin, Figure S3: Quercetin, quercetin 3-O-glucuronide and tamarixetin safety assays in NRK-52E cells for 24 h of treatment. Table S1: Mass spectral data and tentative identification of the compounds detected in the analyzed urine samples.

Author Contributions

Conceptualization, A.I.M., F.J.L.-H. and M.P.; methodology, D.M.-R., A.G.C., A.M.G.-P. and Á.M.; investigation, D.M.-R., A.G.C., A.M.G.-P., Á.M. and M.P.; writing—original draft preparation, D.M.-R., A.G.C. and M.P.; writing—review and editing, D.M.-R., A.G.C., A.M.G.-P., Á.M.; C.S.-B., A.I.M., F.J.L.-H. and M.P.; supervision, C.S.-B., A.I.M., F.J.L.-H. and M.P.; funding acquisition, Á.M., C.S.-B. and A.I.M. All authors have read and agreed to the published version of the manuscript.

Funding

This research was funded by Fundación FUESCYL—Banco de Santander, (grant: Ed. 2014–2015 Desafío UNIV-EMP); Fundación General de la Universidad de Salamanca, Fondo Europeo de Desarrollo Regional (FEDER) y la Junta de Castilla y León (grant: Ed. 2015 Lanzadera TC); and Junta de Castilla y León, (grant: VA225U14); The GIP-USAL is financially supported by the Spanish Ministerio de Ciencia e Innovación (Project PID2019-106167RB-I00), and Consejería de Educación (Project SA093P20) and Strategic Research Programs for Units of Excellence from Junta de Castilla y León (ref. CLU-2018-04).

Institutional Review Board Statement

The study was conducted according to the guidelines of the Declaration of Helsinki, and approved by the Ethics Committee of the University of Salamanca and the Regional Government of Castile and Leon, Ministry of Agriculture and Livestock (code: 0000075, 29 April 2016).

Informed Consent Statement

Not applicable.

Data Availability Statement

The data presented in this study are available on request from the corresponding author.

Conflicts of Interest

The authors declare no conflict of interest.

Sample Availability

Not available.

References

  1. Yao, X.; Panichpisal, K.; Kurtzman, N.; Nugent, K. Cisplatin Nephrotoxicity: A Review. Am. J. Med. Sci. 2007, 334, 115–124. [Google Scholar] [CrossRef] [PubMed] [Green Version]
  2. Manohar, S.; Leung, N. Cisplatin Nephrotoxicity: A Review of the Literature. J. Nephrol. 2018, 31, 15–25. [Google Scholar] [CrossRef] [PubMed]
  3. Sanchez-Gonzalez, P.D.; Lopez-Hernandez, F.J.; Perez-Barriocanal, F.; Morales, A.I.; Lopez-Novoa, J.M. Quercetin Reduces Cisplatin Nephrotoxicity in Rats without Compromising Its Anti-Tumour Activity. Nephrol. Dial. Transplant. 2011, 26, 3484–3495. [Google Scholar] [CrossRef] [PubMed] [Green Version]
  4. Kuhlmann, M.; Burkhardt, G.; Kohler, H. Insights into Potential Cellular Mechanisms of Cisplatin Nephrotoxicity and Their Clinical Application. Nephrol. Dial. Transplant. 1997, 12, 2478–2480. [Google Scholar] [CrossRef]
  5. Sancho-Martínez, S.M.; Piedrafita, F.J.; Cannata-Andía, J.B.; López-Novoa, J.M.; López-Hernández, F.J. Necrotic Concentrations of Cisplatin Activate the Apoptotic Machinery but Inhibit Effector Caspases and Interfere with the Execution of Apoptosis. Toxicol. Sci. 2011, 122, 73–85. [Google Scholar] [CrossRef] [Green Version]
  6. Pabla, N.; Dong, Z. Cisplatin Nephrotoxicity: Mechanisms and Renoprotective Strategies. Kidney Int. 2008, 73, 994–1007. [Google Scholar] [CrossRef] [Green Version]
  7. Dasari, S.; Bernard Tchounwou, P. Cisplatin in Cancer Therapy: Molecular Mechanisms of Action. Eur. J. Pharmacol. 2014, 740, 364–378. [Google Scholar] [CrossRef] [Green Version]
  8. DeHaan, R.D.; Yazlovitskaya, E.M.; Persons, D.L. Regulation of P53 Target Gene Expression by Cisplatin-Induced Extracellular Signal-Regulated Kinase. Cancer Chemother. Pharm. 2001, 48, 383–388. [Google Scholar] [CrossRef]
  9. Gluba, A.; Banach, M.; Hannam, S.; Mikhailidis, D.P.; Sakowicz, A.; Rysz, J. The Role of Toll-like Receptors in Renal Diseases. Nat. Rev. Nephrol. 2010, 6, 224–235. [Google Scholar] [CrossRef]
  10. Wang, W.; Sun, C.; Mao, L.; Ma, P.; Liu, F.; Yang, J.; Gao, Y. The Biological Activities, Chemical Stability, Metabolism and Delivery Systems of Quercetin: A Review. Trends Food Sci. Technol. 2016, 56, 21–38. [Google Scholar] [CrossRef]
  11. Russo, G.L.; Russo, M.; Spagnuolo, C. The Pleiotropic Flavonoid Quercetin: From Its Metabolism to the Inhibition of Protein Kinases in Chronic Lymphocytic Leukemia. Food Funct. 2014, 5, 2393–2401. [Google Scholar] [CrossRef] [PubMed]
  12. Muñoz-Reyes, D.; Morales, A.I.; Prieto, M. Transit and Metabolic Pathways of Quercetin in Tubular Cells: Involvement of Its Antioxidant Properties in the Kidney. Antioxidants 2021, 10, 909. [Google Scholar] [CrossRef] [PubMed]
  13. González-Paramás, A.M.; Ayuda-Durán, B.; Martínez, S.; González-Manzano, S.; Santos-Buelga, C. The Mechanisms Behind the Biological Activity of Flavonoids. Curr. Med. Chem. 2019, 26, 6976–6990. [Google Scholar] [CrossRef]
  14. Yang, H.; Song, Y.; Liang, Y.; Li, R. Quercetin Treatment Improves Renal Function and Protects the Kidney in a Rat Model of Adenine-Induced Chronic Kidney Disease. Med. Sci. Monit. 2018, 24, 4760–4766. [Google Scholar] [CrossRef] [PubMed]
  15. Sánchez-González, P.D.; López-Hernández, F.J.; Dueñas, M.; Prieto, M.; Sánchez-López, E.; Thomale, J.; Ruiz-Ortega, M.; López-Novoa, J.M.; Morales, A.I. Differential Effect of Quercetin on Cisplatin-Induced Toxicity in Kidney and Tumor Tissues. Food Chem. Toxicol. 2017, 107, 226–236. [Google Scholar] [CrossRef]
  16. Casanova, A.G.; Prieto, M.; Colino, C.I.; Gutiérrez-Millán, C.; Ruszkowska-Ciastek, B.; de Paz, E.; Martín, Á.; Morales, A.I.; López-Hernández, F.J. A Micellar Formulation of Quercetin Prevents Cisplatin Nephrotoxicity. Int. J. Mol. Sci. 2021, 22, 729. [Google Scholar] [CrossRef] [PubMed]
  17. Bellomo, R.; Ronco, C.; Kellum, J.A.; Mehta, R.L.; Palevsky, P. Acute Renal Failure—Definition, Outcome Measures, Animal Models, Fluid Therapy and Information Technology Needs: The Second International Consensus Conference of the Acute Dialysis Quality Initiative (ADQI) Group. Crit Care 2004, 8, R204. [Google Scholar] [CrossRef] [Green Version]
  18. Mehta, R.L.; Kellum, J.A.; Shah, S.V.; Molitoris, B.A.; Ronco, C.; Warnock, D.G.; Levin, A. Acute Kidney Injury Network: Report of an Initiative to Improve Outcomes in Acute Kidney Injury. Crit Care 2007, 11, R31. [Google Scholar] [CrossRef] [PubMed] [Green Version]
  19. Khwaja, A. KDIGO Clinical Practice Guidelines for Acute Kidney Injury. Nephron 2012, 120, c179–c184. [Google Scholar] [CrossRef]
  20. De Corte, W.; Vanholder, R.; Dhondt, A.W.; De Waele, J.J.; Decruyenaere, J.; Danneels, C.; Claus, S.; Hoste, E.A.J. Serum Urea Concentration Is Probably Not Related to Outcome in ICU Patients with AKI and Renal Replacement Therapy. Nephrol. Dial. Transplant. 2011, 26, 3211–3218. [Google Scholar] [CrossRef] [Green Version]
  21. Diskin, C.J. Creatinine and Glomerular Filtration Rate: Evolution of an Accommodation. Ann. Clin. Biochem. 2007, 44, 16–19. [Google Scholar] [CrossRef] [PubMed] [Green Version]
  22. Sánchez-González, P.D.; López-Hernández, F.J.; López-Novoa, J.M.; Morales, A.I. An Integrative View of the Pathophysiological Events Leading to Cisplatin Nephrotoxicity. Crit. Rev. Toxicol. 2011, 41, 803–821. [Google Scholar] [CrossRef] [PubMed]
  23. Murphy, R.; Stafford, R.; Petrasovits, B.; Boone, M.; Valentovic, M. Establishment of HK-2 Cells as a Relevant Model to Study Tenofovir-Induced Cytotoxicity. Int. J. Mol. Sci. 2017, 18, 531. [Google Scholar] [CrossRef] [PubMed] [Green Version]
  24. Lash, L.H.; Putt, D.A.; Matherly, L.H. Protection of NRK-52E Cells, a Rat Renal Proximal Tubular Cell Line, from Chemical-Induced Apoptosis by Overexpression of a Mitochondrial Glutathione Transporter. J. Pharm. Exp. 2002, 303, 476–486. [Google Scholar] [CrossRef] [PubMed] [Green Version]
  25. Galindo, P.; González-Manzano, S.; Zarzuelo, M.J.; Gómez-Guzmán, M.; Quintela, A.M.; González-Paramás, A.; Santos-Buelga, C.; Pérez-Vizcaíno, F.; Duarte, J.; Jiménez, R. Different Cardiovascular Protective Effects of Quercetin Administered Orally or Intraperitoneally in Spontaneously Hypertensive Rats. Food Funct. 2012, 3, 643. [Google Scholar] [CrossRef]
  26. Almeida, A.F.; Borge, G.I.A.; Piskula, M.; Tudose, A.; Tudoreanu, L.; Valentová, K.; Williamson, G.; Santos, C.N. Bioavailability of Quercetin in Humans with a Focus on Interindividual Variation: Variability in Quercetin Bioavailability. Compr. Rev. Food Sci. Food Saf. 2018, 17, 714–731. [Google Scholar] [CrossRef] [Green Version]
  27. Nemeth, K.; Piskula, M.K. Food Content, Processing, Absorption and Metabolism of Onion Flavonoids. Crit. Rev. Food Sci. Nutr. 2007, 47, 397–409. [Google Scholar] [CrossRef]
  28. Semenova, S.; Rozov, S.; Panula, P. Distribution, Properties, and Inhibitor Sensitivity of Zebrafish Catechol-O-Methyl Transferases (COMT). Biochem. Pharmacol. 2017, 145, 147–157. [Google Scholar] [CrossRef] [Green Version]
  29. Wong, C.C.; Botting, N.P.; Orfila, C.; Al-Maharik, N.; Williamson, G. Flavonoid Conjugates Interact with Organic Anion Transporters (OATs) and Attenuate Cytotoxicity of Adefovir Mediated by Organic Anion Transporter 1 (OAT1/SLC22A6). Biochem. Pharmacol. 2011, 81, 942–949. [Google Scholar] [CrossRef] [Green Version]
  30. Baral, S.; Pariyar, R.; Kim, J.; Lee, H.-S.; Seo, J. Quercetin-3-O-Glucuronide Promotes the Proliferation and Migration of Neural Stem Cells. Neurobiol. Aging 2017, 52, 39–52. [Google Scholar] [CrossRef]
  31. Chen, X.; Wu, B.; Wang, P. Glucuronides in Anti-Cancer Therapy. Curr. Med. Chem.-Anti-Cancer Agents 2003, 3, 139–150. [Google Scholar] [CrossRef] [PubMed]
  32. Deiana, M.; Incani, A.; Rosa, A.; Atzeri, A.; Loru, D.; Cabboi, B.; Paola Melis, M.; Lucas, R.; Morales, J.C.; Assunta Dessì, M. Hydroxytyrosol Glucuronides Protect Renal Tubular Epithelial Cells against H2O2 Induced Oxidative Damage. Chem.-Biol. Interact. 2011, 193, 232–239. [Google Scholar] [CrossRef] [PubMed]
  33. Asai, H.; Hirata, J.; Watanabe-Akanuma, M. Indoxyl Glucuronide, a Protein-Bound Uremic Toxin, Inhibits Hypoxia-Inducible Factor—dependent Erythropoietin Expression through Activation of Aryl Hydrocarbon Receptor. Biochem. Biophys. Res. Commun. 2018, 504, 538–544. [Google Scholar] [CrossRef] [PubMed]
  34. Iwamura, A.; Watanabe, K.; Akai, S.; Nishinosono, T.; Tsuneyama, K.; Oda, S.; Kume, T.; Yokoi, T. Zomepirac Acyl Glucuronide Is Responsible for Zomepirac-Induced Acute Kidney Injury in Mice. Drug Metab. Dispos. 2016, 44, 888–896. [Google Scholar] [CrossRef] [PubMed] [Green Version]
  35. Steffen, P.; Keller, F. Analgesic Drug Therapy in Kidney Patients. Dtsch. Med. Wochenschr. 2021, 146, 1009–1015. [Google Scholar] [CrossRef]
  36. Yang, L.-L.; Xiao, N.; Li, X.-W.; Fan, Y.; Alolga, R.N.; Sun, X.-Y.; Wang, S.-L.; Li, P.; Qi, L.-W. Pharmacokinetic Comparison between Quercetin and Quercetin 3-O-β-Glucuronide in Rats by UHPLC-MS/MS. Sci. Rep. 2016, 6, 35460. [Google Scholar] [CrossRef] [Green Version]
  37. Perez-Vizcaino, F.; Duarte, J.; Santos-Buelga, C. The Flavonoid Paradox: Conjugation and Deconjugation as Key Steps for the Biological Activity of Flavonoids: The Flavonoid Paradox. J. Sci. Food Agric. 2012, 92, 1822–1825. [Google Scholar] [CrossRef]
  38. Menendez, C.; Dueñas, M.; Galindo, P.; González-Manzano, S.; Jimenez, R.; Moreno, L.; Zarzuelo, M.J.; Rodríguez-Gómez, I.; Duarte, J.; Santos-Buelga, C.; et al. Vascular Deconjugation of Quercetin Glucuronide: The Flavonoid Paradox Revealed? Mol. Nutr. Food Res. 2011, 55, 1780–1790. [Google Scholar] [CrossRef]
  39. Perez, A.; Gonzalez-Manzano, S.; Jimenez, R.; Perez-Abud, R.; Haro, J.M.; Osuna, A.; Santos-Buelga, C.; Duarte, J.; Perez-Vizcaino, F. The Flavonoid Quercetin Induces Acute Vasodilator Effects in Healthy Volunteers: Correlation with Beta-Glucuronidase Activity. Pharmacol. Res. 2014, 89, 11–18. [Google Scholar] [CrossRef]
  40. Galindo, P.; Rodriguez-Gómez, I.; González-Manzano, S.; Dueñas, M.; Jiménez, R.; Menéndez, C.; Vargas, F.; Tamargo, J.; Santos-Buelga, C.; Pérez-Vizcaíno, F.; et al. Glucuronidated Quercetin Lowers Blood Pressure in Spontaneously Hypertensive Rats via Deconjugation. PLoS ONE 2012, 7, e32673. [Google Scholar] [CrossRef] [Green Version]
  41. Duarte, J.; Pérez-Palencia, R.; Vargas, F.; Angeles Ocete, M.; Pérez-Vizcaino, F.; Zarzuelo, A.; Tamargo, J. Antihypertensive Effects of the Flavonoid Quercetin in Spontaneously Hypertensive Rats: Quercetin and Hypertension. Br. J. Pharmacol. 2001, 133, 117–124. [Google Scholar] [CrossRef] [PubMed]
  42. Perez-Vizcaino, F.; Duarte, J.; Andriantsitohaina, R. Endothelial Function and Cardiovascular Disease: Effects of Quercetin and Wine Polyphenols. Free Radic. Res. 2006, 40, 1054–1065. [Google Scholar] [CrossRef] [PubMed]
  43. Fraile, M.; Buratto, R.; Gómez, B.; Martín, Á.; Cocero, M.J. Enhanced Delivery of Quercetin by Encapsulation in Poloxamers by Supercritical Antisolvent Process. Ind. Eng. Chem. Res. 2014, 53, 4318–4327. [Google Scholar] [CrossRef]
  44. Mullen, W.; Edwards, C.A.; Crozier, A. Absorption, Excretion and Metabolite Profiling of Methyl-, Glucuronyl-, Glucosyl- and Sulpho-Conjugates of Quercetin in Human Plasma and Urine after Ingestion of Onions. Br. J. Nutr. 2006, 96, 107. [Google Scholar] [CrossRef] [Green Version]
  45. Gil-Sánchez, I.; Ayuda-Durán, B.; González-Manzano, S.; Santos-Buelga, C.; Cueva, C.; Martín-Cabrejas, M.A.; Sanz-Buenhombre, M.; Guadarrama, A.; Moreno-Arribas, M.V.; Bartolomé, B. Chemical Characterization and in Vitro Colonic Fermentation of Grape Pomace Extracts. J. Sci. Food Agric. 2017, 97, 3433–3444. [Google Scholar] [CrossRef]
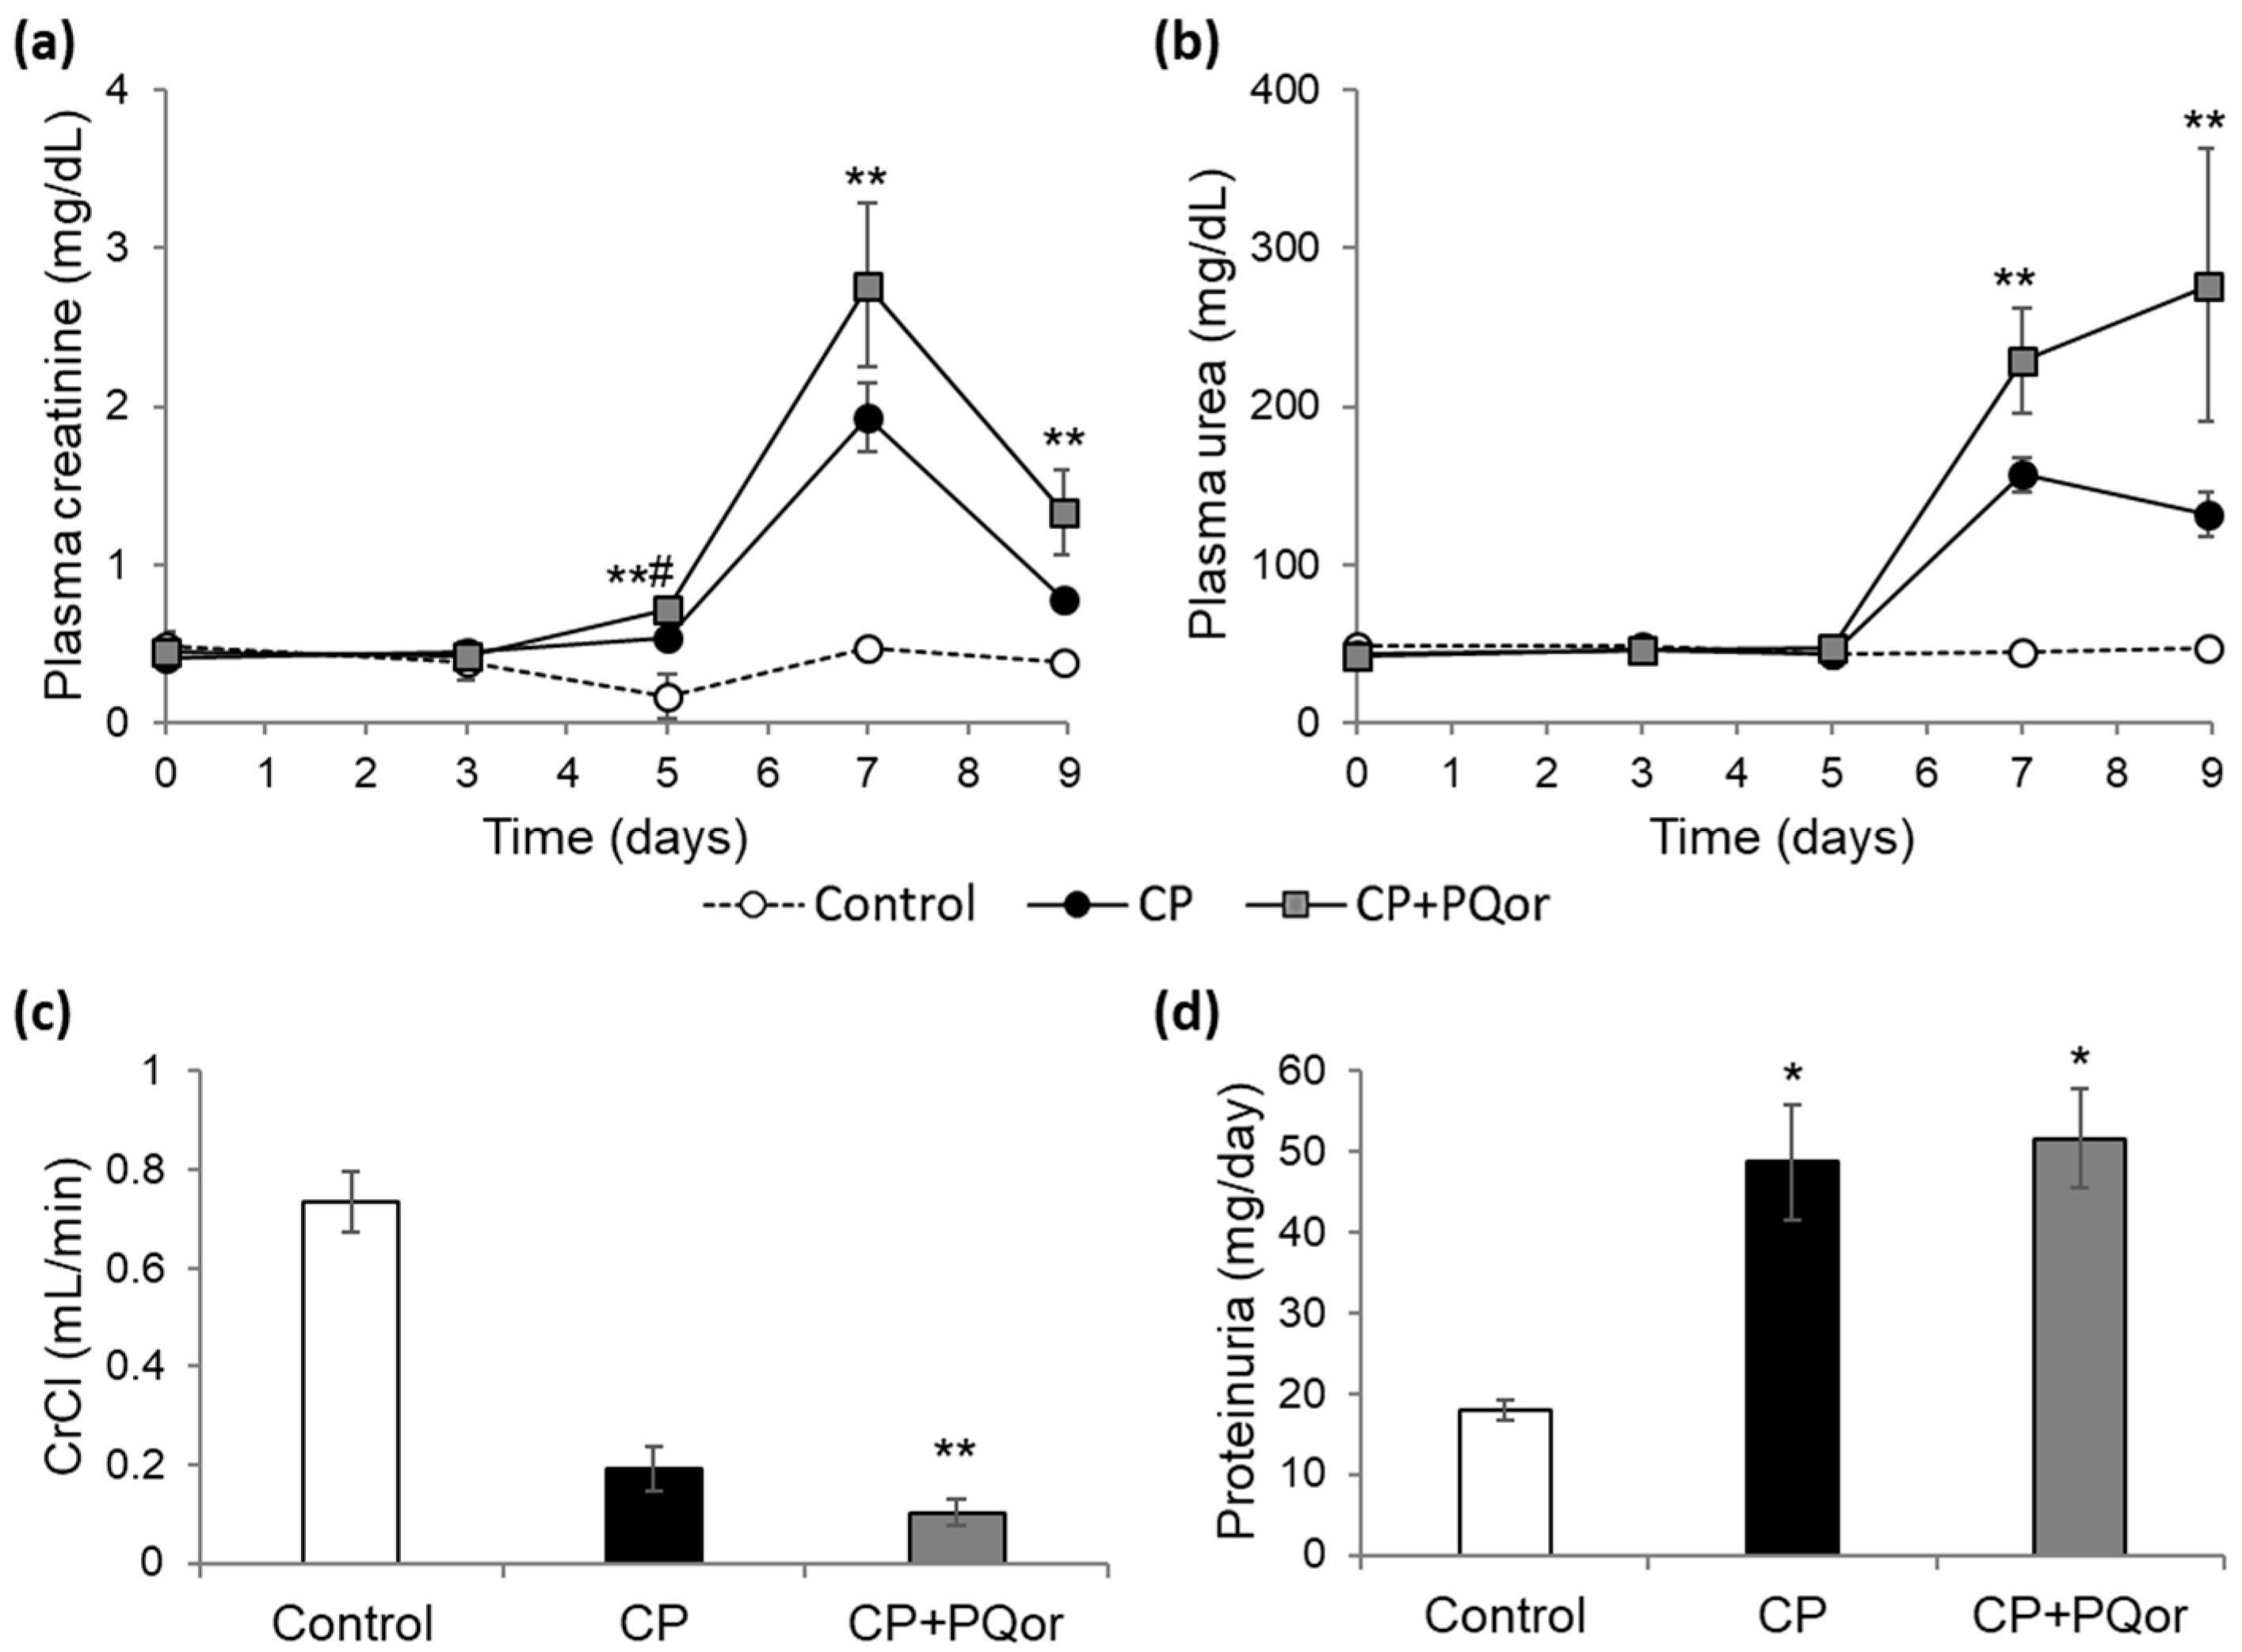
Figure 1. Evaluation of renal function in rats. (a) Evolution of plasma creatinine; (b) evolution of plasma urea; (c) creatinine clearance on day 7; (d) proteinuria on day 7. Values are expressed as the mean ± SEM. * p < 0.05; ** p < 0.01 vs. Control group; # p < 0.05 vs. CP group. CP: cisplatin (6.5 mg/kg, i.p.) on day 3; CP+PQor: P-quercetin (100 mg/kg, p.o.) for 9 days and cisplatin (6.5 mg/kg, i.p.) on day 3. CrCl: creatinine clearance.
Molecules 27 01319 g001
Figure 2. HPLC chromatograms recorded at 360 nm of plasma (a) and urine (b) samples from rats treated with P-quercetin. The formulation (100 mg/kg) was administered for 3 days, p.o. or i.p. Tentative identification of peaks: a and b: quercetin glucuronide sulfate; c: methylquercetin glucuronide sulfate; d and e: quercetin sulfate; f: methylquercetin sulfate. 1: Protocatechuic acid derivative; 2: hydroxyphenylacetic sulfate; 3 and 8: quercetin glucuronide sulfate; 4: protocatechuic acid; 5: methylquercetin diglucuronide; 6: quercetin sulfate derivative; 7: quercetin diglucuronide + quercetin glucose; 9: quercetin glucuronide; 10: methylquercetin glucuronide sulfate; 11: methylquercetin glucuronide + quercetin glucuronide sulfate; 12 and 15: methylquercetin glucuronide; 13, 14 and 16: quercetin sulfate; 17 and 18: methylquercetin sulfate; 19: methylquercetin. Information on MS data of the peaks is given in Table S1, Supplementary Material.
Molecules 27 01319 g002
Figure 3. Titration of cisplatin cytotoxicity for 18 h of treatment in HK-2 cells. Cell viability was determined using the MTT assay. Values are expressed as the mean ± SEM. Significant differences (p < 0.05): a vs. 0 μM; b vs. 10 μM; c vs. 300 μM.
Molecules 27 01319 g003
Figure 4. Quercetin, quercetin 3-O-glucuronide and tamarixetin efficacy assays in HK-2 cells for 24 h against cisplatin cytotoxicity. The cells were pretreated 6 h with the corresponding metabolite and subsequently cotreated for 18 h with the metabolite and cisplatin 10, 30 and 300 µM, respectively. The MTT technique was used to estimate cell viability. Values are expressed as the mean ± SEM. Significant differences (p < 0.05): a vs. Control; b vs. Metabolite alone (quercetin, quercetin 3-O-glucuronide or tamarixetin); c vs. 10 µM cisplatin; d vs. cisplatin 10 µM + protective treatment; e vs. 30 µM cisplatin; f vs. cisplatin 30 μM + protective treatment. The dotted line represents cell viability before treatment (time 0 h). Q3OG: quercetin-3-O-glucuronide; TMX: tamarixetin.
Molecules 27 01319 g004
Figure 5. Representative images of HK-2 cells taken under the light microscope (10× magnification). First line: cells without treatment (Control) and treated with cisplatin 10 (CP10), 30 (CP30) and 300 (CP300) μM for 18 h. Second line: cells treated with tamarixetin (TMX) at a concentration of 12.5 μM for 24 h, and cells pretreated with TMX 12.5 μM for 6 h and subsequently cotreated 18 h with TMX 12.5 μM and CP10, CP30 and CP300, respectively. Third line: cells treated with quercetin 3-O-glucuronide (Q3OG) at a concentration of 25 μM for 24 h, and cells pre-treated with Q3OG 25 μM for 6 h and subsequently cotreated for 18 h with Q3OG 25 μM and CP10, CP30 and CP300, respectively. TMX: tamarixetin; G3OG: quercetin 3-O-glucuronide; CP: cisplatin; A: apoptosis; N: necrosis.
Molecules 27 01319 g005
Figure 6. Titration of cisplatin cytotoxicity for 18 h of treatment in NRK-52E cells. Cell viability was determined using the MTT assay. Values are expressed as the mean ± SEM. Significant differences (p < 0.05): a vs. 0 μM, b vs. 3 μM; c vs. 10 μM; d vs. 30 μM.
Molecules 27 01319 g006
Figure 7. Quercetin, quercetin 3-O-glucuronide and tamarixetin efficacy assays in NRK-52E cells for 24 h against the cytotoxicity of cisplatin. The cells were pretreated for 6 h with the corresponding metabolite and subsequently co-treated for 18 h with the metabolite and 10, 30 and 300 μM cisplatin, respectively. The MTT technique was used to estimate cell viability. Values are expressed as the mean ± SEM. Significant differences (p < 0.05): a vs. Control; b vs. Protective treatment alone; c vs. 10 µM cisplatin; d vs. Cisplatin 10 µM + Protective treatment; e vs. 30 µM cisplatin; f vs. Cisplatin 30 μM + Protective treatment. The dotted line represents the state of the cells before treatment (time 0 h). Q3OG: quercetin-3-O-glucuronide; TMX: tamarixetin.
Molecules 27 01319 g007
Figure 8. Representative images of NRK-52E cells taken under the light microscope (10× magnification). First line: cells without treatment (control) and treated with cisplatin 10 (CP10), 30 (CP30) and 300 (CP300) μM for 18 h. Second line: cells treated with tamarixetin (TMX) at a concentration of 12.5 μM for 24 h, and cells pre-treated with TMX 12.5 μM for 6 h and subsequently cotreated 18 h with TMX 12.5 μM and CP10, CP30 and CP300, respectively. Third line: cells treated with Quercetin 3-O-glucuronide (Q3OG) at a concentration of 25 μM for 24 h, and cells pre-treated with Q3OG 25 μM for 6 h and subsequently cotreated for 18 h with Q3OG 25 μM and CP10, CP30 and CP300, respectively. TMX: tamarixetin; Q3OG: quercetin 3-O-glucuronide; CP: cisplatin; A: apoptosis; N: necrosis.
Molecules 27 01319 g008
Figure 9. Scheme of the nephrotoxicity model. CP: cisplatin (6.5 mg/kg, i.p.) on day 3; CP + PQor: P-quercetin (100 mg/kg, p.o.) for 9 days and cisplatin (6.5 mg/kg, i.p.) on day 3.
Molecules 27 01319 g009
Figure 10. Chemical structure of quercetin and its metabolites used in this study.
Molecules 27 01319 g010
Table 1. Higher non-toxic concentrations of quercetin metabolites in HK-2 cells. The data were obtained by cell viability tests (MTT assay; Figure S1, Supplementary Material).
Maximum Non-Toxic Concentration (μM) in HK-2 Cells
Isorhamnetin1.56
Quercetin12.5
Quercetin 3-O-glucoside0.78
Quercetin 3-O-glucuronide25
Rutin25
Tamarixetin12.5
Table 2. Higher non-toxic concentrations of quercetin metabolites in NRK-52E cells. Data were obtained by cell viability assays (MTT assay; Figure S3, Supplementary Material).
Maximum Non-Toxic Concentration in NRK-52E Cells (μM)
Quercetin25
Quercetin 3-O-glucuronide200
Tamarixetin12.5
Publisher’s Note: MDPI stays neutral with regard to jurisdictional claims in published maps and institutional affiliations.