
Development and Validation of a Novel HPLC Method to Analyse Metabolic Reaction Products Catalysed by the CYP3A2 Isoform: In Vitro Inhibition of CYP3A2 Enzyme Activity by Aspirin (Drugs Often Used Together in COVID-19 Treatment)


Abstract
:1. Introduction
2. Results and Discussion
2.1. HPLC Method Development
2.2. HPLC Method Validation
2.2.1. Linearity and Range
2.2.2. Specificity and Selectivity
2.2.3. Limit of Detection (LOD) and Limit of Quantification (LOQ)
2.2.4. Precision
Intraday Precision of Dexamethasone
Interday Precision of Dexamethasone
Intraday Precision of 6β-Hydroxydexamethasone
Interday Precision of 6β-Hydroxydexamethasone
2.2.5. Stability Study
Solution Stability of Substrate (Dexamethasone)
Solution Stability of 6β-Hydroxydexamethasone (Metabolite)
2.2.6. Robustness of the Method
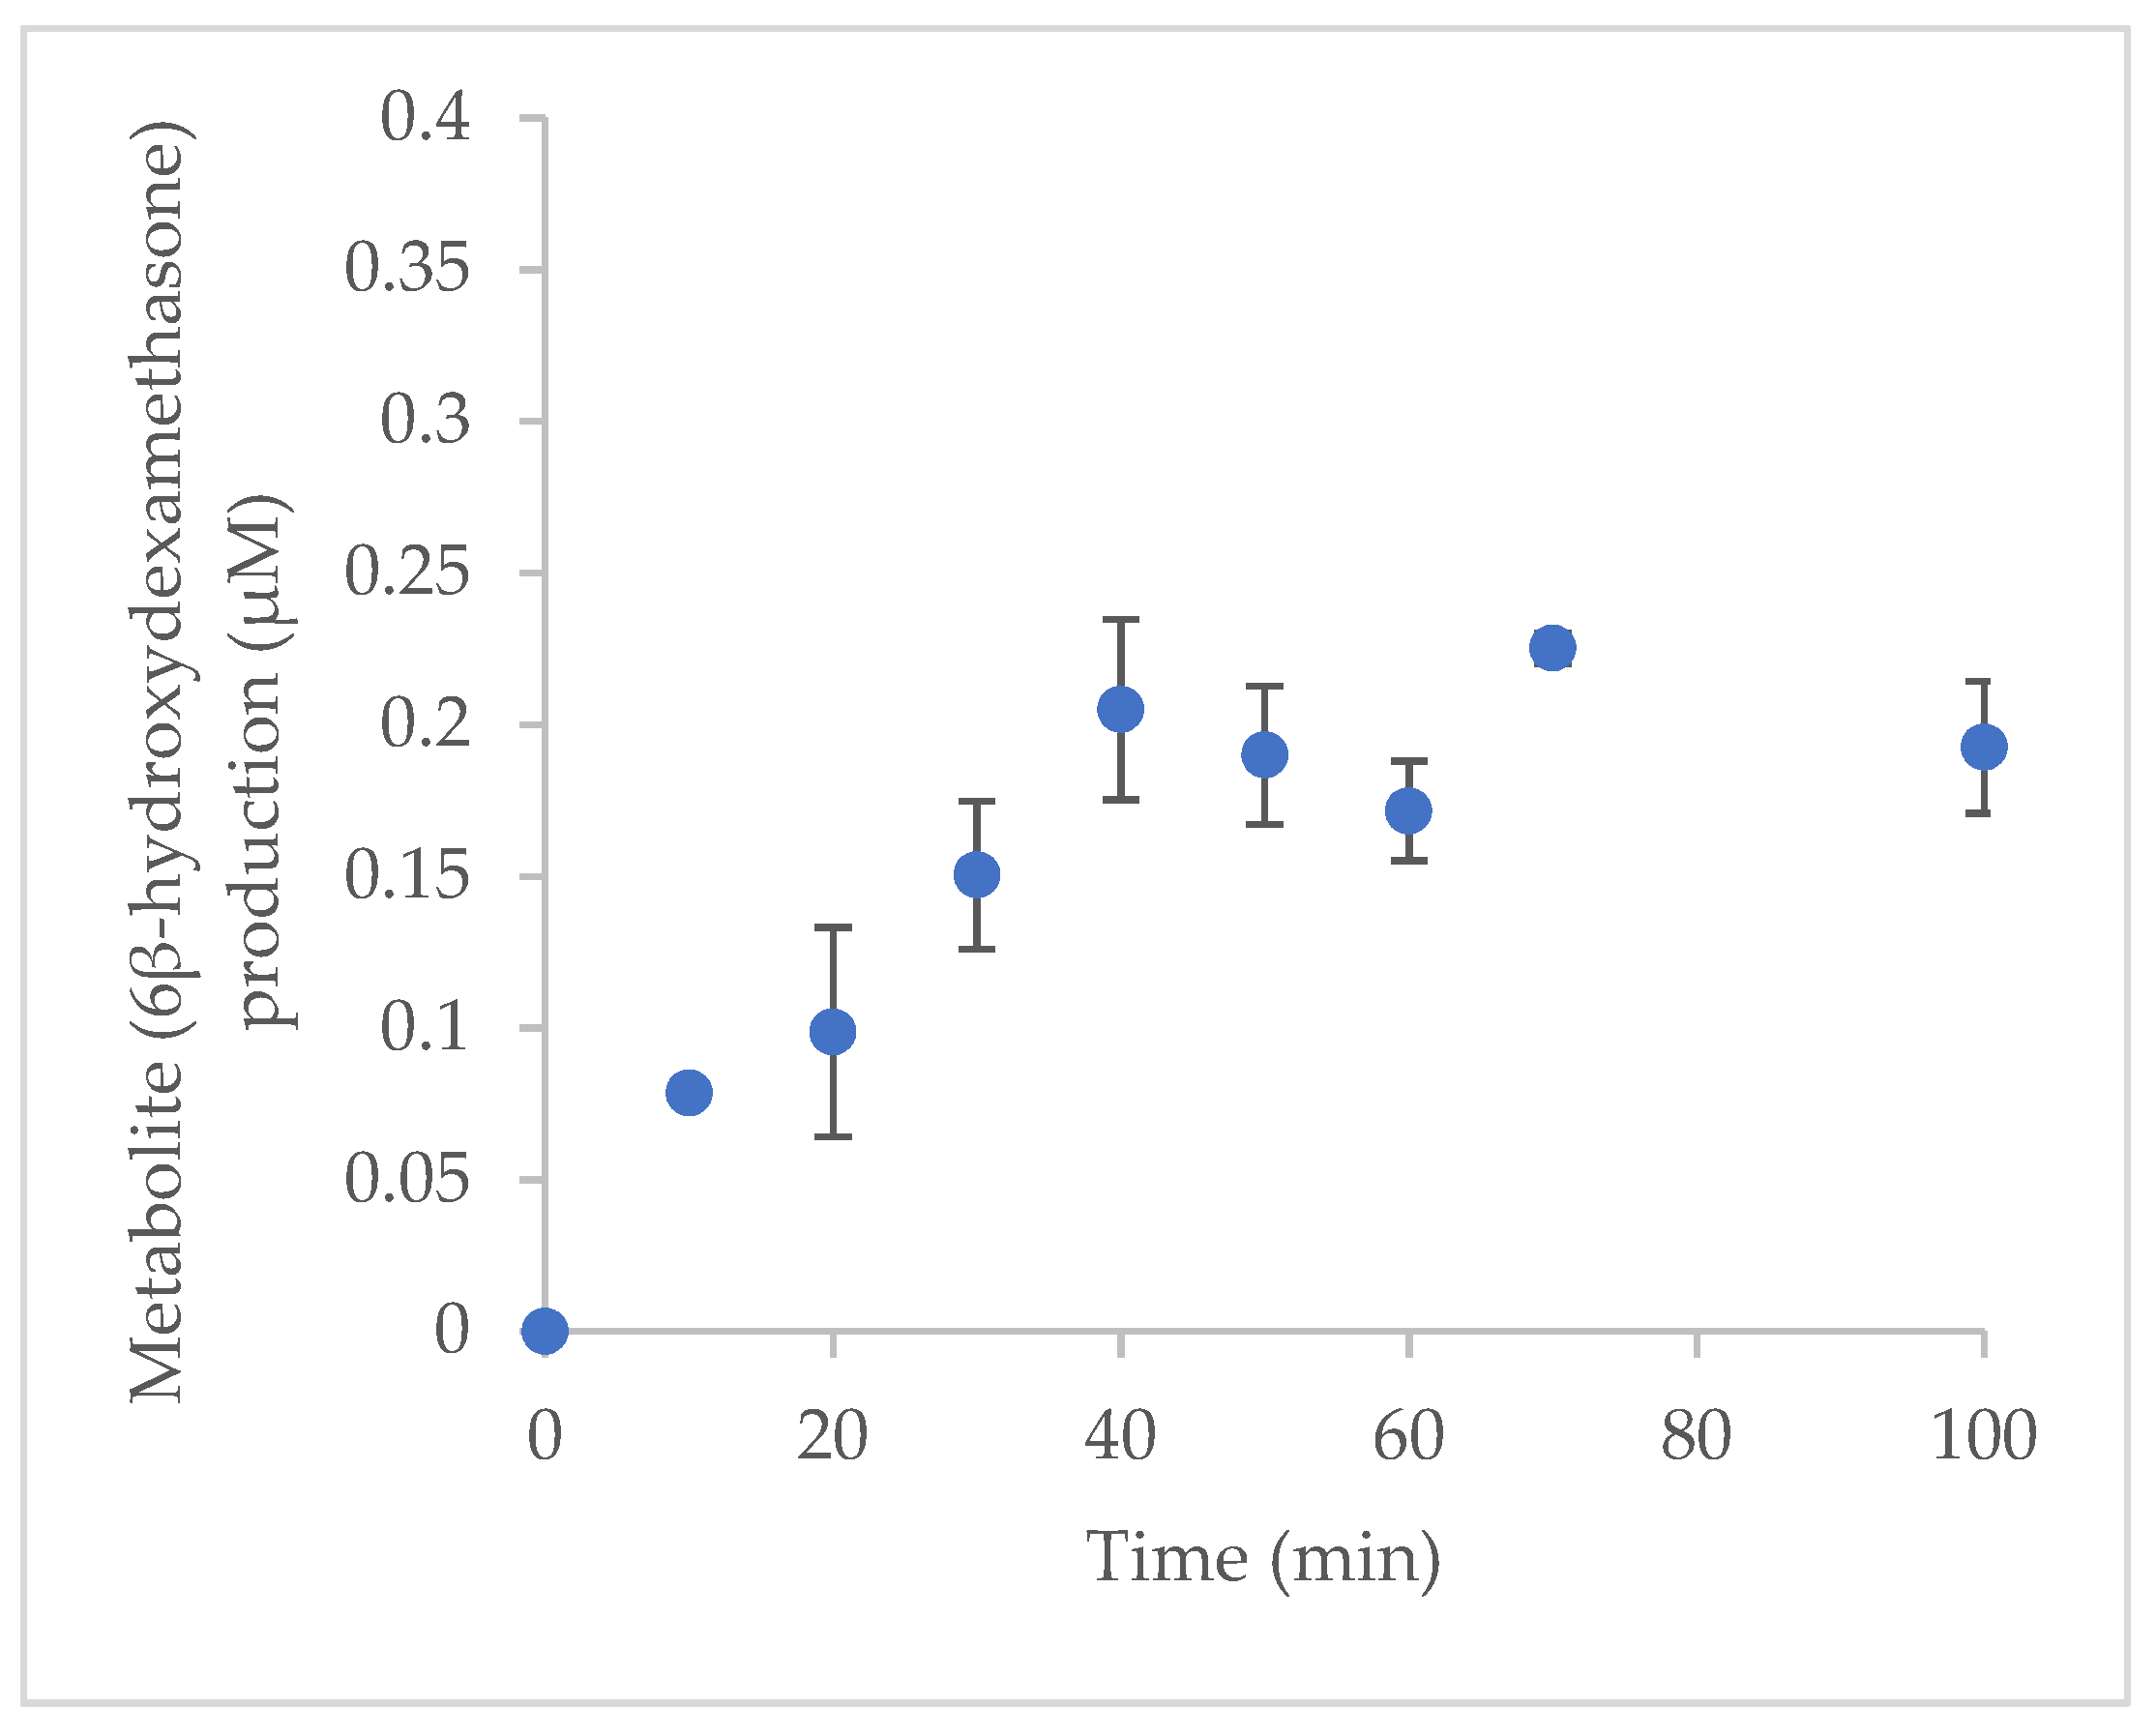
2.3. Optimisation of Incubation Time for Incubation System In Vitro
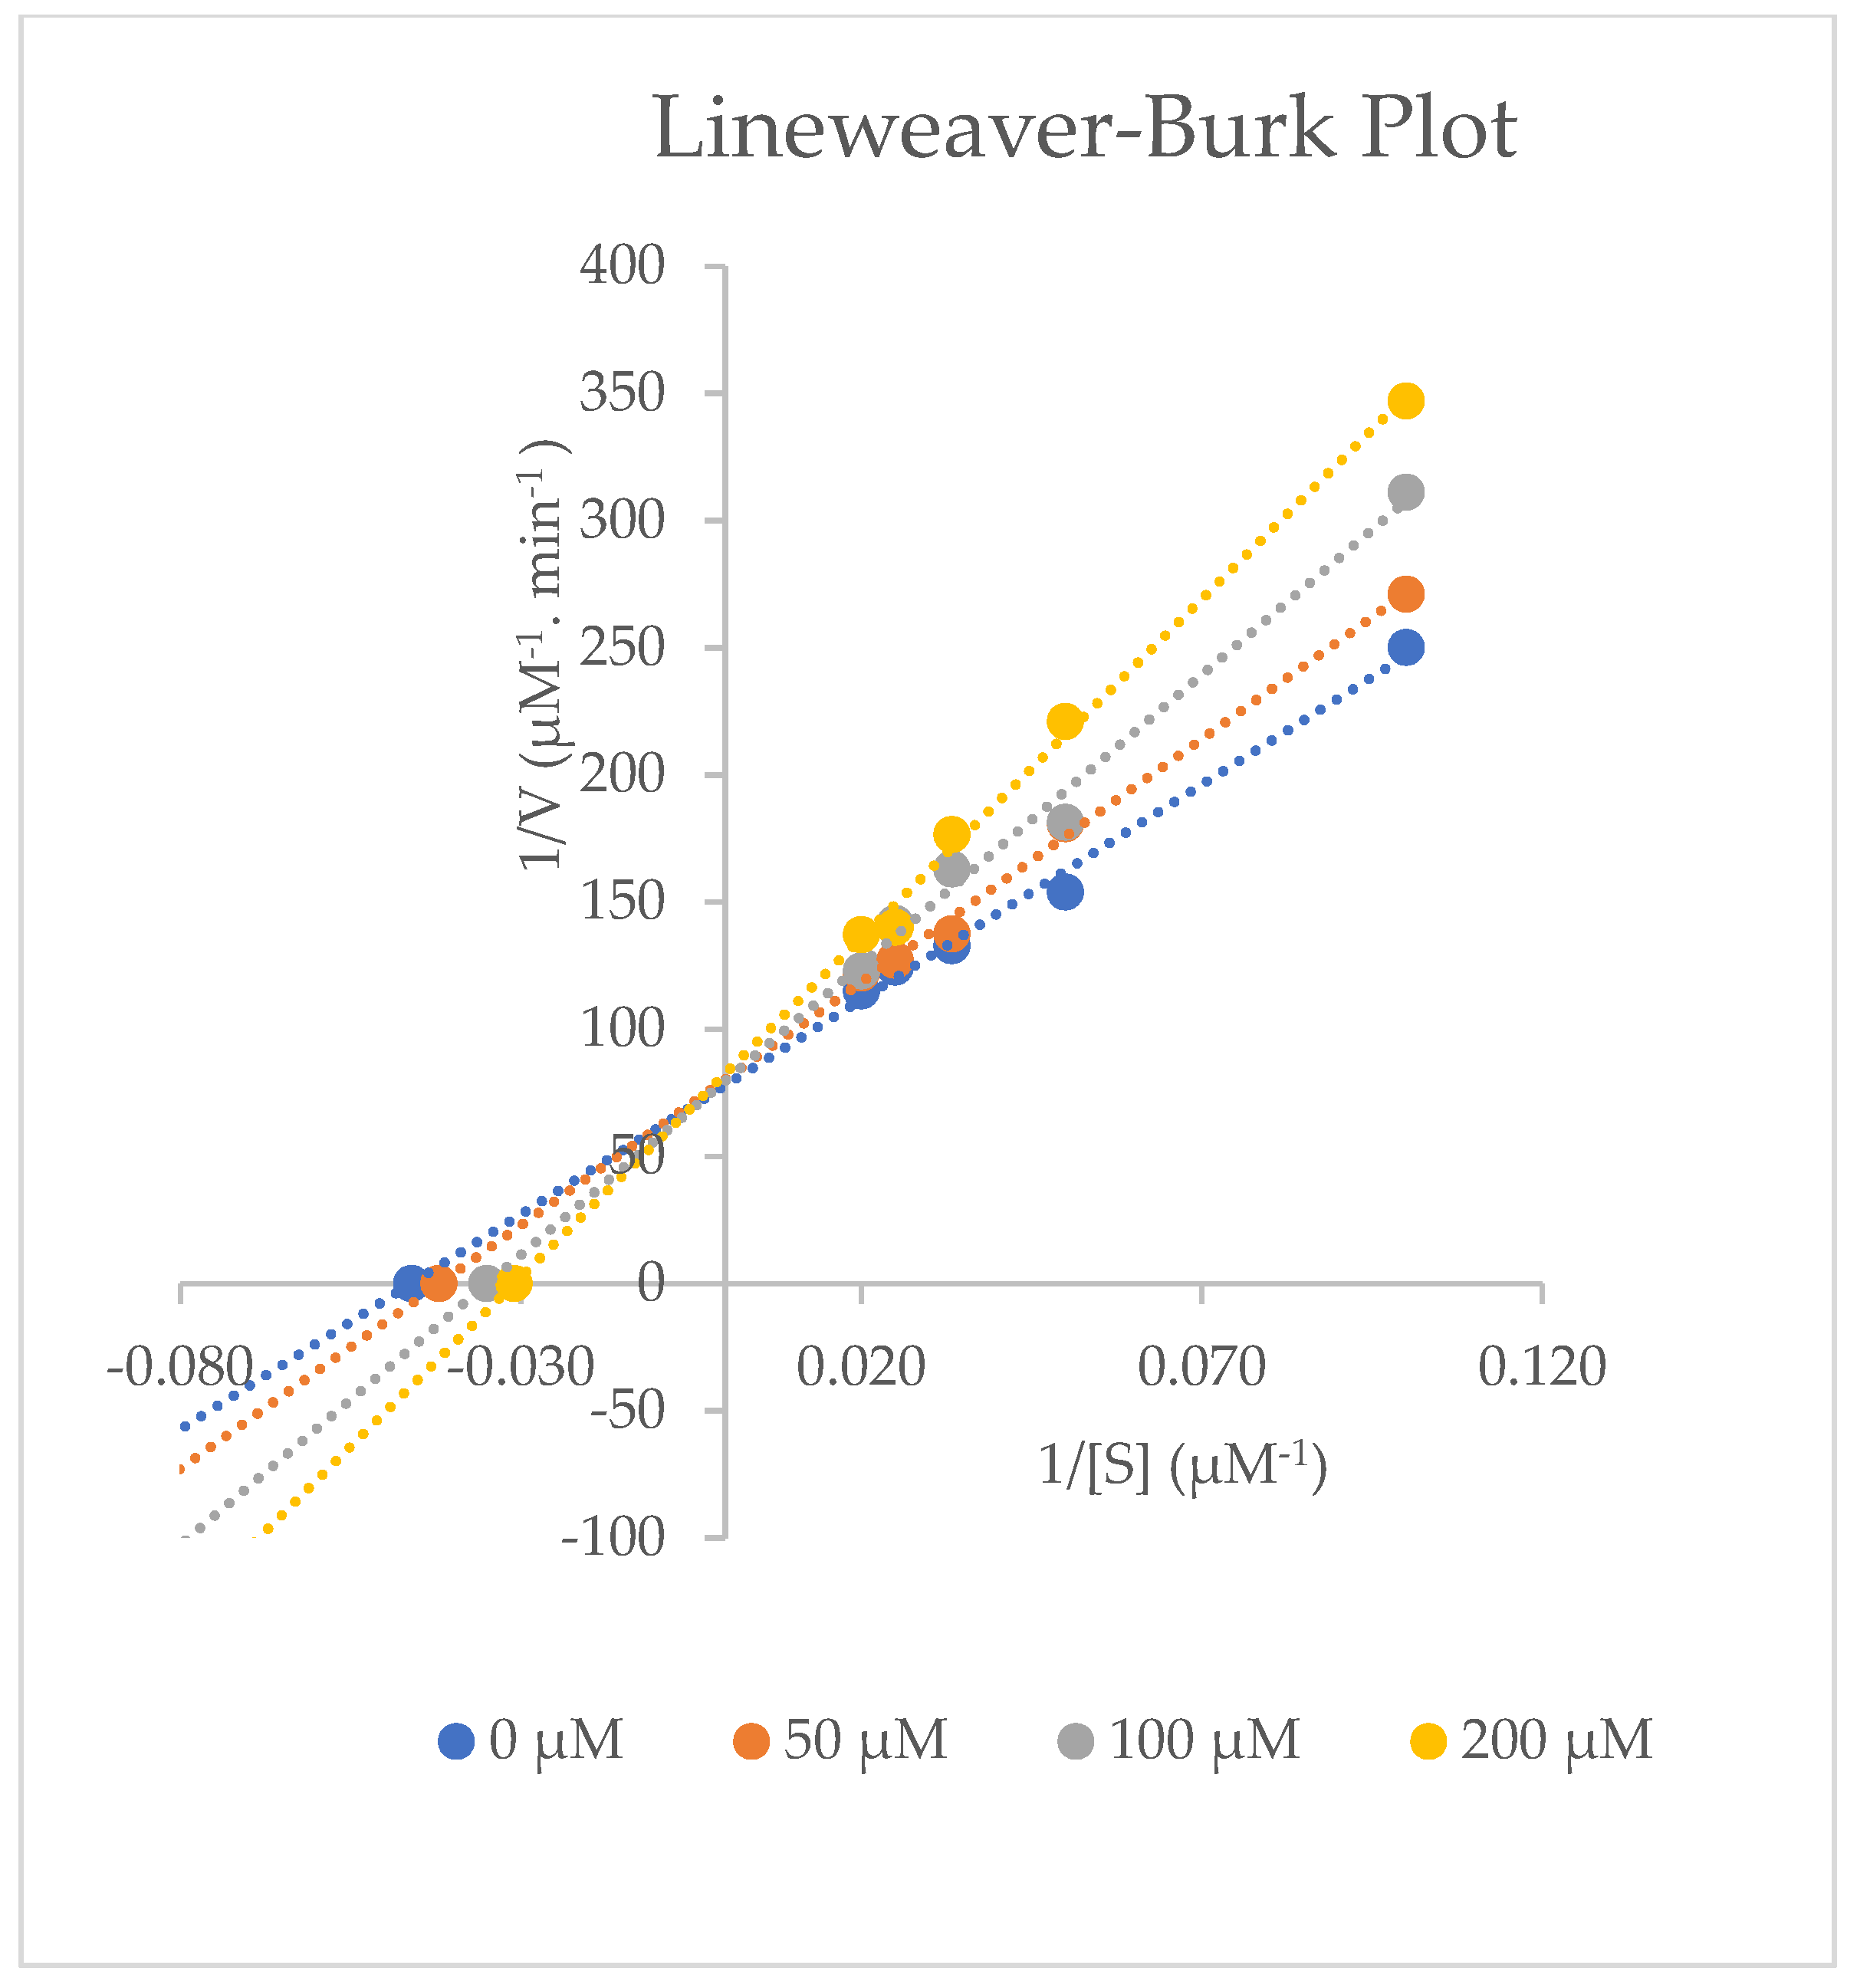
2.4. Inhibitory Effects of Aspirin on CYP3A2 Activity in Rat Liver Microsomes
3. Materials and Methods
3.1. Chemicals
3.2. Instruments
3.3. Cytochrome P450 Assay
3.3.1. Dexamethasone 6β-Hydroxylation Assay for CYP3A2
3.3.2. Microsomal Incubations Procedure
3.4. Preparation of Standard Substrate and Metabolite Solutions
3.5. Optimisation of Incubation Time In Vitro
3.6. Data Analysis
4. Conclusions
Supplementary Materials
Author Contributions
Funding
Institutional Review Board Statement
Informed Consent Statement
Data Availability Statement
Acknowledgments
Conflicts of Interest
Sample Availability
References
- Bibi, Z. Role of cytochrome P450 in drug interactions. Nutr. Metab. 2008, 5, 27. [Google Scholar] [CrossRef] [PubMed] [Green Version]
- Lynch, T.; Price, A. The Effect of Cytochrome P450 Metabolism on Drug Response, Interactions, and Adverse Effects. Am. Fam. Physician 2007, 76, 391–396. [Google Scholar] [PubMed]
- Ko, J.W.; Desta, Z.; Soukhova, N.V.; Tracy, T.; Flockhart, D.A. In Vitro inhibition of the cytochrome P450 (CYP450) system by the antiplatelet drug ticlopidine: Potent effect on CYP2C19 and CYP2D6. Br. J. Clin. Pharmacol. 2000, 49, 343–351. [Google Scholar] [CrossRef] [PubMed] [Green Version]
- Nduka, S.O.; Okonta, M.J.; Ajaghaku, D.L.; Ukwe, C.V. In Vitro and in vivo cytochrome P450 3A enzyme inhibition by Aframomum melegueta and Denniettia tripetala extracts. Asian Pac. J. Trop. 2017, 10, 576–581. [Google Scholar] [CrossRef] [PubMed]
- McDonnell, A.M.; Dang, C.H. Basic Review of the Cytochrome P450 System. J. Adv. Pract. Oncol. 2013, 4, 263–268. [Google Scholar] [PubMed]
- Sprouse, A.A.; van Breemen, R.B. Pharmacokinetic interactions between drugs and botanical dietary supplements. Drug Metab. Dispos. 2016, 44, 162–171. [Google Scholar] [CrossRef] [PubMed] [Green Version]
- Zurbonsen, K.; Bressolle, F.; Solassol, I.; Aragon, P.J.; Culine, S.; Pinguet, F. Simultaneous determination of dexamethasone and 6β-hydroxydexamethasone in urine using solid-phase extraction and liquid chromatography: Applications to in vivo measurement of cytochrome P450 3A4 activity. J. Chromatogr. B 2004, 804, 421–429. [Google Scholar] [CrossRef] [PubMed]
- Ahmed, M.H.; Hassan, A. Dexamethasone for the Treatment of Coronavirus Disease (COVID-19): A Review. SN Compr. Clin. Med. 2020, 2, 2637–2646. [Google Scholar] [CrossRef] [PubMed]
- Al Rihani, S.B.; Deodhar, M.; Dow, P.; Turgeon, J.; Michaud, V. Is Dexamethasone a Substrate, an Inducer, or a Substrate-Inducer of CYP3As? Arch. Pharm. Res. 2020, 2, 1–5. [Google Scholar]
- Park, B.K.; Back, D.J. Dexamethasone metabolism by human liver in vitro. Metabolite identification and inhibition of 6-hydroxylation. J. Pharmacol. Exp. Ther. 1996, 277, 105–112. [Google Scholar]
- Tomlinson, E.S.; Maggs, J.L.; Park, B.K.; Back, D.J. Dexamethasone Metabolism in Species Differences. J. Steroid Biochem. Mol. 1997, 62, 345–352. [Google Scholar] [CrossRef]
- Wang, S.; Dong, Y.; Su, K.; Zhang, J.; Wang, L.; Han, A.; Wen, C.; Wang, X.; He, Y. Effect of codeine on CYP450 isoform activity of rats. Pharm. Biol. 2017, 55, 1223–1227. [Google Scholar] [CrossRef] [Green Version]
- Hector, A.C.; Roberto, H.; Eugenia, F.M.; Muniz, F.J.; Aires, B. Safety and efficacy of the combined use of Ivermectin, Dexamethasone, Enoxaparin and Aspirin, against Covid 19. medRxiv 2020. [Google Scholar] [CrossRef]
- Vukoja, D.; Juric, A.; Erkapic, Z.; Pejic, T.; Zovko, Z.; Juricic, J.; Pejic, J.; Corluka, M. Beneficial Treatment Outcomes of Severe COVID-19 Patients Treated Entirely in Primary Care Settings With Dexamethasone Including Regimen—Case Series Report. Front. Pharmacol. 2021, 12, 1–11. [Google Scholar] [CrossRef]
- Pan, Z.; Camara, B.; Gardner, H.W.; Backhaus, R.A. Aspirin Inhibition and Acetylation of the Plant Cytochrome P450, Allene Oxide Synthase, Resembles that of Animal Prostaglandin Endoperoxide H Synthase. Am. Soc. Biochem. Mol. 1998, 273, 18139–18145. [Google Scholar] [CrossRef] [PubMed] [Green Version]
- Ornelas, A.; Zacharias-Millward, N.; Menter, D.G.; Davis, J.S.; Lichtenberger, L.; Hawke, D.; Hawk, E.; Vilar, E.; Bhattacharya, P.; Millward, S. Beyond COX-1: The effects of aspirin on platelet biology and potential mechanisms of chemoprevention. Cancer Metastasis Rev. 2017, 36, 289–303. [Google Scholar] [CrossRef] [Green Version]
- Vane, J.R.; Botting, R.M. The mechanism of action of aspirin. Thromb. Res. 2003, 110, 255–258. [Google Scholar] [CrossRef]
- International Conference on Harmonisation of Technical Requirements for Registration of Pharmaceuticals for Human Use. In ICH Harmonised Tripartite Guideline, Validation of Analytical Procedures: Text and Methodology Q2(R1); Somatek Inc.: San Diego, CA, USA, 2005.
- Heda, A.A.; Kathiriya, J.M.; Gadade, D.D.; Puranik, P.K. Development-and-validation-of-rphplc-method-for-simultaneous-determination-of-granisetron-and-dexamethasone. Indian J. Pharm. Sci. 2011, 73, 696–699. [Google Scholar] [CrossRef] [Green Version]
- Jafari-Fesharaki, M.; Scheinman, M.M. Adverse Effects of Amiodarone. Pacing Clin. Electrophysiol. 1998, 21, 108–120. [Google Scholar] [CrossRef]
- Strelow, J.; Dewe, W.; Iversen, P.W.; Brooks, H.B.; Radding, J.A.; McGee, J.; Weidn, J. Mechanism of Action Assays for Enzymes. AGM 2012. Available online: https://www.ncbi.nlm.nih.gov/books/NBK92001/?report=printable (accessed on 5 January 2022).
- Liu, L.I.; Jiang, Z.; Liu, J.; Huang, X.; Wang, T.; Liu, J.; Zhang, Y.; Zhou, Z.; Guo, J.; Yang, L.; et al. Sex differences in subacute toxicity and hepatic microsomal metabolism of triptolide in rats. Toxicology 2010, 271, 57–63. [Google Scholar] [CrossRef] [PubMed]
- Zhang, Z.J.; Xia, Z.Y.; Wang, J.M.; Song, X.T.; Wei, J.F.; Kang, W.Y. Effects of flavonoids in Lysimachia clethroides duby on the activities of cytochrome P450 CYP2E1 and CYP3A4 in rat liver microsomes. Molecules 2016, 21, 738. [Google Scholar] [CrossRef] [PubMed] [Green Version]


| Standards | Dexamethasone | 6β-Hydroxydexamethasone |
|---|---|---|
| Regression equation | y = 0.2505x + 0.0945 | y = 1.6775x + 0.0385 |
| r2 | 0.999 | 0.998 |
| Linear range | 25–200 µM | 0.2–1 µM |
| Standards | Dexamethasone | 6β-Hydroxydexamethasone |
|---|---|---|
| LOD | 5.60 µM | 0.06 µM |
| LOQ | 16.98 µM | 0.19 µM |
| Dexamethasone Standards | Mean (µM) | Recovery a (%) | RSD (%) |
|---|---|---|---|
| Low concentration (40 µM) | 39.28 ± 0.90 | 98.21 | 2.30 |
| Medium concentration (110 µM) | 99.06 ± 3.06 | 90.05 | 3.09 |
| High concentration (185 µM) | 151.11 ± 0.76 | 81.68 | 0.50 |
| Dexamethasone Standards | Mean (µM) | Recovery a (%) | RSD (%) |
|---|---|---|---|
| Low concentration (40 µM) | 45.01 ± 2.09 | 112.52 | 4.65 |
| Medium concentration (110 µM) | 110.01 ± 2.17 | 100.01 | 1.98 |
| High concentration (185 µM) | 178.92 ± 3.13 | 96.72 | 1.75 |
| 6β-Hydroxydexamethasone Standards | Mean (µM) | Recovery a (%) | RSD (%) |
|---|---|---|---|
| Low concentration (0.3 µM) | 0.33 ± 0.01 | 108.60 | 2.21 |
| Medium concentration (0.5 µM) | 0.50 ± 0.02 | 100.01 | 3.64 |
| High concentration (0.85 µM) | 1.02 ± 0.09 | 119.38 | 8.82 |
| 6β-Hydroxydexamethasone Standards | Mean (µM) | Recovery a (%) | RSD (%) |
|---|---|---|---|
| Low concentration (0.3 µM) | 0.32 ± 0.02 | 107.61 | 4.67 |
| Medium concentration (0.5 µM) | 0.50 ± 0.03 | 99.28 | 5.90 |
| High concentration (0.85 µM) | 0.79 ± 0.03 | 93.13 | 4.13 |
| Analytical Parameters | Actual Concentration (µM) | |||
|---|---|---|---|---|
| Intraday | 40 | 110 | 185 | |
| Calculated Concentration (µM) | 0 h | 35.40 | 88.64 | 176.98 |
| 5 h | 32.20 | 92.43 | 202.56 | |
| 10 h | 32.32 | 92.87 | 203.56 | |
| % Recovery | 0 h | 88.51 | 80.58 | 95.66 |
| 5 h | 80.50 | 84.03 | 109.49 | |
| 10 h | 80.80 | 84.43 | 110.03 | |
| % Accuracya | 0 h | 111.49 | 119.42 | 104.34 |
| 5 h | 119.51 | 115.97 | 90.51 | |
| 10 h | 119.20 | 115.57 | 89.97 | |
| Calculated Concentration (µM) | Interday | 40 | 110 | 185 |
| Interday 1 | 32.02 | 94.39 | 181.79 | |
| Interday 2 | 34.99 | 100.43 | 193.84 | |
| Interday 3 | 34.12 | 90.60 | 187.22 | |
| % Recovery | Interday 1 | 80.04 | 85.81 | 98.26 |
| Interday 2 | 87.31 | 91.30 | 104.78 | |
| Interday 3 | 85.29 | 82.36 | 101.20 | |
| % Accuracy a | Interday 1 | 119.96 | 114.19 | 101.74 |
| Interday 2 | 112.70 | 108.70 | 95.22 | |
| Interday 3 | 114.71 | 117.64 | 98.80 | |
| Analytical Parameters | Actual Concentration (µM) | |||
|---|---|---|---|---|
| Intraday | 0.3 | 0.5 | 0.85 | |
| Calculated Concentration (µM) | 0 h | 0.30 | 0.47 | 0.84 |
| 5 h | 0.29 | 0.44 | 0.77 | |
| 10 h | 0.27 | 0.44 | 0.79 | |
| % Recovery | 0 h | 98.18 | 94.82 | 99.34 |
| 5 h | 97.22 | 87.58 | 90.45 | |
| 10 h | 88.89 | 87.75 | 92.98 | |
| % Accuracy a | 0 h | 101.82 | 105.18 | 100.66 |
| 5 h | 102.79 | 112.42 | 109.55 | |
| 10 h | 111.11 | 112.25 | 107.02 | |
| Interday | 0.3 | 0.5 | 0.85 | |
| Calculated Concentration (µM) | Interday 1 | 0.27 | 0.46 | 0.72 |
| Interday 2 | 0.32 | 0.47 | 0.69 | |
| Interday 3 | 0.32 | 0.46 | 0.68 | |
| % Recovery | Interday 1 | 89.49 | 92.64 | 84.06 |
| Interday 2 | 105.46 | 94.15 | 81.57 | |
| Interday 3 | 106.90 | 92.10 | 80.51 | |
| % Accuracy a | Interday 1 | 110.51 | 107.36 | 115.94 |
| Interday 2 | 94.54 | 105.85 | 118.43 | |
| Interday 3 | 93.10 | 107.90 | 119.49 | |
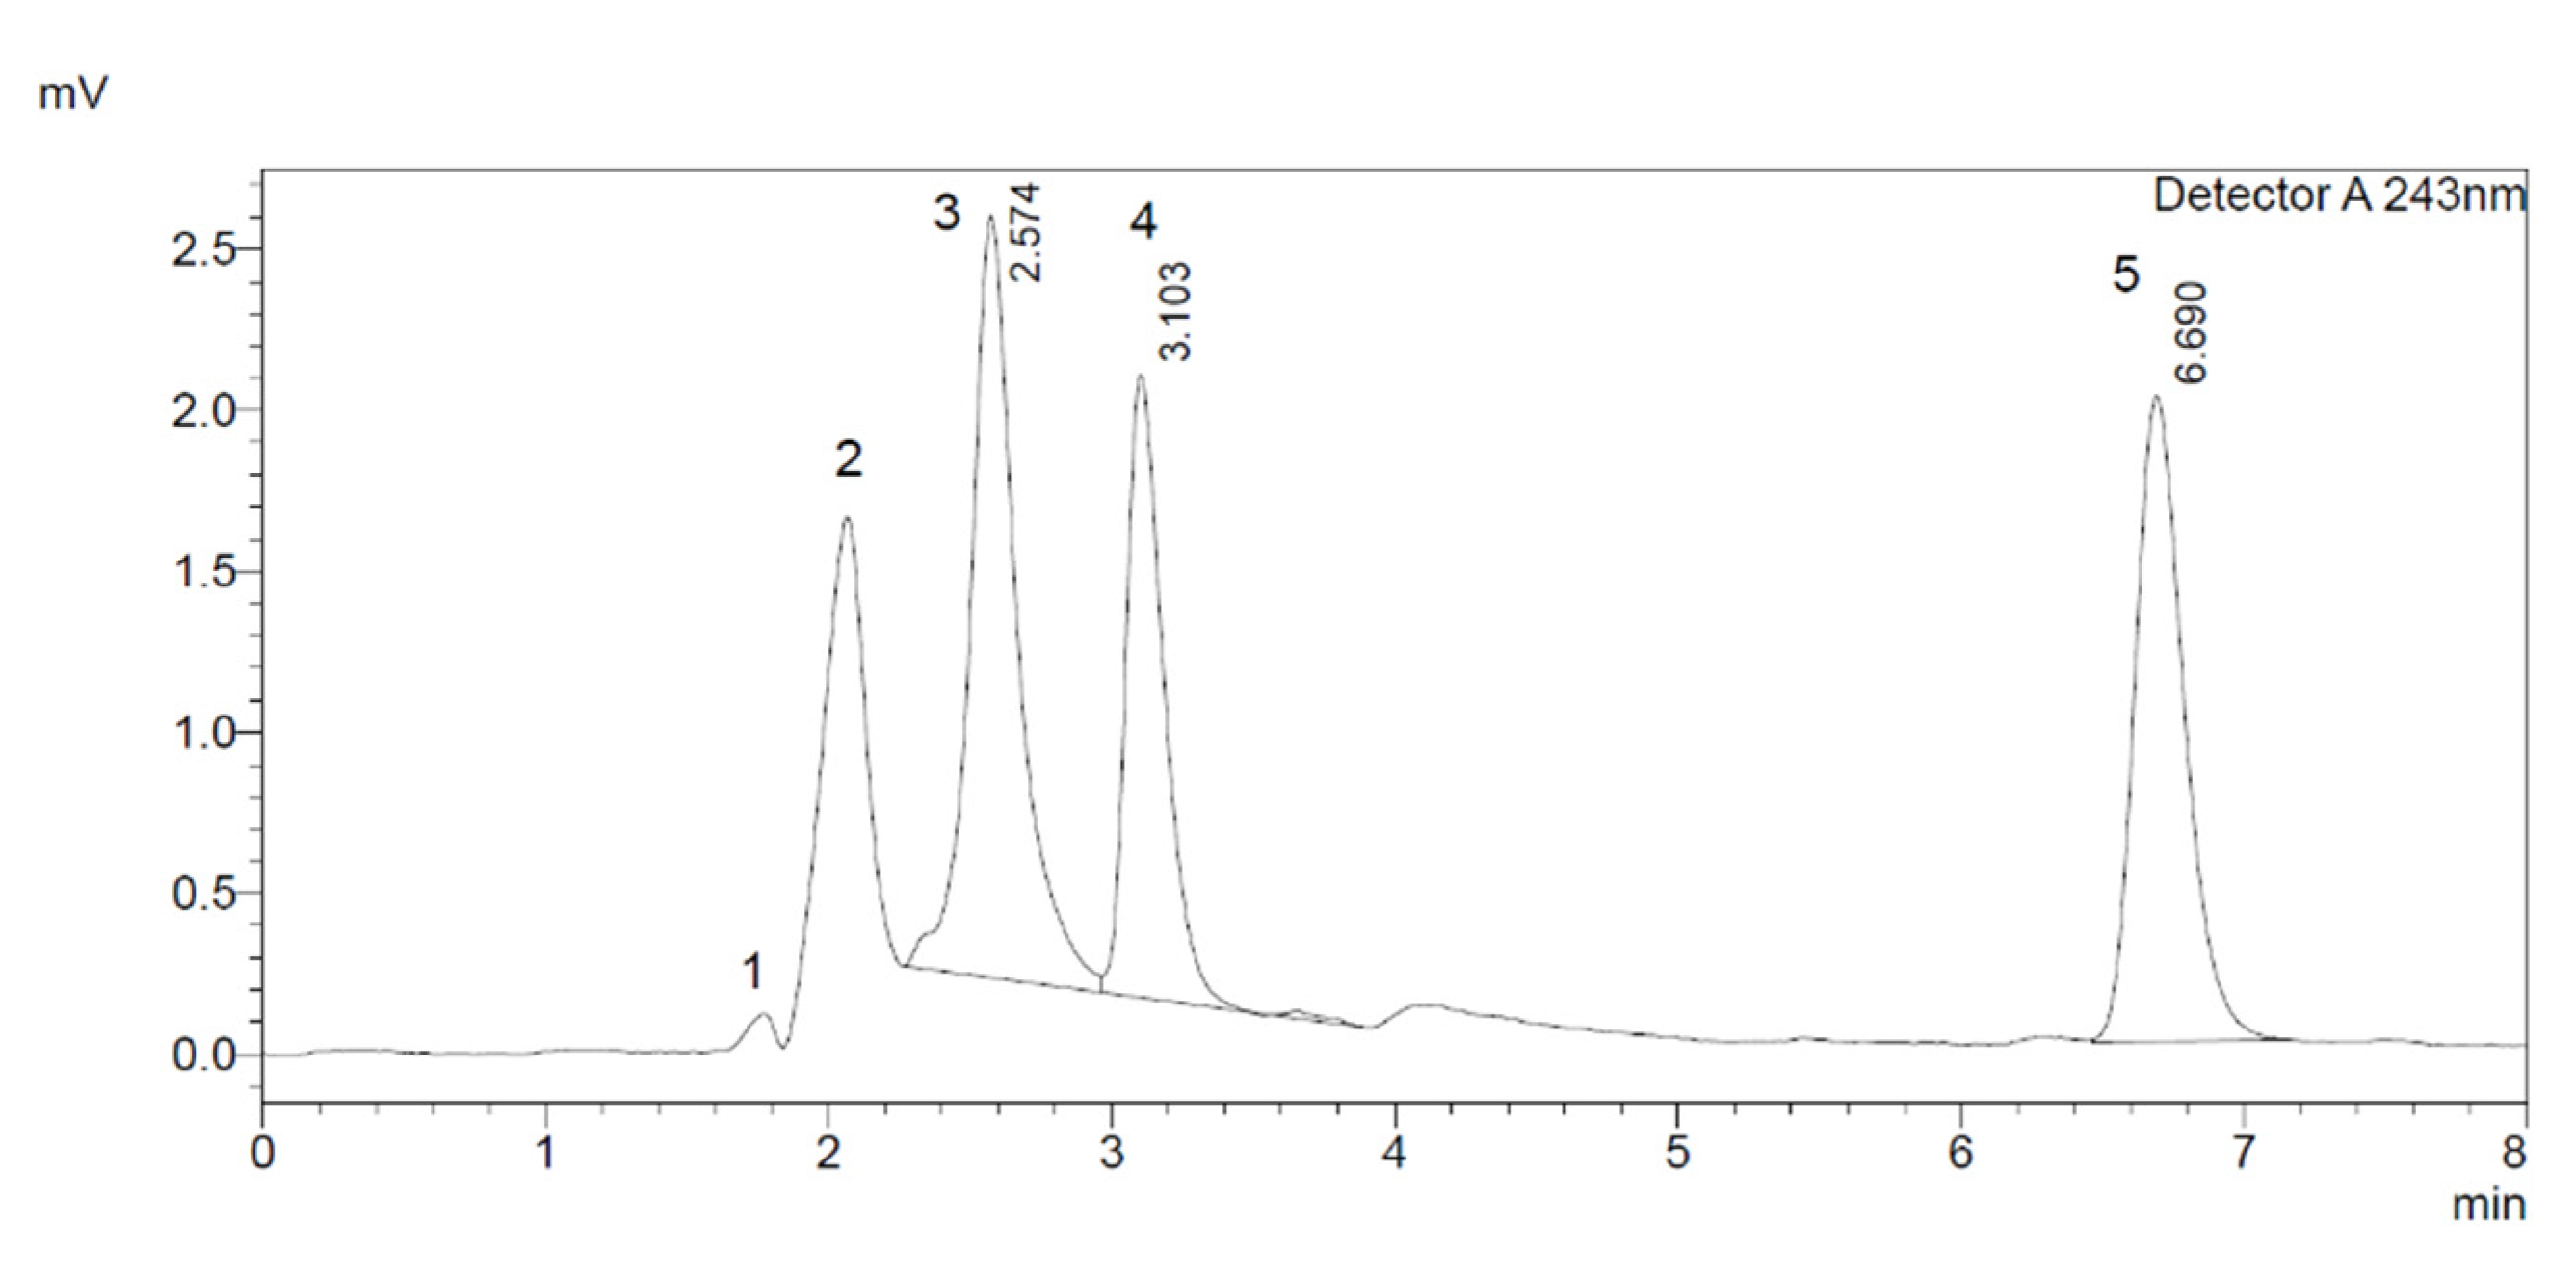
| Analytes of Interest | Average tR | Average Peak Area | Resolution |
|---|---|---|---|
| Normal Conditions (0.6 mL/min, 243 nm and 25 °C) | |||
| Aspirin | 2.04 | 16,162.67 | All compounds were well separated, and a good resolution was achieved. |
| 6β-Hydroxydexamethasone | 2.64 | 127,567.67 | |
| Dexamethasone | 3.08 | 58,676.00 | |
| 4-Hydroxyoctanophenone | 6.67 | 31,991.33 | |
| A: Temperature (30 °C) | |||
| Aspirin | 2.04 | 12,351.00 | All compounds were separated well, with a faster elution pattern as the temperature increased. |
| 6β-Hydroxydexamethasone | 2.64 | 120,462.67 | |
| Dexamethasone | 3.07 | 55,890.67 | |
| 4-Hydroxyoctanophenone | 6.51 | 29,137.67 | |
| B: Wavelength (248 nm) | |||
| Aspirin | 2.08 | 10,039.33 | All four compounds were separated, but there was a decrease in intensity of metabolite peak. |
| 6β-Hydroxydexamethasone | 2.67 | 75,995.00 | |
| Dexamethasone | 3.08 | 49,674.00 | |
| 4-Hydroxyoctanophenone | 6.61 | 53,310.00 | |
| C: Flow rate (0.8 mL/min) | |||
| Aspirin | 1.42 | 6458.00 | Peaks were separated with a 0.8 mL/min flow rate. All compounds showed a faster and narrow elution pattern. |
| 6β-Hydroxydexamethasone | 1.99 | 97,253.00 | |
| Dexamethasone | 2.33 | 38,095.00 | |
| 4-Hydroxyoctanophenone | 5.02 | 22,253.33 | |
| Aspirin Concentration | (Inhibition Parameters) | ||||
|---|---|---|---|---|---|
| Km (µM) | Vmax (µM−1∙min−1) | Clint (µM−2∙min−1) | á | %Inhibition | |
| 0 µM Aspirin | 21.23 ± 0.51 | 0.0127 ± 1.53 × 10⁻⁴ | 0.0006 ± 1.10 × 10⁻⁵ | - | - |
| 50 µM Aspirin | 23.83 ± 0.31 | 0.0123 ± 1.15 × 10⁻⁴ | 0.0005 ± 4.00 × 10⁻⁶ | 1.03 ± 0.01 | 12.44 ± 1.20 |
| 100 µM Aspirin | 26.13 ± 0.70 | 0.0127 ± 7.94 × 10⁻⁴ | 0.0005 ± 5.00 × 10⁻⁵ | 1.02 ± 0.06 | 23.29 ± 3.30 |
| 200 µM Aspirin | 32.57 ± 0.35 | 0.0123 ± 1.73 × 10⁻⁴ | 0.0004 ± 1.00 × 10⁻⁵ | 1.04 ± 0.01 | 53.64 ± 1.76 |
| Aspirin | 6β-Hydroxydexamethasone | Dexamethasone | Internal Standard | |||||
|---|---|---|---|---|---|---|---|---|
| Retention Time (tR) | 2.09 | 2.65 | 3.08 | 6.66 | ||||
| Efficiency (N) | 1078 | 970 | 3363 | 6137 | ||||
| Plate Height (H) | 1.39 × 10⁻² | 1.55 × 10⁻² | 4.46 × 10⁻³ | 2.44 × 10⁻³ | ||||
| Resolution (Rs) | 1.58 | 1.33 | 11.01 | |||||
| Asymmetry Factor (AsF) | 0.97 | 1.03 | 1.07 | 1.07 | ||||
Publisher’s Note: MDPI stays neutral with regard to jurisdictional claims in published maps and institutional affiliations. |
© 2022 by the authors. Licensee MDPI, Basel, Switzerland. This article is an open access article distributed under the terms and conditions of the Creative Commons Attribution (CC BY) license (https://creativecommons.org/licenses/by/4.0/).
Share and Cite
Hussain, A.; Naughton, D.P.; Barker, J. Development and Validation of a Novel HPLC Method to Analyse Metabolic Reaction Products Catalysed by the CYP3A2 Isoform: In Vitro Inhibition of CYP3A2 Enzyme Activity by Aspirin (Drugs Often Used Together in COVID-19 Treatment). Molecules 2022, 27, 927. https://doi.org/10.3390/molecules27030927
Hussain A, Naughton DP, Barker J. Development and Validation of a Novel HPLC Method to Analyse Metabolic Reaction Products Catalysed by the CYP3A2 Isoform: In Vitro Inhibition of CYP3A2 Enzyme Activity by Aspirin (Drugs Often Used Together in COVID-19 Treatment). Molecules. 2022; 27(3):927. https://doi.org/10.3390/molecules27030927
Chicago/Turabian StyleHussain, Amira, Declan P. Naughton, and James Barker. 2022. "Development and Validation of a Novel HPLC Method to Analyse Metabolic Reaction Products Catalysed by the CYP3A2 Isoform: In Vitro Inhibition of CYP3A2 Enzyme Activity by Aspirin (Drugs Often Used Together in COVID-19 Treatment)" Molecules 27, no. 3: 927. https://doi.org/10.3390/molecules27030927
APA StyleHussain, A., Naughton, D. P., & Barker, J. (2022). Development and Validation of a Novel HPLC Method to Analyse Metabolic Reaction Products Catalysed by the CYP3A2 Isoform: In Vitro Inhibition of CYP3A2 Enzyme Activity by Aspirin (Drugs Often Used Together in COVID-19 Treatment). Molecules, 27(3), 927. https://doi.org/10.3390/molecules27030927