
Improved Cathepsin Probes for Sensitive Molecular Imaging

 , , , and
Abstract
:1. Introduction
2. Results
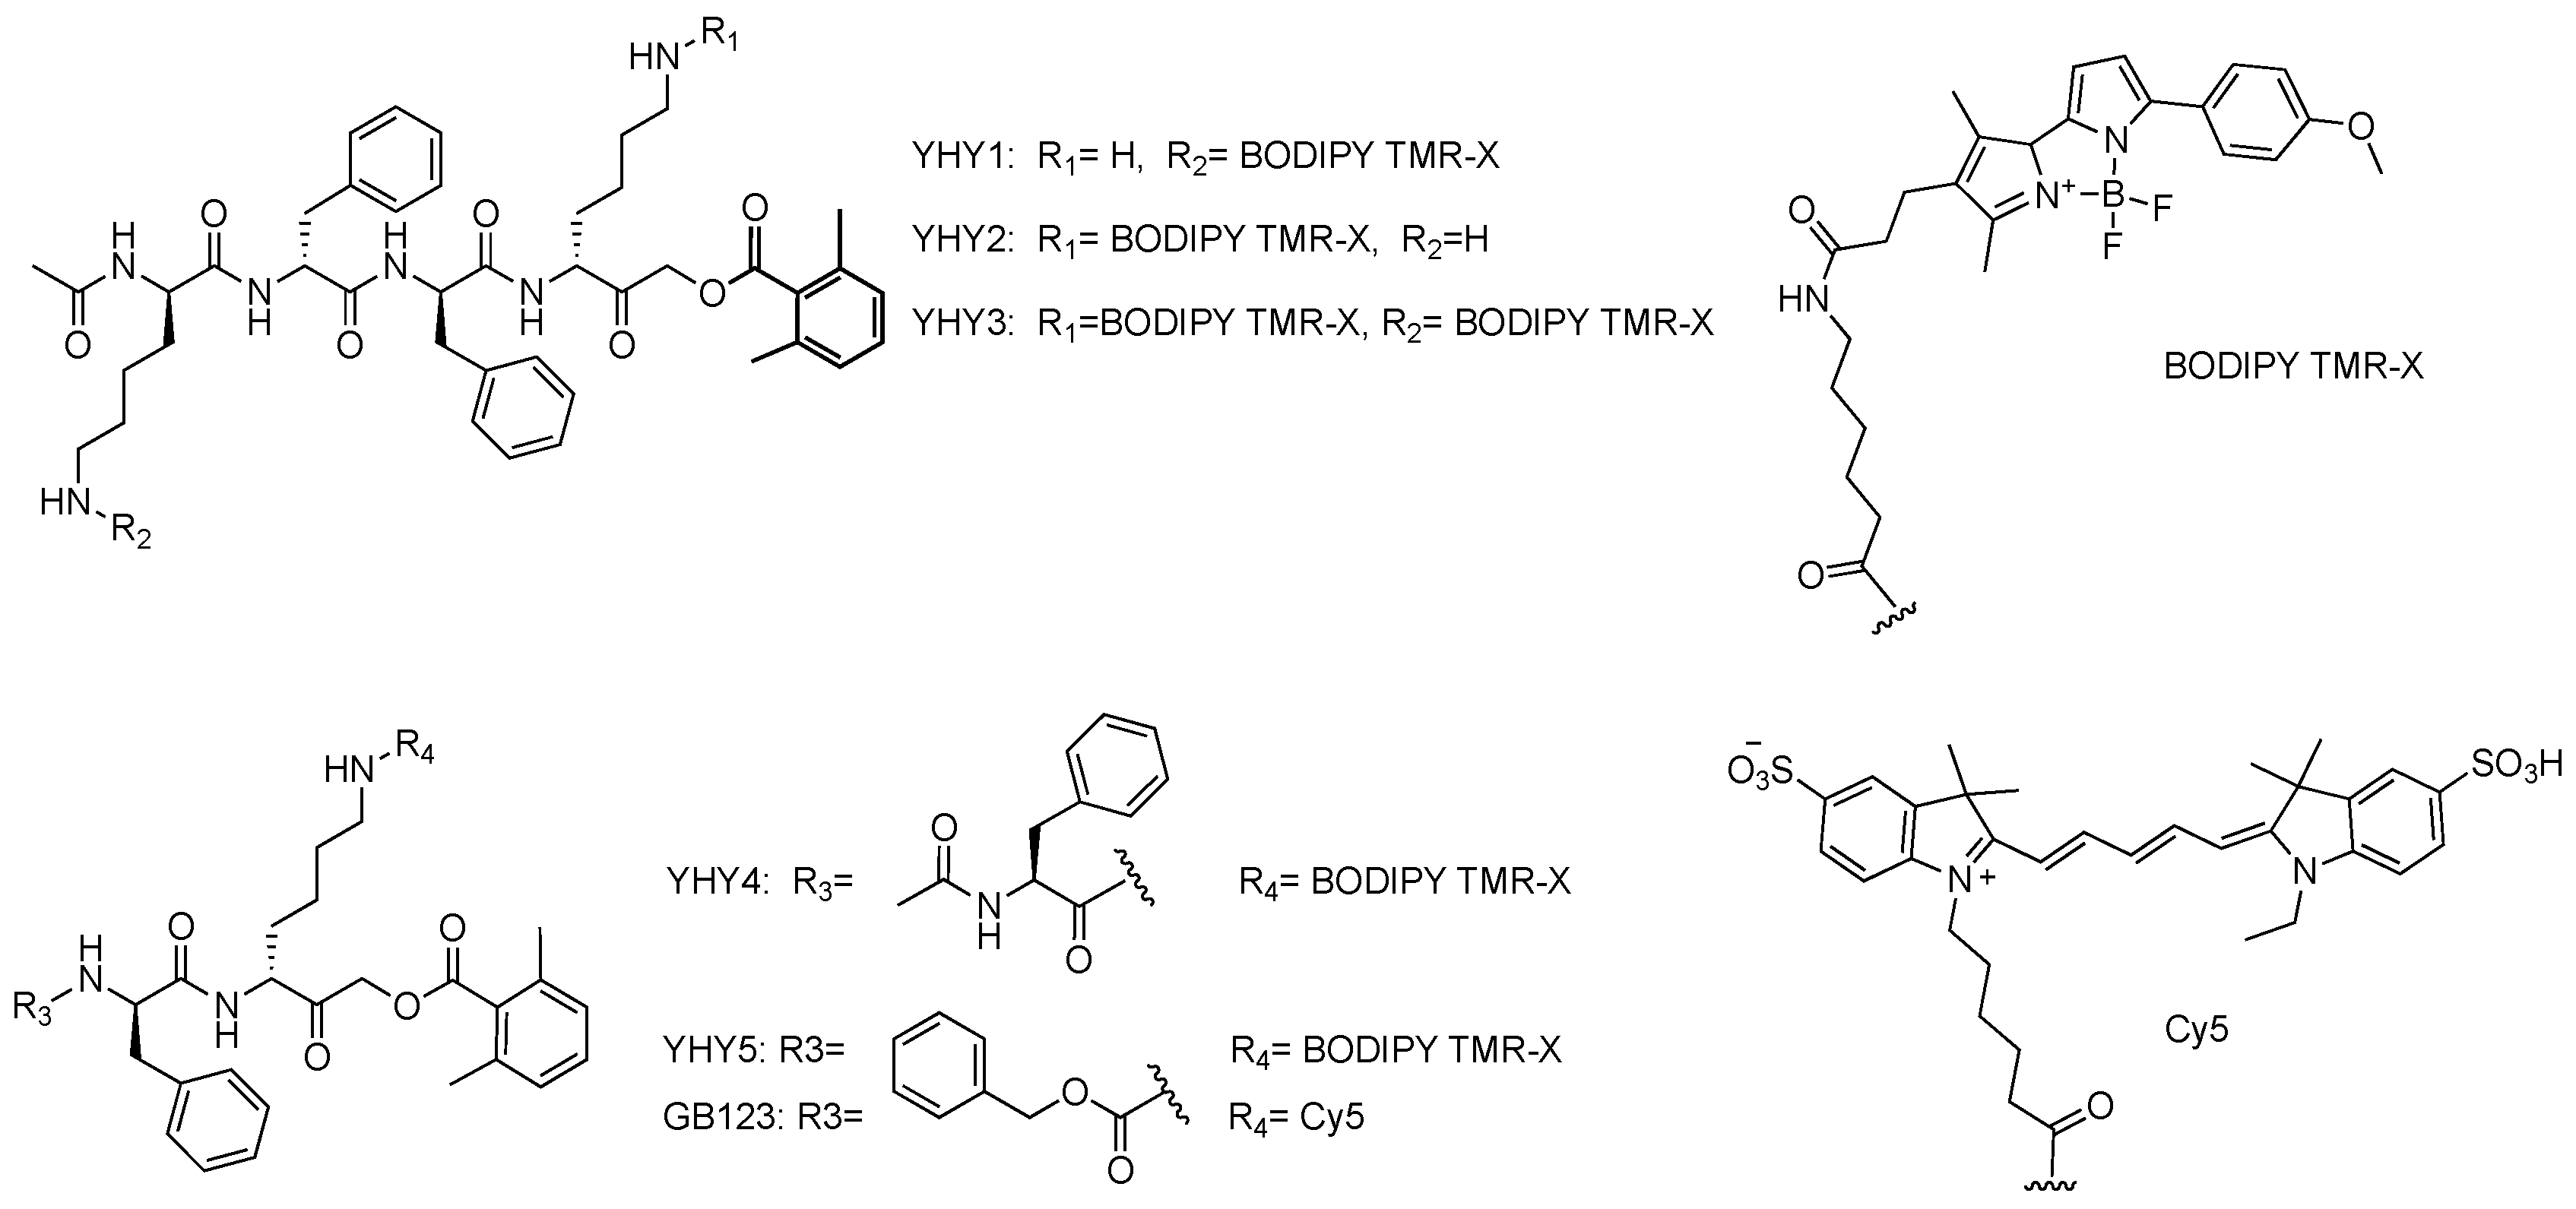
2.1. Probe Design
2.2. Biological Evaluations of Probes
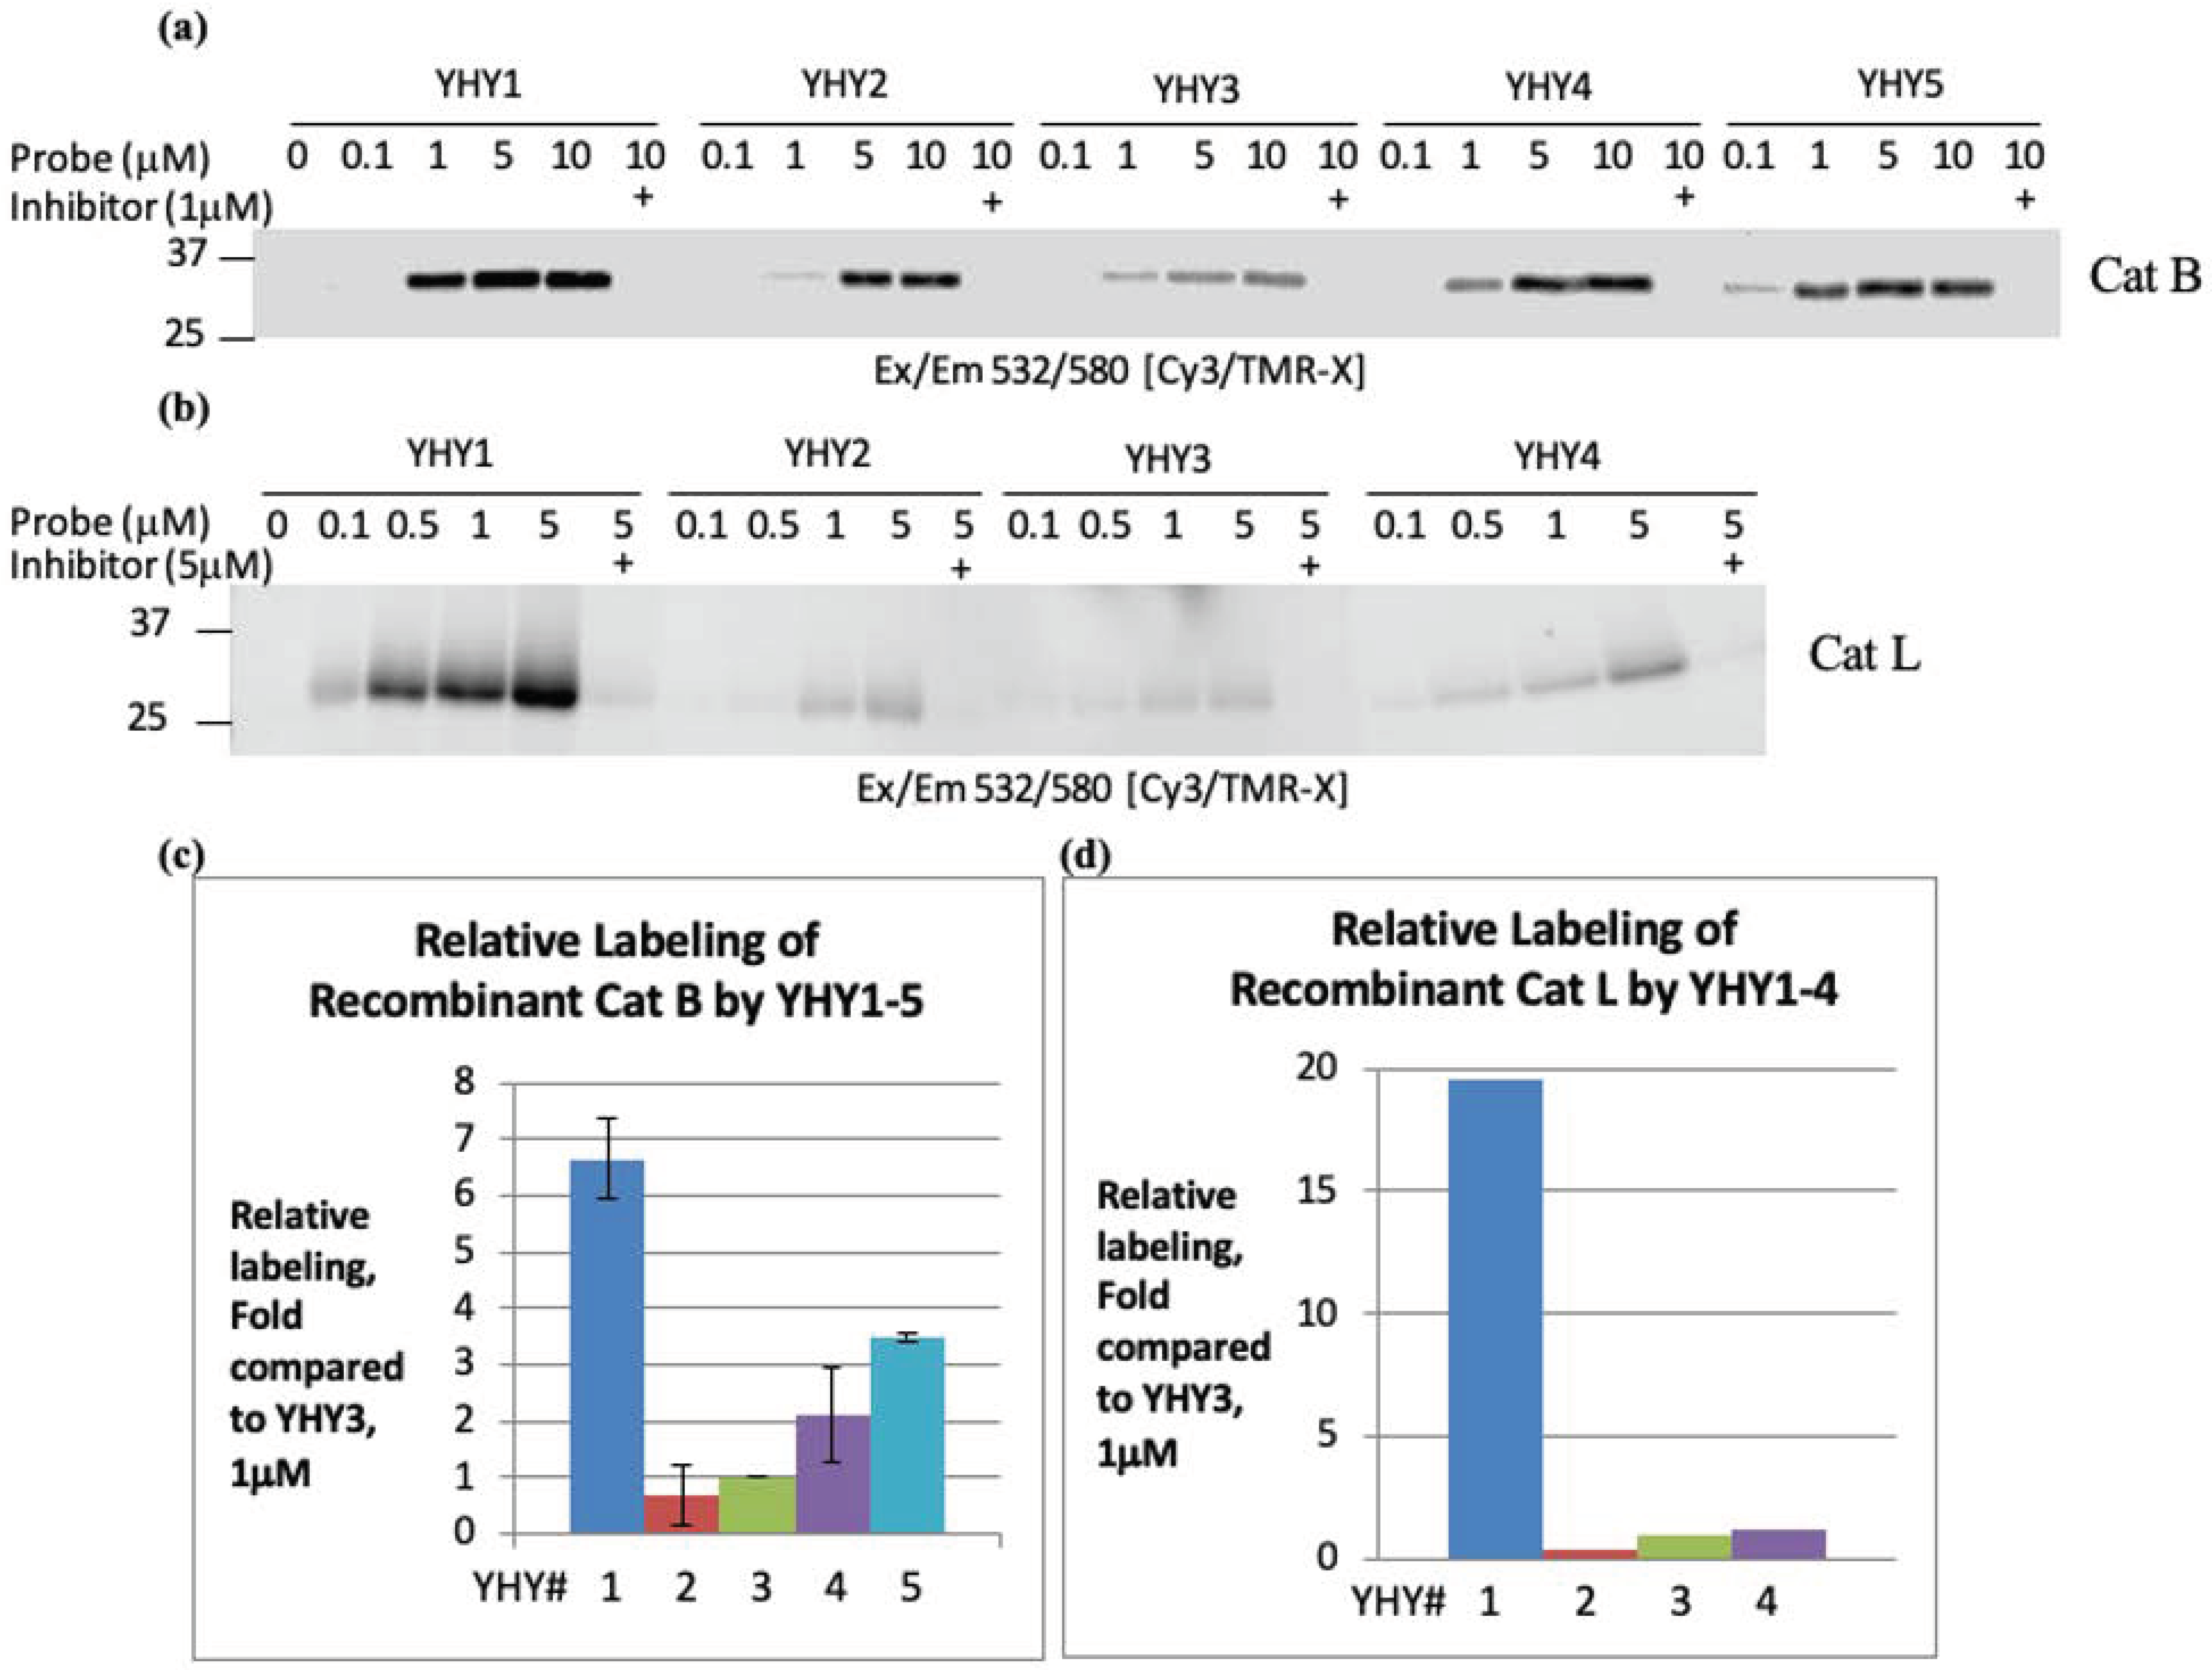
2.3. Labeling of Recombinant Cathepsin B and L
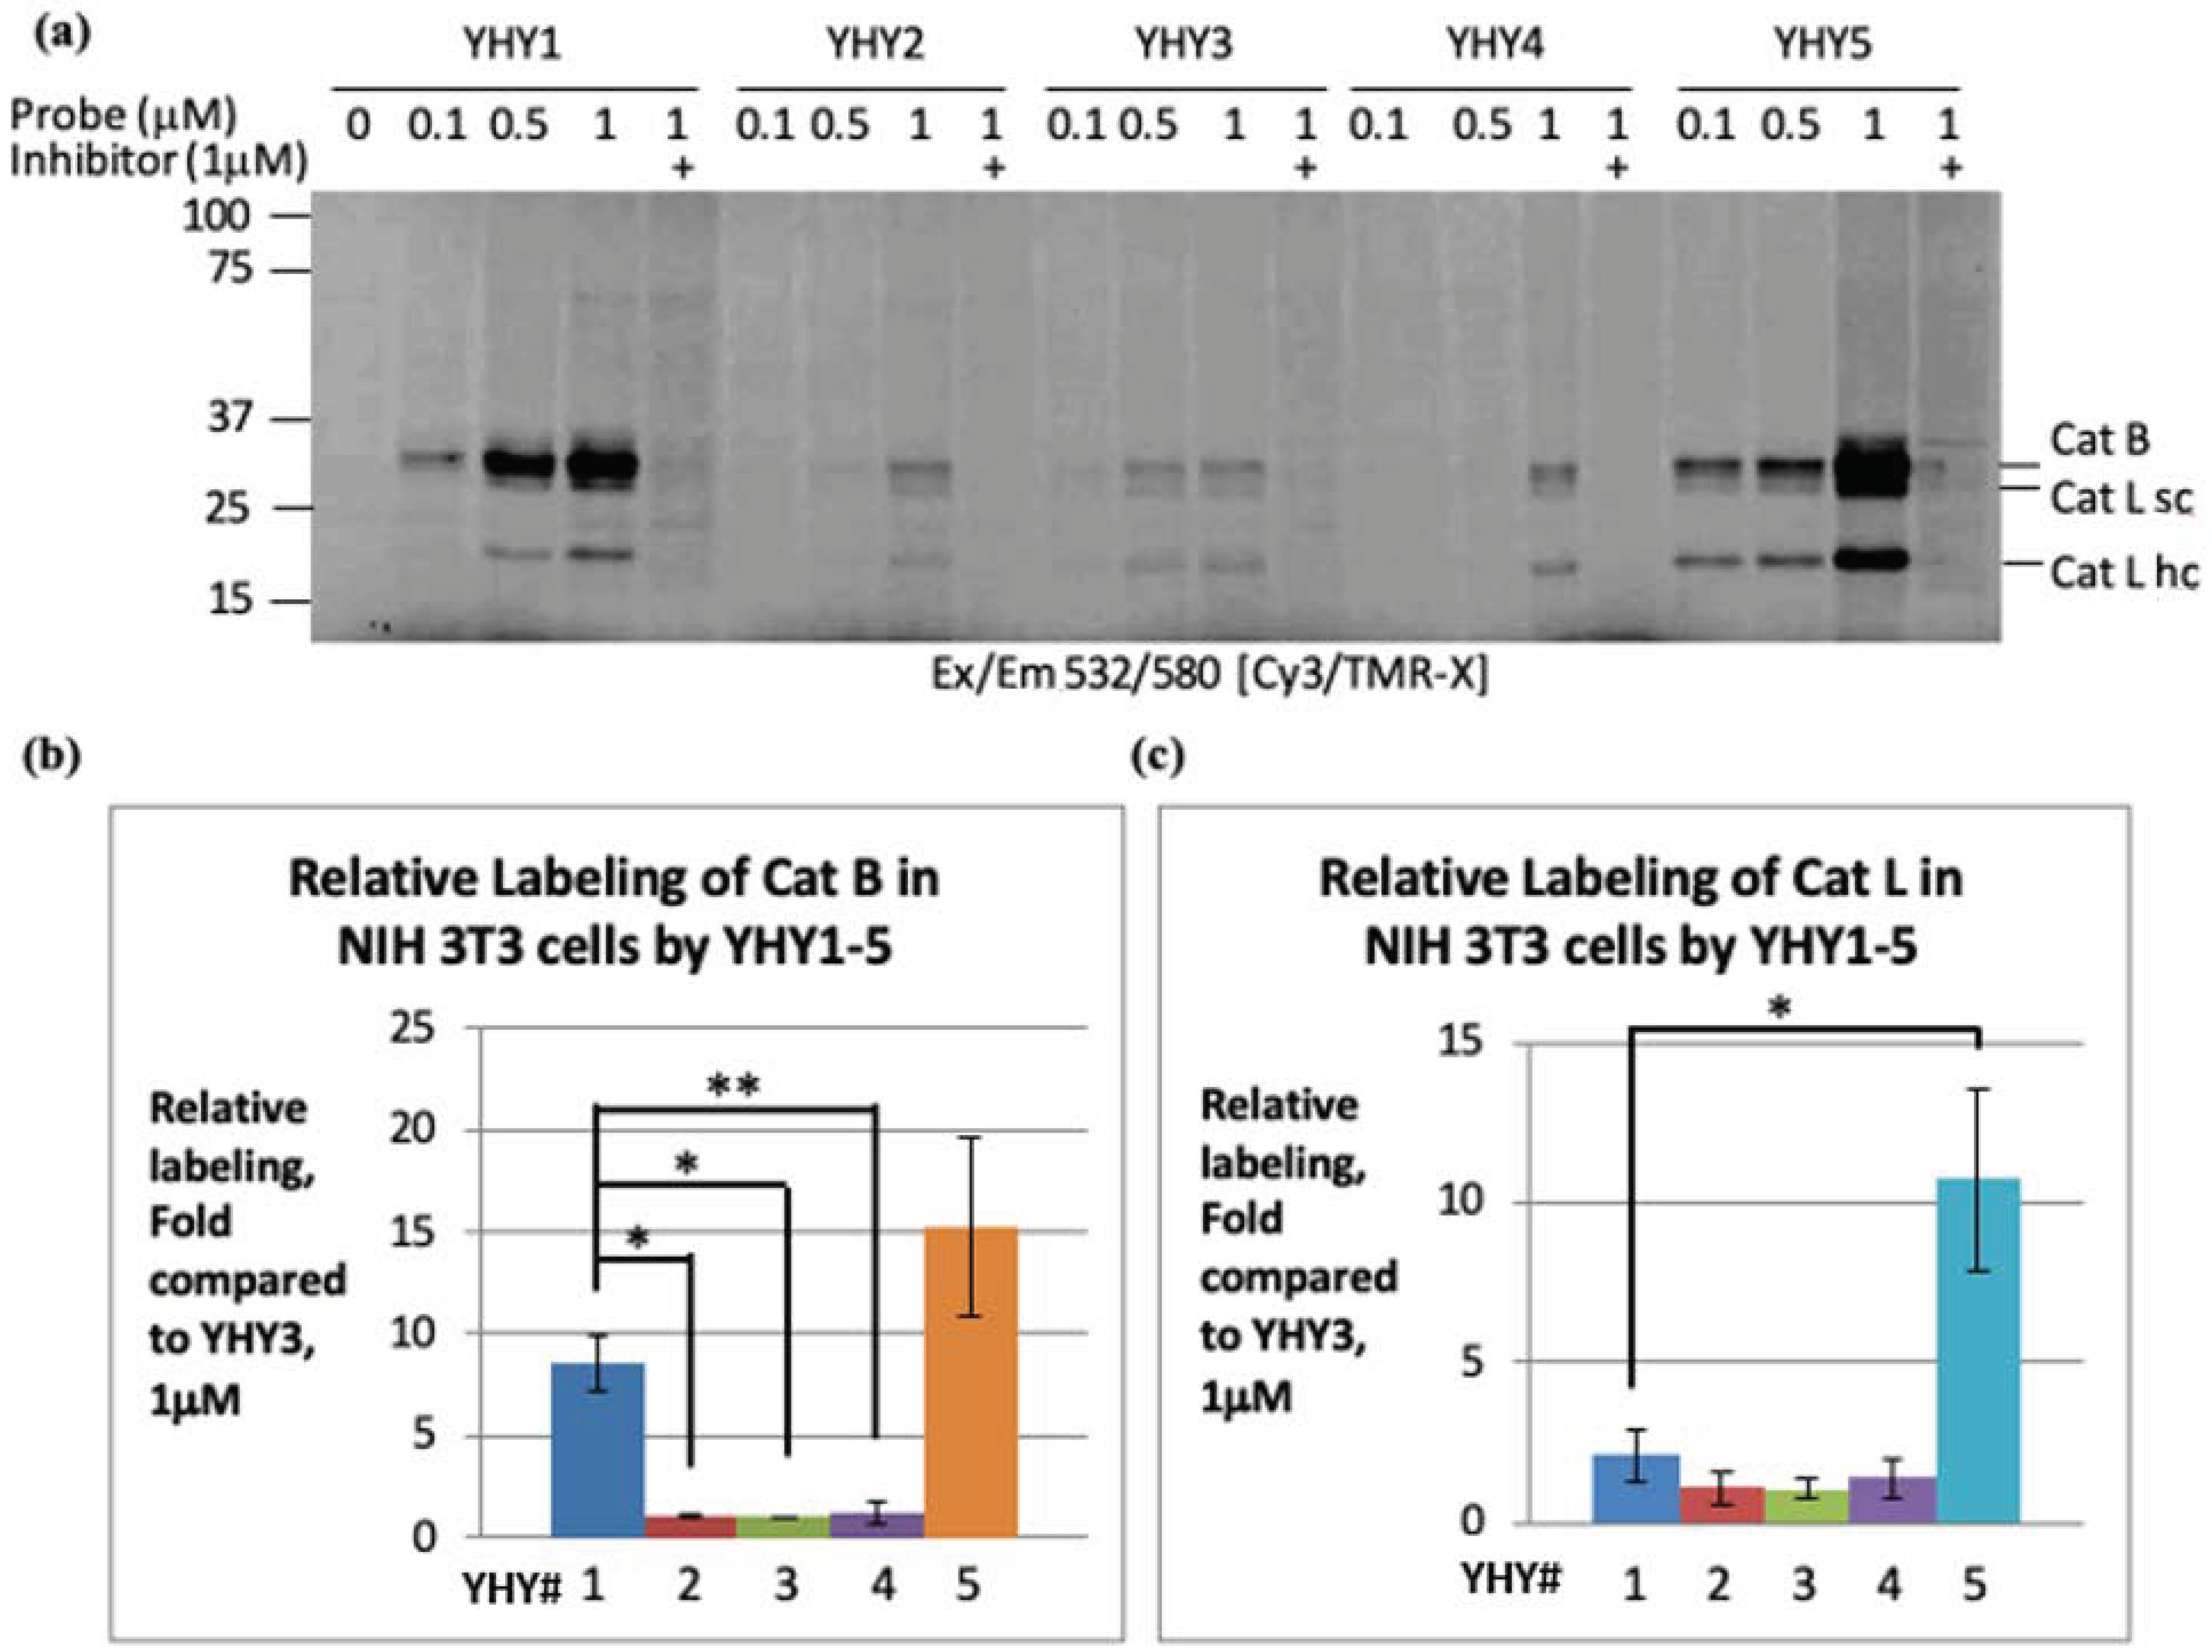
2.4. Labeling of Cathepsins in Intact Cells
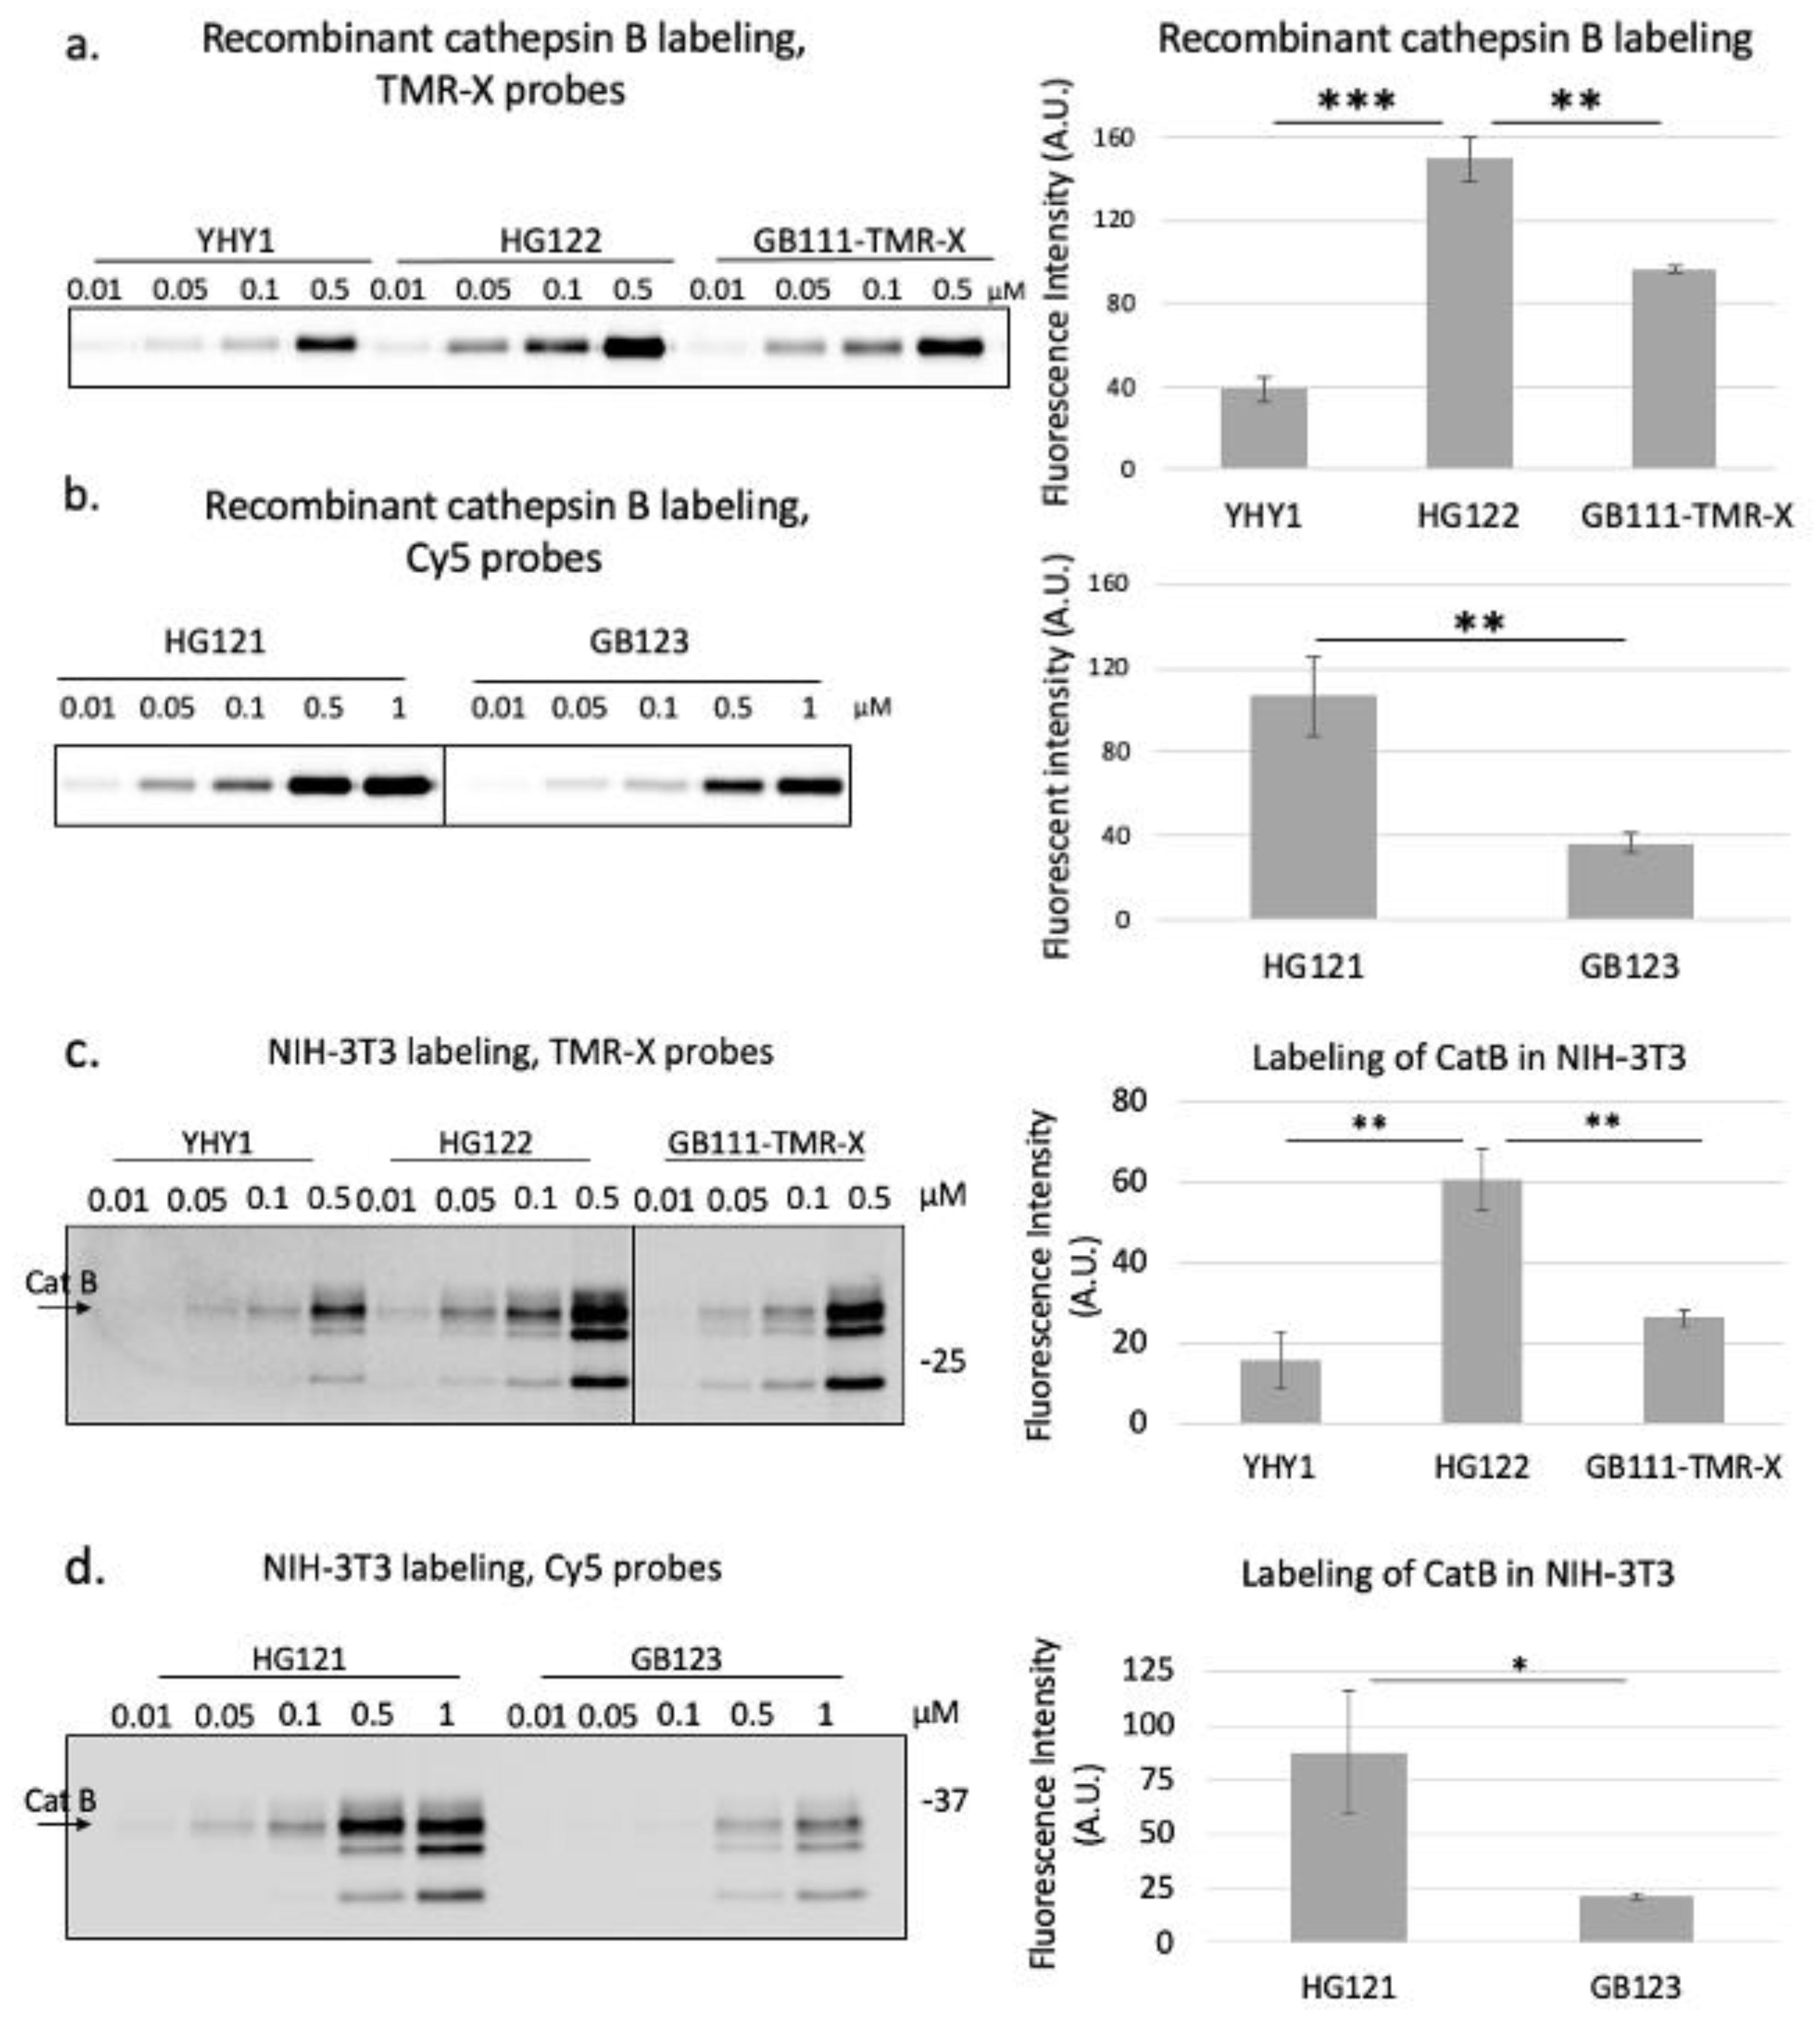
2.5. Second Generation Probes
2.6. Biochemical Evaluation of the Second Generation Probes
3. Discussion
4. Materials and Methods
4.1. General Methods
4.2. Chemical Synthesis and Characterization of Probes
4.3. Solid-Phase Peptide Synthesis
4.4. Removal of Protecting Groups
4.5. Compound Cleavage from Resin
4.6. Purification and Characterization
4.7. Recombinant Cathepsin Labeling of the Probes
4.8. Cell Permeability Assay
4.9. Gel Quantification and Statistical Analysis
5. Conclusions
Supplementary Materials
Author Contributions
Funding
Institutional Review Board Statement
Informed Consent Statement
Data Availability Statement
Conflicts of Interest
Sample Availability
References
- Lecaille, F.; Bromme, D.; Lalmanach, G. Biochemical properties and regulation of cathepsin K activity. Biochimie 2008, 90, 208–226. [Google Scholar] [CrossRef] [PubMed]
- Reiser, J.; Adair, B.; Reinheckel, T. Specialized roles for cysteine cathepsins in health and disease. J. Clin. Investig. 2010, 120, 3421–3431. [Google Scholar] [CrossRef] [PubMed] [Green Version]
- Wilkinson, R.D.; Williams, R.; Scott, C.J.; Burden, R.E. Cathepsin S: Therapeutic, diagnostic, and prognostic potential. Biol. Chem. 2015, 396, 867–882. [Google Scholar] [CrossRef] [PubMed]
- Li, W.; Yuan, X.M. Increased expression and translocation of lysosomal cathepsins contribute to macrophage apoptosis in atherogenesis. Ann. N. Y. Acad. Sci. 2004, 1030, 427–433. [Google Scholar] [CrossRef] [PubMed]
- Sudhan, D.R.; Siemann, D.W. Cathepsin L targeting in cancer treatment. Pharmacol. Ther. 2015, 155, 105–116. [Google Scholar] [CrossRef] [PubMed] [Green Version]
- Bian, B.; Mongrain, S.; Cagnol, S.; Langlois, M.J.; Boulanger, J.; Bernatchez, G.; Carrier, J.C.; Boudreau, F.; Rivard, N. Cathepsin B promotes colorectal tumorigenesis, cell invasion, and metastasis. Mol. Carcinog. 2016, 55, 671–687. [Google Scholar] [CrossRef] [PubMed]
- Singh, N.; Das, P.; Gupta, S.; Sachdev, V.; Srivasatava, S.; Datta Gupta, S.; Pandey, R.M.; Sahni, P.; Chauhan, S.S.; Saraya, A. Plasma cathepsin L: A prognostic marker for pancreatic cancer. World J. Gastroenterol. 2014, 20, 17532–17540. [Google Scholar] [CrossRef] [PubMed]
- Kramer, L.; Turk, D.; Turk, B. The Future of Cysteine Cathepsins in Disease Management. Trends Pharmacol. Sci. 2017, 38, 873–898. [Google Scholar] [CrossRef] [PubMed]
- Vizovisek, M.; Vidmar, R.; Drag, M.; Fonovic, M.; Salvesen, G.S.; Turk, B. Protease Specificity: Towards In Vivo Imaging Applications and Biomarker Discovery. Trends Biochem. Sci. 2018, 43, 829–844. [Google Scholar] [CrossRef] [PubMed]
- Blum, G. Use of fluorescent imaging to investigate pathological protease activity. Curr. Opin. Drug Discov. Dev. 2008, 11, 708–716. [Google Scholar]
- Blum, G.; von Degenfeld, G.; Merchant, M.J.; Blau, H.M.; Bogyo, M. Noninvasive optical imaging of cysteine protease activity using fluorescently quenched activity-based probes. Nat. Chem. Biol. 2007, 3, 668–677. [Google Scholar] [CrossRef] [PubMed]
- Blum, G.; Mullins, S.R.; Keren, K.; Fonovic, M.; Jedeszko, C.; Rice, M.J.; Sloane, B.F.; Bogyo, M. Dynamic imaging of protease activity with fluorescently quenched activity-based probes. Nat. Chem. Biol. 2005, 1, 203–209. [Google Scholar] [CrossRef] [PubMed]
- Chenoweth, D.M.; Harki, D.A.; Dervan, P.B. Solution-phase synthesis of pyrrole-imidazole polyamides. J. Am. Chem. Soc. 2009, 131, 7175–7181. [Google Scholar] [CrossRef] [PubMed] [Green Version]
- Salpeter, S.J.; Pozniak, Y.; Merquiol, E.; Ben-Nun, Y.; Geiger, T.; Blum, G. A novel cysteine cathepsin inhibitor yields macrophage cell death and mammary tumor regression. Oncogene 2015, 34, 6066–6078. [Google Scholar] [CrossRef] [PubMed]
- Schneider, C.A.; Rasband, W.S.; Eliceiri, K.W. NIH Image to ImageJ: 25 years of image analysis. Nat. Methods 2012, 9, 671–675. [Google Scholar] [CrossRef] [PubMed]
- Han, G.; Tamaki, M.; Hruby, V.J. Fast, efficient and selective deprotection of the tert-butoxycarbonyl (Boc) group using HCl/dioxane (4 m). J. Pept. Res. 2001, 58, 338–341. [Google Scholar] [CrossRef] [PubMed]
- Chatterjee, J.; Laufer, B.; Kessler, H. Synthesis of N-methylated cyclic peptides. Nat. Protoc. 2012, 7, 432–444. [Google Scholar] [CrossRef] [PubMed]
- Ben-Nun, Y.; Merquiol, E.; Brandis, A.; Turk, B.; Scherz, A.; Blum, G. Photodynamic quenched cathepsin activity based probes for cancer detection and macrophage targeted therapy. Theranostics 2015, 5, 847–862. [Google Scholar] [CrossRef] [PubMed] [Green Version]
- Ren, G.; Blum, G.; Verdoes, M.; Liu, H.; Syed, S.; Edgington, L.E.; Gheysens, O.; Miao, Z.; Jiang, H.; Gambhir, S.S.; et al. Non-invasive imaging of cysteine cathepsin activity in solid tumors using a 64Cu-labeled activity-based probe. PLoS ONE 2011, 6, e28029. [Google Scholar] [CrossRef] [PubMed]
- Kato, D.; Boatright, K.M.; Berger, A.B.; Nazif, T.; Blum, G.; Ryan, C.; Chehade, K.A.; Salvesen, G.S.; Bogyo, M. Activity-based probes that target diverse cysteine protease families. Nat. Chem. Biol. 2005, 1, 33–38. [Google Scholar] [CrossRef] [PubMed]


Publisher’s Note: MDPI stays neutral with regard to jurisdictional claims in published maps and institutional affiliations. |
© 2022 by the authors. Licensee MDPI, Basel, Switzerland. This article is an open access article distributed under the terms and conditions of the Creative Commons Attribution (CC BY) license (https://creativecommons.org/licenses/by/4.0/).
Share and Cite
Yitzhak, Y.; Gaikwad, H.; Weiss-Sadan, T.; Merquiol, E.; Turk, B.; Blum, G. Improved Cathepsin Probes for Sensitive Molecular Imaging. Molecules 2022, 27, 842. https://doi.org/10.3390/molecules27030842
Yitzhak Y, Gaikwad H, Weiss-Sadan T, Merquiol E, Turk B, Blum G. Improved Cathepsin Probes for Sensitive Molecular Imaging. Molecules. 2022; 27(3):842. https://doi.org/10.3390/molecules27030842
Chicago/Turabian StyleYitzhak, Yonit, Hanmant Gaikwad, Tommy Weiss-Sadan, Emmanuelle Merquiol, Boris Turk, and Galia Blum. 2022. "Improved Cathepsin Probes for Sensitive Molecular Imaging" Molecules 27, no. 3: 842. https://doi.org/10.3390/molecules27030842
APA StyleYitzhak, Y., Gaikwad, H., Weiss-Sadan, T., Merquiol, E., Turk, B., & Blum, G. (2022). Improved Cathepsin Probes for Sensitive Molecular Imaging. Molecules, 27(3), 842. https://doi.org/10.3390/molecules27030842