Article

Efficient Degradation of Congo Red in Water by UV-Vis Driven CoMoO4/PDS Photo-Fenton System

1
Institute of Environment and Ecology, Shandong Normal University, Jinan 250358, China
2
School of Environmental and Municipal Engineering, Qingdao University of Technology, Qingdao 266525, China
3
Middle School of Gantian, Chenzhou 424400, China
4
Key Laboratory for Liquid-Solid Structural Evolution and Processing of Materials, Shandong University, Jinan 250061, China
*
Authors to whom correspondence should be addressed.
Molecules 2022, 27(24), 8642; https://doi.org/10.3390/molecules27248642
Submission received: 28 October 2022 / Revised: 26 November 2022 / Accepted: 1 December 2022 / Published: 7 December 2022
(This article belongs to the Special Issue Recent Advances in Photocatalysts)

Abstract

:
In order to improve the catalytic activity of cobalt molybdate (CoMoO4), a PDS-activated and UV-vis assisted system was constructed. CoMoO4 was prepared by coprecipitation and calcination, and characterized by XRD, FTIR, Raman, SEM, TEM, XPS, TGA Zeta potential, BET, and UV-Vis DRS. The results showed that the morphology of the CoMoO4 nanolumps consisted of stacked nanosheets. XRD indicated the monoclinic structures with C2/m (C32h, #12) space group, which belong to α-CoMoO4, and both Co2+ and Mo6+ ions occupy distorted octahedral sites. The pH of the isoelectric point (pHIEP) of CMO-8 at pH = 4.88 and the band gap of CoMoO4 was 1.92 eV. The catalytic activity of CoMoO4 was evaluated by photo-Fenton degradation of Congo red (CR). The catalytic performance was affected by calcination temperature, catalyst dosage, PDS dosage, and pH. Under the best conditions (0.8 g/L CMO-8, PDS 1 mL), the degradation efficiency of CR was 96.972%. The excellent catalytic activity of CoMoO4 was attributed to the synergistic effect of photo catalysis and CoMoO4-activated PDS degradation. The capture experiments and the ESR showed that superoxide radical (·O2), singlet oxygen (1O2), hole (h+), sulfate (SO4·), and hydroxyl (·OH) were the main free radicals leading to the degradation of CR. The results can provide valuable information and support for the design and application of high-efficiency transition metal oxide catalysts.

1. Introduction

Congo red (CR) is an azo dye in organic dyes (Figure 1), which is widely used in papermaking, plastics, cosmetics, pharmaceuticals, and other fields. However, its widespread use also brings a variety of problems, such as reduced visibility of water, resulting in water ecological environment problems [1,2,3]. It is also harmful to human health, owing to its teratogenicity and carcinogenic potential [4,5,6,7]. Thus, it is of great significance to find an effective way to treat CR-polluted wastewater.
In general, membrane filtration processes, precipitation, coagulation, biological treatment, adsorption, ion exchange, electrochemical processes, advanced oxidation processes (AOPs), and ozonation are suitable choices [8,9,10,11,12,13,14]. AOPs were considered to be an effective method for degrading organic dye wastewater [15]. Fenton technology has been widely applied to the degradation of organic dye wastewater. However, the low pH, low utilization of oxidant, large amount of reagent, and the formation of an iron sludge precipitation limit its wide application [16]. In addition to Fenton oxidation, persulphate oxidation as a type of AOPs has also attracted much attention in the field of wastewater treatment. Persulfate oxidation can produce strong oxidizing sulfate radicals (SO4·) under the different activation factors to degrade many organic compounds, presenting the advantages of strong oxidation ability (E0 = 2.6–3.1 V), wide pH application range (2.0–10.0), and long half-life [17]. Recent studies have shown that cobalt ions and their composites can more effectively decompose the peroxydisulfate (PDS, S2O82−) to form the free radical species [18]. Furthermore, the electron transition in Co2+ and Co3+ can also assist in the generation of radicals and non-radicals. As a highly effective photo-Fenton catalyst to decompose RhB under visible light, Li-prepared Zn/Co-ZIFs@MIL-101 (Fe) composites demonstrated a remarkable capability to remove RhB [19]. Among transition metal oxides, molybdenum oxide is a promising candidate for such applications because of its crystal structure, multiple oxidation states, N-type semiconductors, and reversible small ion storage. Molybdenum atoms in molybdate have a variety of coordination modes and redox activities, and molybdate is widely used in optical, electrochemical, magnetic, antimicrobial, and other functional materials [20,21,22,23,24]. Molybdate can be prepared by various simple methods, including hydrothermal synthesis, coprecipitation, and so on [25,26,27,28]. It is very noteworthy that these characteristics also cater to PDS activation.
CoMoO4 as a promising electrochemical material due to its stable crystal structure, high conductivity, fast electron transmission, and high redox ability, also shows good catalytic activity in PMS activation for organic degradation [29]. In addition, CoMoO4 can complete photogenerated electron transition under UV-vis irradiation, but the hole-electron recombination is easy [30]. Previous studies of CoMoO4 as a photo-catalyst are shown in Table 1 [29,31,32,33,34]. In comparison with PMS, PDS has drawn growing attention due to its high solubility and stability under mild conditions. Accordingly, we chose PDS to construct the CMO-PDS system [35]. Therefore, wolframite cobalt molybdate catalyst was successfully synthesized by the coprecipitation and calcination method. After activation by persulfate (PDS), the CR dye solution was degraded by photocatalytic reaction.
In this study, CoMoO4 was prepared by co-precipitation and calcination, and characterized by XRD, FTIR, Raman, SEM, TEM, XPS, TGA, DTG, Zeta, BET, UV-Vis DRS, and ESR. Due to the excellent performance of CoMoO4 for organic dye pollutant degradation, we chose it as a catalyst for the degradation of CR dye wastewater. The photo-Fenton degradation of CR, capture experiment to evaluate the activity of the catalyst, and the photo-Fenton catalytic activity of the catalyst were affected by calcination temperature, catalyst dosage, PDS dosage, and pH. The capture experiment and ESR verified that ·O2, ·OH, SO4·, h+, and 1O2 were the main active species (ROS). The experimental results indicated that the transition metal oxides provided support for the degradation of organic dyes. The results can provide valuable information and support the design and application of high-efficiency transition metal oxide catalysts.

2. Experiment

2.1. Chemicals and Materials

Ammonium persulfate (PDS; 98.5%), Congo red (CR; 99%), sodium molybdate dihydrate (Na2(MoO3)3·2H2O; 99.95%), cobalt chloride hexahydrate (CoCl2·6H2O; 99.95%), p-benzoquinone (p-BQ; 99%), L-histidine (99.5%), and ammonium oxalate monohydrate (AO; 99.99%) were purchased from Shanghai Macklin Biochemical Co., Ltd. (Shanghai, China). Sodium molybdate dihydrate (Na2MoO4·2H2O; 99%), ammonia solution (NH4OH), sulfuric acid (H2SO4), methanol (MeOH), ethanol (EtOH) and tert-butyl alcohol (TBA) were purchased from Sinopharm Chemical Reagent Co., Ltd. (Shanghai, China). All reagents and chemicals used in this study were of analytical grade and were used without further purification.

2.2. Preparation of Samples

CoMoO4 samples were synthesized by co-precipitation and calcination, and the specific process was as follows: CoCl2·6H2O and NaMoO4·2H2O were used as Co and Mo sources, respectively. We dissolved 1 g of CoCl2 · 6H2O in 20 mL distilled water and stirred at 70 °C; then, 30 mL deionized water containing 1.02 g of dissolved Na2MoO4 · 2H2O was added and the solution was stirred for 5 h. The purple solid obtained was centrifuged and dried at 120 °C overnight. The initial product was ground into powder, heat-treated under air atmosphere for 180 min at 800 °C (900, 1000 °C) at a heating rate of 2 °C min−1 and naturally cooled to room temperature. The obtained products were named as CMO-8, CMO-9, and CMO-1.

2.3. Characterization

Powder X-ray diffraction (XRD) patterns of the as-prepared samples were obtained at room temperature with a D/MAXRC X-ray diffractometer using Cu Ka radiation source which operated at 45 kV and 40 mA. The structure and morphology of the sample was performed by scanning electron microscopy (SEM, Zeiss Gemini 300, Gena, Germany) and transmission electron microscopy (TEM, JEOL JEM-2100F Japan). Raman spectra were obtained using a confocal Raman microscope Horiba LabRAM HR (Bruker, Billerica, MA, USA) excited by a laser source of 10 W at a specific λ of 325 nm. The Fourier transform infrared (FTIR) spectra were collected on a ThermoScientific Nicolet IS5 Fourier Transform infrared spectrometer (Waltham, NJ, USA) in the wavenumber range of 400–4000 cm−1 resolution through the KBr pellet method. Thermal analysis was studied by a Netzsch TG209F3 (Netzsch TG209F3, Bayern, Germany) at a heating temperature ramping rate of 10 °C min−1 in the temperature range of 40–800 °C under air/N2 atmosphere. The pH of the isoelectric point (pHIEP) of materials was determined by using a Zetasizer Nano analyzer (Malvern zetasizer nano ZS, Malvern, UK). The Brunauer-Emmett-Teller (BET) specific surface area of the sample was measured using the Autosorb-iQ instrument (Tristar II 3020, USA). The UV-vis diffuse reflectance spectra (UV-vis DRS) of the samples were measured by UV-vis spectrophotometer (UV3600PLUS, Japan). The electron spin resonance (ESR) measurements were performed on a Bruker EMXnano spectrometer (EMX10/12, Bruker, Germany). The intermediate products of CR degradation were identified by high-performance liquid chromatography equipped with mass spectrometry (Thermo Scientific™ Q Exactive™, Waltham, MA, USA).

2.4. Catalytic Activation Experiments

We dispersed 0.8 g/L of catalysts in a 50 mL solution containing 100 mg/L of CR. The solution was kept in the dark for 60 min for adsorption saturation to be achieved, and the catalyst was dispersed in the water in the form of nanoplatelets. A 500 W xenon lamp was selected. Degradation was initiated during the UV-vis process by adding PMS solution (0.5 mM) to the suspension. The solution was stirred by a magnetic stirrer at room temperature for the reaction. To analyze catalytic activity, 1 mL of the suspension was sampled within a given time interval. The number of sampling times and time intervals depended on the degradation rate. Each sample was quenched with 1 mL methanol and filtered through a 0.22 µm membrane filter for further analysis. To test the reusability of the material, after measurements, the catalysts were recycled by centrifugation, washed with deionized water and ethanol, and then dried in an oven at 60 °C to further investigate their reusability.

3. Results and Discussion

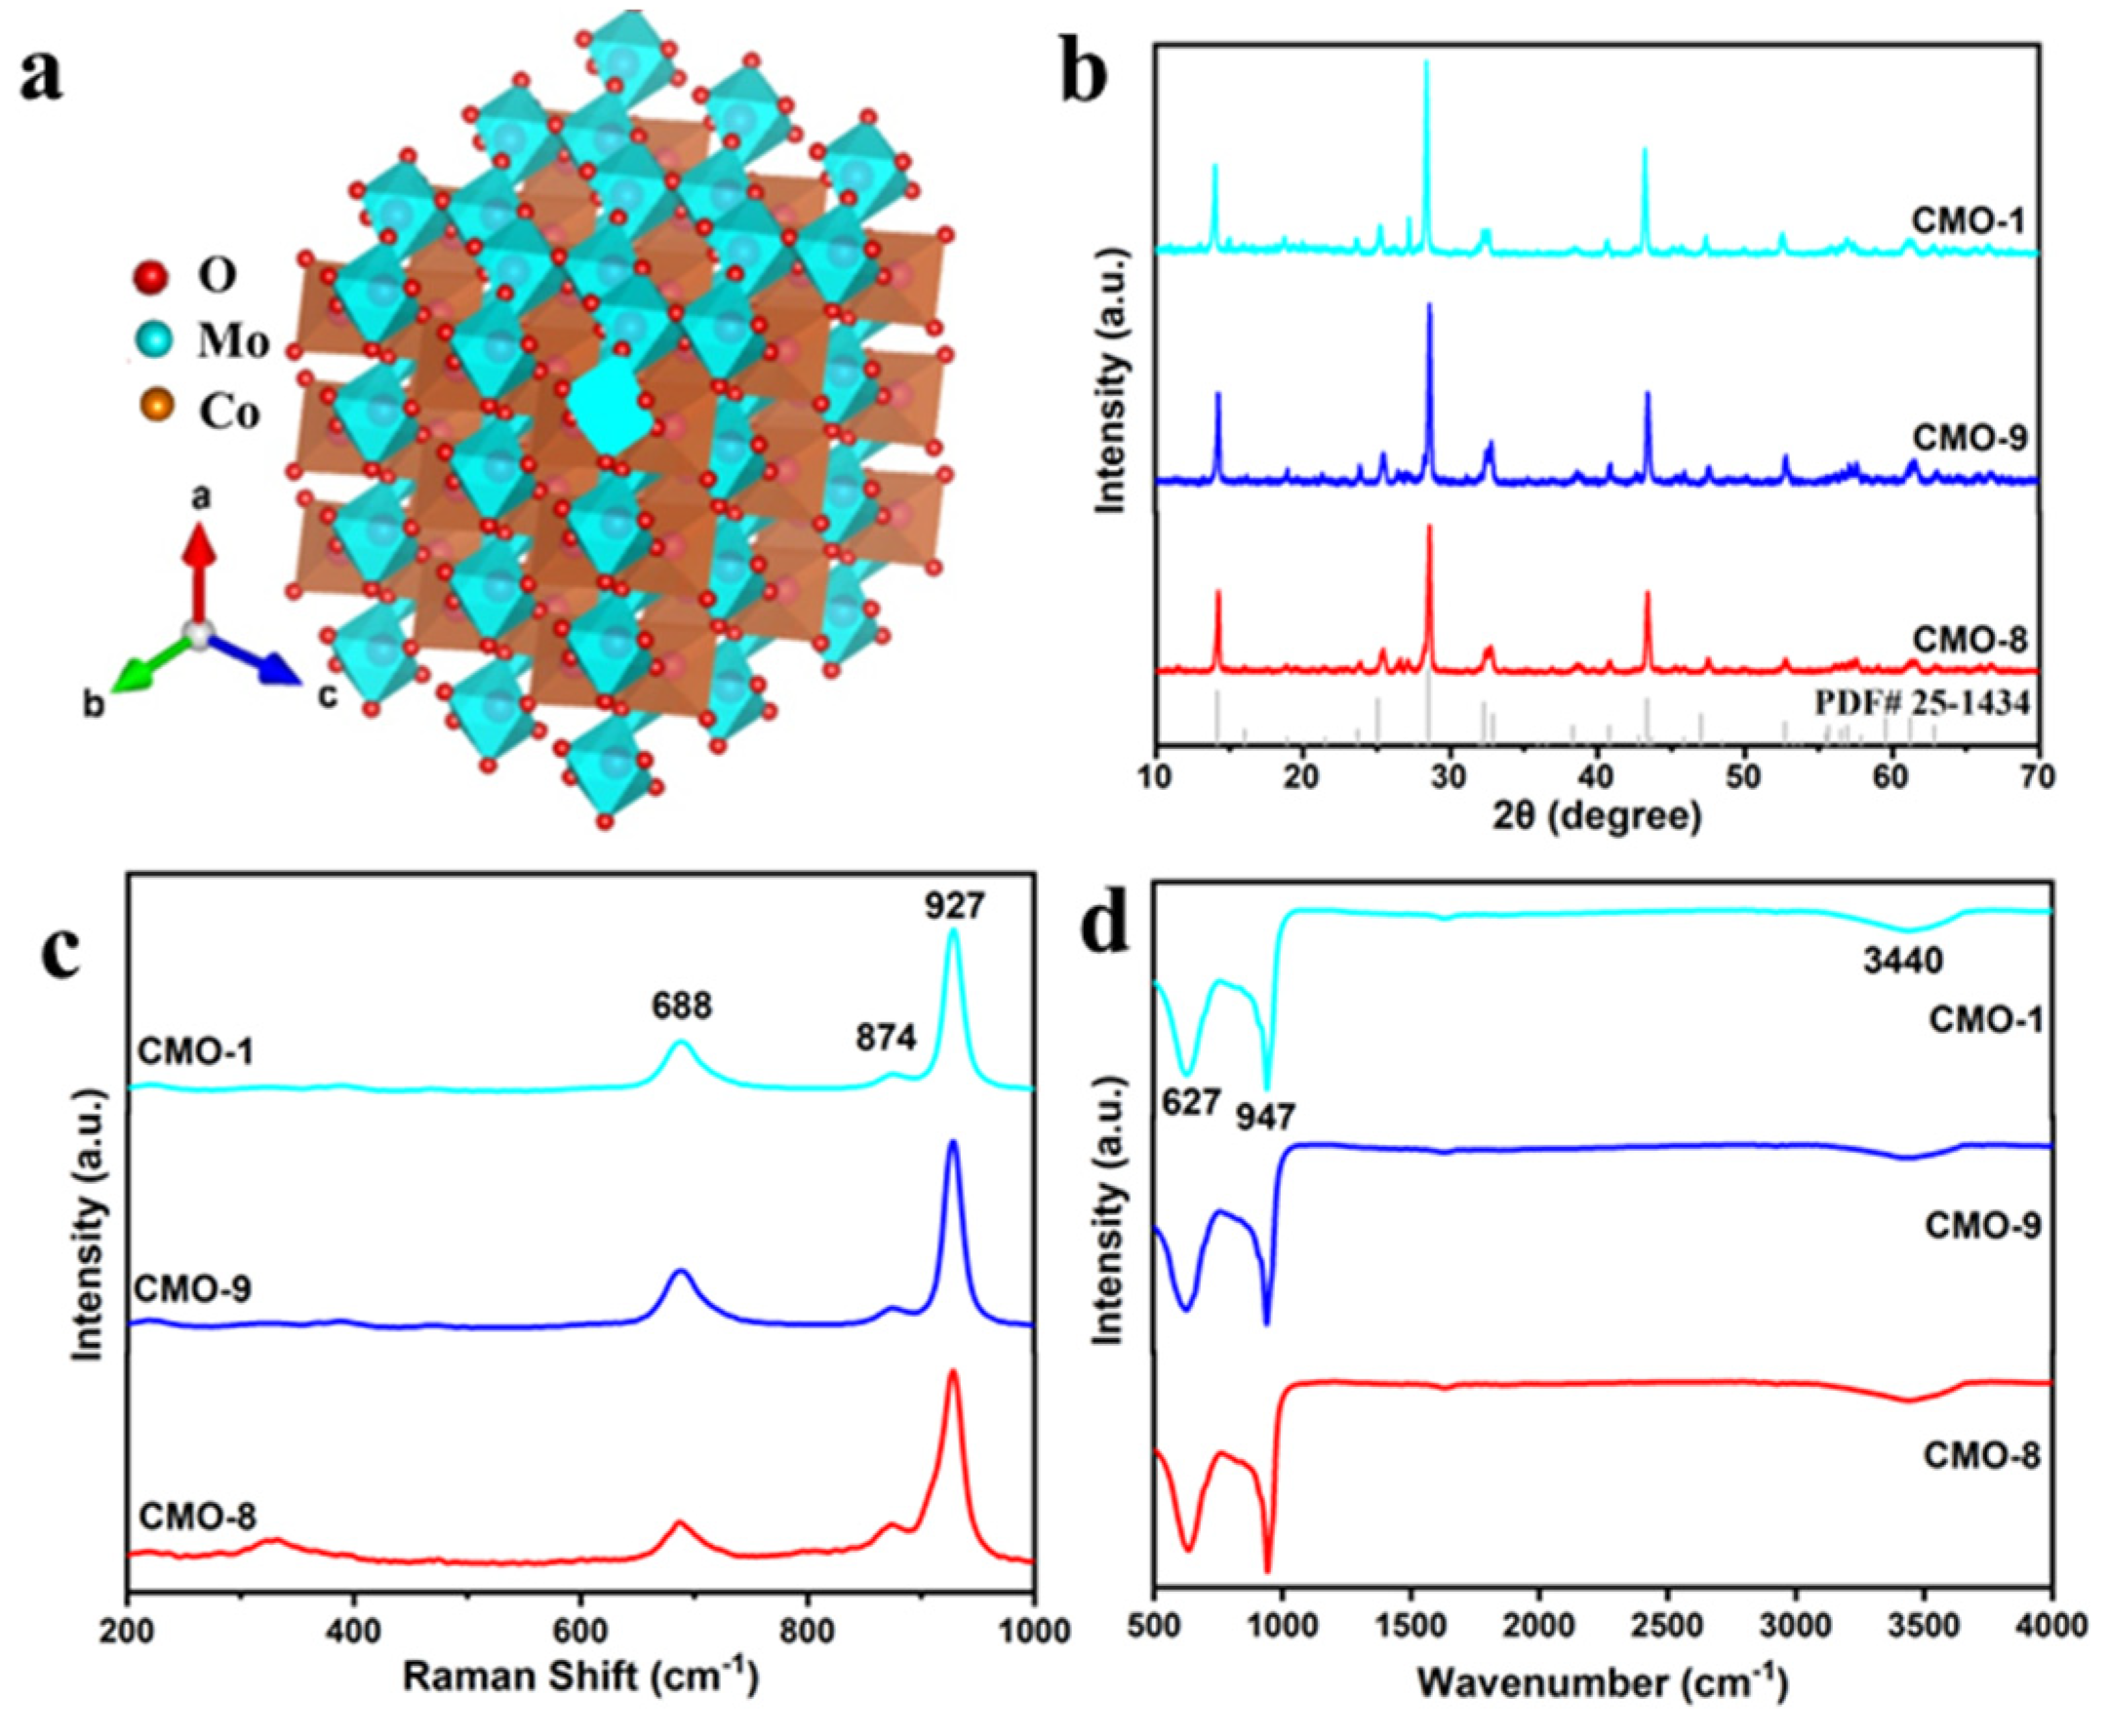
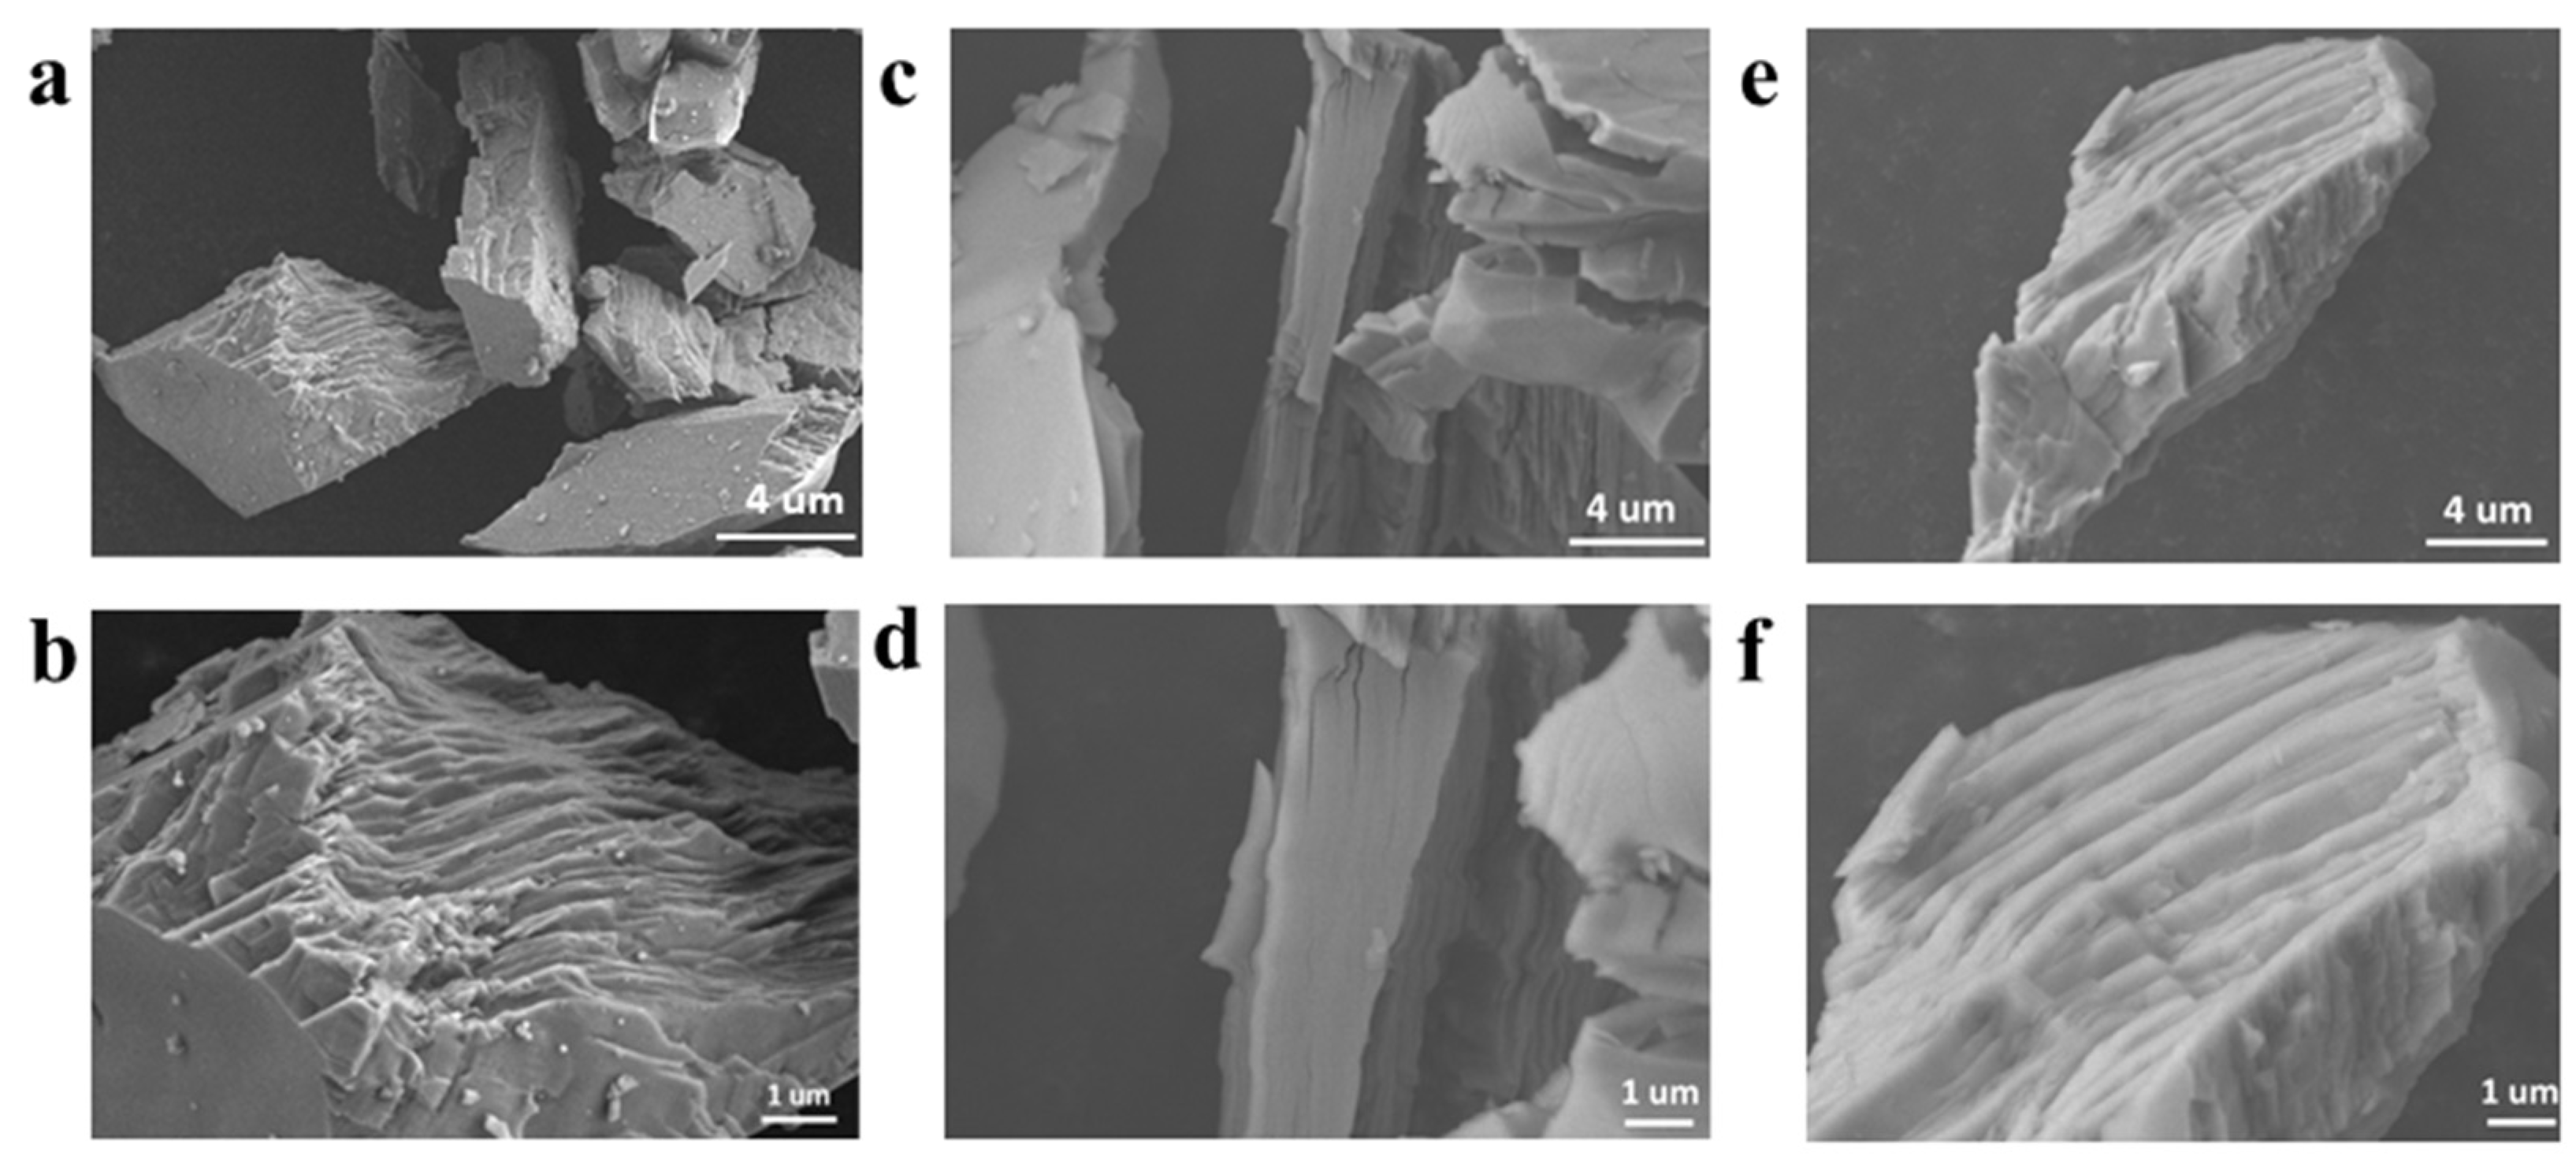
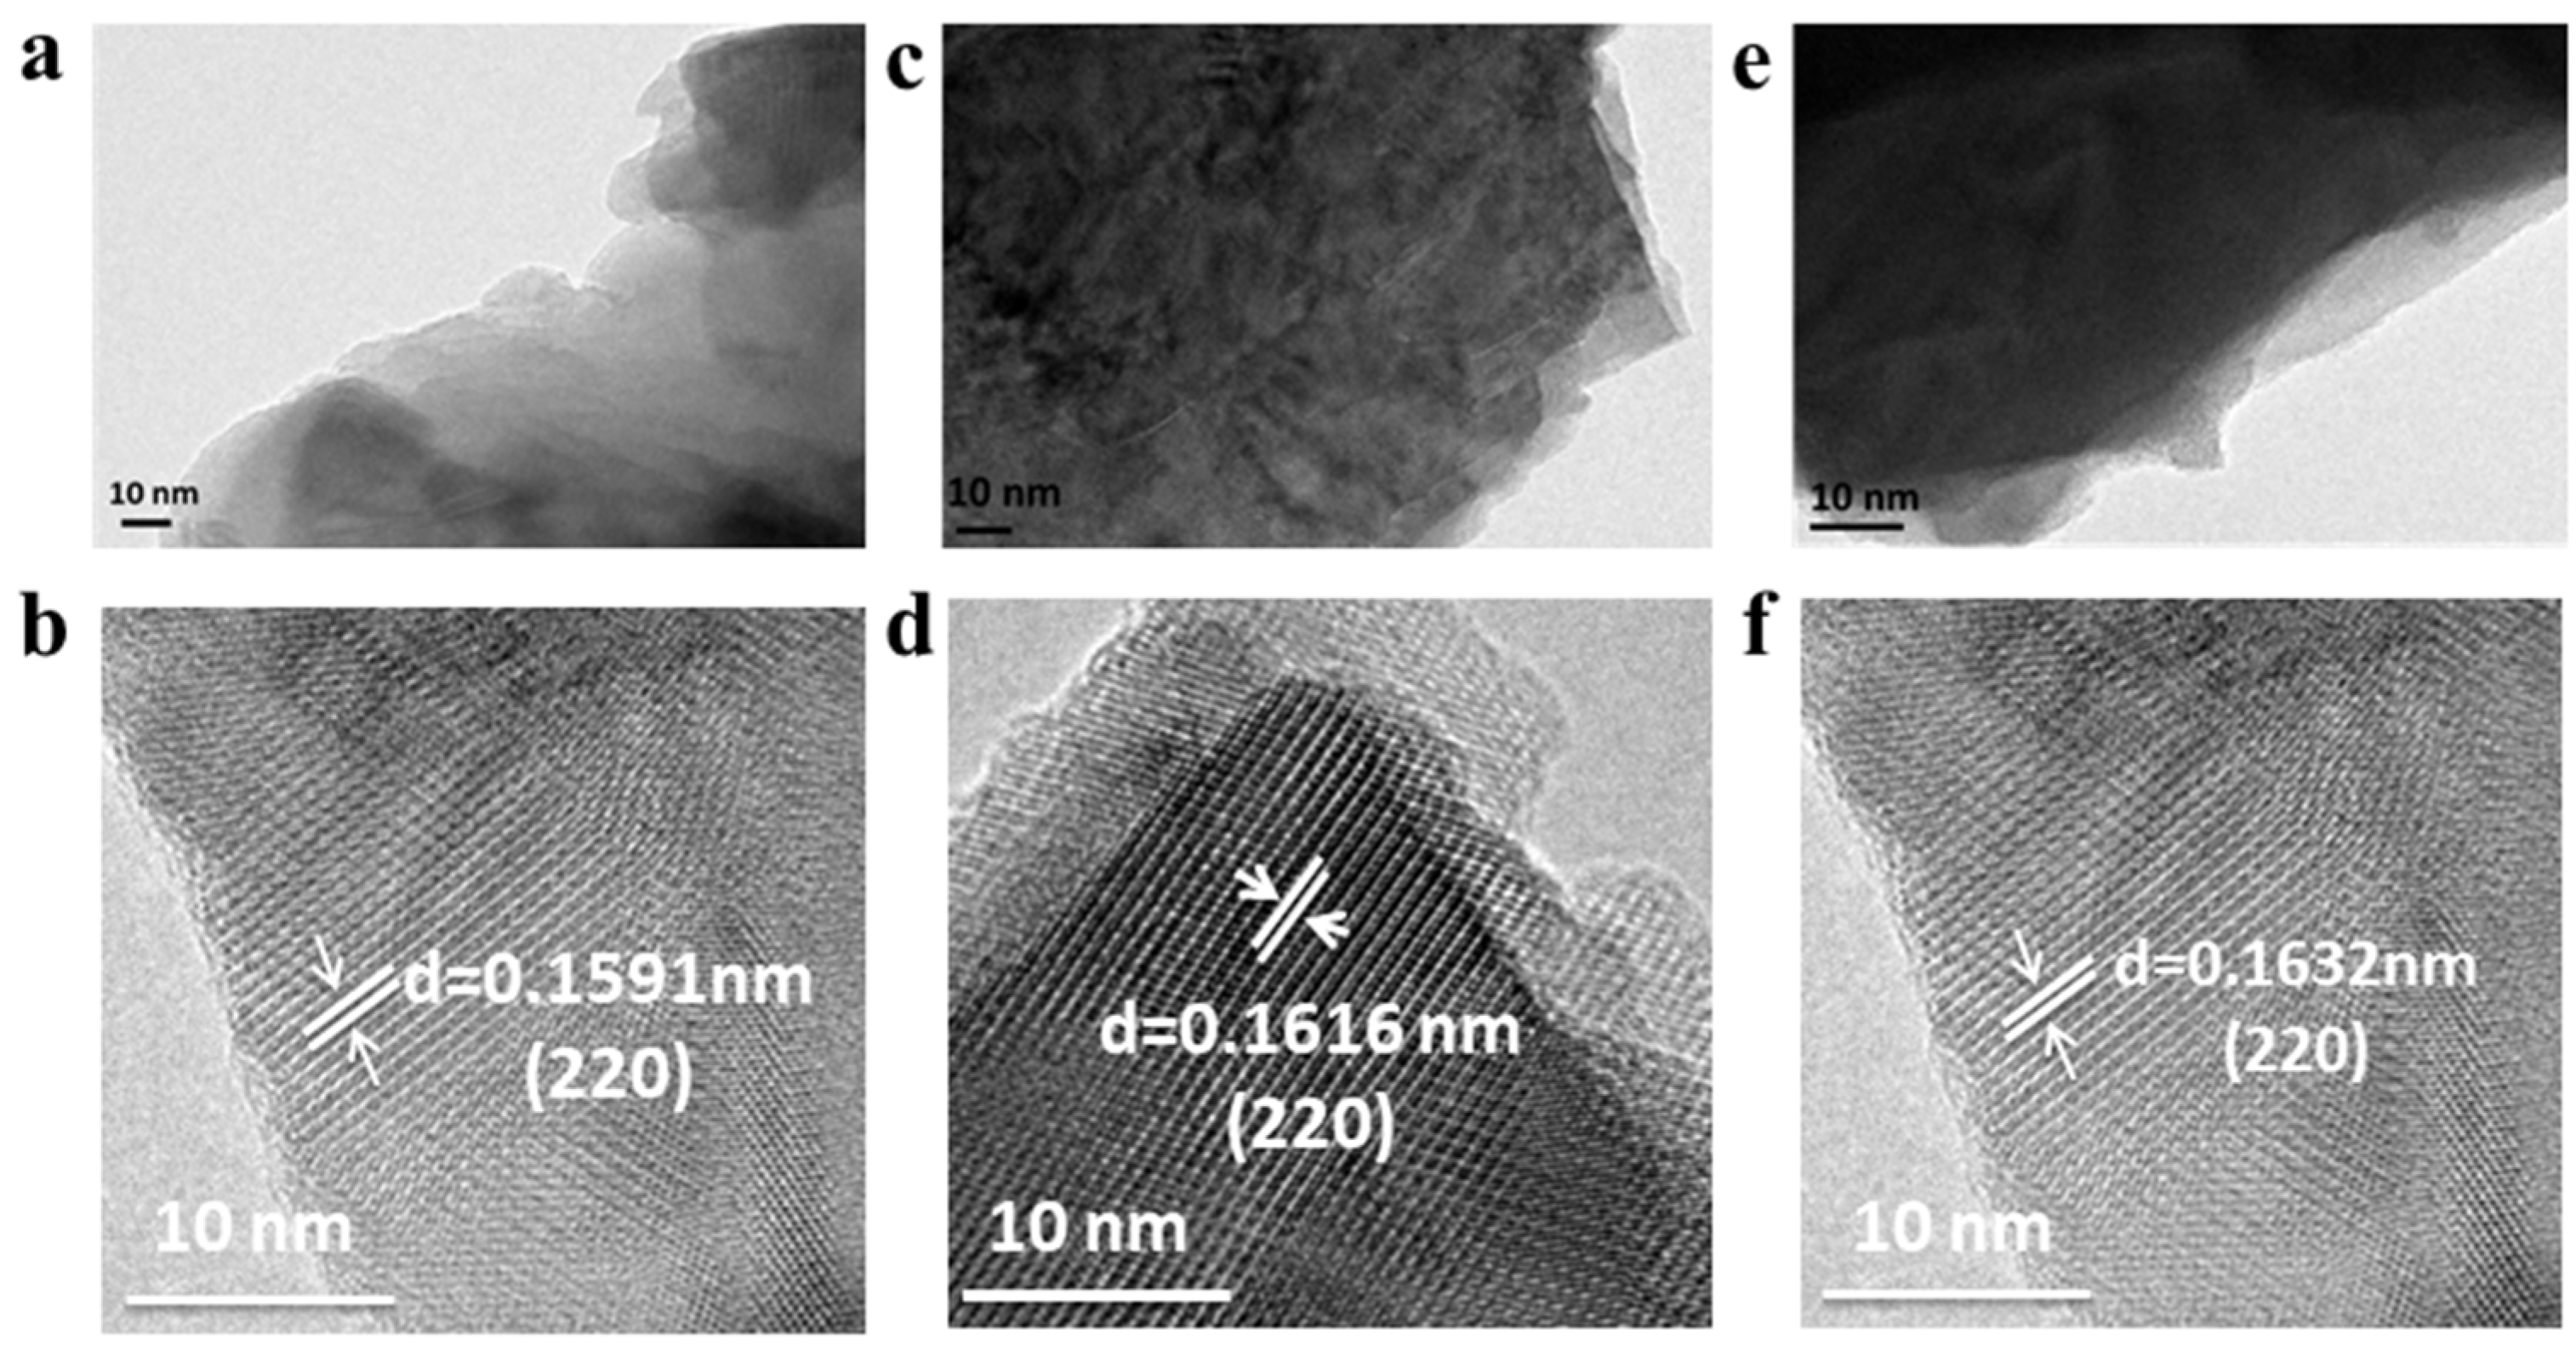
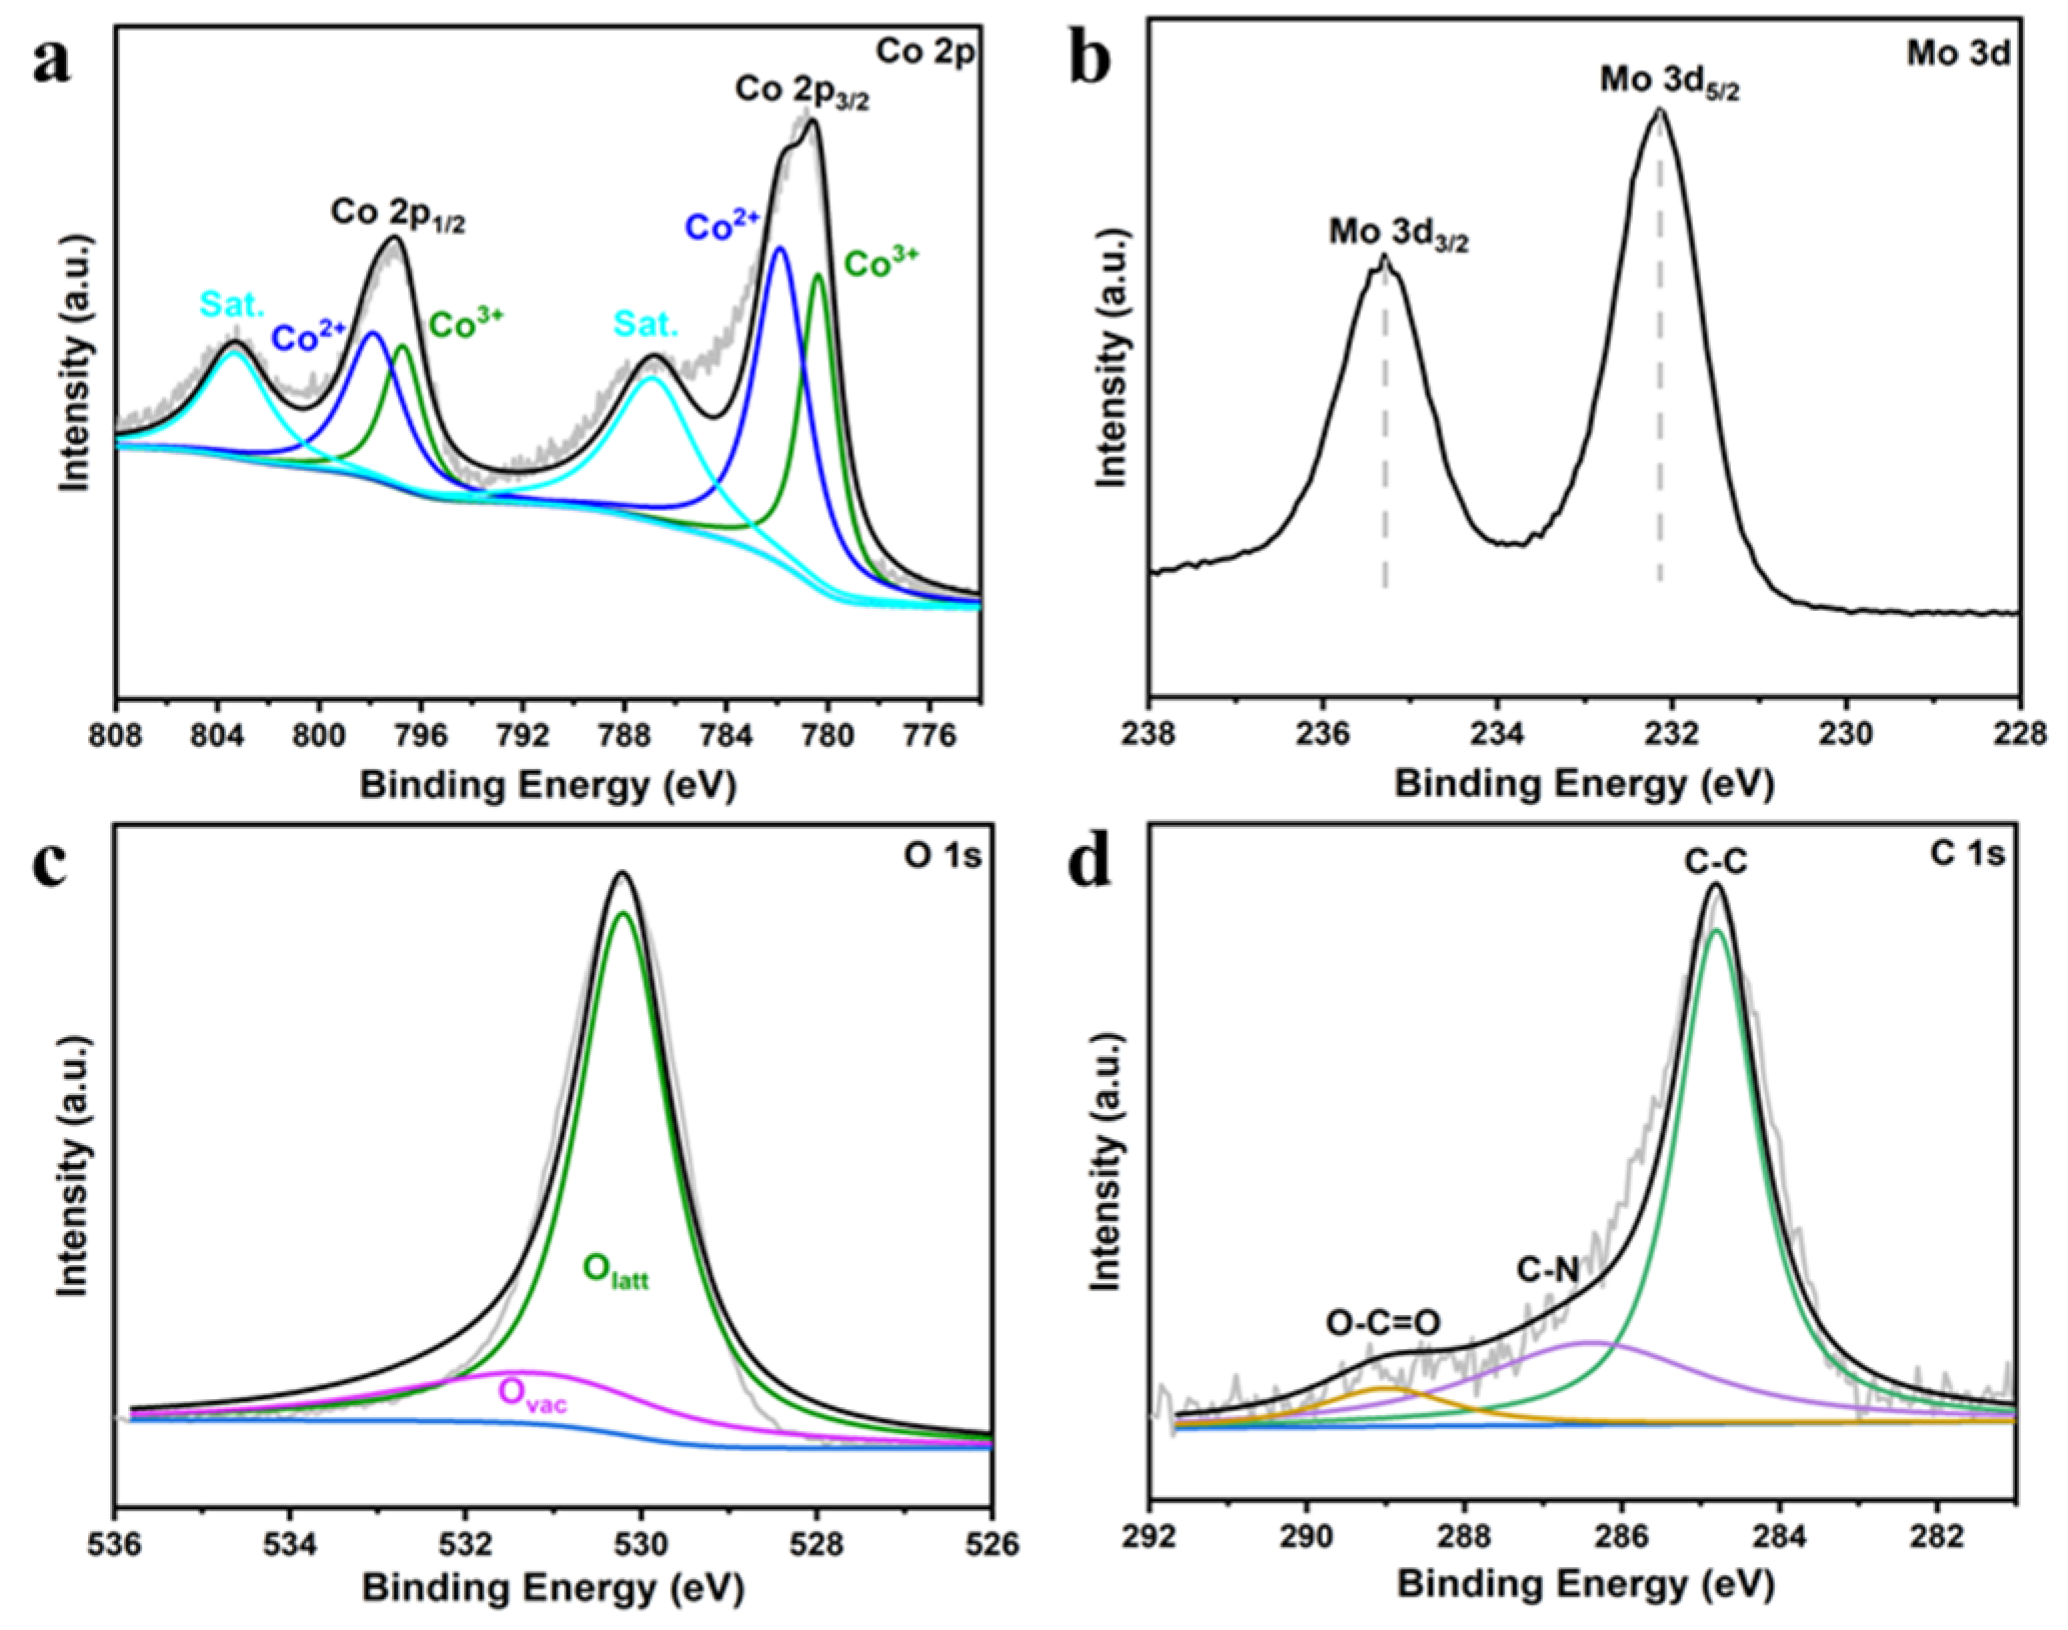
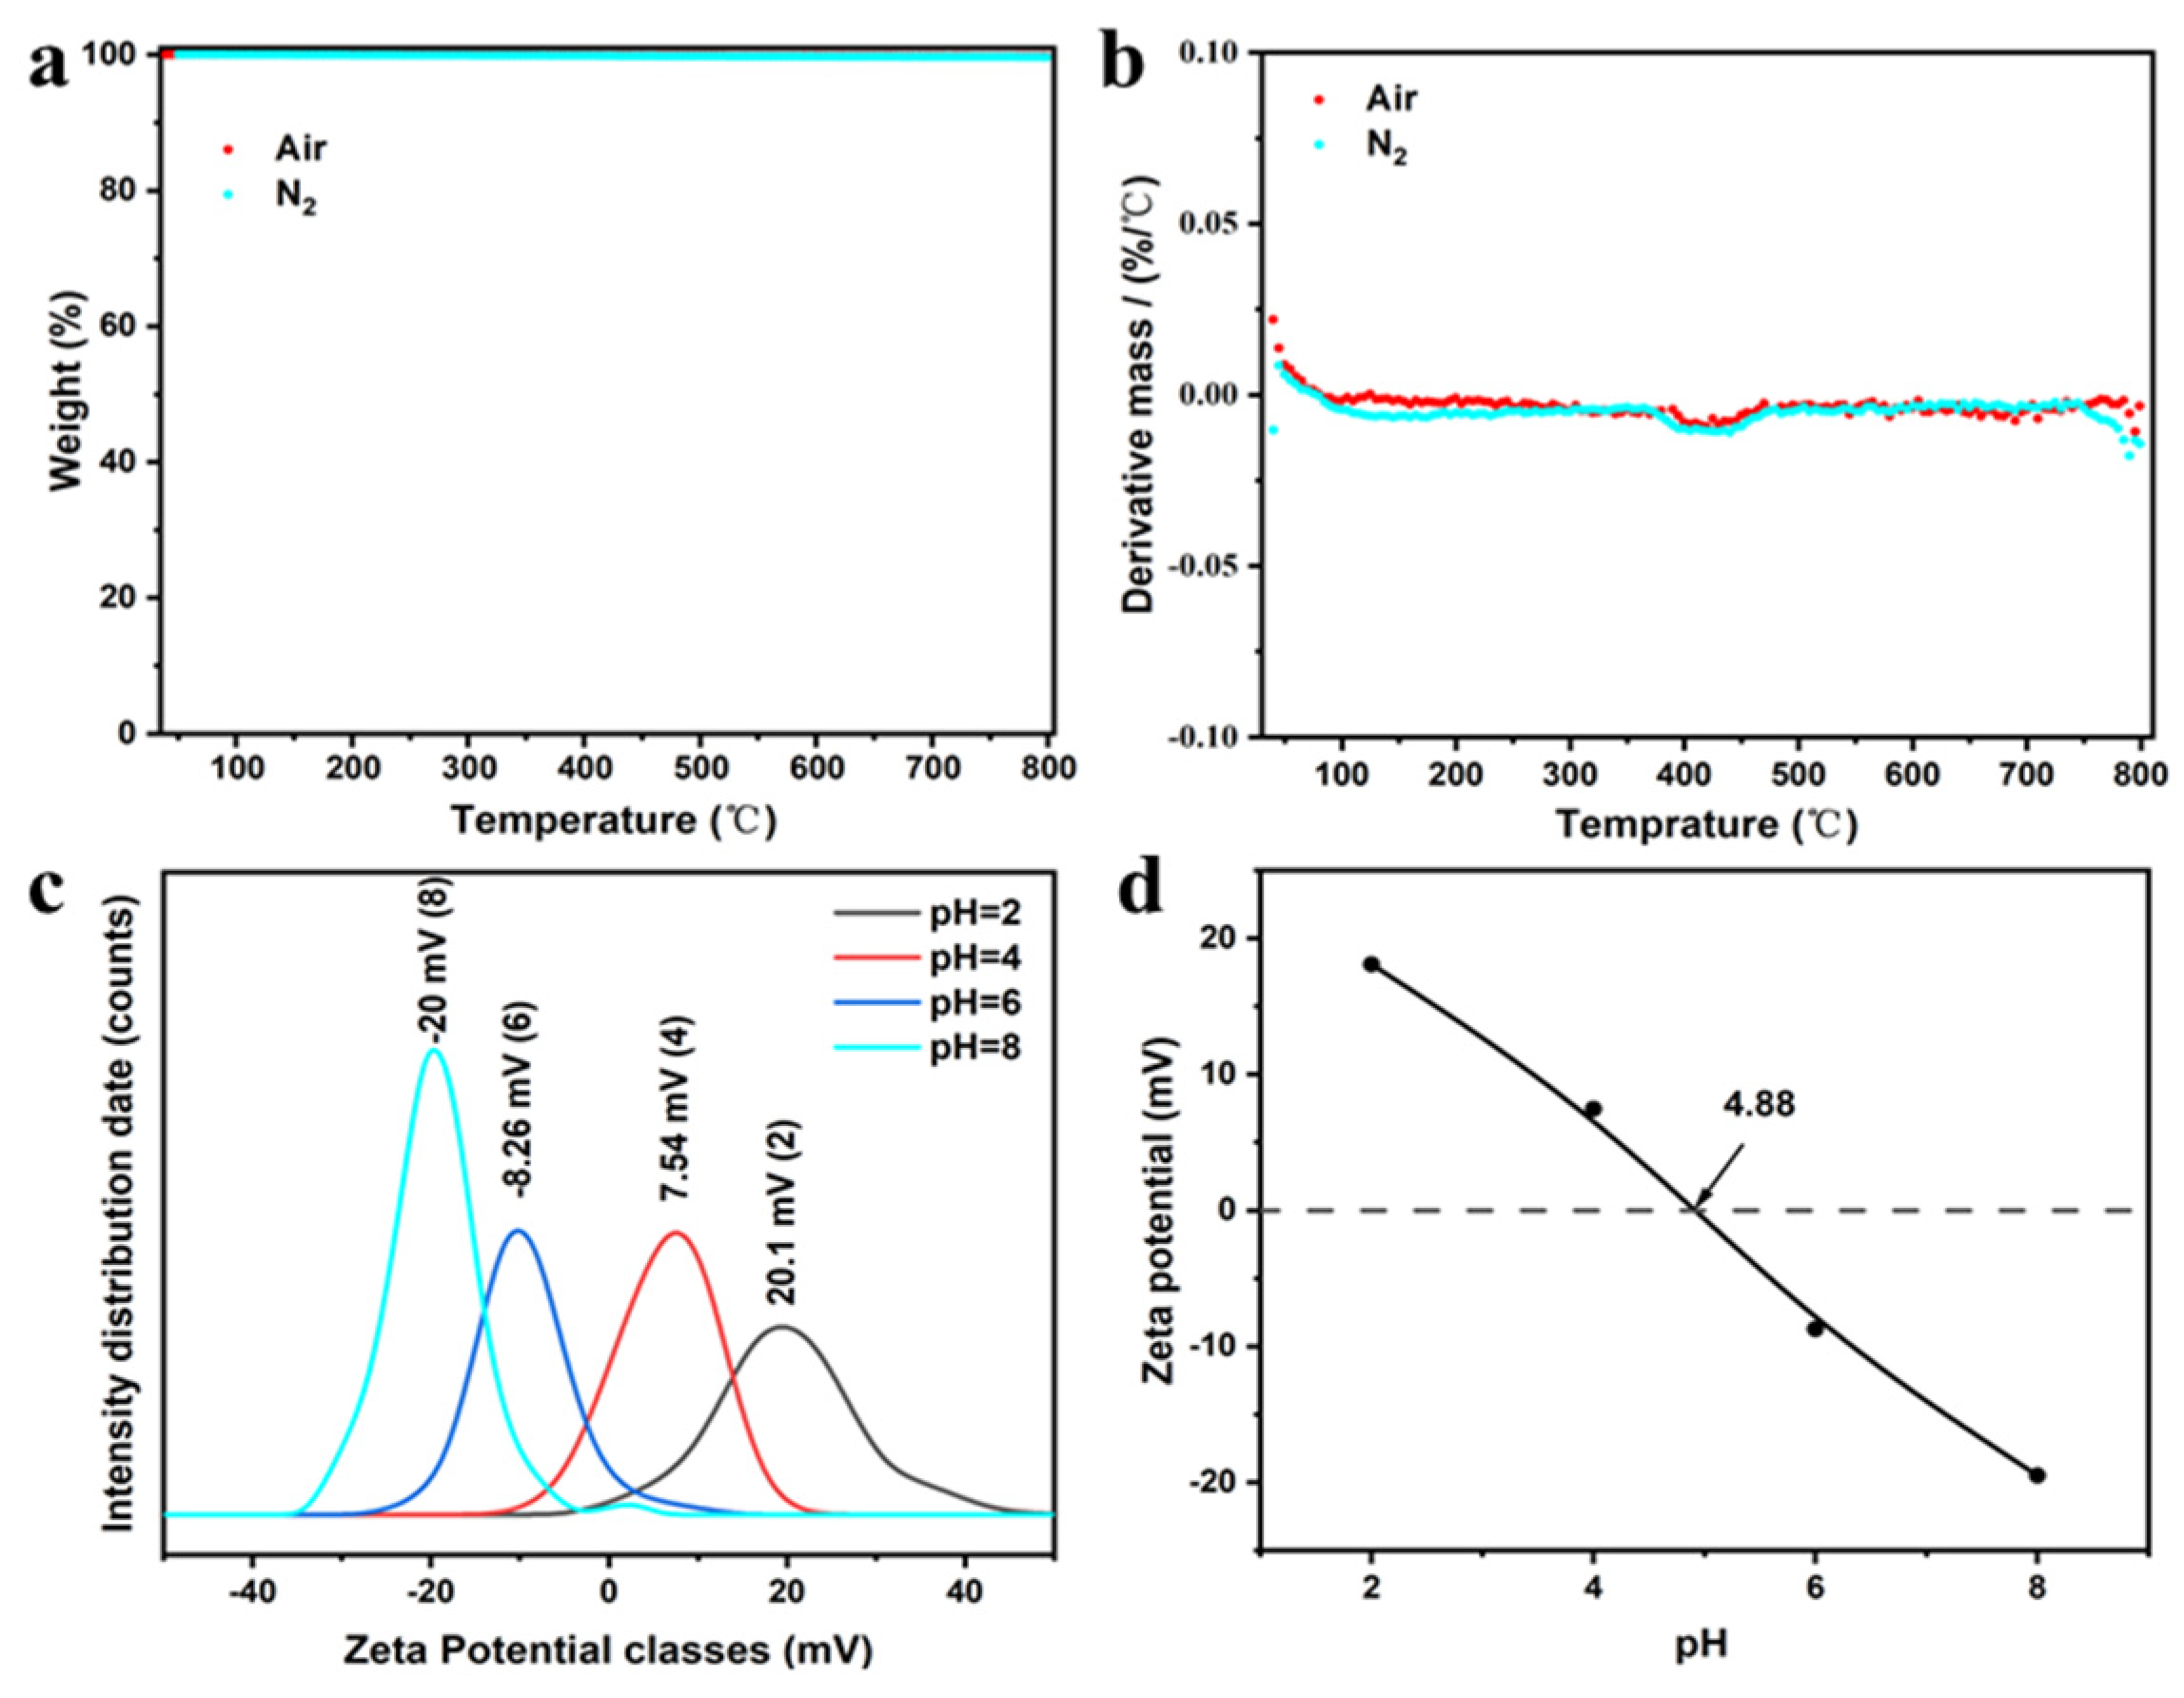
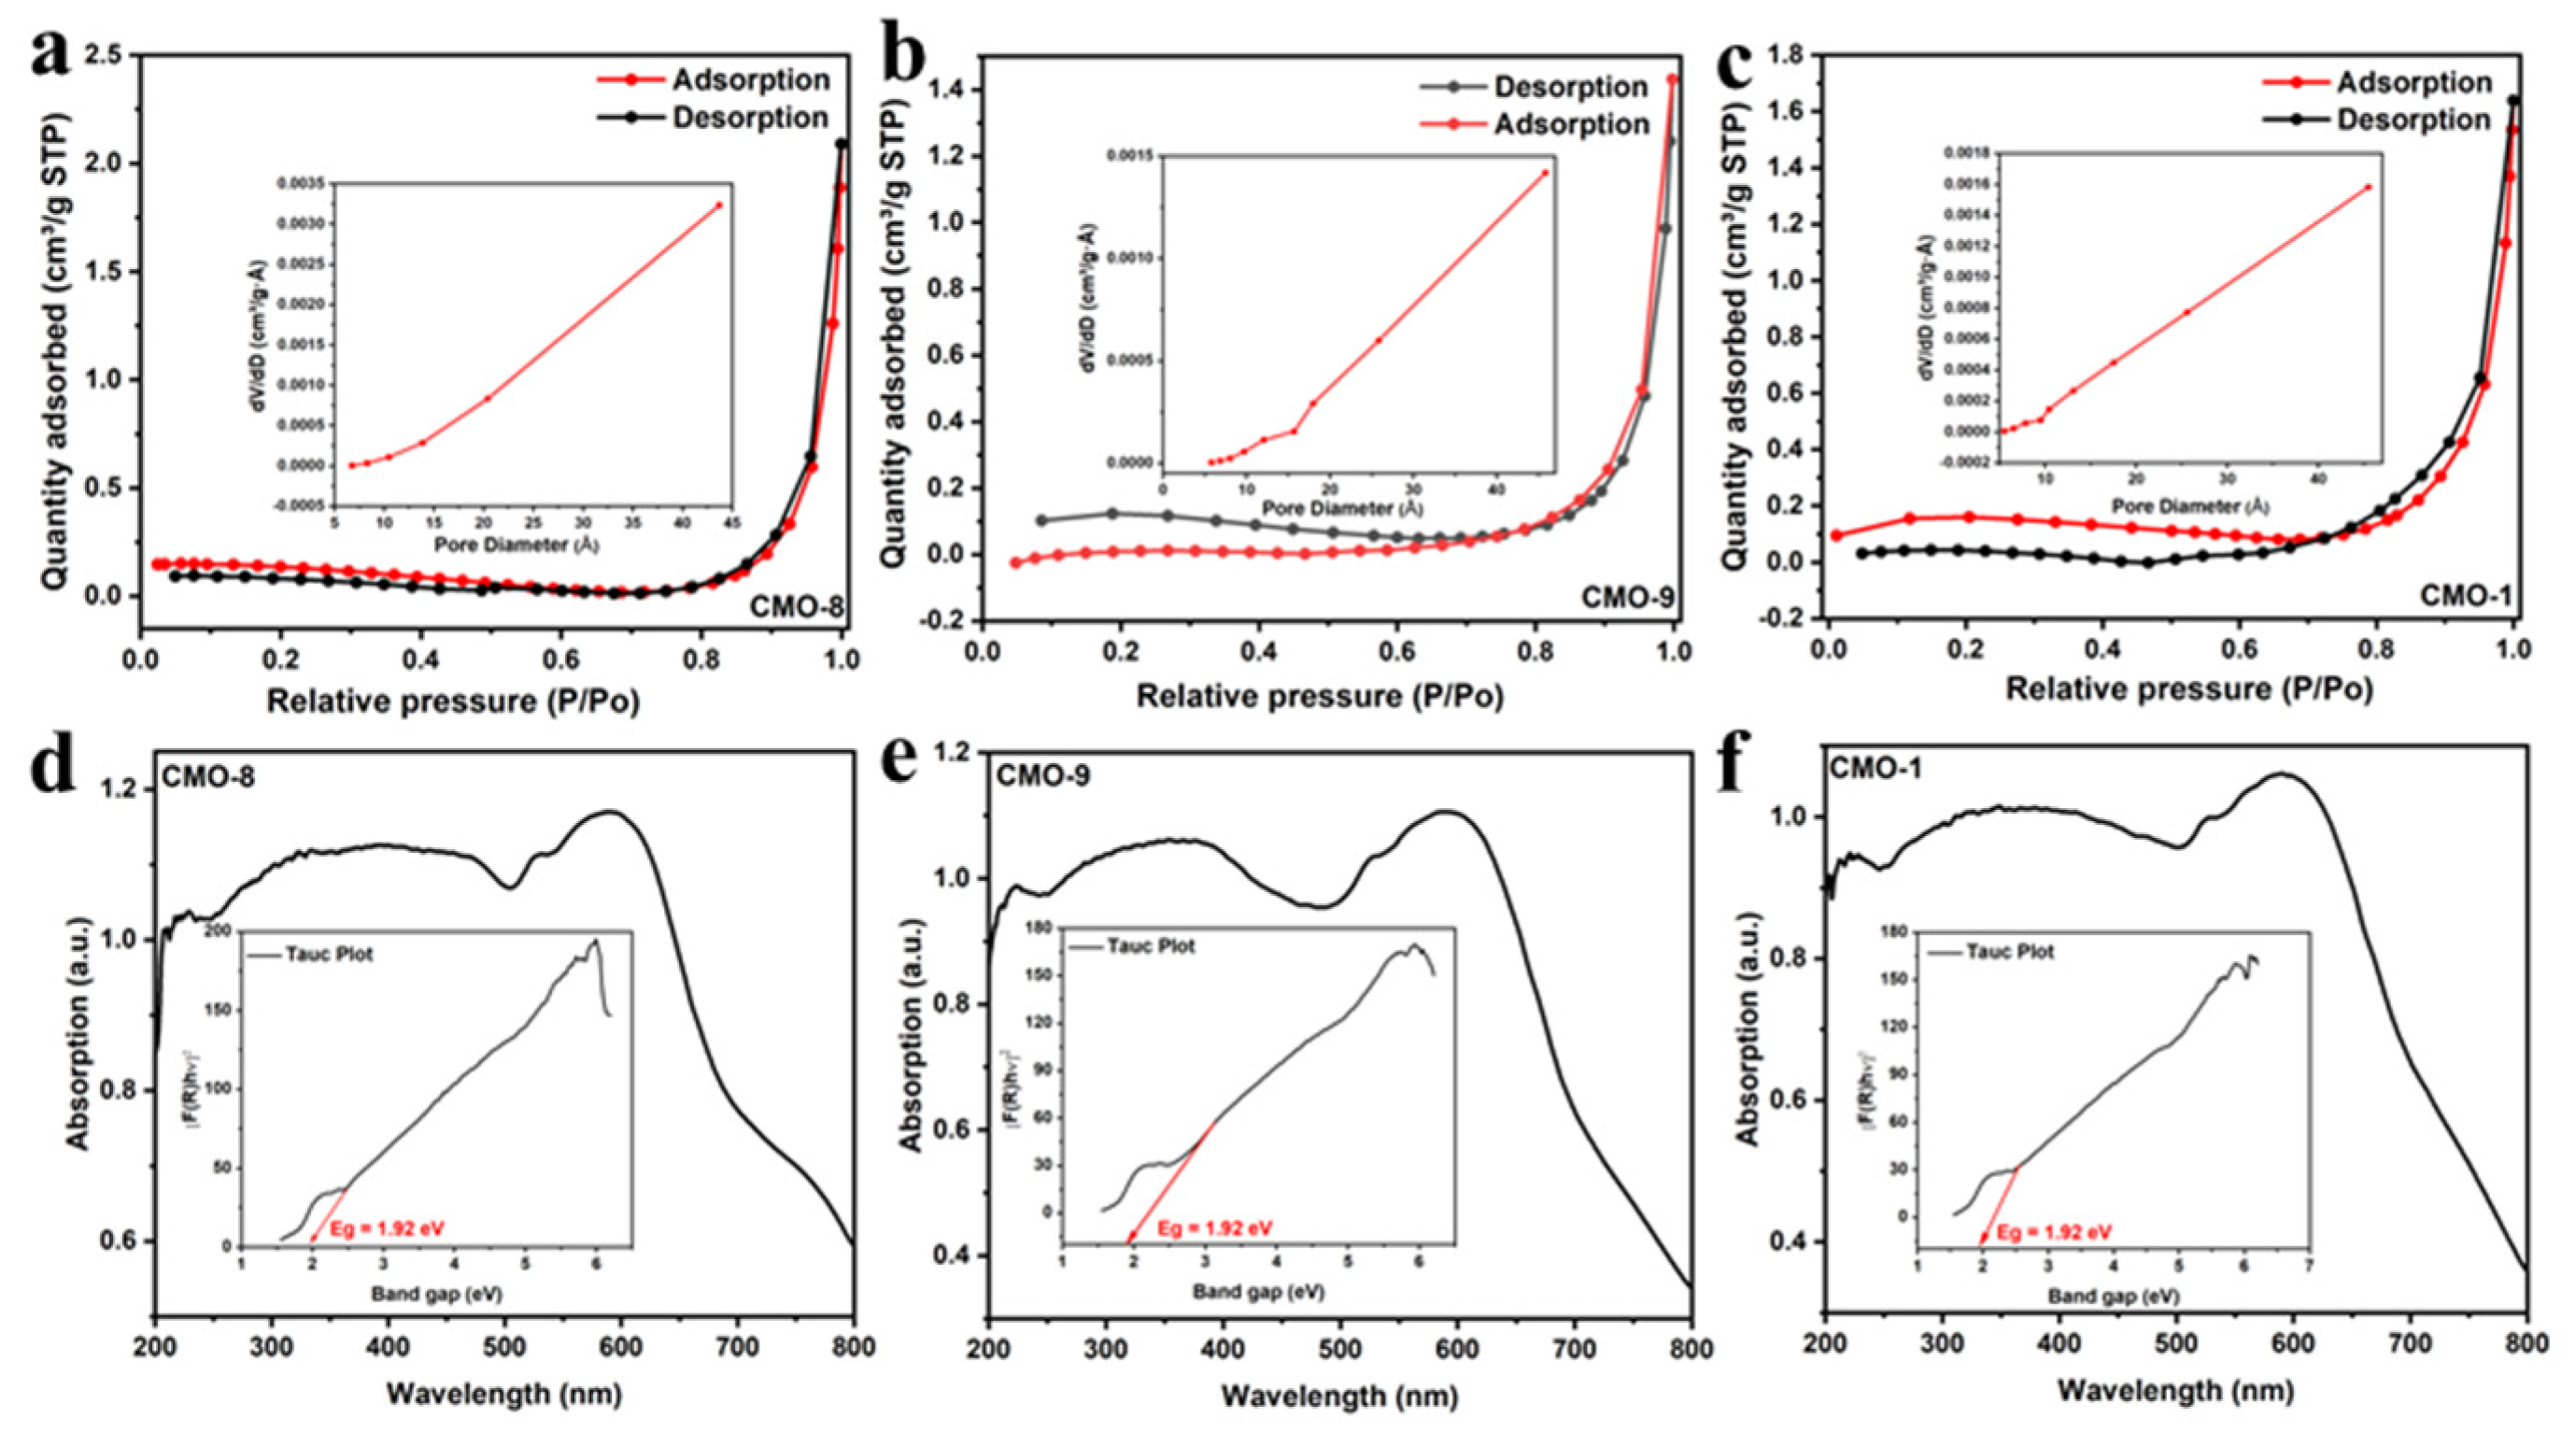
3.1. Characterization of CoMoO4

We selected CoMoO4 with ABO4 wolframite as the photocatalyst; Co ions occupy the A six-coordinated, whereas Mo ions occupy the B six-coordinated as show in Figure 2a. The crystal phase of the resultant samples was identified by X-ray diffraction (XRD). As shown in Figure 2b, the diffraction peaks of all samples are consistent with the monoclinic phase of CoMoO4 (JCPDS 25-1434) [36]. With the increase of temperature, the growth of crystal will be changed to some extent. Thus, the XRD spectra of CMO-1 show an intense peak around 27° compared with CMO-8 and CMO-9 [36]. In this form, both Co2+ and Mo6+ ions occupy distorted octahedral sites [37]. The calculated lattice parameters, a = 9.628 Å, b = 8.865 Å, c = 7.694 Å, b = 112.62, and cell volume = 606.19 Å3, for the heated α-CoMoO4 sample match well with JCPDS 025-1434, confirming the formation of a pure monoclinic α-CoMoO4, C2/m space group [38]. In α-CoMoO4, the main characteristic peaks are obtained at 2θ of 14.159° (110), 25.063° (002), 32.267° (−222), 28.512° (220), 32.267° (−222), and 43.340° (−330), and these can be indexed with JCPDS 025-1434. There are two types (α phase and β phase) of molybdate, such as CoMoO4, FeMoO4, and NiMoO4 [36,37].
Raman scattering was observed at 688, 874, and 927 cm−1 for CoMoO4, as shown in Figure 2c. A strong band at 927 cm−1 and two weak bands centered around 874 cm−1 were the characteristic bands of CoMoO4 representing the Mo–O–Co vibrational stretching frequencies [39]. The FTIR spectra of CoMoO4 are shown in Figure 2d. For pure CoMoO4, the bands in the range of 750–950 cm−1 are attributed to the stretching vibration of Mo–O bonds of distorted MoO4 in CoMoO4 [40,41]. The bands in the lower frequency range (400–700 cm−1) belong to Co–Mo–O stretching vibrations. The spectra at 613 and 950 cm−1 correspond to the Co−O and Mo−O−Mo vibration modes. It is believed that the absorption peak at 3441 cm−1 can be attributed to the O–H stretching vibration and its corresponding O–H bending vibration occurs at 1636 cm−1, due to chemically adsorbed water molecules; the vibration band at around 947 cm−1 is attributed to the activation of υ1 vibration of the distorted MoO4 tetrahedron present in CoMoO4 [42].
The SEM images of CMO-8, CMO-9, and CMO-1 are shown in Figure 3a–f, respectively. The nanolumps consist of stacked nanosheets, which expose a large number of active sites and provide sufficient space for CR to attach. The rising temperatures cause nanosheets to agglomerate in a way that makes them more compact with each other; accordingly, at 1000 °C, the nanosheets stack more tightly [43]. Thus, the degradation of CR for CMO-1 was poor compared with CMO-8 and CMO-9.
The images of SEM can also be indicated by TEM. Figure 4a–f represent the HRTEM images of CMO-8, CMO-9, and CMO-1, respectively. The TEM images of CMO-8, CMO-9, and CMO-1 provide a clear view of the morphological shape of the nanolumps that consist of nanosheets as the temperature increase. The spacings of the lattice fringes of CMO-8, CMO-9, and CMO-1 are measured to be 0.1591, 0.1616, and 0.1632 nm, respectively, which can be ascribed to the (220) plane of α-CoMoO4, and both match well with the monoclinic phase of CoMoO4 (JCPDS 25-1434). The calcination temperature did not change the crystal structure, and the lattice spacing measured by the digital micrograph was consistent with the XRD crystal structure.
The surface composition and chemical states of the CoMoO4 were further characterized by XPS. The full-survey-scan spectra further demonstrate the presence of Co, Mo, O, and C (Figure 5 and Figure S1). Figure 5a shows the curves of Co 2p, which shows two obvious peaks of 2p3/2 and 2p1/2, and two satellites (marked as “Sat.”). Two low binding energy peaks at 780.35 and 796.7 eV are assigned to Co3+, while the other peaks at 781.82 and 797.0 eV are well-matched with Co2+ [44,45]. Figure 5b displays Mo 3d XPS doublets, which correspond to Mo 3d5/2 and Mo 3d3/2. The Mo 3d doublet binding energies of CoMoO4 shift towards a lower level. The peaks at 232.2 and 235.25 eV come from the Mo6+ [45]. As shown in Figure 5c, the peak at 530.18 eV was ascribed to the lattice oxygen (Olatt) bonds of metal oxides; the peak at 531.28 eV might be owing to the defect site of low hypoxia coordination, indicating that Ovac were created on the surface of CoMoO4 [46]. The ratios of Olatt and Ovac were 77.773% and 22.227%. Figure 5d shows the C1s: the peak at 284.8 eV was ascribed to the C-C, the peak at 286.4 eV was ascribed to the C-N, and the peak at 289 eV was ascribed to the O-C=O [47]. Figure S1 shows the survey spectra. This further confirms the formation of CoMoO4.
CMO-8 samples were heated from 40 °C to 800 °C under an air/N2 flow of 20 mL/min, and the heating rates were 10 °C/min. In order to eliminate systematic error, blank tests were performed before the experiment to provide the baseline, and repetitions were also performed to ensure good reproducibility of the results. Figure 6a,b shows the TGA and DTG curves of CMO-8 at 10 °C/min, with the 0.23682% and the 0.36296% of weightlessness in air and N2 atmosphere, respectively. The CMO-8 sample exhibits excellent thermal stability in both air and N2 atmospheres due to its negligible mass decrease.
Figure 6c shows the variation in the zeta potential of the CMO-8 sample at different pH. The Zeta potential classes are −20 mV, −8.26 mV, 7.54 mV, and 20.1 mV at pH = 8, pH = 6, pH = 4, and pH = 2, respectively. Figure 6d shows the pH of the isoelectric point (pHIEP) of CMO-8 at pH = 4.88. When pH < 4.88, the adsorbent is positively charged; when pH > 4.88, the adsorbent is negatively charged.
Figure 7a–c showed the BET of CMO-8, CMO-9, and CMO-1, respectively. The specific surface area of CMO-8, CMO-9, and CMO-1 were 0.5451, 0.5186, and 0.4531 m2/g, respectively. Among them, the CMO-8 exhibited the highest surface area and pore volume, which may be beneficial to the diffusion and adsorption of CR molecules and expose more active sites to activate PDS to generate SO4· and ·OH.
To determine the band gap energy of semiconductor materials, two prominent methods are used: (i) Tauc method: α = A (hv-Eg) 2/λ for direct (allowed) and α = A (hv-Eg) 1/2/λ for indirect (allowed) (α = absorption coefficient; A = absorption constant for indirect transitions depending on the transition probability) [48,49,50,51,52]. Figure 7d–f shows the UV-visible diffuse reflectance spectra (DRS) of CoMoO4. The optical band gap energy (Eg) of CMO-8, CMO-9, and CMO-1 were both found to be 1.92 eV, which is in accordance with the value already published [53].

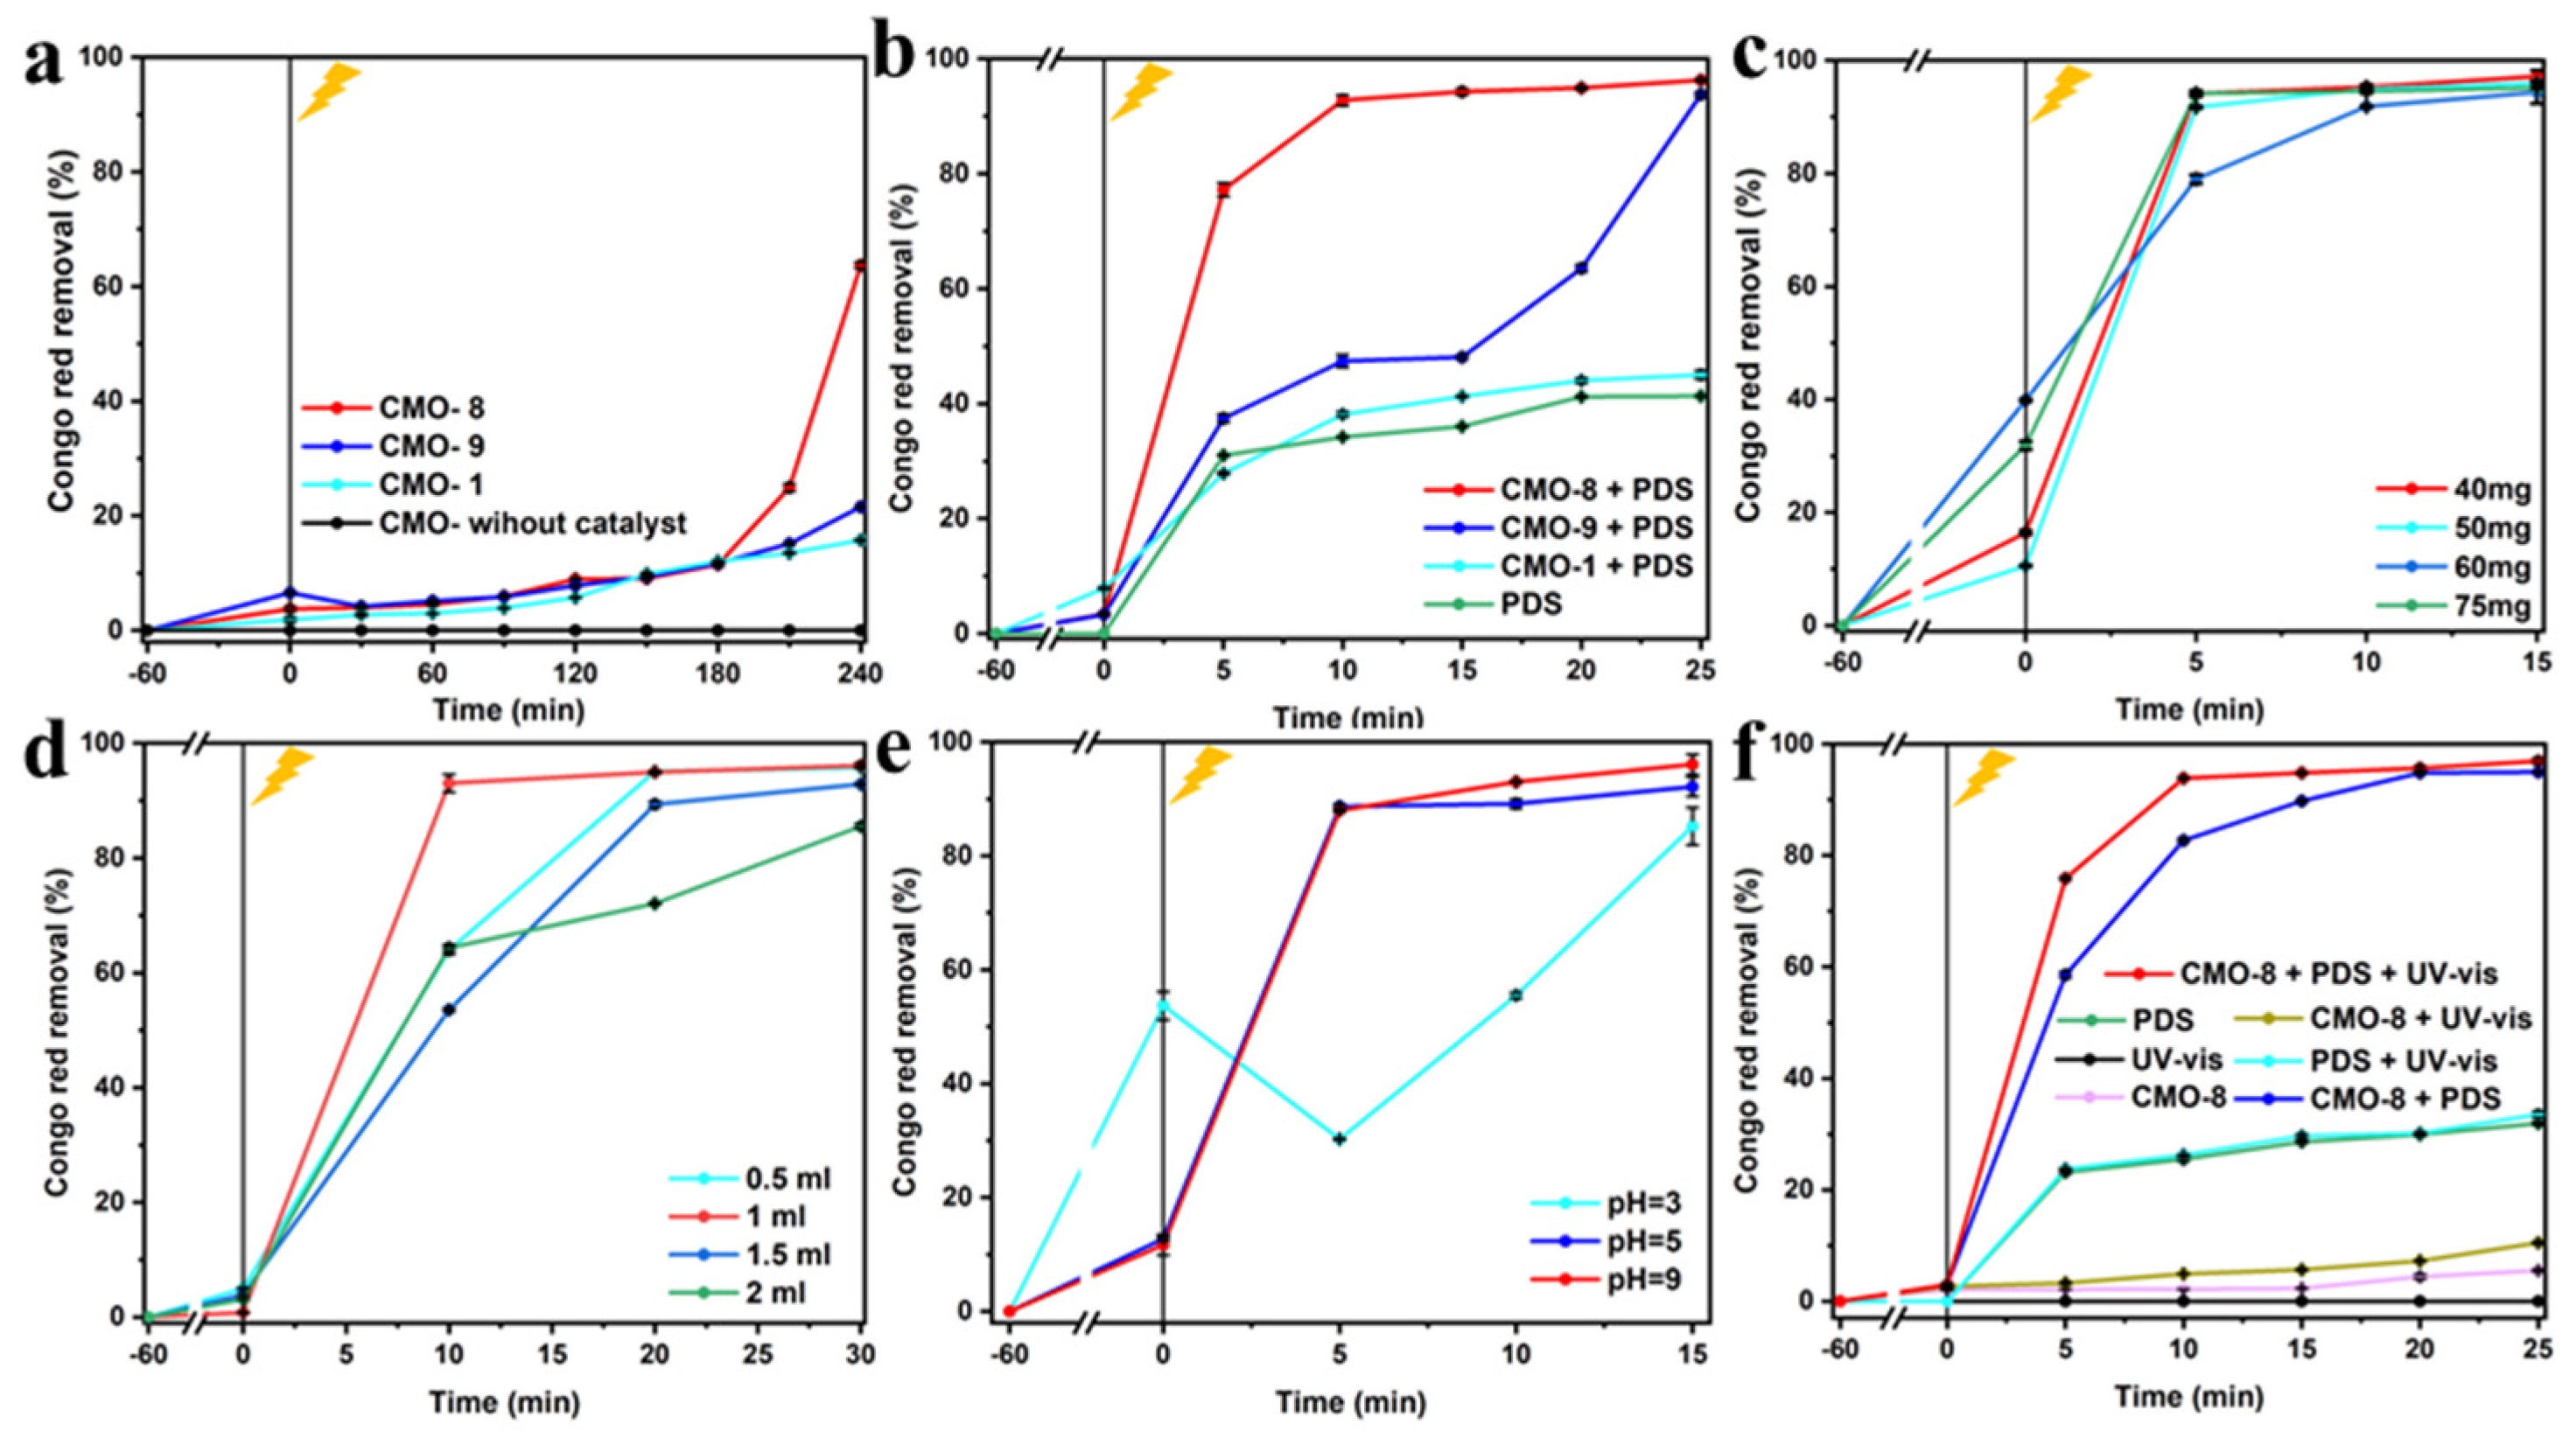
3.2. Degradation of CR in Different Condition

The initial concentration of CR was 100 mg/L in all experiments. All experiments were carried out under UV-vis after 1h adsorption in dark conditions, and PDS (0.5 mmol/L) was added after adsorption. The number of sampling times and time intervals depended on the degradation rate.
Figure 8a,b shows that the dosage of CMO-8, CMO-9, and CMO-10 was 20 mg. Figure 8a shows that without PDS, the removal rates of CR were 63.68% (63.68% ± 0.555%), 21.561% (21.561% ± 0.12%), and 15.753% (15.753% ± 0.145%) under UV-vis after 240 min, respectively. Figure 8b shows that the removal rates of CR were 96.29% (96.29% ± 0.158%), 93.782% (93.782% ± 0.446%), and 45.024% (21.561% ± 0.12%) after the addition of 1 mL PDS under UV-vis for 25 min, respectively. This indicated that there is an excellent synergy between the CoMoO4 catalyst and PDS, and this is more noticeable with CMO-8. The removal of CR with CMO-9 and CMO-1 were poor compared with CMO-8, which were closely consistent with their morphologies. Thus, we chose CMO-8 as the optimal photocatalyst for subsequent experiments.
Figure 8c shows the degradation of CR by CMO-8 at different concentrations ranging from 0.8–1.5 g/L. At dosages of 40 mg (0.8 g/L), 50 mg (1 g/L), 60 mg (1.2 g/L), and 75 mg (1.5 g/L) with 1 mL PDS, the removal rates of CR were 97.169% (97.169% ± 1.051%), 95.982% (95.982% ± 0.185%), 94.38% (94.38% ± 2%), and 95.147% (95.14% ± 0.129%) after 15 min, respectively. Therefore, we chose the optimal dosage of 40 mg for subsequent experiments. Figure S2a shows the removal of CR by reused CMO-8 at different dosages of concentrations ranging from 40–75 mg (0.8–1.5 g/L). At dosages of 40 mg (0.8 g/L), 50 mg (1 g/L), 60 mg (1.2 g/L), and 75 mg (1.5 g/L) with 1 mL PDS, the removal rates of CR were 73.181%, 79.203%, 82.798%, and 81.05% after 40 min of UV-vis, respectively. Therefore, we chose the optimal dosage of 60 mg for subsequent experiments. This result indicated that the more PDS was required to active reused CMO-8.
Figure 8d shows the degradation of CR with a CMO-8 dosage of 40 mg; different dosages of PDS ranging from 0.5–2 mL were studied. As the dosage was increased from 0.5 mL, 1 mL, 1.5 mL, and 2 mL with 0.8 g/L catalyst, the removal rates of CR were 95.776% (95.776% ± 0.139%), 96.121% (96.121% ± 0.594%), 92.874% (92.874% ± 0.1%), and 85.526% (85.526% ± 0.402%) after 30 min of UV-vis, respectively. When the dosage of PDS was below 1 mL, the removal of CR was increased. In contrast, when the dosage of PDS was over 1 mL, the removal of CR was decreased. This is closely related to the degree of activation of the dosed catalyst. Therefore, we chose a dosage of 1 mL of PDS as the best option for subsequent studies. Figure S2b shows the removal of CR with a dosage of 60 mg at different concentrations of PDS ranging from 0.5–2 mL. At concentrations of 0.5 mL, 1 mL, 1.5 mL, and 2 mL with 60 mg (1.2 g/L) of reused catalyst, the removal rates of CR were 48.03%, 64.184%, 67.275%, and 68.367% after 30min of UV-vis, respectively. Therefore, we chose the dosage of 2 mL of PDS as the best option in subsequent studies of the reused catalyst. As the dosage of PDS increased, the removal rate of CR increased. Due to the secondary utilization of CMO-8, the synergistic effect was weakened. Thus, the CMO-8 activation required more dosage of PDS.
CR is an anionic dye in nature and at neutral pH, it appears as a red color in aqueous solutions. The color of CR changes with the solution pH. At low pH, it appears blue due to tautomerism. Thus, the adsorption of CR onto CMO-8/PDS was studied at pH 3–9. Figure 8e shows the degradation of CR by 40 mg CMO-8 and 1 mL PDS at different pH. When pH = 3, 5, and 9, the degradation efficiencies of CR were 85.203% (85.203% ± 3.281%), 92.16% (92.16% ± 1.677%), and 96.077% (96.077% ± 1.764%) after 15 min of UV-vis, respectively. With the increasing pH, CMO-8 degradation toward CR increased. Under alkaline conditions, CR is an anionic dye with a positive charge due to a higher solution concentration of OH. Due to mutual attraction between positive and negative charges, CR can be more quickly adsorbed and decomposed at pH = 9, relative to pH = 3 and 5. The degradation efficiency was excellent. Under subsequent illumination, the concentration increased due to desorption and side reactions. When the pH is decreased, the adsorption was poor. We evaluated the Zeta potential to estimate the surface charge of CMO-8 to better understand the effect of pH on the adsorption process. Figure S2c shows the degradation of CR with 60 mg of the reused CMO-8 catalyst and 2 mL of PDS at different pH. When pH = 3, 5, and 9, the degradation efficiencies of CR were 88.504%, 92.001%, and 96.955%, respectively, after 35 min of UV-vis. These results further validate the above conclusions.
Figure 8f shows the degradation of CR in UV-vis, CMO-8, UV-vis with CMO-8, PDS, PDS with UV-vis, CMO-8 with PDS, and CMO-8 with PDS and UV-vis; the corresponding degradation was 0, 5.519% (5.519% ± 0.207%), 10.486% (10.486% ± 0.168%), 31.922% (31.922% ± 0.218%), 33.532% (33.53% ± 0.551%), 94.989% (94.989% ± 0.1%), and 96.972% (96.972% ± 0.5%) after 25 min, respectively. In this study, it can be concluded that there is a good synergy between the CMO-8 catalyst and PDS, and with the participation of UV-vis, the degradation effect of the whole system on CR is greatly improved. Thus, the CMO-8/PDS-UV-vis system for CR degradation was successful.

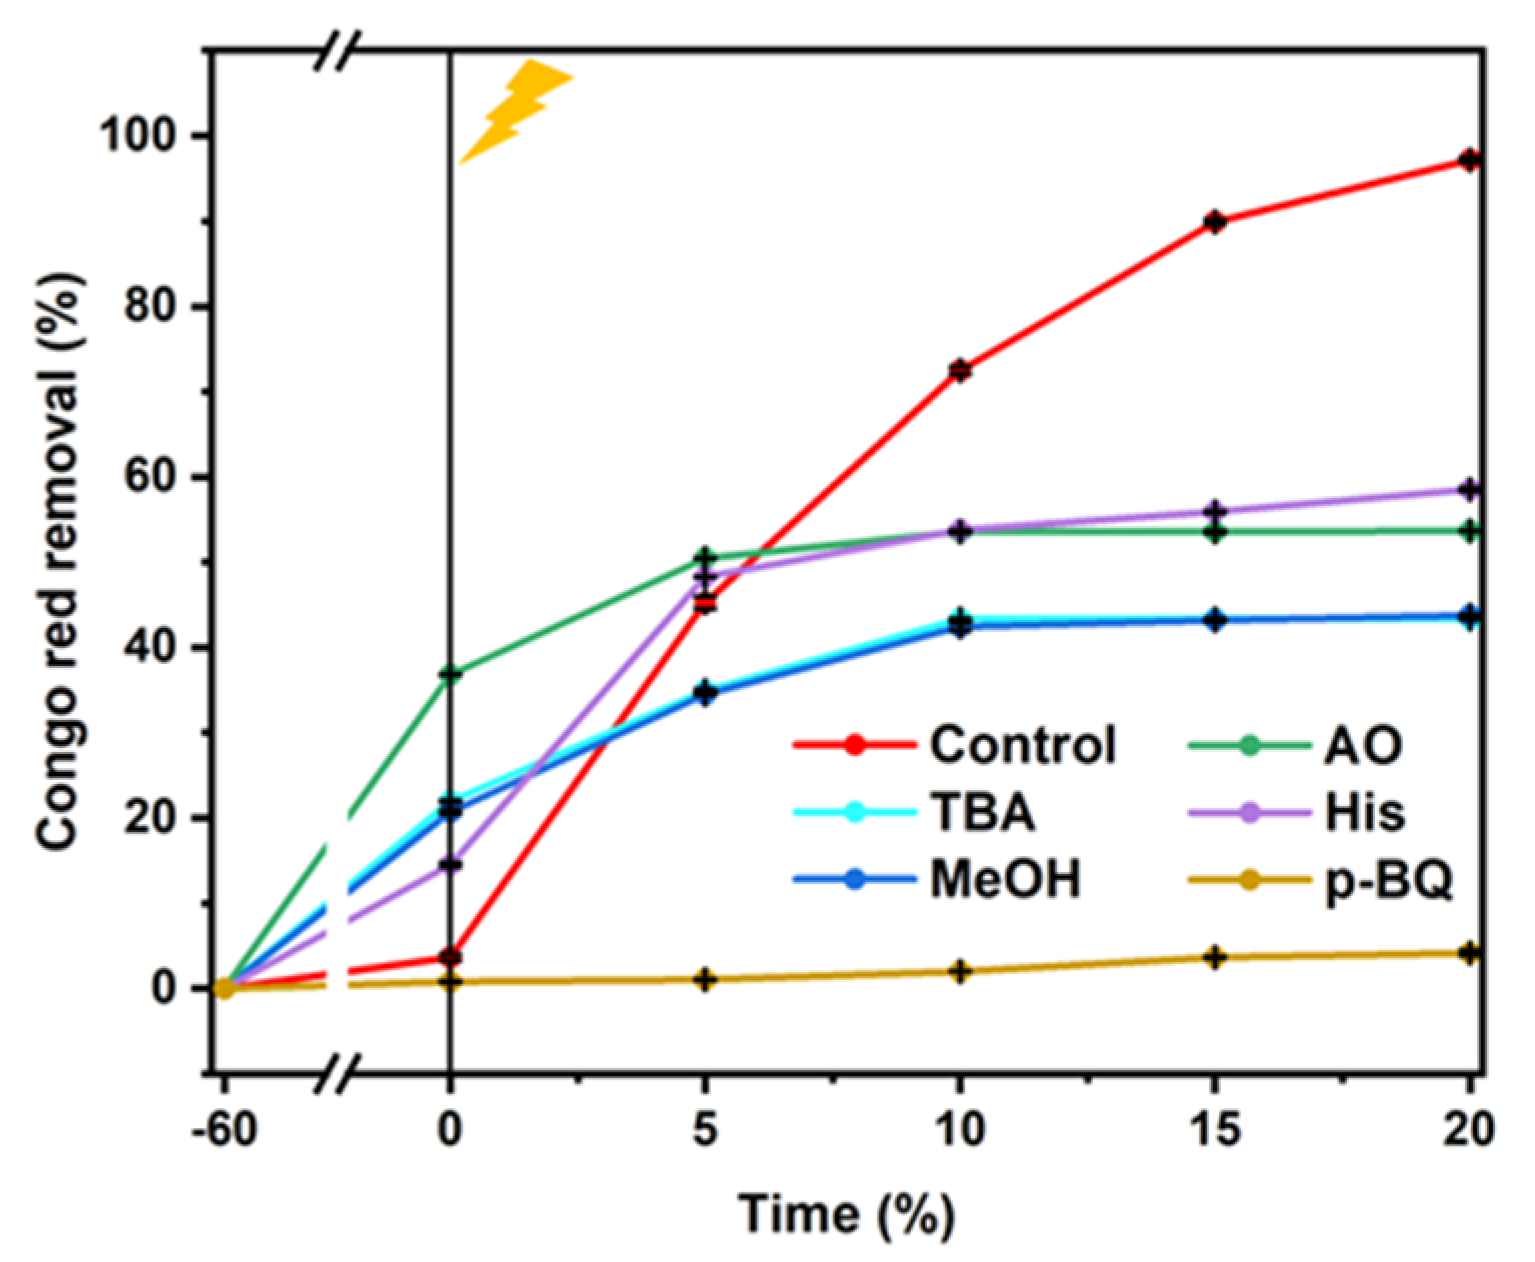
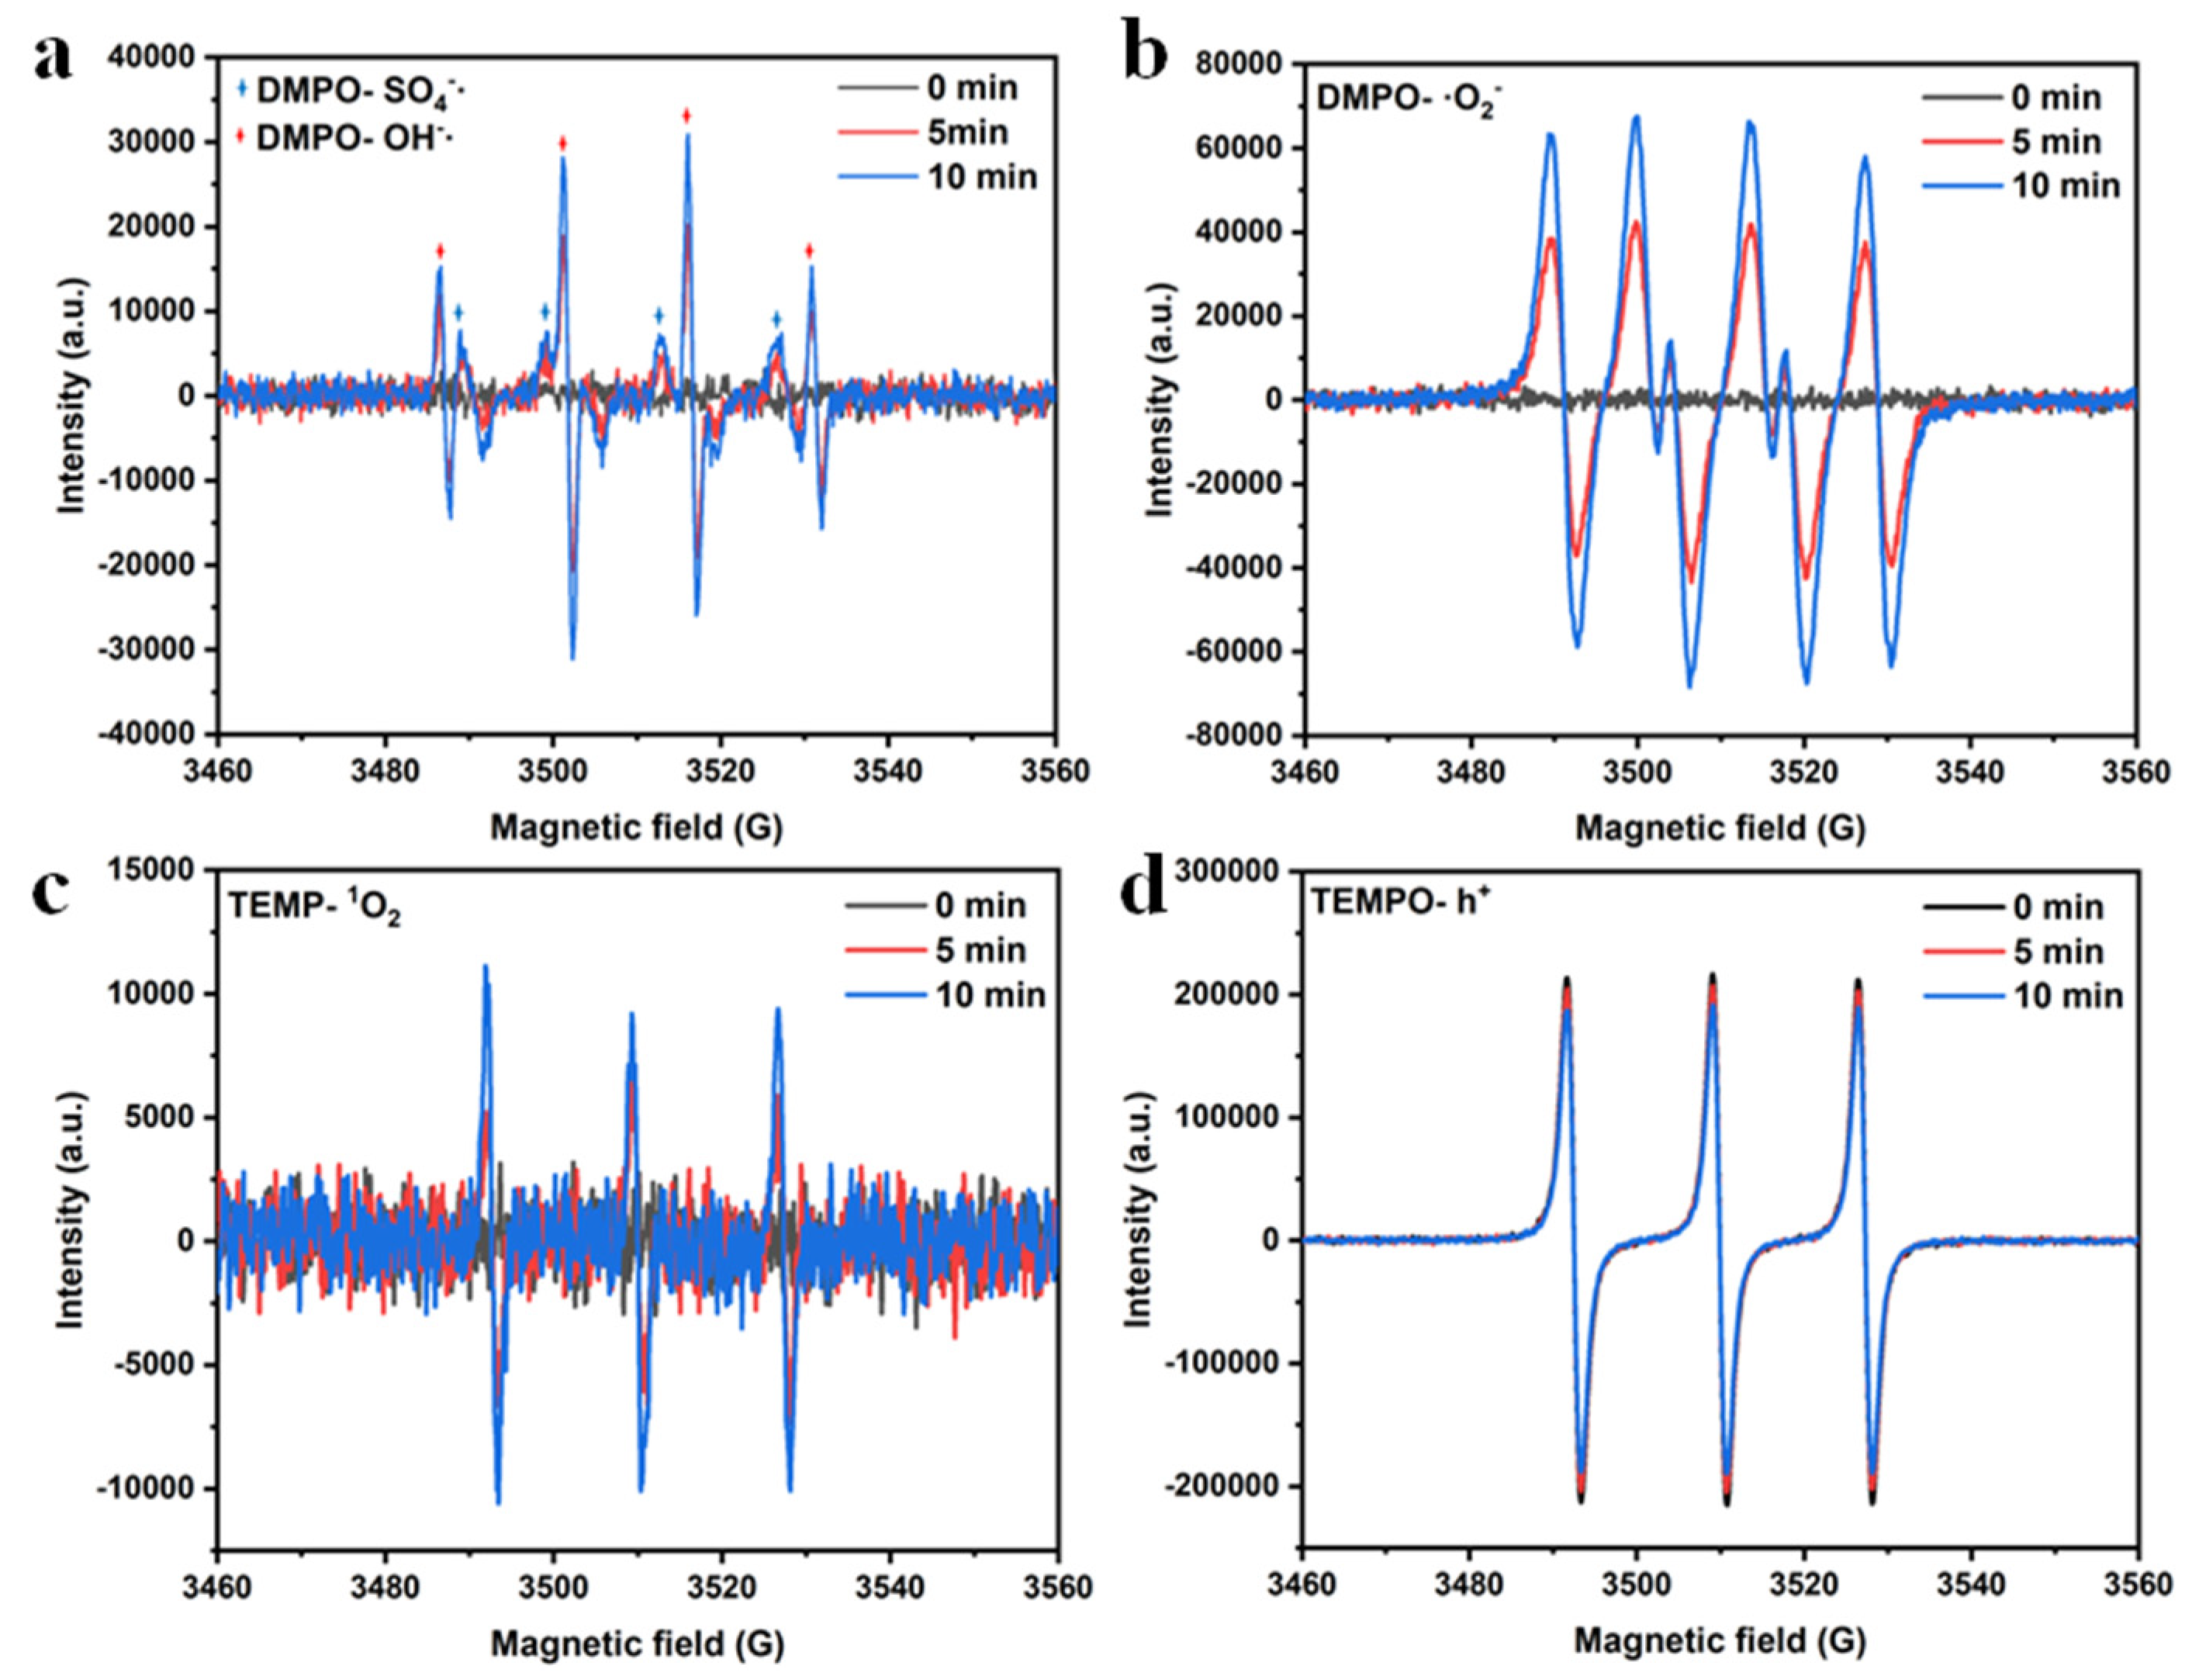
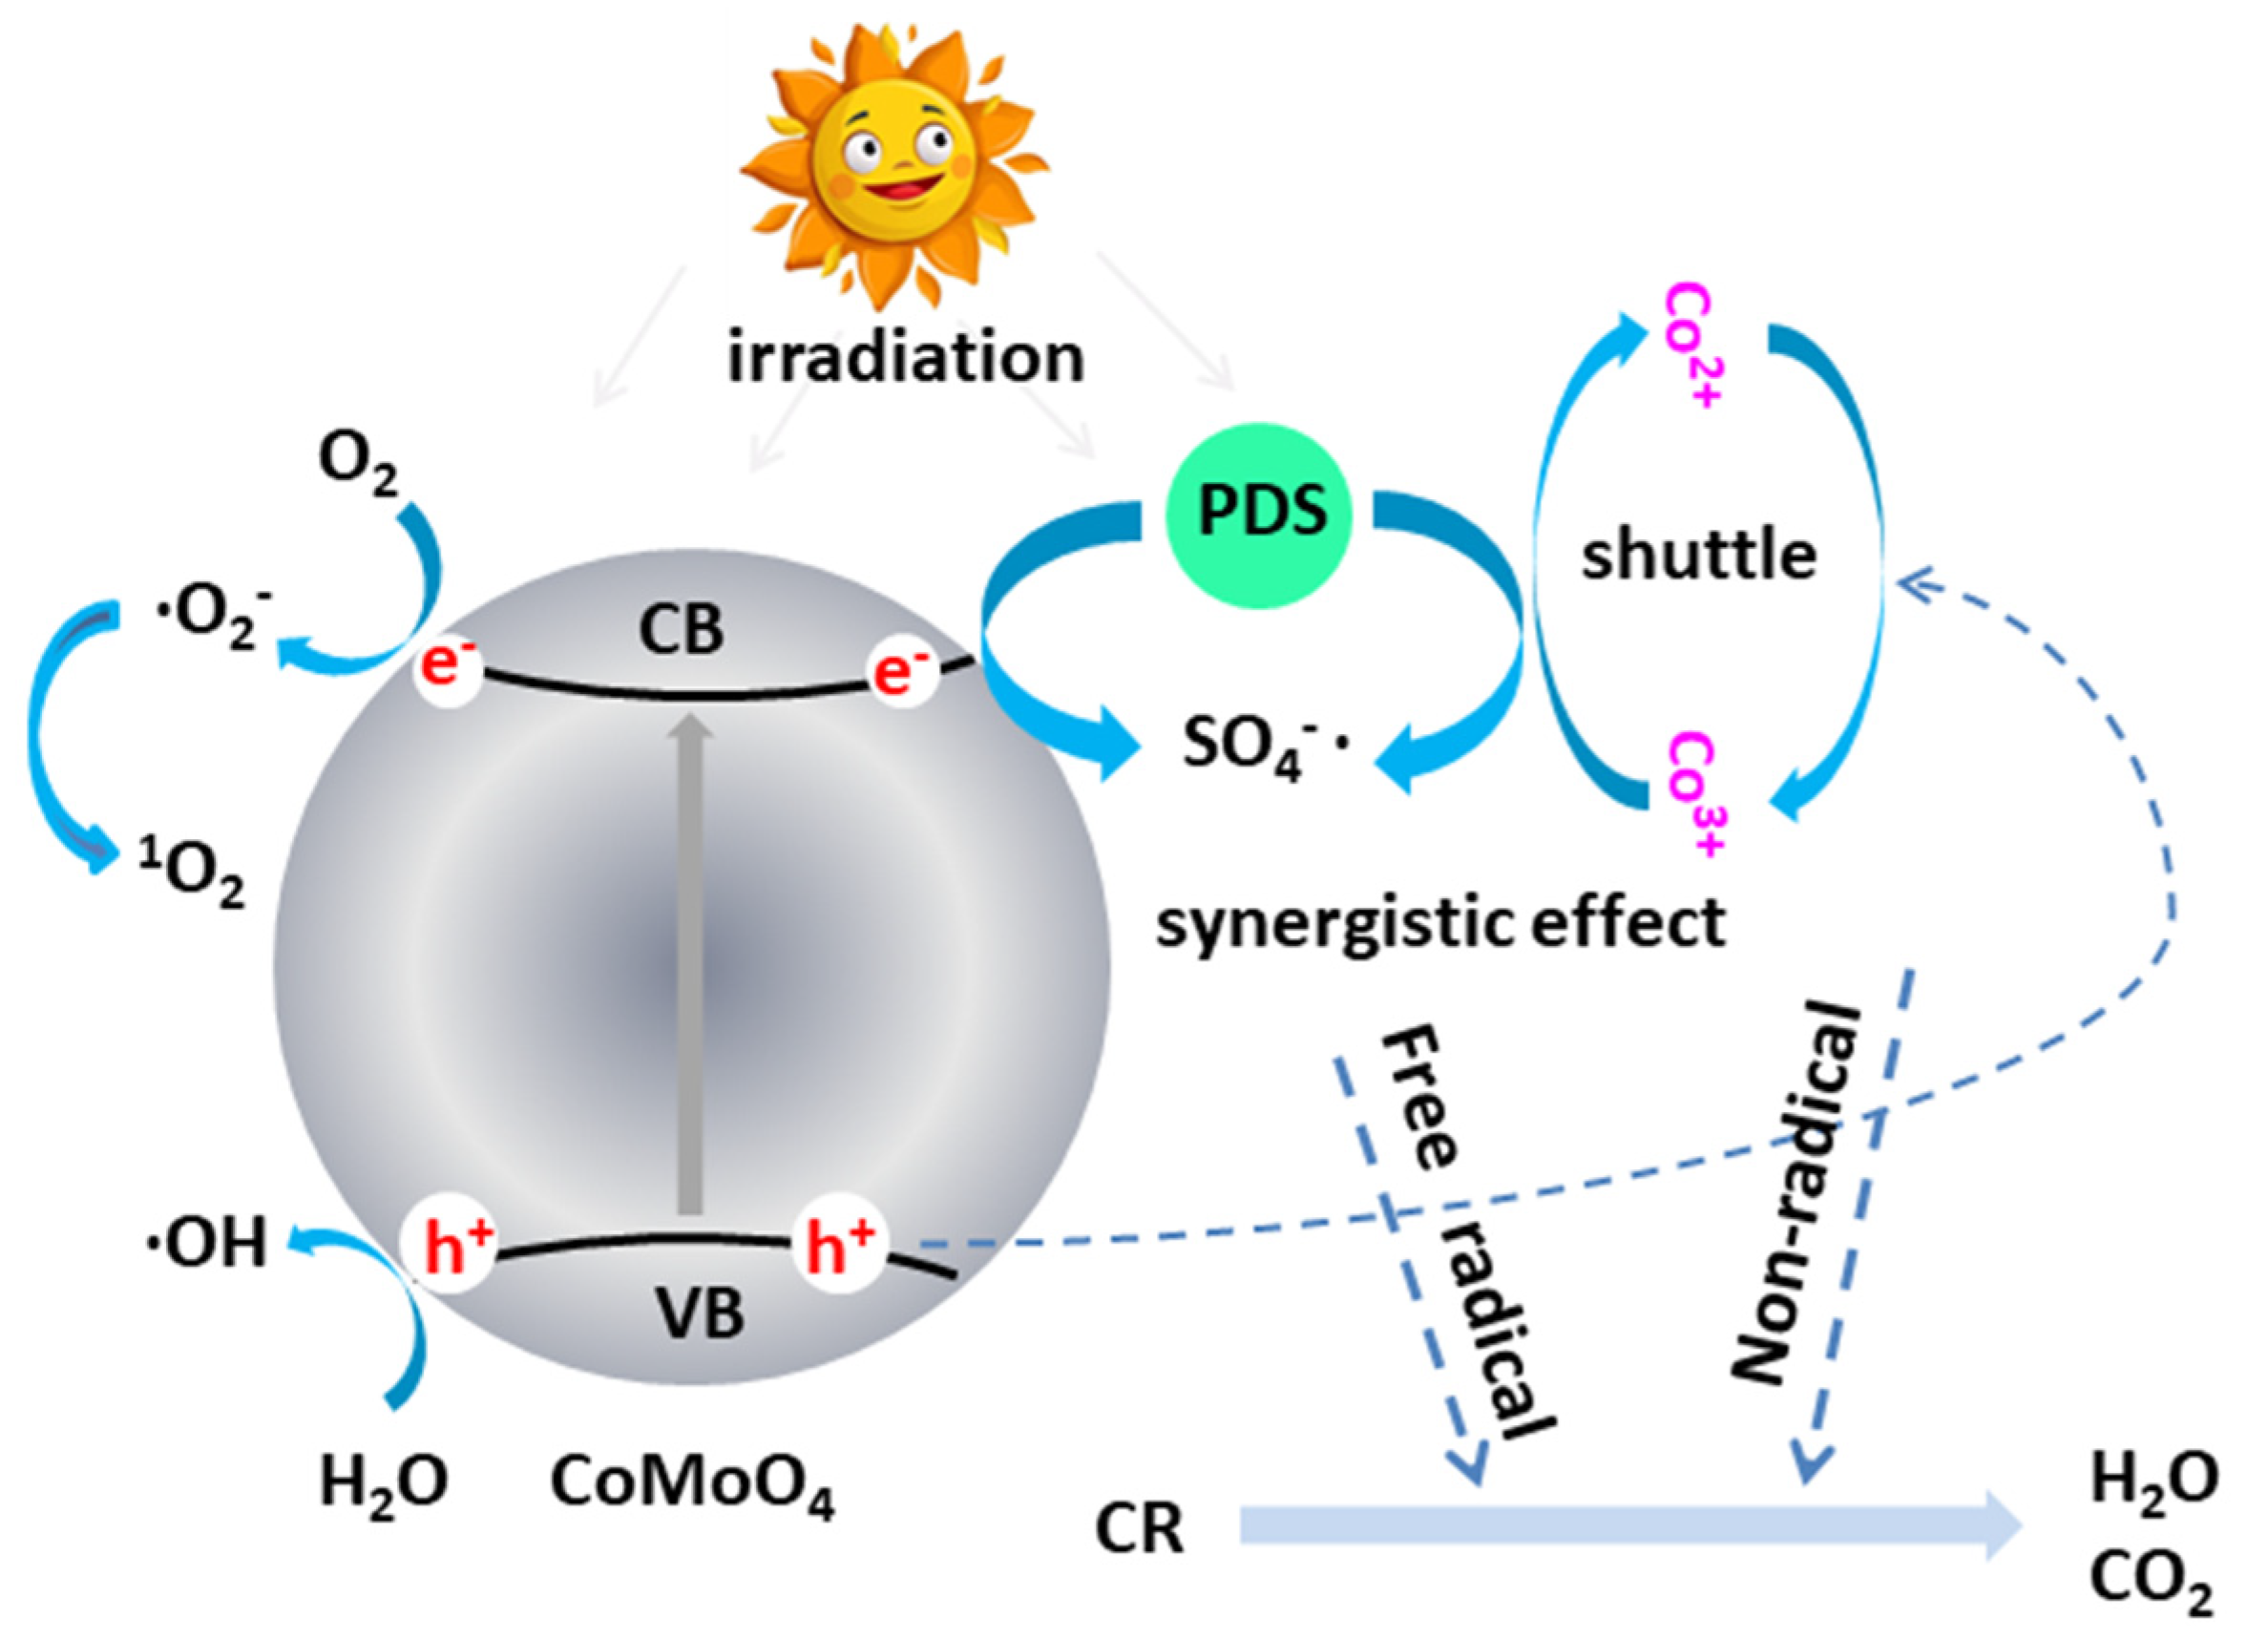
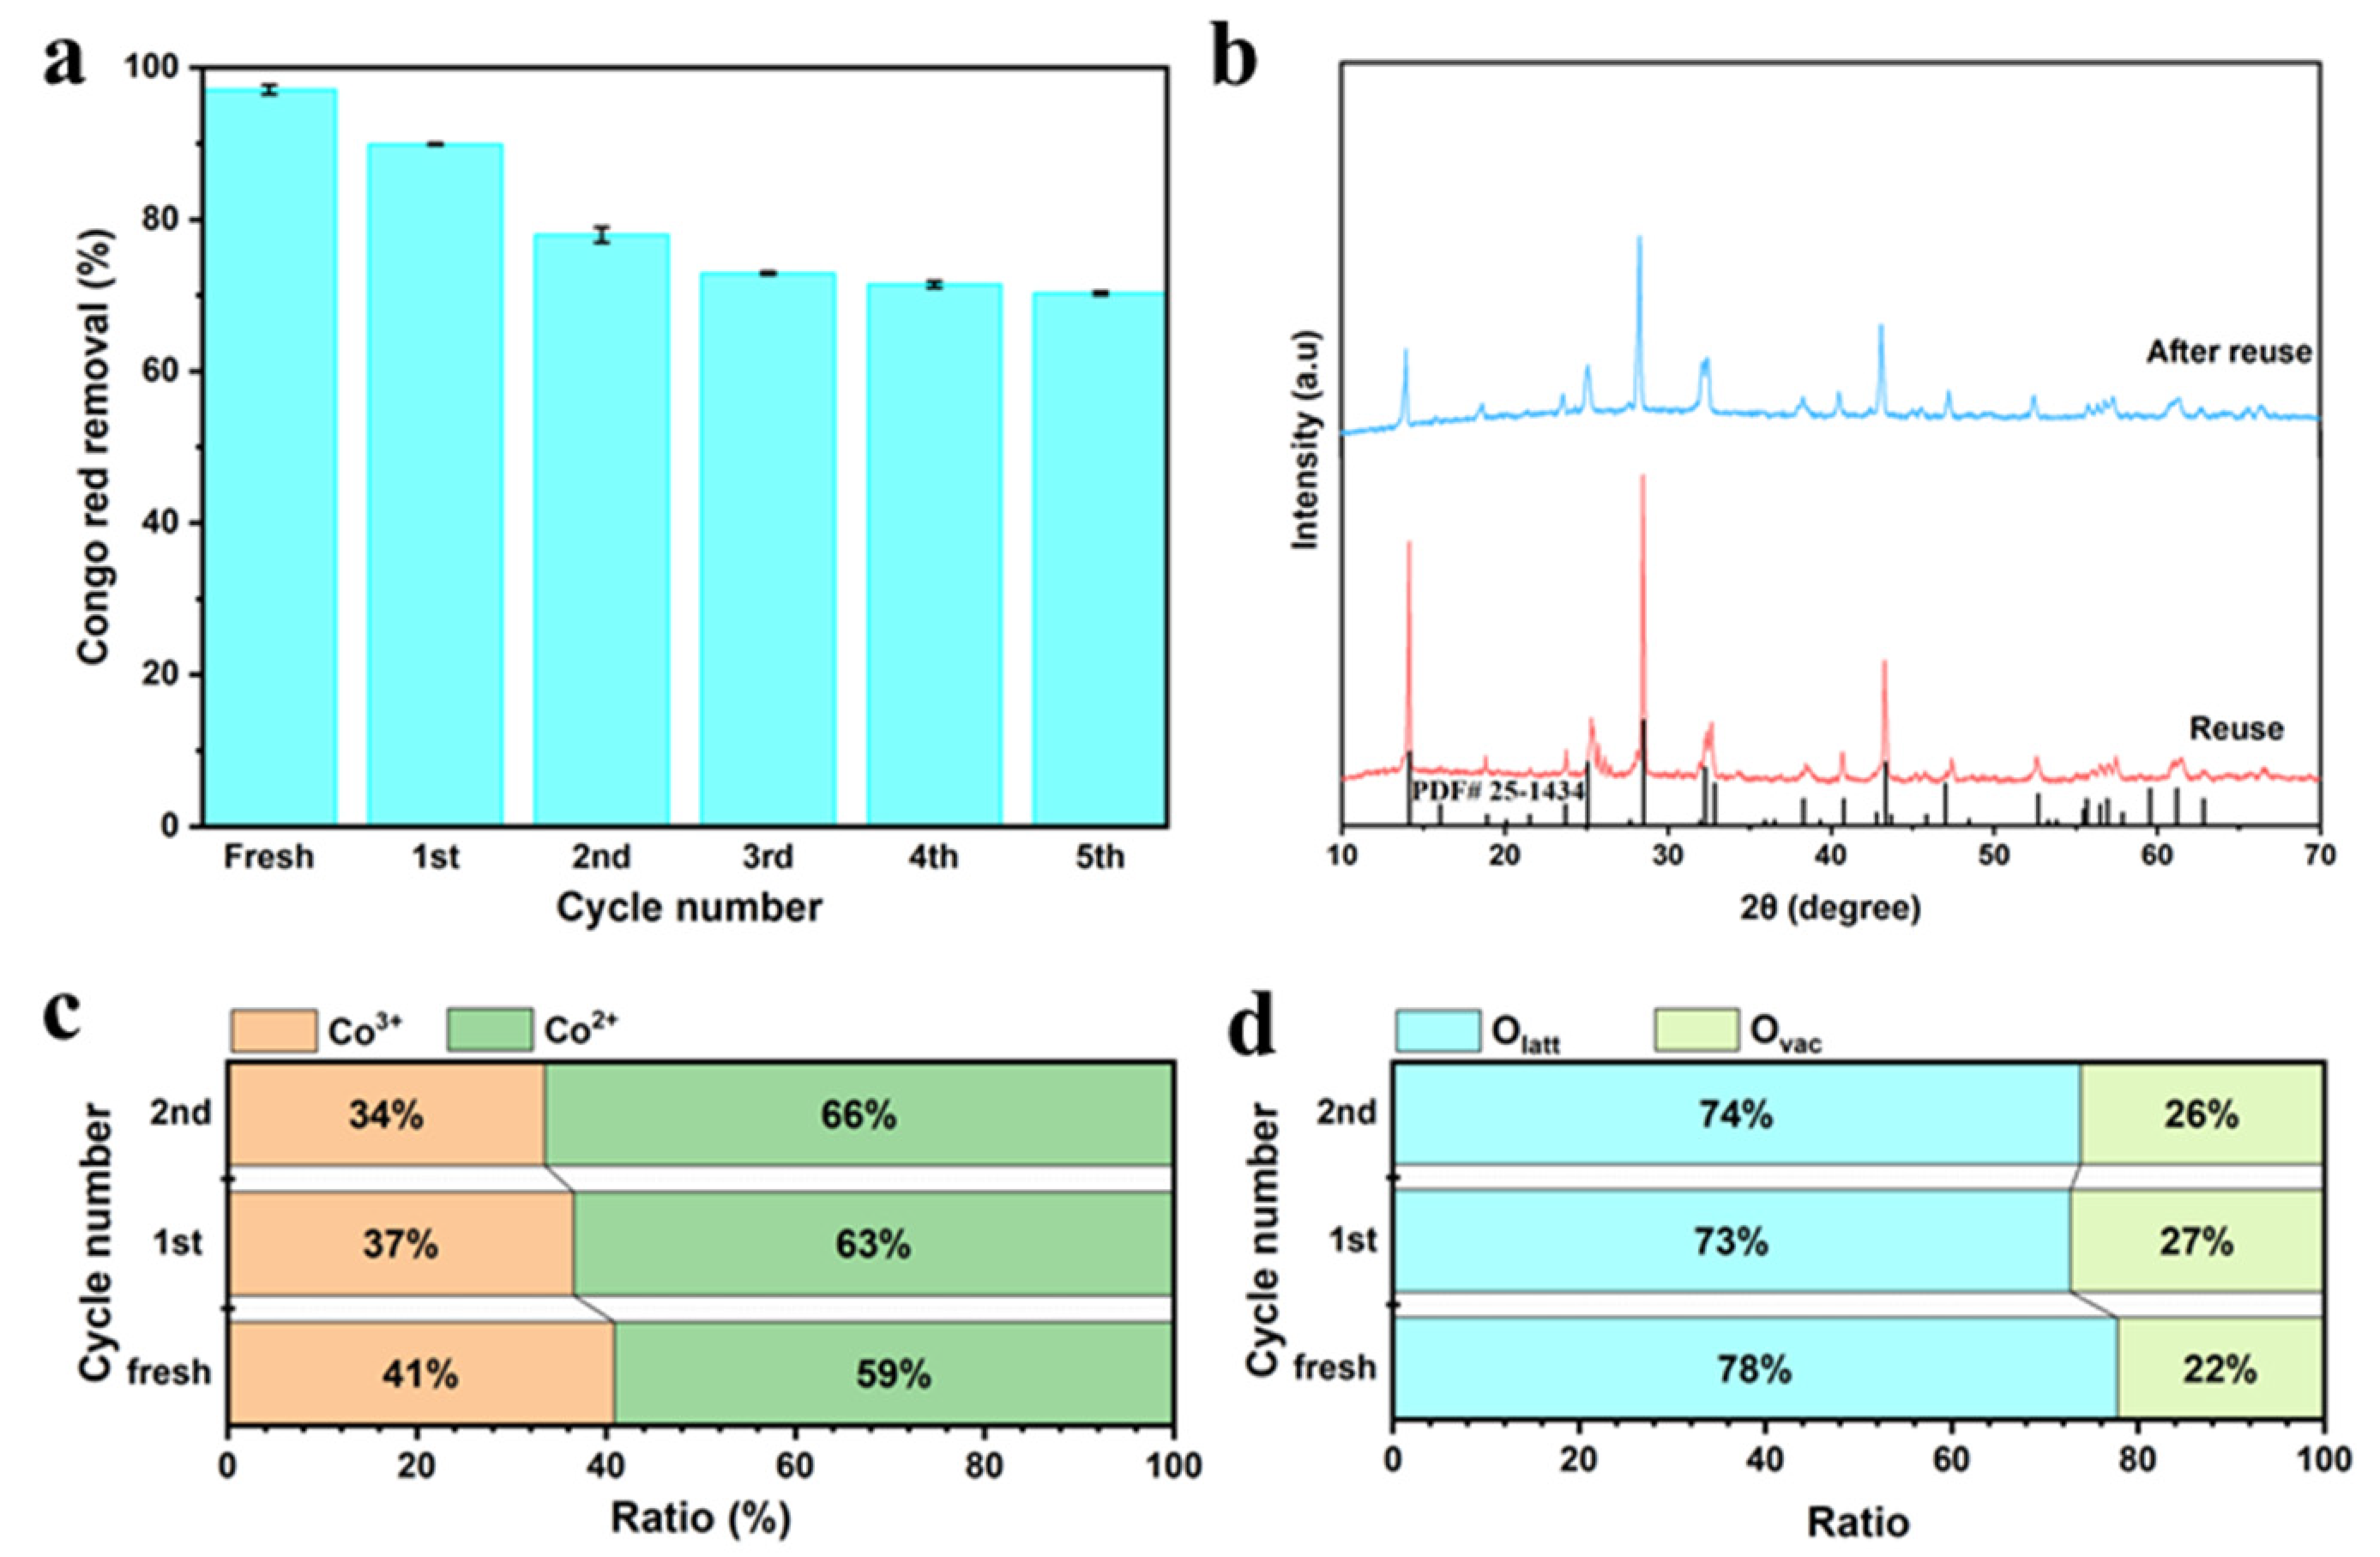
3.3. Degradation Mechanism by CMO under PDS Activation and Visible Light Irradiation

Generally speaking, ROS, such as ·OH, SO4·, O2·, and 1O2, play important roles in the oxidation of organic pollutants in PDS-based AOPs. To confirm the presence of ROS in the CoMoO4/PDS system, various quenching tests were deduced. As is reported, MeOH could be used as a capture compound for the total flux of ·OH and SO4· because of its high reactivity with both of these species (k OH/MeOH = 9.7 × 10⁸ M−1s−1; kSO4·/MeOH = 1.6 × 10⁷ M−1s−1) [54,55]. The p-BQ was also chosen as scavengers for HO2·/O2· with a rate constant of (k O2·/p-BQ = 1.0 × 10⁹ M−1s−1) [56]. TBA was used as a special ·OH capture because TBA reacts with ·OH approximately 1000 times greater than it reacts with SO4· (k·OH/TBA = (3.8–7.6) × 108 M−1s−1; kSO4·/TBA = (4–9.1) × 105 M−1s−1) [57]. In addition, L-histidine (L-His, 1O2 scavenger, K1O2 = 1.2 × 10⁸ M−1 S−1) was used [55]. Figure 9 shows that the degradation of CR was significantly suppressed from 97.168% (97.168% ± 0.3%) (control) to 43.33% (43.33% ± 0.181%), 43.739% (43.739% ± 0.135%), 53.684% (53.684% ± 0.124%), 58.507% (58.507% ± 0.21%), and 4.17% (4.17% ± 0.331%) with the addition of 1 mM TBA, 1 mM MeOH, 1 mM (NH4)2C2O2, 1 mM His, and 1 mM p-BQ to the system, respectively. Therefore, ·OH, SO4·, h+, 1O2, and ·O2 were the active substances in the CMO-PDS-UV-vis system. ·O2 showed the strongest effect among five active species (·O2> ·OH > SO4· > h+ > 1O2).
To further verify the free radical and non-radical species mentioned above, Figure 10a–d show that electron spin resonance (ESR) technology was applied to verify the quenching test [50]. Figure 10a–c show that when DMPO was added to the CMO-8/PDS reaction system for 5 min, the signal peaks of DMPO-SO4·, DMPO-·OH, and DMPO- O2· can be observed, confirming the generation of SO4·, ·OH, and O2· radicals. The intensity of the characteristics peaks of DMPO-SO4·, DMPO-·OH, and DMPO- O2· became stronger when DMPO was added for 10 min. Figure 10c shows that after adding TEMP to the system, a series of 1O2-based characteristic signals were found, indicating that 1O2 was also involved in the catalytic reaction, which was the non-radical oxidation pathway of the CMO-8/PDS system. Figure 10d shows that the peak intensity of the CMO-8-vis-PDS system (Figure 10d 5 min/10 min) was weaker than that of the CMO-8-vis-PDS (Figure 10d 0 min). The peak strength of the CMO-8-vis-PDS system decreased with time. The reason for these phenomena was that the h+ generated by photoexcitation of CMO-8 was captured by TEMPO to generate TEMPOH without paramagnetism, which reduced the intensity of the EPR spectrum. Moreover, after adding TEMPO, these observations were consistent with the studies on PDS, clearly indicating that CMO-8 can effectively activate PDS through radical and non-radical oxidation pathways to degrade CR. These results demonstrate that ·O2, ·OH, SO4·, h+, and 1O2 were very reactive oxygen species (ROSs) to degrade the dye pollutants in the CMO-8-vis-PDS system.
Figure 11 shows the detailed mechanism of radical species generation and transport in the CMO-vis-PDS system. During the photoactivation process, the CMO photo catalyst was activated by visible light, generating photoexcited e and h+ pairs when electrons were excited from the VB to the CB of CMO (Equation (1)). SO4−· radicals were produced from S2O82− by gaining e from the CB (Equation (2)), ·O2− radicals were produced from O2 by gaining e (Equation (4)), and the ·OH radicals were produced by reacting with ·O2−, h+, and H2O (Equations (6) and (7)) [57,58]. Thus, the photo-generated h+, SO4·, ·O2−, e, and ·OH radicals participated in the degradation process. At the same time, PDS was activated by Co2+, producing SO4· radicals. Combined with the abovementioned discussion in Figure 8, the excellent degradation performance of CMO could be attributed to the reactive ·O2 species, which was mainly produced from the activation of PDS by CMO (Equation (8)) [59]. Furthermore, it can be seen from Equations (9) and (11) that the Co element could undergo a reciprocal transformation between Co3+ and Co2+ during the reaction process. Electron shuttling facilitates the circulation between Co3+ and Co2+. The possible photocatalytic and persulfate activation and equations mentioned above are listed below.
CoMoO4 (photo catalyst) + h v e + h+
S2O82− + e  SO4· + SO42−
SO4· + H2O HSO5 + ·OH + H+
O2 + e  ·O2
·O2 + ·OH 1O2 + OH
H2O + ·O2 ·OH
H2O/OH + h+ ·OH + H+
Co2+ + HSO5 Co3+ + SO4· + OH
Co3+ + HSO5 Co2+ + SO5· + H+
HSO5− + SO5· SO4· + HSO4− + 1O2
Co3+ + e Co2+
CR + radicals (·O2,·OH, SO4·, h+, 1O2) degraded products +CO2 + H2O
The reusability of materials is significant in measuring the economic feasibility and propensity of secondary pollutants [60]. Figure 12a shows the CR removal rate for 6 cycles to measure the reusability of CMO-8. Before reusing, we used EtOH and deionized water to wash used CMO to remove the adsorbed PDS. Compared with the first cycle (97.7% ± 0. 6%), the removal efficiency of CR in the 2nd (89.9% ± 0.16%), 3rd (77.968% ± 1%), 4th (72.901% ± 0.18%), 5th (71.433% ± 0.41%), and 6th (70.27% ± 0.244%) cycle decreased by 7.203% (±0.6%), 19.235% (±1%), 24.302% (±0.18%), 25.77% (±0.41%), and 26.933% (±0.244%), respectively. Thus, the CMO-8/PDS-UV-vis system exhibits excellent performance in CR degradation. Figure 12b shows the XRD of reused CMO-8; after reuse, the peaks at 14.159° (110), 28.512° (220), and 43.340° (−330) were the main characteristic peaks that had a sharp decline. The XRD data of the reused CMO-8 and after reuse CMO-8 are compared with the unreacted catalyst; the results showed that the main peak shape had not changed, indicating the stability of the CMO-8 composite catalyst structure before and after the reaction (the crystal shape had not changed). In summary, the stability of both the performance and structure reflected the good cyclability and stability of the reaction system. Thus, it can be indicated that the reason of the activity liveness competence of CMO-8 decreased. Therefore, this is the reason that the degradation of CR expressed a gradual decline downdrift.
Figures S3 and S4 show the XPS spectra of reused CMO-8 and after reuse CMO-8. Figure S3a shows the curves of Co 2p, which shows two obvious peaks of 2p3/2 and 2p1/2, and two satellites (marked as “Sat.”). Two low binding energy peaks at 780.38, 780.4 and 796.71, 796, 73 eV are assigned to Co3+, while the other peaks at 781.81, 781.8 and 797.85, 797.85 eV are well-matched with Co2+. Figure S3b displays Mo 3d XPS doublets, corresponding to Mo 3d5/2 and Mo 3d3/2. The peaks at 232.35, 232.45 and 235.5, 235.6 eV come from the Mo6+. As shown in Figure S3c, the peak at 530.18 eV was ascribed to the lattice oxygen (Olatt) bonds of metal oxides and the peak at 531.28 eV might be owing to the defect site of low hypoxia coordination, indicating that Ovac were created on the surface of CoMoO4. Figure S3d shows the C1s: the peak at 284.8 eV was ascribed to the C-C, the peak at 286.4 eV was ascribed to the C-N, and the peak at 289 eV was ascribed to the O-C=O. Figure 12c shows that the ratios of Co3+, Co2+ are 36.56% and 33.51%, and 63.44% and 66.49% for reused CMO-8 and after reuse CMO-8, respectively. Figure 12d shows that the ratios of Olatt, Ovac are 72.739% and 73.817%, and 27.261% and 26.183% for reused CMO-8 and after reuse CMO-8, respectively. The Co2+ and Ova were increased by 4.277% and 7.327%, and 5.034% and 3.956% compared with the initial CMO-8, respectively. Based on this study, the repeatability of the CMO-8 catalyst is excellent.

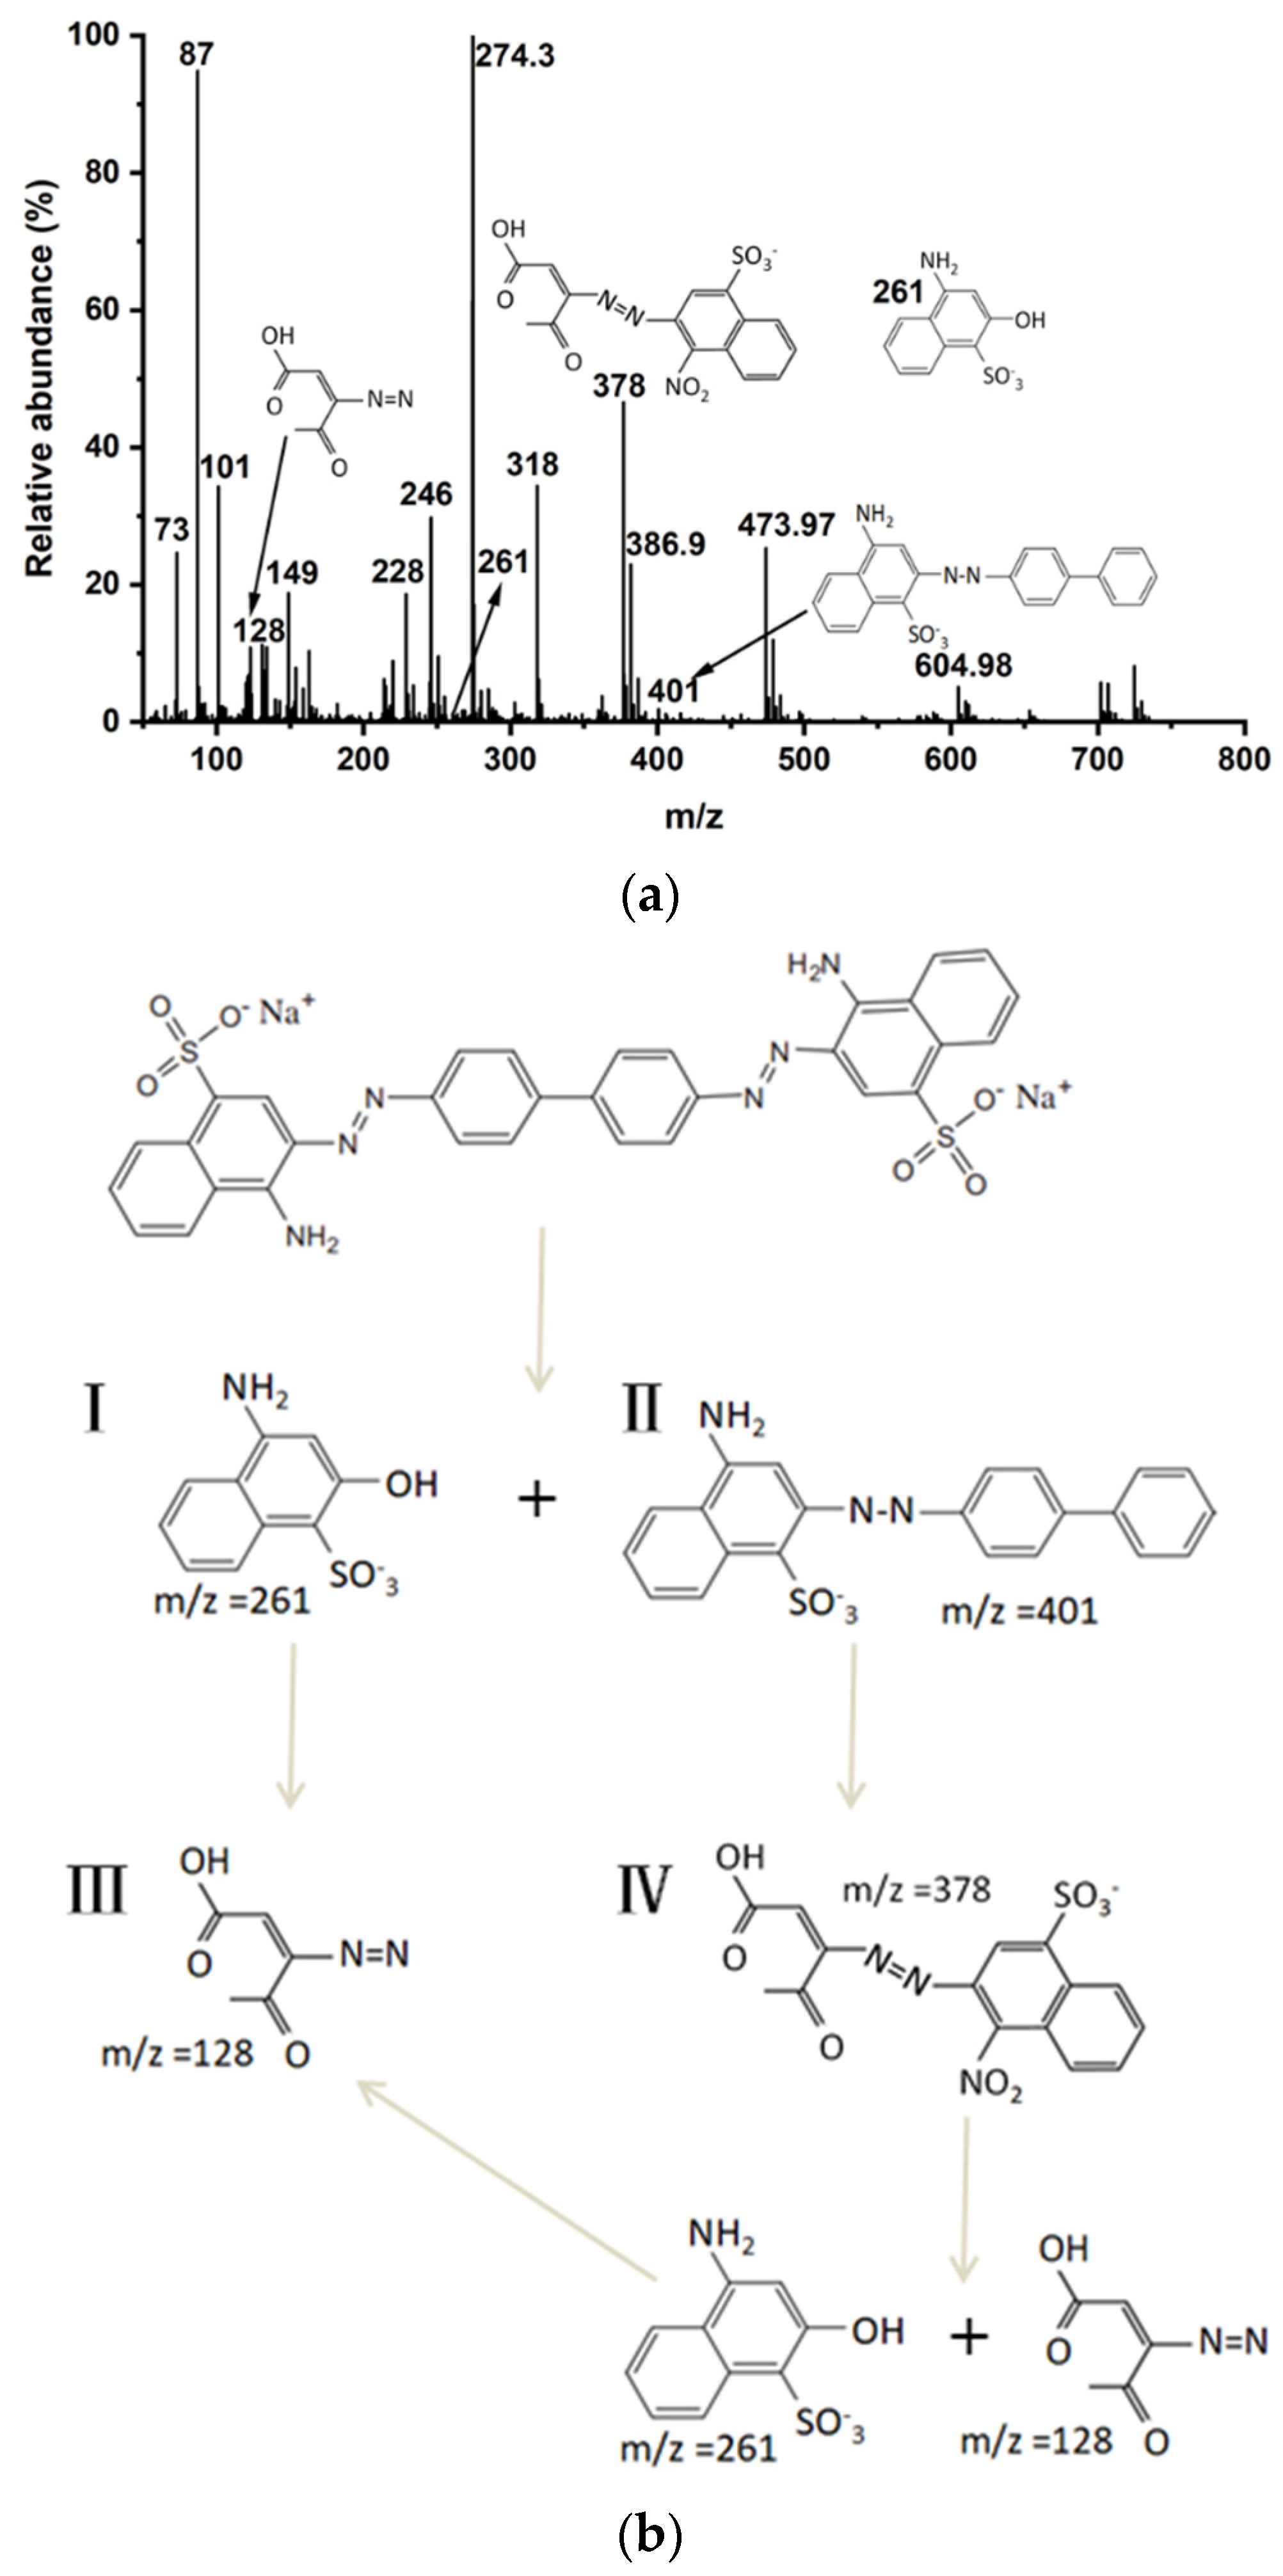
3.4. MS Analysis of Oxidation Intermediates from CR

CR is easily soluble in water, with -NH2 and SO3 groups in its molecular formula, just as phenol may be hydrolyzed in water, such as: SO3 + H2O → HSO3 + OH [61].
Figure 13 shows the degradation pathways of CR by ·OH were established from the pattern of degradation of the dye and nature of the compounds formed. Since no peak corresponding to the molecular ion peak of the dye was obtained in Figure 13a, degradation of the dye was thus confirmed. The MS method, as reported above, was used for the analysis of organic compounds of CR. CR is attacked by ·OH at the N attached to the small moiety bearing NH2 and SO3, undergoes electron transfer and bond cleavage reactions, and forms products III and IV through the loss of N2 group [62,63,64]. Product IV under the ·OH persistent attack is composed of products I and III; these intermediates are less toxic molecules compared with Congo red dye. Additionally, other than these peaks, several more peaks of negligible intensity are present in the spectrum, indicating that most of the Congo red dye molecules have been mineralized. Although several by-products are expected to form in the dye oxidation, the identification of all the products becomes difficult due to their low solubility in methanol [63].

4. Conclusions

In this study, a CoMoO4 photocatalyst was successfully synthesized by the coprecipitation method and calcination method. The CoMoO4 primary product could be synthesized quickly and efficiently by the coprecipitation method. α-CoMoO4 with high activity was further synthesized by the calcination method, and PDS activated the CR-simulated wastewater under UV-vis. The removal rate of Congo red was 96.972% after 35 min of light exposure, and 70.27% after the 6th re-use of the material. The excellent catalytic activity of CMO-8 was attributed to the synergistic effect of photocatalysis and Co2+-activated PDS degradation. The capture experiments showed that superoxide radical (·O2), singlet oxygen (1O2), sulfate (SO4), hole (h+), and hydroxyl (OH) were the main free radicals leading to the degradation of CR, which was also indicated in EPR. The effects of initial concentration, catalyst dosage, PDS dosage, and pH on CR degradation efficiency were systematically investigated. The stability of both performance and structure reflected the good cyclability and stability of the reaction system. Therefore, CMO-8 catalysts can be used for the efficient removal of dye organic wastewater.

Supplementary Materials

The following supporting information can be downloaded at: https://www.mdpi.com/article/10.3390/molecules27248642/s1, Figure S1: XPS spectra of survey; Figure S2: (a) Effect of reused CMO-8 loading; (b) Effect of PMS concentration; (c) Effect of pH; Figure S3: XPS spectra of (a) Co 2p; (b) Mo 3d; (c) O 1s; (d) C 1s of CMO-8 reuse and CMO-8 after reuse.; Figure S4: XPS spectra of survey of CMO-8 reuse and CMO-8 after reuse.

Author Contributions

Conceptualization, H.Z., Y.Q. and C.Y.; methodology, H.Z.; software, H.Z., Y.Q. and C.Y.; validation, H.Z., Y.Q. and C.Y.; formal analysis, H.Z., Y.Q., C.Y., J.Z., Z.S., T.Y., J.L. and W.W.; investigation, Y.F. and F.D.; resources, F.D. and W.W.; data curation, H.Z., Y.Q. and C.Y.; writing—original draft preparation, H.Z., Y.Q., C.Y. and W.W. All authors have read and agreed to the published version of the manuscript.

Funding

This research was funded by the National Natural Science Foundation of China grant number [42207019, 41672340].

Conflicts of Interest

The authors declare no conflict of interest.

Sample Availability

Samples of the compounds are not available from the authors.

References

  1. Silva, R.A.; Carmona-Ribeiro, A.M.; Petri, D.F. Catalytic behavior of lipase immobilized onto congo red and PEG-decorated particles. Molecules 2014, 19, 8610–8628. [Google Scholar] [CrossRef] [PubMed] [Green Version]
  2. Haounati, R.; Alakhras, F.; Ouachtak, H.; Saleh, T.; Al-Mazaideh, G.; Alhajri, E.; Jada, A.; Hafid, N.; Addi, A. Synthesized of Zeolite@Ag2O Nanocomposite as Superb Stability Photocatalysis Toward Hazardous Rhodamine B Dye from Water. Arab. J. Sci. Eng. 2022, 2022, 1–11. [Google Scholar] [CrossRef]
  3. Haounati, R.; El Guerdaoui, A.; Ouachtak, H.; El Haouti, R.; Bouddouch, A.; Hafid, N.; Bakiz, B.; Santos, D.M.F.; Taha, M.L.; Jada, A.; et al. Design of direct Z-scheme superb magnetic nanocomposite photocatalyst Fe3O4/Ag3PO4@Sep for hazardous dye degradation. Sep. Purif. Technol. 2021, 277, 119399. [Google Scholar]
  4. Das, T.; Ganguly, S.; Bhawal1, P.; Mondal1, S.; Das, N. A facile green synthesis of silver nanoparticle-decorated hydroxyapatite for efficient catalytic activity towards 4-nitrophenol reduction. Res. Chem. Intermed. 2018, 44, 1189–1208. [Google Scholar] [CrossRef]
  5. Das, T.; Remanan, S.; Ghosh, S.; Ghosh, S.; Das, N. Efficient synthesis of catalytic active silver nanoparticles illuminated cerium oxide nanotube: A mussel inspired approach. Environ. Nanotechnol. Monit. Manag. 2021, 15, 100411. [Google Scholar] [CrossRef]
  6. Karci, A.; Arslan-Alaton, I.; Olmez-Hanci, T.; Bekbolet, M. Degradation and detoxification of industrially important phenol derivatives in water by direct UV-C photolysis and H2O2/UV-C process: A comparative study. Chem. Eng. J. 2013, 224, 4–9. [Google Scholar]
  7. Li, X.L.; Zhang, J.; Jiang, Y.C.; Hu, M.C.; Li, S.N.; Zhai, Q.G. Highly efficient biodecolorization/degradation of Congo red and Alizarin yellow R by chloroperoxidase from Caldariomyces fumago: Catalytic mechanism and degradation pathway. Ind. Eng. Chem. Res. 2013, 52, 13572–13579. [Google Scholar] [CrossRef]
  8. Mokhtari, P.; Ghaedi, M.; Dashtian, K.; Rahimi, M.R.; Purkait, M.K. Removal of methyl orange by copper sulfide nanoparticles loaded activated carbon: Kinetic and isotherm investigation. J. Mol. Liq. 2016, 219, 299–305. [Google Scholar] [CrossRef]
  9. Sharma, G.; Kumar, A.; Naushad, M.; Garcia-Penas, A.; Al-Muhtaseb, A.H.; Ghfar, A.A.; Sharma, V.; Ahamad, T.; Stadler, F.J. Fabrication and characterization of Gum arabic-cl-poly(acrylamide) nanohydrogel for effective adsorption of crystal violet dye. Carbohydr. Polym. 2018, 202, 444–453. [Google Scholar] [CrossRef]
  10. Sharma, G.; Kumar, A.; Sharma, S.; Al-Muhtaseb, A.H.; Naushad, M.; Ghfar, A.A.; Ahamad, T.; Stadler, F.J. Fabrication and characterization of novel Fe0@Guar gum-crosslinked-soya lecithin nanocomposite hydrogel for photocatalytic degradation of methyl violet dye. Sep. Purif. Technol. 2019, 211, 895–908. [Google Scholar] [CrossRef]
  11. Sharma, G.; Dionysiou, D.D.; Sharma, S.; Kumar, A.; Al-Muhtaseb, A.H.; Naushad, M.; Stadler, F.J. Highly efficient Sr/Ce/activated carbon bimetallic nanocomposite for photoinduced degradation of rhodamine B. Catal. Today 2019, 335, 437–451. [Google Scholar]
  12. Paz, A.; Carballo, J.; Perez, M.J.; Dominguez, J.M. Biological treatment of model dyes and textile wastewaters. Chemosphere 2017, 181, 168–177. [Google Scholar] [CrossRef] [PubMed]
  13. Sachdeva, S.; Kumar, A. Preparation of nanoporous composite carbon membrane for separation of rhodamine B dye. J. Membr. Sci. 2009, 329, 2–10. [Google Scholar]
  14. Fernandes, A.; Nunes, M.J.; Rodrigues, A.S.; Pacheco, M.J.; Ciríaco, L.; Lopes, A. Electro-Persulfate Processes for the Treatment of Complex Wastewater Matrices: Present and Future. Molecules 2021, 26, 4821. [Google Scholar] [CrossRef] [PubMed]
  15. Dai, K.; Chen, H.; Peng, T.Y.; Ke, D.N. Photocatalytic degradation of methyl orange in aqueous suspension of mesoporous titania nanoparticles. Chemosphere 2007, 69, 1361–1367. [Google Scholar] [CrossRef]
  16. Asfaram, A.; Ghaedi, M.; Hajati, S.; Rezaeinejad, M.; Goudarzi, A.; Purkait, M.K. Rapid removal of Auramine-O and Methylene blue by ZnS:Cu nanoparticles loaded on activated carbon: A response surface methodology approach. J. Taiwan. Inst. Chem. Eng. 2015, 53, 80–91. [Google Scholar]
  17. Ribeiro, J.P.; Gomes, H.G.M.F.; Sarinho, L.; Marques, C.C.; Nunes, M.I. Synergies of metallic catalysts in the Fenton and photo-Fenton processes applied to the treatment of pulp bleaching wastewater. Chem. Eng. Process. Process Intensif. 2022, 181, 80–91. [Google Scholar]
  18. Liu, D.; Chen, D.; Hao, Z.; Tang, Y.; Jiang, L.; Li, T.; Tian, B.; Yan, C.; Luo, Y.; Jia, B. Efficient degradation of Rhodamine B in water by CoFe2O4/H2O2 and CoFe2O4/PMS systems: A comparative study. Chemosphere 2022, 307, 135935. [Google Scholar] [CrossRef]
  19. Li, Y.; Wang, X.; Duan, Z.; Yu, D.; Wang, Q.; Ji, D.; Liu, W. Zn/Co-ZIFs@MIL-101(Fe) metal–organic frameworks are effective photo-Fenton catalysts for RhB removal. Sep. Purif. Technol. 2022, 293, 121099. [Google Scholar]
  20. Parhi, P.K.; Misra, P.K. Environmental friendly approach for selective extraction and recovery of molybdenum (Mo) from a sulphate mediated spent Ni–Mo/Al2O3 catalyst baked leach liquor. J. Environ. Manag. 2022, 306, 114474. [Google Scholar]
  21. Xue, C.-M.; Li, S.-X.; Zhang, L.; Sha, J.-Q.; Zheng, T.-Y.; Zhang, Q.-N.; Li, L. Hydrothermal Synthesis, Characterization and Electrocatalytic/Photocatalytic Activities of New Polyoxometalate Based Hybrid Compound. J. Inorg. Organomet. Polym. Mater. 2013, 23, 1468–1476. [Google Scholar]
  22. Coué, V.; Dessapt, R.; Bujoli-Doeuff, M.; Evain, M.; Jobic, S. Hydrothermal Synthesis, Characterization and Electrocatalytic/Photocatalytic Activities of New Polyoxometalate Based Hybrid Compound. Inorg. Chem. 2007, 46, 2824–2835. [Google Scholar] [PubMed]
  23. Xu, Z.; Wang, Y.; Liu, M.; Sarwar, M.K.; Zhao, Y. Defects enriched cobalt molybdate induced by carbon dots for a high rate Li-ion battery anode. Nanotechnology 2021, 33, 1361–6528. [Google Scholar]
  24. Guo, J.; Chu, L.; Wang, L.; Liu, H.; Yang, M.; Wang, G. Self-templated fabrication of CoMoO4-Co3O4 hollow nanocages for efficient aerobic oxidative desulfurization. Appl. Surf. Sci. 2022, 579, 152251. [Google Scholar] [CrossRef]
  25. Geng, X.; Ai, Y.; Shen, G. Facile construction of novel CoMoO4 microplates@CoMoO4 microprisms structures for well-stable supercapacitors. Prog. Nat. Sci. 2016, 26, 243–252. [Google Scholar]
  26. Konga, L.B.; Langa, J.W.; Liua, M.; Luo, Y.C.; Kang, L. Facile approach to prepare loose-packed cobalt hydroxide nano-flakes materials for electrochemical capacitors. J. Power Sources 2009, 194, 1194–1201. [Google Scholar] [CrossRef]
  27. Liu, M.-C.; Kong, L.-B.; Lu, C.; Li, X.-M.; Luo, Y.-C.; Kang, L. Facile fabrication of CoMoO4 nanorods as electrode material for electrochemical capacitors. Mater. Lett. 2013, 94, 197–200. [Google Scholar]
  28. Edrissi, M.; Samadanian-Isfahani, S.; Soleymani, M. Preparation of cobalt molybdate nanoparticles; Taguchi optimization and photocatalytic oxidation of Reactive Black 8 dye. Powder Technol. 2013, 249, 378–385. [Google Scholar] [CrossRef]
  29. Zhou, J.; Deng, S.; Liu, L.; Lan, Y.; Chen, C. Three-dimensional blocky sponge based CoMoO4 catalyst activates peroxymonosulfate to degrade sulfadimethoxine: A remedy for ready-made catalysts to achieve convenient and continuous operation. Chem. Eng. J. 2023, 451, 138754. [Google Scholar] [CrossRef]
  30. Liu, Z.L.; Xu, J.; Xiang, C.J.; Liu, Y.; Ma, L.J.; Hu, L.Y. S-scheme heterojunction based on ZnS/CoMoO4 ball-and-rod composite. Appl. Surf. Sci. 2021, 569, 150973. [Google Scholar] [CrossRef]
  31. Adabavazeh, H.; Saljooqi, A.; Shamspur, T.; Mostafavi, A. Synthesis of polyaniline decorated with ZnO and CoMoO4 nanoparticles for enhanced photocatalytic degradation of imidacloprid pesticide under visible light. Polyhedron 2021, 198, 115058. [Google Scholar] [CrossRef]
  32. Umapathy, V.; Neeraja, P. Sol–Gel synthesis and characterizations of CoMoO4 nanoparticles: An efficient photocatalytic degradation of 4-chlorophenol. J. Nanosci. Nanotechnol. 2016, 16, 2960–2966. [Google Scholar] [PubMed]
  33. Fan, Y.A.; Ma, W.J.; He, J.L.; Du, Y.C. CoMoO4 as a novel heterogeneous catalyst of peroxymonosulfate activation for the degradation of organic dyes. RSC Adv. 2017, 7, 36193–36200. [Google Scholar]
  34. Sun, M.; Dang, Y.; Du, R.; Lu, Z.; Wang, Y.; Wang, X.; Song, C.; Li, T.; Wang, G.; Ye, J.; et al. Experiment and theoretical insights into CuNi/CoMoO4 multi-functional catalyst with laccase-like: Catalysis mechanism, smartphone biosensing and organic pollutant efficient degradation. Chem. Eng. J. 2021, 425, 130586. [Google Scholar]
  35. Song, X.; Ni, J.; Liu, D.; Shi, W.; Yuan, Y.; Cui, F.; Tian, J.; Wang, W. Molybdenum disulfide as excellent Co-catalyst boosting catalytic degradation of sulfamethoxazole by nZVI/PDS process. Sep. Purif. Technol. 2022, 285, 120398. [Google Scholar]
  36. Saleem, S.S. Infrared and Raman Spectroscopic Studies of the Polymorphic forms of Nickel, Cobalt and Ferric Molybdates. Infkred Phys. 1987, 27, 309–315. [Google Scholar] [CrossRef]
  37. Rodriguez, J.A.; Chaturvedi, S.; Hanson, J.C. Reaction of H2 and H2S with CoMoO4 and NiMoO4: TPR, XANES, time-resolved XRD, and molecular-orbital studies. J. Phy. Chem. 1999, 103, 770–781. [Google Scholar] [CrossRef]
  38. Baskar, S.; Meyrick, D.; Ramakrishnan, K.S.; Minakshi, M.J.C.E.J. Facile and large scale combustion synthesis of α-CoMoO4: Mimics the redox behavior of a battery in aqueous hybrid device. Chem. Eng. J. 2014, 253, 502–507. [Google Scholar] [CrossRef] [Green Version]
  39. Ette, P.M.; Chithambararaj, A.; Prakash, A.; Ramesha, K.J.A. Interfaces, MoS2 nanoflower-derived interconnected CoMoO4 nanoarchitectures as a stable and high rate performing anode for lithium-ion battery applications. ACS Appl. Mater. Interfaces 2020, 12, 11511–11521. [Google Scholar] [CrossRef]
  40. Mandal, M.; Ghosh, D.; Giri, S.; Shakir, I.; Das, C.K. Polyaniline-wrapped 1D CoMoO4·0.75H2O nanorods as electrode materials for supercapacitor energy storage applications. RSC. Adv. 2014, 4, 30832–30839. [Google Scholar]
  41. Rahulan, K.M.; Flower, N.A.L.; Sujatha, R.A.; Padmanathan, N.; Gopalakrishnan, C. Nonlinear optical absorption studies of CoMoO4 hybrid nanostructures. J. Mater. Sci. Mater. Electron. 2017, 29, 1504–1509. [Google Scholar] [CrossRef]
  42. Dang, Y.; Wang, G.; Su, G.; Lu, Z.; Wang, Y.; Liu, T.; Pu, X.; Wang, X.; Wu, C.; Song, C.; et al. Rational construction of a Ni/CoMoO4 heterostructure with strong Ni-O-Co bonds for improving multifunctional nanozyme activity. ACS Nano 2022, 16, 4536–4550. [Google Scholar] [PubMed]
  43. Rosić, M.; Zarubica, A.; Šaponjić, A.; Babić, B.; Zagorac, J.; Jordanov, D.; Matović, B. Structural and photocatalytic examination of CoMoO4 nanopowders synthesized by GNP method. Mater. Res. Bull. 2018, 98, 111–120. [Google Scholar] [CrossRef]
  44. Chi, K.; Zhang, Z.; Lv, Q.; Xie, C.; Xiao, J.; Xiao, F.; Wang, S. Well-Ordered Oxygen-Deficient CoMoO4 and Fe2O3 Nanoplate Arrays on 3D Graphene Foam: Toward Flexible Asymmetric Supercapacitors with Enhanced Capacitive Properties. ACS Appl. Mater. Interfaces 2017, 9, 6044–6053. [Google Scholar] [CrossRef] [PubMed]
  45. Liu, Z.; Wang, J.; Zhan, C.; Yu, J.; Cao, Y.; Tu, J.; Shi, C. Phosphide-oxide honeycomb-like heterostructure CoP@CoMoO4/CC for enhanced hydrogen evolution reaction in alkaline solution. J. Mater. Sci. Technol. 2020, 46, 177–184. [Google Scholar]
  46. Sun, M.M.; Huang, S.; Su, G.H.; Wang, X.X.; Lu, Z.W.; Wamg, Y.Y.; Liu, T.; Jiang, Y.Y.; Song, C.; Rao, H.B. Synthesis of pH-switchable Pt/Co3O4 nanoflowers: Catalytic mechanism, four-enzyme activity and smartphone biosensing applications. Chem. Eng. J. 2022, 437, 134414. [Google Scholar]
  47. Xu, K. Electrolytes and interphases in Li-ion batteries and beyond. Chem. Rev. 2014, 114, 11503–11618. [Google Scholar]
  48. Huerta-Aguilar, C.; Gutiérrez, Y.; Thangarasu, P. Crystal plane directed interaction of TiO2 [1 0 1] with AgNPs [1 1 1] silver nanoparticles enhancing solar light induced photo-catalytic oxidation of ciprofloxacin: Experimental and theoretical studies. Chem. Eng. J 2020, 394, 124286. [Google Scholar]
  49. Huerta-Aguilar, C.; Ramírez-Alejandre, A.; Thangarasu, P.; Arenas-Alatorre, J.; Reyes-Dominguez, I.; Corea, M. Crystal phase induced band gap energy enhancing the photo-catalytic properties of Zn–Fe2O4/Au NPs: Experimental and theoretical studies. Catal. Sci. Technol. 2019, 9, 3066–3080. [Google Scholar] [CrossRef]
  50. Huerta-Aguilar, C.; Diaz-Puerto, Z.; Tecuapa-Flores, E.; Thangarasu, P. Crystal Plane Impact of ZnFe2O4−Ag Nanoparticles Influencing Photocatalytical and Antibacterial Properties: Experimental and Theoretical Studies. ACS Omega 2022, 7, 33985–34001. [Google Scholar] [CrossRef]
  51. Ortega-Granados, J.; Thangarasu, P. Photo-deposition of Ag/AuNPs on TiO2 accelerating the oxidation of tetracycline under visible light. Mater. Lett. 2022, 321, 132455. [Google Scholar] [CrossRef]
  52. Ko, S.; Kim, E.S.; Park, S.; Daigle, H.; Milner, T.E.; Huh, C.; Bennetzen, M.V.; Geremia, G.A. Amine functionalized magnetic nanoparticles for removal of oil droplets from produced water and accelerated magnetic separation. J. Nanoparticle Res. 2017, 19, 132. [Google Scholar] [CrossRef]
  53. Zhao, S.; Xu, J.; Mao, M.; Li, L.J.; Li, X.H. NiCo2S4@Zn0.5Cd0.5S with direct Z-scheme heterojunction constructed by band structure adjustment of ZnxCd1-xS for efficient photocatalytic H2 evolution. Appl. Surf. Sci. 2020, 528, 147016. [Google Scholar] [CrossRef]
  54. Yang, S.P.; Yang, J.; Zhang, X.Q.; Tang, J.; Li, J.L.; Zhang, A.P. Degradation of refractory organic matter in MBR effluent from treating landfill leachate by UV/PMS and UV/H2O2: A comparative study. Environ. Technol. 2022, 2022, 1–32. [Google Scholar] [CrossRef] [PubMed]
  55. Yang, S.; Wu, P.; Liu, J.; Chen, M.; Ahmed, Z.; Zhu, N. Efficient removal of bisphenol A by superoxide radical and singlet oxygen generated from peroxymonosulfate activated with Fe0-montmorillonite. Chem. Eng. J. 2018, 350, 484–495. [Google Scholar] [CrossRef]
  56. Neta, P.; Huie, R.E.; Ross, A. Rate constants for reactions of inorganic radicals in aqueous solution. J. Phys. Chem. Ref. Data 1988, 17, 1027–1284. [Google Scholar] [CrossRef]
  57. Mafa, P.J.; Mamba, B.B.; Kuvarega, A.T. Construction of hierarchical BiPW12O40/BiOI p–n heterojunction with enhanced visible light activity for degradation of endocrine disrupting Bisphenol A. Sep. Purif. Technol. 2020, 253, 117349. [Google Scholar] [CrossRef]
  58. Guo, J.; Shen, C.-H.; Sun, J.; Xu, X.-J.; Li, X.-Y.; Fei, Z.-H.; Liu, Z.-T.; Wen, X.J. Highly efficient activation of peroxymonosulfate by Co3O4/Bi2MoO6 pn heterostructure composites for the degradation of norfloxacin under visible light irradiation. Sep. Purif. Technol. 2021, 259, 118109. [Google Scholar] [CrossRef]
  59. Shakeel, M.; Arif, M.; Yasin, G.; Li, B.; Khan, H.D. Layered by layered Ni-Mn-LDH/g-C3N4 nanohybrid for multi-purpose photo/electrocatalysis: Morphology controlled strategy for effective charge carriers separation. Appl. Catal. B Environ. 2019, 242, 485–498. [Google Scholar] [CrossRef]
  60. Mian, M.M.; Liu, G. Activation of peroxymonosulfate by chemically modified sludge biochar for the removal of organic pollutants: Understanding the role of active sites and mechanism. Chem. Eng. J. 2020, 392, 123681. [Google Scholar] [CrossRef]
  61. Aguilar, C.; Pandiyan, T.; Arenas-Alatorre, J.; Singh, N. Oxidation of phenols by TiO2-Fe3O4-M (M = Ag or Au) hybrid composites under visible light. Sep. Purif. Technol. 2015, 149, 265–278. [Google Scholar] [CrossRef]
  62. Shaha, N.; Khanb, J.; Sayedb, M.; Khana, Z.; Iqbalc, J.; Arshada, S.; Junaida, M.; Khan, H. Synergistic effects of H2O2 and S2O82− in the gamma radiation induced degradation of congo-red dye: Kinetics and toxicities evaluation. Sep. Purif. Technol. 2020, 233, 115966. [Google Scholar] [CrossRef]
  63. Huerta-Aguilar, C.; Palos-Barba, V.; Thangarasu, P.; Koodali, R. Visible light driven photo-degradation of Congo red by TiO2ZnO/Ag:DFT approach on synergetic effect on band gap energy. Chemosphere 2018, 213, 481–497. [Google Scholar] [CrossRef] [PubMed]
  64. Ko, S.; Kim, E.; Park, S.; Daigle, H.; Milner, T.; Huh, C. Oil Droplet Removal from Produced Water Using Nanoparticles and Their Magnetic Separation. In Proceedings of the SPE Annual Technical Conference and Exhibition 2016, Dubai, United Arab Emirates, 26–28 September 2016. [Google Scholar]
Figure 1. Molecular structure of CR.
Molecules 27 08642 g001
Figure 2. (a) Determined unit crystal illustration (cyan represents Mo, jacinth represents Co, and red represents O); (b) XRD; (c) Raman; (d) FTIR spectra of CMO-8, CMO-9, and CMO-1.
Molecules 27 08642 g002
Figure 3. SEM images of CMO-8 (a,b); CMO-9 (c,d); CMO-1 (e,f).
Molecules 27 08642 g003
Figure 4. TEM images of CMO-8 (a,b); CMO-9 (c,d); CMO-1 (e,f).
Molecules 27 08642 g004
Figure 5. XPS spectra of (a) Co 2p; (b) Mo 3d; (c) O 1s; (d) C 1s of CMO-8.
Molecules 27 08642 g005
Figure 6. (a) TGA; (b) DTG; (c) Zeta potential of various pH with 2, 4, 6, and 8; (d) The variation curve for zeta potential as a function of pH value of CMO-8.
Molecules 27 08642 g006
Figure 7. BET of (a) CMO-8; (b) CMO-9; (c) CMO-1; UV-visible diffuse reflectance spectra of (d) CMO-8; (e) CMO-9; (f) CMO-1.
Molecules 27 08642 g007
Figure 8. Degradation of CR of (a) CMO-8, CMO-9, CMO-1; (b) CMO-8, CMO-9, CMO-1 + PDS; (c) Effect of catalyst loading; (d) Effect of PDS concentration; (e) Effect of pH; (f) Degradation of CR in different conditions. The error bars represent the standard deviation (n = 3).
Molecules 27 08642 g008
Figure 9. Effect of radical scavengers on the removal of CR in the CMO-8/PDS system (conditions: 100 mg·L−1 CR, 1 g·L−1 catalyst, 0.5 mM PMS and pH of 7). The error bars represent the standard deviation (n = 3).
Molecules 27 08642 g009
Figure 10. ESR analysis for the CMO-8/PDS system in aqueous dispersion by spin trapping with DMPO (a) SO4·, OH·; (b) ·O2; (c) TEMP-1O2; (d) TEMPO-h+ at different time intervals.
Molecules 27 08642 g010
Figure 11. Photo-Fenton mechanism of CoMoO4/PDS system.
Molecules 27 08642 g011
Figure 12. (a) Cyclic degradation performance, the error bars represent the standard deviation (n = 3); (b) the XRD of reused CMO-8 and after reuse CMO-8; the ratio of Co2+, Co3+, Olatt, Ovac (c,d).
Molecules 27 08642 g012
Figure 13. (a) MS spectra of Congo red dye solution after treatment with catalyst; (b) Product formation from the degradation of CR dye.
Molecules 27 08642 g013
Table 1. Photocatalytic performance of the prepared CoMoO4 in comparison with literature.
PhotocatalystLight SourceDye (mg/L)Degradation (%)Time (min)Ref
CoMoO4@CMSUV-visSDM 30 mg/L9810 min[29]
CoMoO4-Co3O4UV-visDBT 2000 ppm100180 min[31]
CoMoO4UV-vis4-CP 50 mg/L88275 min[32]
CoMoO4UV-visMB 100 mg/L10040 min[33]
CuNi/CoMoO4UV-visAF 15 mg/L99.4540 min[34]
CoMoO4UV-visCR 100 mg96.97535 minThis work
Publisher’s Note: MDPI stays neutral with regard to jurisdictional claims in published maps and institutional affiliations.

