Article

Integrated Hydrogeological, Hydrochemical, and Isotopic Assessment of Seawater Intrusion into Coastal Aquifers in Al-Qatif Area, Eastern Saudi Arabia

1
Interdisciplinary Research Center for Membranes and Water Security, King Fahd University of Petroleum and Minerals, Dhahran 31261, Saudi Arabia
2
Geosciences Department, College of Petroleum Engineering & Geosciences, King Fahd University of Petroleum & Minerals (KFUPM), Dhahran 31261, Saudi Arabia
3
Saudi Irrigation Organization, Al-Qatif 31982, Saudi Arabia
4
Department of Analytical Chemistry, Faculty of Pharmacy, Near East University, TRNC, Mersin 10, Nicosia 99138, Turkey
5
Operational Research Centre in Healthcare, Near East University, Nicosia 99138, Turkey
6
Department of Chemical Engineering, King Fahd University of Petroleum and Minerals, Dhahran 31261, Saudi Arabia
*
Authors to whom correspondence should be addressed.
Molecules 2022, 27(20), 6841; https://doi.org/10.3390/molecules27206841
Submission received: 1 September 2022 / Revised: 4 October 2022 / Accepted: 5 October 2022 / Published: 12 October 2022
(This article belongs to the Special Issue Chemometrics in Analytical Chemistry)

Abstract

:
Seawater intrusion (SWI) is the main threat to fresh groundwater (GW) resources in coastal regions worldwide. Early identification and delineation of such threats can help decision-makers plan for suitable management measures to protect water resources for coastal communities. This study assesses seawater intrusion (SWI) and GW salinization of the shallow and deep coastal aquifers in the Al-Qatif area, in the eastern region of Saudi Arabia. Field hydrogeological and hydrochemical investigations coupled with laboratory-based hydrochemical and isotopic analyses (18O and 2H) were used in this integrated study. Hydrochemical facies diagrams, ionic ratio diagrams, and spatial distribution maps of GW physical and chemical parameters (EC, TDS, Cl, Br), and seawater fraction (fsw) were generated to depict the lateral extent of SWI. Hydrochemical facies diagrams were mainly used for GW salinization source identification. The results show that the shallow GW is of brackish and saline types with EC, TDS, Cl, Br concentration, and an increasing fsw trend seaward, indicating more influence of SWI on shallow GW wells located close to the shoreline. On the contrary, deep GW shows low fsw and EC, TDS, Cl, and Br, indicating less influence of SWI on GW chemistry. Moreover, the shallow GW is enriched in 18O and 2H isotopes compared with the deep GW, which reveals mixing with recent water. In conclusion, the reduction in GW abstraction in the central part of the study area raised the average GW level by three meters. Therefore, to protect the deep GW from SWI and salinity pollution, it is recommended to implement such management practices in the entire region. In addition, continuous monitoring of deep GW is recommended to provide decision-makers with sufficient data to plan for the protection of coastal freshwater resources.

1. Introduction

Groundwater (GW) is a valuable water resource for living organisms in nature, accounting for 99% of the world’s liquid freshwater resources [1]. It is critical to both our survival on the planet and the economic growth of countries. However, in the present era, the degradation of GW quality is a considerable concern [2], particularly in coastal regions, where elevated GW salinity degrades water quality for all users (domestic, industry, and agriculture). Seawater intrusion (SWI), inappropriate sewage treatment, disposal of waste, and agricultural and industrial activities are the primary causes of GW salinization in coastal regions [3,4,5,6]. Therefore, salinizing fresh GW resources is a challenging and critical problem for coastal region environments and socioeconomic conditions worldwide.
It is worth mentioning that GW salinization is the most severe threat to GW resources in coastal areas, reducing the availability and suitability of water for domestic and even agricultural use. The threat of GW salinization has been reported in over 501 coastal cities worldwide [7], as a result of seawater intrusion [8,9,10] and/or anthropogenic activities [11,12,13]. The overexploitation of coastal aquifers to meet the increased water demand for all sectors (domestic, agriculture, and industry) is the main cause of GW salinization. Increased water demand is also driven by rapid population growth, urbanization, industrialization, and agricultural development. As such, seawater infiltrates into coastal aquifers, increasing GW salinity to a level at which water becomes brackish and saline. Hence, it is not suitable for human use [14,15,16,17,18]. Many researchers report that the salinization of GW resources in coastal aquifers is caused by natural processes such as mineral weathering, evaporation, ion exchange, and seawater intrusion [5,13,19,20,21]. However, other studies show that the salinization of GW is caused by anthropogenic activities such as agricultural, industrial, domestic, and urban development [14,22]. Huang et al. [14] reported the influence of SWI on the salinization of GW in south China along with other natural and anthropogenic processes. Kloppmann et al. [15] analyzed the GW salinization of French aquifers, and they found that SWI is the main process that controls the GW salinity in coastal regions. Ahmed et al. [18] investigated the salinization of GW in a volcano-sedimentary aquifer in Djibouti’s coastal region, Africa, and discovered that SWI and other geogenic processes are the primary sources of GW salinity.
Saudi Arabia has two coastlines, the western Red Sea and the eastern Arabian Gulf, as well as some islands. Scholars have assessed seawater intrusion, GW salinization, and pollution sources in some parts of the western coastal region of the country (Red Sea coast) [8,23,24,25,26]. The eastern coastal region, however, has yet to be covered. Therefore, the current study aims to evaluate seawater intrusion, GW salinization, and salinity sources in shallow and deep coastal aquifers in the Al-Qatif area, eastern Saudi Arabia. To better assess seawater intrusion and GW salinization in the study area, we used an integrated hydrogeochemical, hydrogeological, and isotopic approach.

2. Study Area

The area of this study is located along the western coastline of the Arabian Gulf in Saudi Arabia’s Eastern Province, within the administrative boundaries of the Al-Qatif governorate (Figure 1). Al-Qatif is a coastal city and oasis with a population of around 524,000 people, and it is bordered to the south by Dammam city and to the north by Al-Jubail. It is characterized by a flat coastal plain with surface elevations increasing westward to a summit of around 12 m. Al-Qatif city is made up of urban and cropland areas; however, in recent years, urban development has significantly replaced croplands. The water in Al Qatif city for irrigation purposes is mainly extracted from shallow and deep aquifers, with more extraction from the deep aquifers due to salinization of the shallow ones [27]. More than 70 hand-dug wells and 1200 artesian wells supply water for the agriculture area [27]. Shallow and deep aquifers have maximum depths of up to 12 m and 130 m below the ground surface, respectively. The shallow aquifers’ water levels range from less than a meter to 2 m and for the deep aquifers the depth of water ranges from 3 to 11 m.

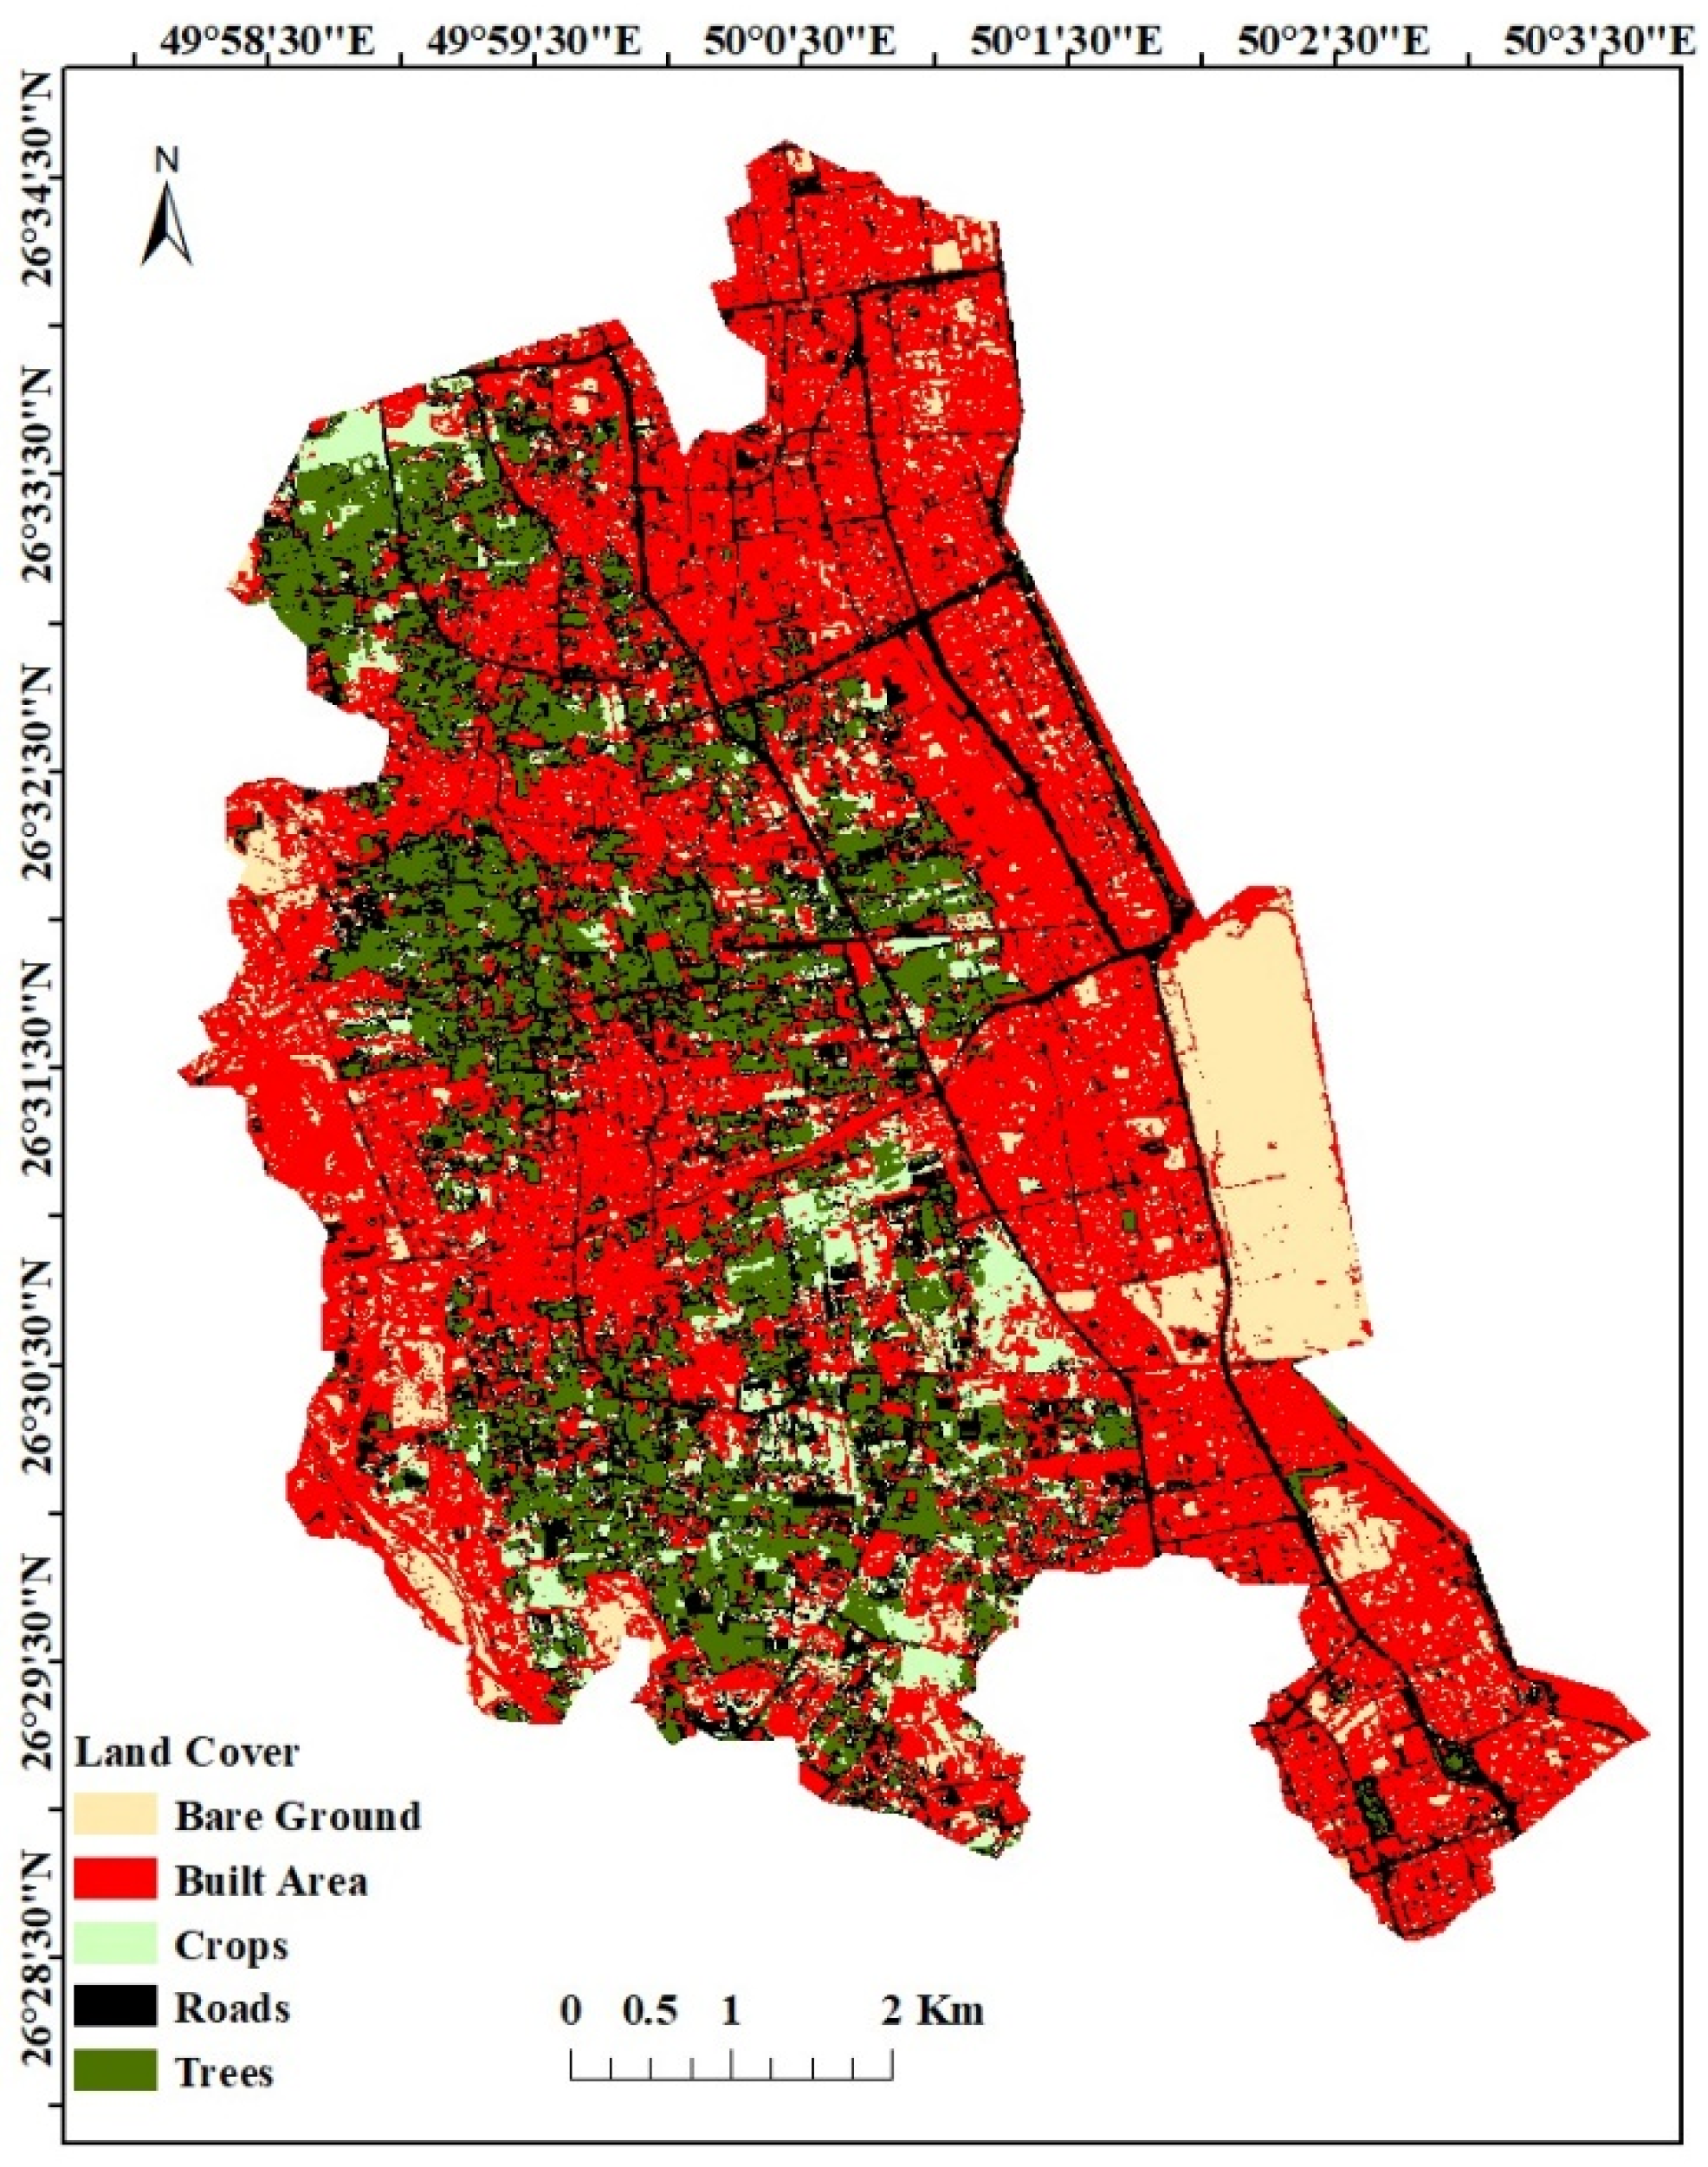
3. Climate and Land Use

Land use/cover of the Al-Qatif area was evaluated based on a Sentinel image with a 10 m resolution, which was then compared with information from site investigations and aerial photographs. The residential area covers 48.7% of the watershed and is mainly concentrated in the coastal zone. Road’s cover 20.2% of the watershed, while trees and crops cover 14.7% and 6.9%, respectively. Bare land covers 9.4% of the watershed (Figure 2). Figure 3 depicts the monthly average precipitation from 2001 to 2021, estimated by the IMERG final data with 30 min temporal and 0.1° spatial resolutions. This indicates that Al Qatif received 3.42 mm/month in 2001, the lowest amount during this period, and 18.28 mm/month in 2011 [28].

4. Geological and Hydrogeological Setting

The surface geology of the study area is composed of seven formations, as illustrated in Figure 4. The Dammam Formation is mainly marl, limestone, and dolomitic limestone. The Alat Member of the Dammam Formation forms the upper part and is composed of dolomitic limestone. The Al-Khobar Member of the Dammam Formation is mainly karstified fractured limestone and forms the Al-Khobar aquifer. The other three members of the Dammam Formation are marl and shale and form an aquitard [29]. The Hadrukh Formation consists mainly of interbedded sandstone and shale layers. The Dam Formation is mainly interbedded limestone, marine marl, and clay. Eolian deposits cover most of the surface geology of Al-Qatif, Dammam, and Al-Khobar cities. Interdune sabkha deposits are exposed north and northwest of Al-Qatif city (study area).
The principal aquifers in the study area are termed the Neogene, Alat, and Al-Khobar aquifers. The Neogene aquifer is shallow, with a maximum depth of 12 m [27] (Figure 5). The Alat and Al-Khobar aquifers, which are part of the Dammam Formation, form the principal aquifers in Al-Qatif and other coastal cities in the studied region. The Alat aquifer, as reported by [30], is present within the uppermost part of the Alat Member of the Dammam Formation, and its lithology is mainly porous dolomitic limestone with an average thickness of 25 m in the coastal area. The Alat aquifer has a maximum depth of 40 m below ground surface and is mainly utilized in the northern part of the Al-Qatif oasis [27]. The Alat aquifer displays a varied range of hydraulic properties, with transmissivity ranging from 2.6 × 10⁻⁵ m2/s to 5.1 × 10⁻³ m2/s [28]. On the other side, the Al-Khobar aquifer is a karstified and fractured limestone aquifer, with an average depth of 130 m, and a thickness of up to 80 m. It provides good quality water for the irrigated areas in the Al-Qatif and Al-Hassa regions. The Al-Khobar aquifer displays a higher transmissivity than the Alat aquifer, with values ranging from 0.9 × 10⁻² m2/s to 0.29 m2/s [31].
In the study area, the shallow aquifer is the Neogene aquifer, and the deep aquifers are the Alat and Al-Khobar aquifers. Potentiometric maps of GW levels were established for the shallow and deep aquifers, as shown in Figure 6. Figure 6a illustrates the shallow aquifer’s water level, with the water level decreasing to the east, northeast, and southeast toward the Arabian Gulf. The deep aquifer’s water level also decreases toward the Arabian Gulf with upconing of GW levels in the middle of the study area, as shown in Figure 6b. The raising of the water level is due to the reduction of GW pumping from the deep aquifer in the middle part of Al-Qatif as it is replaced by treated wastewater for irrigation.

5. Methodology

Thirty-six groundwater samples were collected from the shallow and deep aquifers in the coastal area of the Arabian Gulf coast of Saudi Arabia. Moreover, a seawater sample from the Arabian Gulf was collected as a reference sample. Water sampling was carried out per US Environmental Protection Agency guidelines [32]. Parameter preservation and holding time criteria outlined by the American Public Health Association were considered [33]. The water depth ranges from 0.5 to 1.6 m and 2.1 to 9.93 m in the shallow and deep aquifers, respectively. The water samples were taken from wells with submersible pumps after being pumped for 15 min to remove the stagnant water.
Measurements of static water levels of both shallow and deep aquifers were conducted in the field using a portable water level meter and corrected to mean sea level. Furthermore, GW physicochemical parameters (pH), electrical conductivity (EC), turbidity, dissolved oxygen (DO), temperature, and atmospheric pressure were measured on site using a portable Hanna GPS Multiparameter Meter (HI9829). All GW and seawater samples were filtered with 0.45 μm membrane filters before being analyzed for hydrochemical composition in the laboratory. Two 500 mL polyethylene bottles were collected for major cation and anion analysis, total dissolved solids (TDS) and bicarbonate measurement, and stable isotope analysis. Water samples were sealed and maintained at 4 °C until they were analyzed in laboratories. On the same day, all water samples were delivered to the King Fahd University of Petroleum and Minerals (KFUPM) environmental laboratory. Major cations and anions were analyzed using high-performance ion chromatography (IC). Bicarbonate and TDS were determined using acid titration and gravimetric analyses (TDS). The ionic charge balance for all water samples was cross-checked as follows [34]:
c h a r g e   b a l a n c e ( % ) = m e q   C a t i o n s     m e q   A n i o n s m e q   C a t i o n s + m e q   A n i o n s
The charge balance ranges from 0.3% to 5%, with an average value of 3.5%. The charge balance for all GW samples was less than the 10% accepted criteria. Blank, duplicate, and blind water samples were analyzed along with GW samples for quality controls. Stable isotopes (18O and 2H) were sampled and analyzed according to Clark’s protocol [35].
Stable oxygen and hydrogen isotopes of water were analyzed at the College of Petroleum Engineering and Geosciences Stable Isotope Laboratory at KFUPM. Sample injections of 1.0 µL were analyzed by cavity ring-down spectroscopy on a Picarro L-2130i water isotope analyzer. Isotope results for d 18O and d 2H (d D) are reported as a per mille difference (%) relative to the Vienna Standard Mean Ocean Water (VSMOW) international reference standard, with instrument calibration based on SMOW, SLAP, and NBS water reference materials. Each sample and laboratory working standard was injected six times, with the reported value being an average of the fifth and sixth injections, in order to account for known instrumental memory effects. Analytical precision based on replicates of the lab working standard and two blind sample duplicates was ±0.02% for oxygen and ±0.21% for hydrogen.

6. Results and Discussion

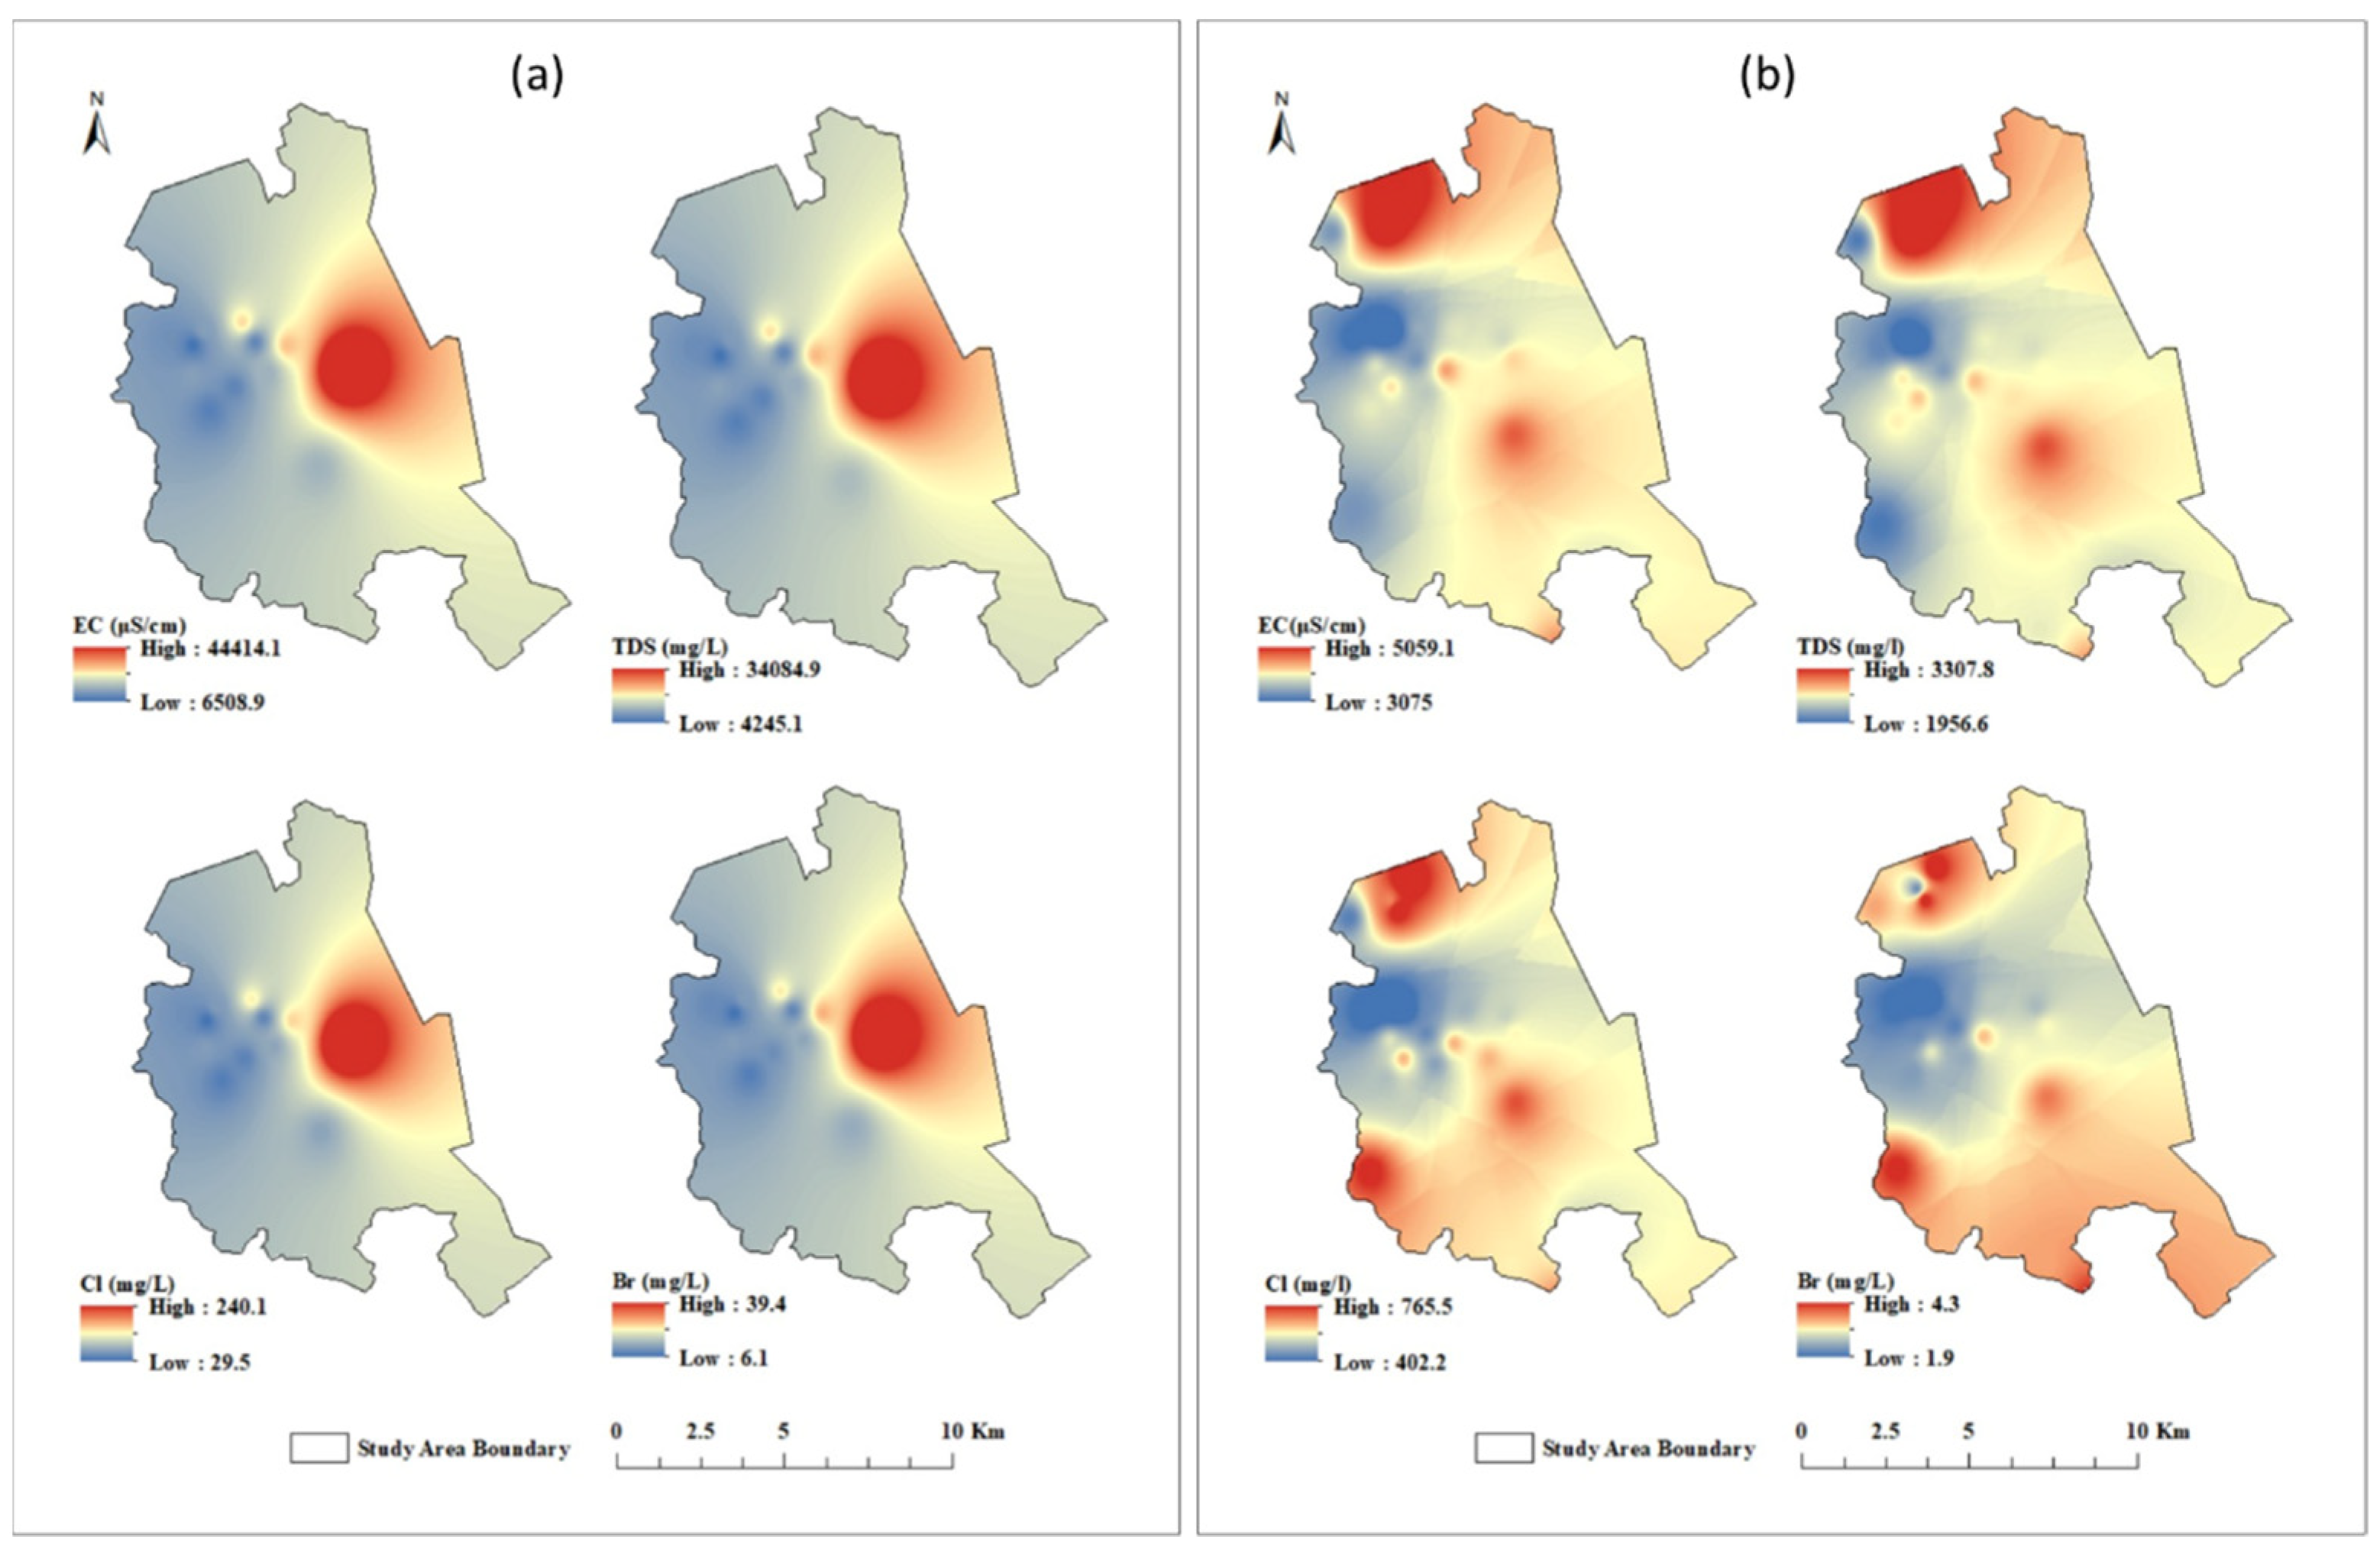
6.1. Hydrogeochemical Characteristics of Groundwater

The descriptive statistics of the hydrochemical parameters of the analyzed GW samples are reported in Table 1. The pH values vary from 6.5 to 7.7 and 6.8 to 8.0, with an average of 6.8 and 7.2 for shallow and deep GW, respectively. A slightly acidic pH of the shallow GW might be due to anthropogenic activities [36]. The electrical conductivity (EC) ranges from 6475.7 µS/cm to 44,420.5 µS/cm and 3072.5 µS/cm to 5060.3 µS/cm with an average of 13,936.0 µS/cm and 3993.3 µS/cm for the shallow and deep GW, respectively. The total dissolved solids (TDS) vary from 4220.1 mg/L to 34,090.0 mg/L with an average of 10,108.5 mg/L for shallow GW and from 1955.0 mg/L to 3308.7 mg/L with an average of 2544.7 mg/L for deep GW. The highest values of EC and TDS were observed in shallow GW, with increasing levels towards the Arabian Gulf, indicating seawater intrusion as the source for GW salinization [37,38].
In terms of the major ion chemistry of the GW from both aquifers, Cl, Na+, SO42, Ca2+, HCO3, and Mg2+ were the most abundant ions and the most significant contributors to the TDS. Additionally, K+ and NO3 had an insignificant effect on the TDS. As presented in Table 1, the concentrations of Cl, Na+, SO42−, and Mg2+ in the shallow GW samples are higher than in the deep GW. This indicates more incursion of seawater into the shallow GW aquifer than the deeper one [39]. For cations, Na+ dominated the cation chemistry of the analyzed GW, followed by Ca2+ and Mg2+. The order of cation abundance in the tested GW samples was Na+ > Ca2+ >Mg2+ > K+ for both aquifers. On the other hand, the abundance of anions in the groundwater of the study area followed the pattern of Cl > SO42 > HCO3 > NO3 > Br. Of course, Cl ion predominated in the study area for both aquifers.
The spatial distribution pattern of the main hydrochemical parameters (EC, TDS, Cl, and Br) was used by researchers to assess the impact of SWI on GW salinization in coastal regions [40]. In general, the EC and TDS are a measure of salinity, while Cl and Br are conservative ions and are used by researchers to quantify the seawater contribution to GW resources [40,41,42]. Therefore, correlating the spatial pattern of EC, TDS, Cl, and Br helped define the source of elevated salinity of the analyzed GW in the current study. As shown in Figure 7a, the EC, TDS, Cl and Br of shallow GW exhibit the same general westward decrease from the Arabian Gulf coast. This reveals that SWI significantly impacts GW salinization of the shallow aquifer.
On the other hand, as shown in Figure 7b, the EC, TDS, Cl and Br of the deep GW show a general northwest decrease from the Arabian Gulf. However, in the northern part of the study area, the deep GW display southwest decreases from sabkha brine in the north. Thus, variation in salinity and ion concentration of deep GW may reflect the impact of the geology, topography, and hydraulic properties. In general, transporting salinity contaminants to the shallow aquifer followed an east–west direction from the Arabian Gulf westward to the inland region. However, the saline water in the deep aquifer had a southwest pathway from the Arabian Gulf, and a southeast pathway from the sabkha brine.

6.2. Hydrogeochemical Facies and Water Type

Piper (1944) [43] proposed a diagram illustrating water-dominant hydrochemical facies. After that, Piper diagrams have been used to define the main hydrochemical facies of GW for SWI assessment studies (e.g., [5,44,45]). A Piper diagram for the tested GW samples and seawater reference sample was established, as shown in Figure 8. The Piper diagram of Figure 8 shows that the GW from both the shallow and deep aquifers in the Al-Qatif area is mainly of Na-Cl type followed by Ca-Mg-Cl type. GW samples mostly plot within the Na-Cl domain in the diamond part of the Piper plot, revealing an interaction between GW and seawater in both aquifers. Some GW samples plotted close to the reference seawater sample reflect a high rate of SWI in the study area.

6.3. Seawater Intrusion Indicators

6.3.1. Gibbs Diagram

Gibbs (1970) [46] proposed a diagram, named the Gibbs diagram, which illustrates the relationship between TDS vs. Na+/(Na+ + Ca2+) and Cl/(Cl + HCO3) in order to identify the processes that control GW chemistry, including precipitation, evaporation, rock–water interaction, and seawater intrusion. Scholars have adopted the Gibbs diagram to define the states of mixing of GW with seawater in coastal aquifers (e.g., [47]). The GW samples from shallow and deep coastal aquifers in the study area and seawater reference sample from the Arabian Gulf were plotted in the Gibbs diagram, as shown in Figure 9. All GW samples from both aquifers plotted in the evaporation domain with more extent toward the seawater reference sample, indicating an interaction between GW and seawater. Moreover, GW samples from a shallow aquifer located closer to the seawater reference sample reveal more influence of seawater on the shallow GW aquifer than the deep aquifer.

6.3.2. Hydrochemical Facies Evolution (HFE) Diagram

Giménez-Forcada (2010) [48] proposed the Hydrochemical Facies Evolution Diagram (HFE-D) model to identify intrusion and freshening phases of coastal aquifers. SWI is identified by the anion and cation percentage distribution in the square diagram. Subsequently, the HFE-D model has been utilized in several studies to identify the SWI phase in coastal aquifers worldwide (e.g., [47,49]). We used the Excel macro published by [50] to establish the HFE-D model for the tested GW samples from both aquifers in the study area, as shown in Figure 10. Note that all GW samples plot below the freshwater–seawater line within the intrusion domain with Mixed-Na-Cl and Na-Cl facies. A total of 80% of shallow and deep GW samples show Na-Cl facies, and 20% Mixed-Na-Cl. The HFE-D diagram illustrates that both shallow and deep aquifers in the study area are, to some extent, contaminated with seawater intrusion of different magnitudes. The distance from the sea, topographic variation, and hydrogeological characteristics of the aquifers, among other factors, influence the degree of aquifer contamination by SWI.

6.3.3. Chadha’s Diagram

Chadha (1999) [51] proposed a diagram illustrating the difference between alkaline earth (Ca2+ + Mg2+) and alkali metals (Na+ + K+) vs. the difference between weak acidic anions (CO3 + HCO3) and strong acidic anions (Cl + SO4). The diagram has been applied in the literature to identify hydrochemical processes that control the GW chemistry in coastal aquifers, as an approach to identify SWI and GW salinization (e.g., [52,53,54]). Figure 11 shows the Chadha diagram of the tested GW samples from both aquifers. About 70% of the shallow GW samples and 100% of the deep GW samples are located within the left bottom quadrangle with the saline water type, indicating seawater intrusion as the main hydrochemical process controlling the GW salinization in the studied coastal region. On the contrary, 30% of the studied GW samples from the shallow aquifer were located in the right bottom quadrangle of the diagram, showing more mixed Ca and Mg-Cl types of water, revealing a reverse ion exchange process.

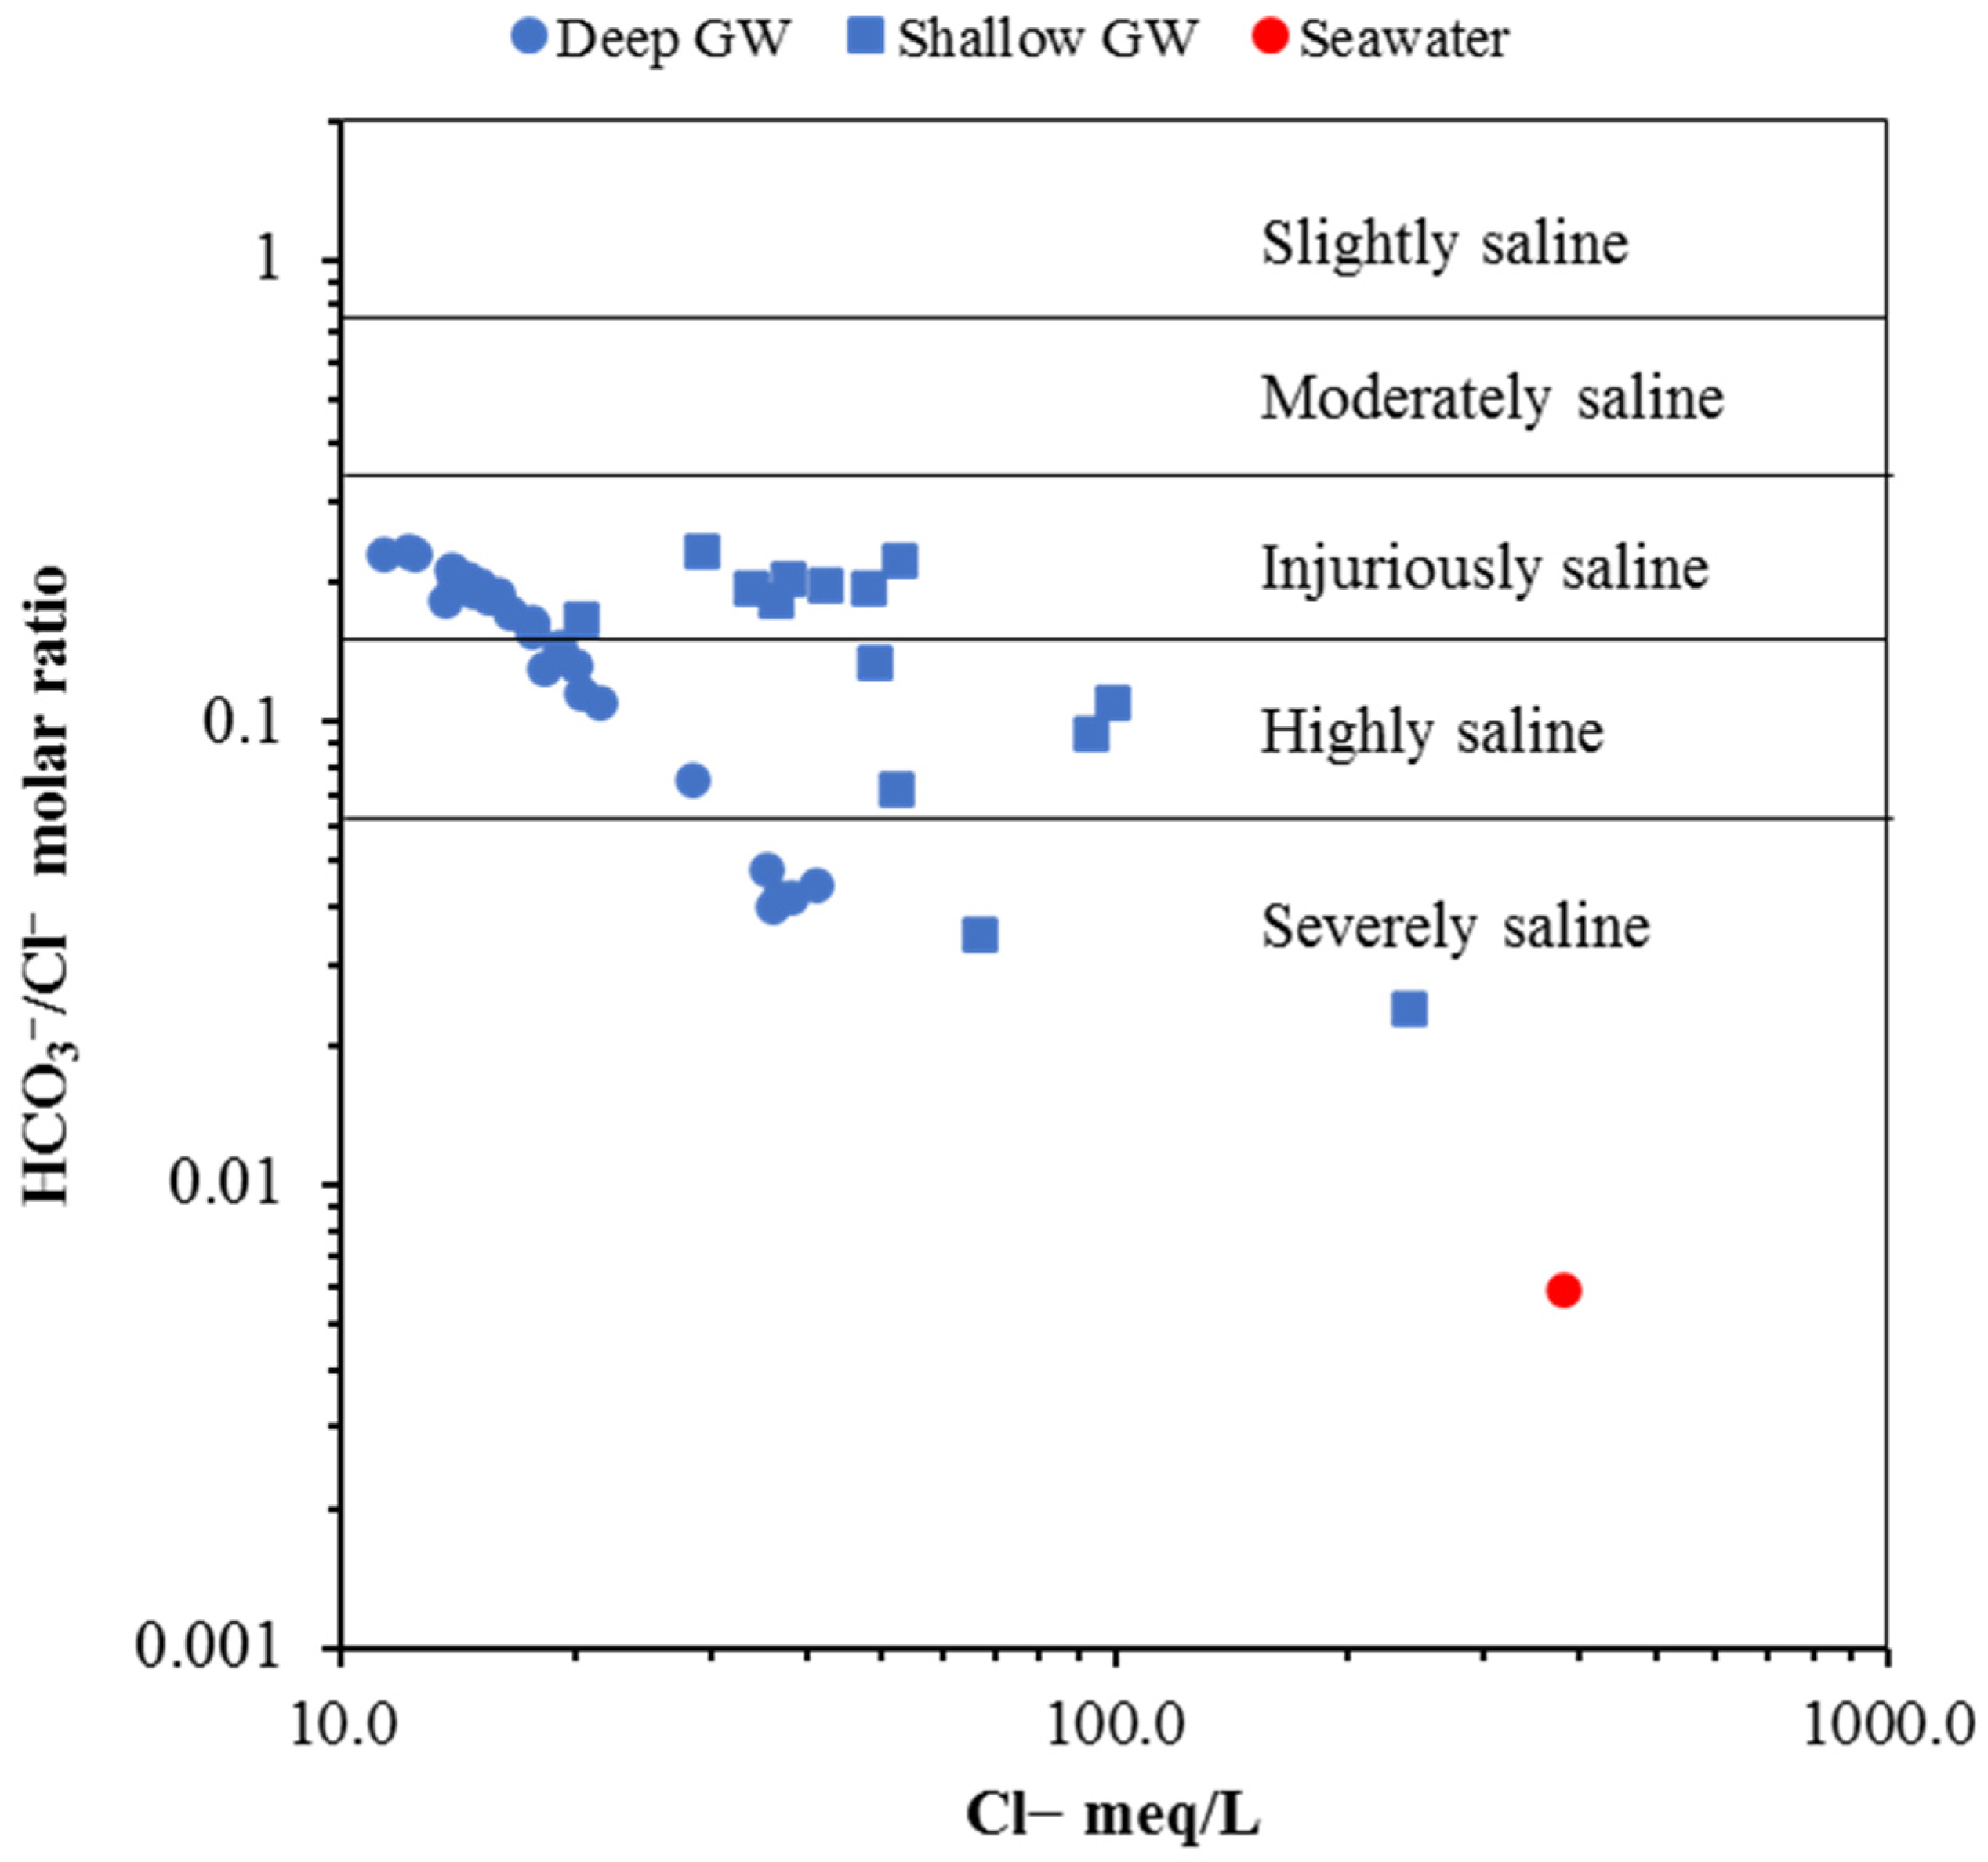
6.3.4. Inverse of Simpson’s Ratio

The influence of saline water on GW in the coastal aquifer in the study area was evaluated by applying the inverse Simpson’s ratio [55,56]. This ratio classifies GW into six classes: severely saline, highly saline, injuriously saline, moderately saline, slightly saline, and freshwater. Molar ratio of HCO3/Cl with a value higher than 2 reveals freshwater recharge, while the degree of salinization is reflected by a ratio of less than 2 [57,58,59]. As shown in Figure 12, the GW samples from shallow and deep aquifers fall into severely saline, highly saline, and injuriously saline classes. Totals of 14%, 28%, and 58% of shallow GW samples plotted within the severely saline, highly saline, and injuriously saline classes, respectively. GW samples from deep aquifers fall into severe, high, and injuriously saline classes with 15%, 20%, and 65%, respectively. The results, as shown in Figure 12, clearly show that the GW of both aquifers has been influenced by seawater, with higher salinization on shallow GW and wells located close to the shoreline.

6.3.5. Ionic Ratio Diagram

Na+/Cl vs. Cl

To determine the source of salinity in GW, the correlation between Na+/Cl and Cl plays an indispensable role [59,60]. We applied a Na+/Cl molar ratio vs. Cl ion (meq/L) diagram to evaluate the sources of dissolved ions in the tested GW samples, as shown Figure 13a. The ratio of Na+/Cl equal to unity indicates halite minerals as the source for Na+ and Cl ions in water, while the deviated values reflect other sources such as SWI and the ion exchange process [58]. As illustrated in Figure 13a, GW samples from both aquifers plot below the Na+/Cl unity line, indicating the impact of reverse ion exchange processes on the GW. Therefore, the results suggest that SWI is the primary process controlling GW chemistry in both aquifers. The result of this study is in line with other results [58,59].

Mg2+/Ca2+ vs. Cl

Generally, magnesium is more dominant in seawater, while calcium is abundant in freshwater. The Mg2+/Ca2+ ratio is a crucial chemical indicator for seawater intrusion [61]. The ratio of Mg2+/Ca2+ in groundwater is less than one, whereas it is more than one in seawater. GW samples from the study area plot mainly below the unity line, except for one sample from the shallow GW aquifer above the line, as shown in Figure 13b. Shallow GW samples located below the unity line have Mg2+/Ca2+ ratios ranging from 0.6 to 0.98; however, deep GW samples display a narrow range from 0.6–0.7, indicating a greater influence of seawater intrusion on the shallow aquifer. None of the GW samples plot below 0.5 ratio of Mg2+/Ca2+, which not surprisingly reveals negligible weathering of silicate minerals in the studied aquifers.

Ca2+/HCO3 vs. Cl

The relationship between Ca2+/HCO3 vs. Cl has been used to evaluate the impact of carbonate mineral dissolution on GW chemistry in coastal aquifers [58,59]. As shown in Figure 13c, GW samples from both aquifers plot above the calcite dissolution line, indicating excess of Ca2+, and this is mainly related to reverse ion exchange via seawater intrusion. The Ca2+/HCO3 ratio of GW samples from both aquifers ranges from 2–11, with some samples close to the seawater reference sample.

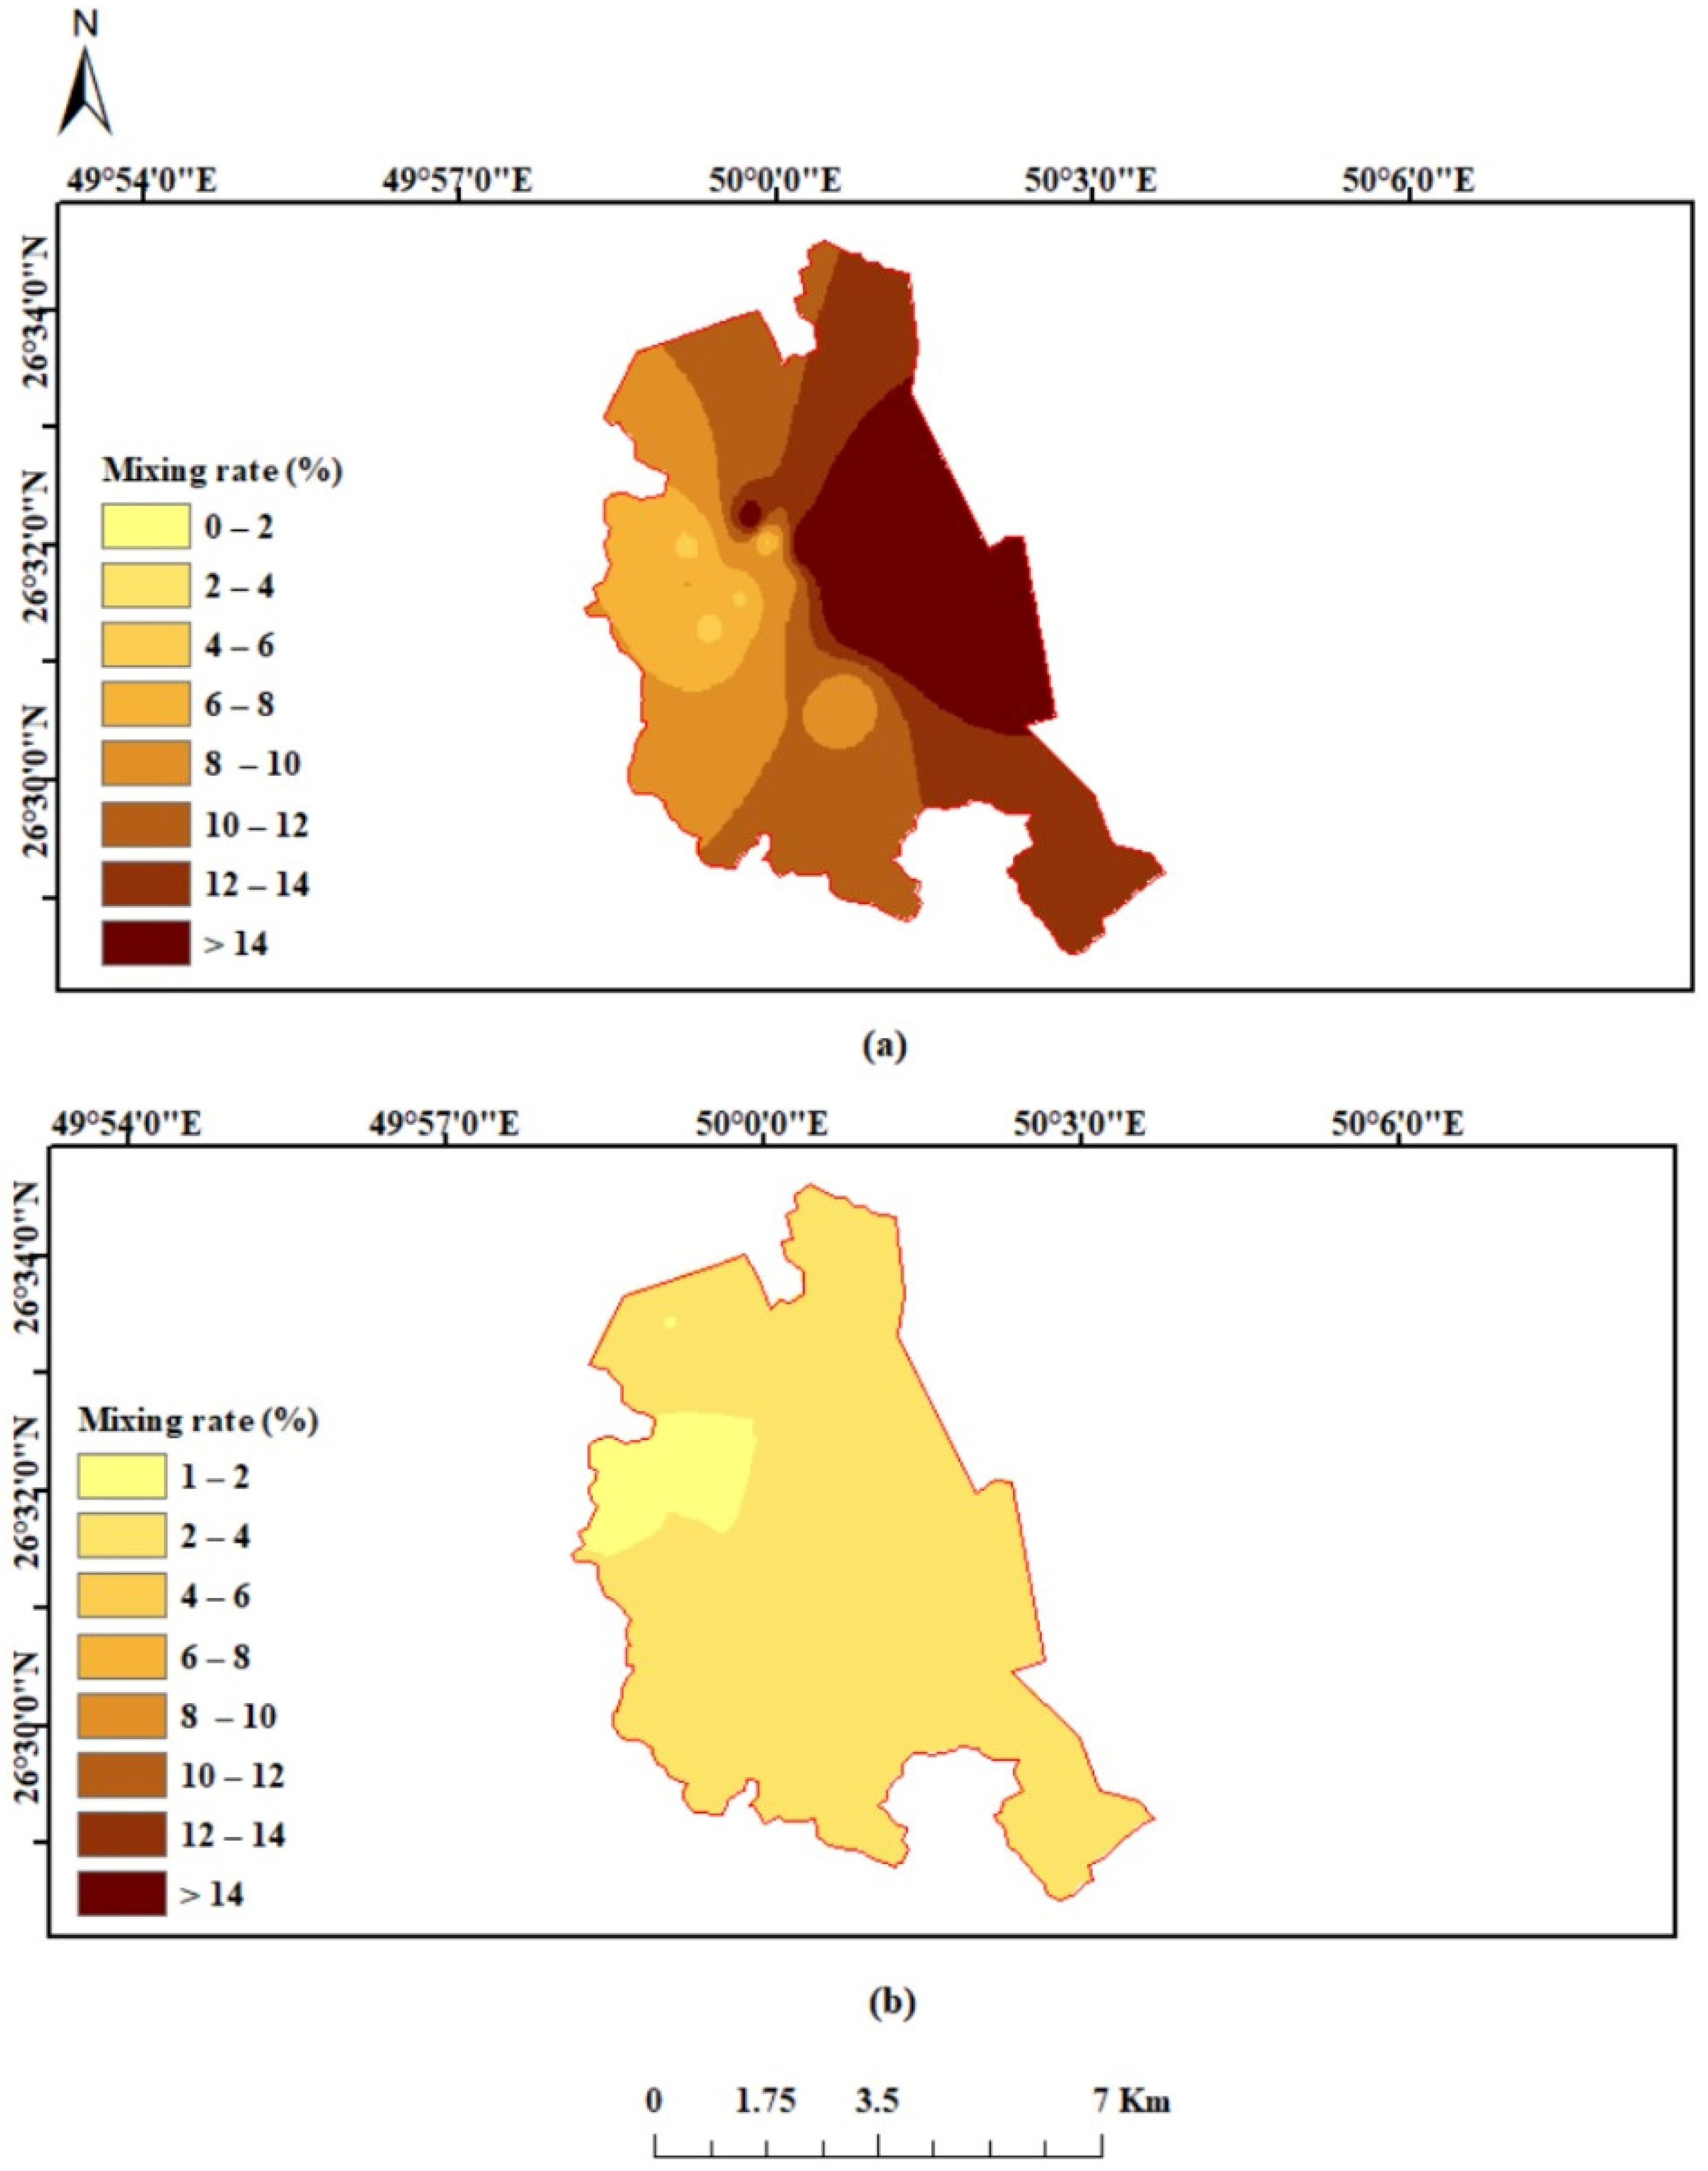
6.4. Quantification of Seawater Intrusion

For seawater intrusion quantification, we adopted the model proposed by Appelo and Postma (2005) [41] for mixing calculations based on chloride concentration as a conservative ion. The contribution of seawater in tested GW samples was calculated as a fraction of seawater (fsw) for each sample and according to the Appelo and Postma (2005) [41] formula as follows:
f s w = C C l , s a m C C l , f C C l , s w C C l , f
where CCl,sam, CCl,sw, CCl,f refer to the concentration of chloride ions in GW samples, seawater, and freshwater, respectively. The fraction of seawater (fsw) of tested GW samples from shallow and deep aquifers in the study area is illustrated in Figure 14. The fractions of seawater for GW samples from the shallow aquifer range from 6.51% to 62.38%, with an average value of 16.69%. The deep GW samples have seawater fractions ranging from 1.73% to 4.45% and an average value of 3.02%. The highest value of mixing proportion of seawater was observed in a well tapped with the shallow aquifer that is present close to the shoreline of the Arabian Gulf (1.6 km from the sea). The lowest value of seawater fraction was observed in the shallow GW well located 4.3 km from the sea. In general, shallow GW in the study area displays a higher fraction of seawater than the deep GW, indicating a significant contribution of seawater to GW chemistry and salinity of shallow wells. The spatial distribution of fsw for both aquifers has been mapped, as shown in Figure 15. Higher values of fsw of shallow GW occurred along the coast, indicating the advancement of seawater into the shallow aquifer with an average width of around 3.5 km. On the contrary, most of the study area has a range of fsw for deep GW from 2–4%. Salinity contamination of the shallow GW in the study area is most likely triggered by the decline of the water table due to decades of overexploitation of shallow aquifers and persistently low precipitation in the region.

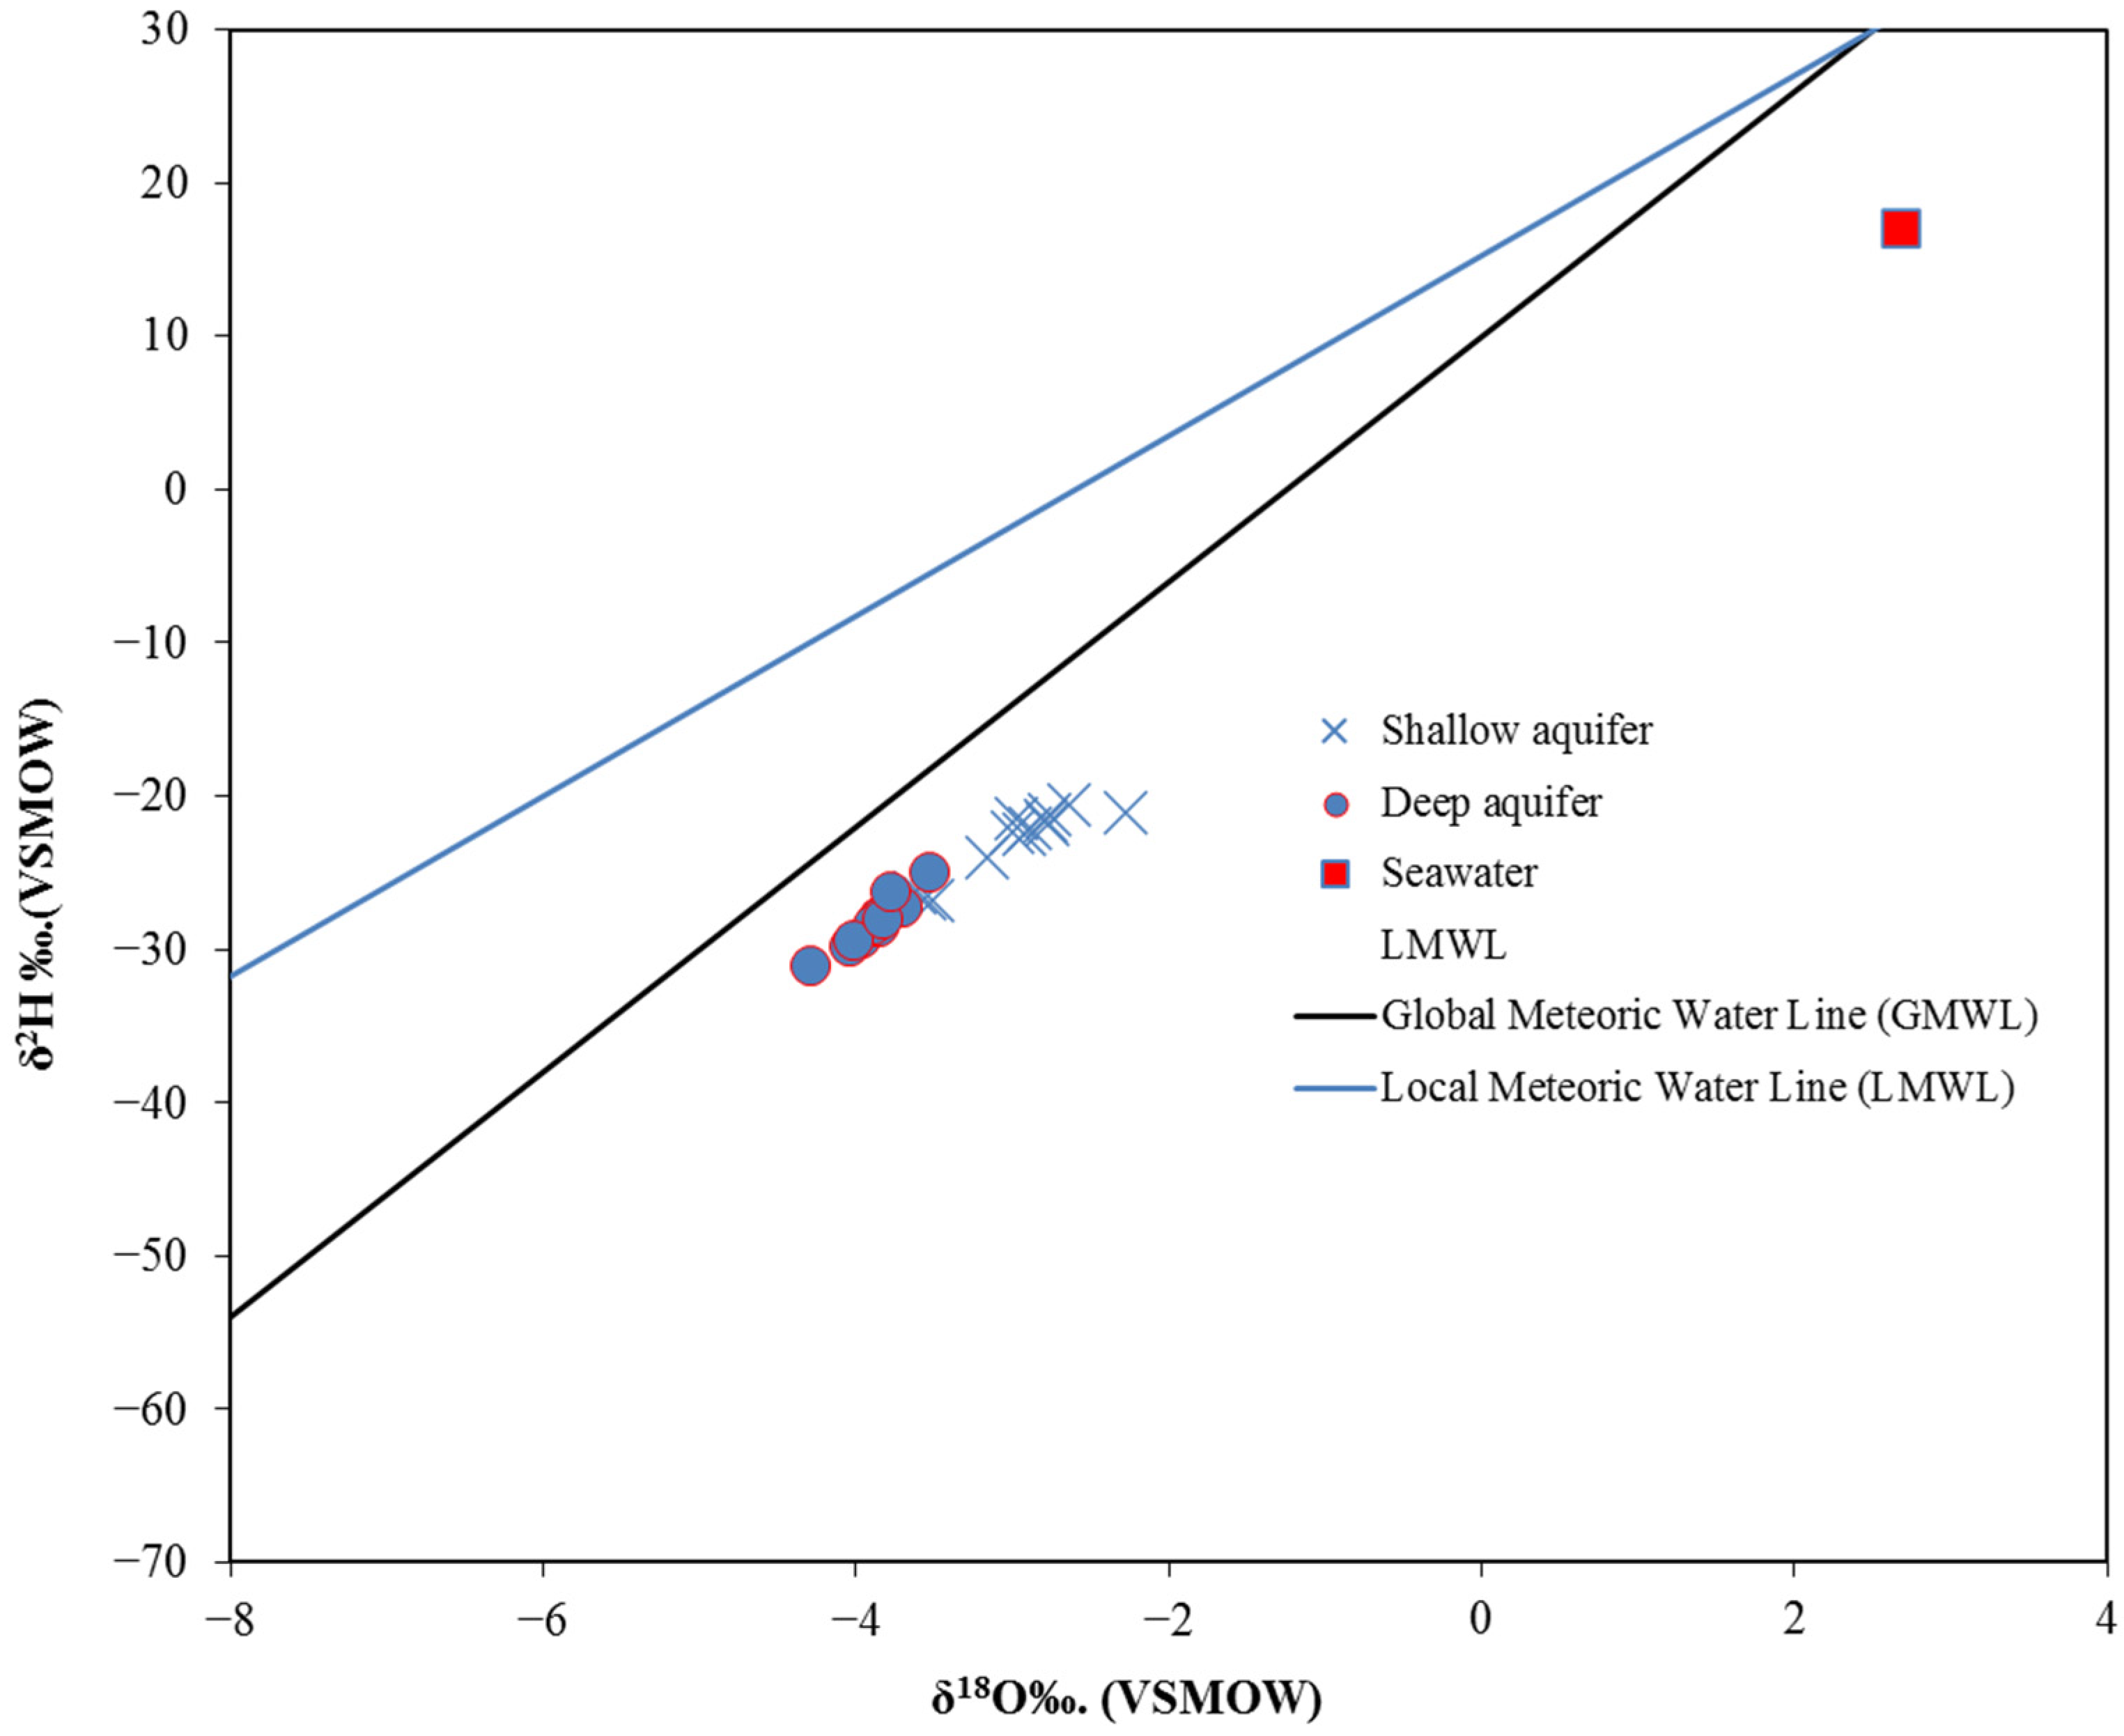
6.5. Isotopic Analyses

Oxygen and hydrogen stable isotopes have been used to identify GW salinization and the effect of seawater intrusion on coastal aquifers in many regions worldwide [5,62,63]. Generally, GW affected by SWI has higher values of δ18O and δ2H than fresh GW [64]. Twenty-nine GW samples were analyzed for the δ18O and δ2H. The results of the analyzed isotopes show that the δ18O and δ2H values of shallow GW varied from −3.6 to −2.3‰ and −26.8 to −20.58%, respectively (Table 1). The deep GW has δ18O and δ2H values ranging from −4.3 to −3.4% and from 31.7 to −25%, respectively. It has been found that the shallow GW has an isotope composition higher than the deep GW (i.e., more enriched in the heavy/rare isotope). The values of δ18O and δ2H were plotted and compared with local and global meteoric water lines, as shown in Figure 16. The local meteoric water line (LMWL, δ2H = 5.89* δ18O + 15.3, R2 = 0.94) was calculated from the precipitation isotope data obtained from the GNIP database [65] for the Jubail station, which is the closest station (~20 km) to the study area. As shown in Figure 16, the shallow GW samples were clustered toward the seawater sample, with higher values than deep GW samples, indicating more SWI and GW salinization influence on shallow wells. As expected for this arid region, seawater and GW samples plot as more enriched values relative to both the LMWL and GMWL, indicating an evaporative trajectory for seawater evolution and its mixing with the meteoric GW.
Oxygen isotope data were correlated with hydrochemical parameters, including salinity (TDS) and Cl concentration, to understand the impact of SWI on the isotope composition of GW in the study area. As illustrated in Figure 17, the δ18O had increased values associated with increasing TDS and Cl concentration for both shallow and deep GW. However, shallow GW samples show the higher δ18O values associated with a higher concentration of TDS and Cl, indicating more influence of seawater on the shallow aquifer in the study area. The result of the current study is in line with similar results found by [62].

6.6. Management of Seawater Intrusion

Generally, management responses to protect coastal aquifers from SWI can be of three types: conventional methods (e.g., pumping reduction and well construction restriction) [66,67], engineering methods (e.g., surface and subsurface structures) [68], and hydraulic barrier (e.g., managed aquifer recharge) [69,70]. Operational controls and hydraulic barriers are the most effective techniques for SWI management [71]. In the study area, pump reduction from the deep aquifer was partially applied in the central part of the Al-Qatif area, and the water supply for irrigation was satisfied by treated wastewater. The deep GW abstraction reduction notably raised the water level by an average of 3.5 m. However, in the northern and southern parts of Al-Qatif city, farmland is still irrigated through GW; thus, its effect on the water level in the central part is obviously observed, as shown in Figure 6b. Besides GW pumping reductions, expanding artificial land seaward for urbanization (land reclamation) along the shoreline is probably playing another role in protecting GW from SWI. Chen and Jiao (2007) [72] reported the efficiency of land reclamation in the coastal zone for protecting the GW in Shenzhen city, China. They noted chloride ion concentration reduction as an indicator for retardation of SWI. Such indirect control of SWI is recorded in the study area, with land reclamation in the coastal zone having an average width of one kilometer as shown in Figure 18.

7. Conclusions and Recommendations

In the current study, we utilized an integrated approach to assess seawater intrusion and GW salinization in shallow and deep aquifers in the study area. Hydrochemical facies diagrams, ionic ratio plots, isotope signatures, seawater fractions, and spatial analysis of the hydrochemical parameters were primarily applied as indicative tools to understand GW salinization and SWI. All GW samples from both aquifers displayed a variable degree of salinization. However, a higher degree of salinization was observed in the shallow aquifer, which made the water brackish and saline types and thus unsuitable for human and irrigation use. SWI was recognized as the primary source of the elevated salinity in both aquifers; however, the shallow aquifer is significantly impacted by SWI. Besides SWI, hydrochemical facies analyses also pinpointed reverse ion exchange as an essential hydrochemical process in both aquifers. The extent of SWI into the shallow aquifer is estimated to be around 3.5 km inland. This most probably happened due to the early exploitation of GW for crop irrigation that lasted for decades. On the other hand, the deep aquifer has less SWI and GW salinization than the shallow aquifer, with more impact on wells near the shoreline. Geology, aquifer hydraulic properties, fracture density, hydrological processes, and distance from the shoreline might be critical factors controlling SWI in both aquifers. Conducting studies and incorporating such factors is recommended to understand GW salinization in the deep aquifer.
The applied reduction of GW abstraction from the deep aquifer in the middle of the study area significantly stabilizes the water level. Such critical management practice is recommended to cover the whole area. Continuous monitoring of deep GW is also recommended for early identification of SWI and to provide decision-makers with real-time data to plan for a suitable management measure. For shallow aquifers, it is recommended to desalinate brackish water and recharge the aquifer with fresh water to a quality level beneficial for soil and the ecosystem.

Author Contributions

Conceptualization, M.B. and S.I.A.; methodology, S.I.A., M.B. and B.T.; validation, I.H.A., M.B. and S.I.A.; formal analysis. A.G.U., S.I.A. and J.D.H.; investigation, M.B., S.I.A., S.A.A., A.M.A.-A. and B.T.; resources, M.B., I.H.A., and J.D.H.; data curation, M.B., S.I.A., S.A.A. and I.H.A.; writing—original draft preparation, M.B., A.M.A.-A., S.I.A., J.D.H. and A.G.U.; writing—review and editing, B.T., I.H.A. and J.D.H.; visualization, A.G.U. and A.M.A.-A.; supervision, B.T., I.H.A. and J.D.H.; project administration, M.B. and S.I.A.; funding acquisition, M.B. and I.H.A. All authors have read and agreed to the published version of the manuscript.

Funding

This research was funded by the Deanship of Research Oversight and Coordination (DROC) at King Fahd University of Petroleum and Minerals (KFUPM) under the Interdisciplinary Research Center for Membranes and Water Security [Grant Number: INMW2202]. Article Processing Charges (APC) was provided by the Deanship of Research Oversight and Coordination (DROC).

Institutional Review Board Statement

Not applicable.

Informed Consent Statement

Not applicable.

Data Availability Statement

Data will be made available on request.

Acknowledgments

Authors would like to acknowledge all support provided by the Interdisciplinary Research Center for Membranes and Water Security, King Fahd University of Petroleum and Minerals. We also appreciate the assistance provided by the Saudi Irrigation Organization, Al-Qatif branch, for the field survey and sample collection.

Conflicts of Interest

The authors declare no conflict of interest.

References

  1. Famiglietti, J.S. The global groundwater crisis. Nat. Clim. Chang. 2014, 4, 945–948. [Google Scholar] [CrossRef] [Green Version]
  2. Daskalaki, P.; Voudouris, K. Groundwater quality of porous aquifers in Greece: A synoptic review. Environ. Geol. 2008, 54, 505–513. [Google Scholar] [CrossRef]
  3. Van Camp, M.; Mtoni, Y.; Mjemah, I.C.; Bakundukize, C.; Walraevens, K. Investigating seawater intrusion due to groundwater pumping with schematic model simulations: The example of the Dar es Salaam coastal aquifer in Tanzania. J. Afr. Earth Sci. 2014, 96, 71–78. [Google Scholar] [CrossRef]
  4. Singh, A. Managing the environmental problem of seawater intrusion in coastal aquifers through simulation-optimization modeling. Ecol. Indic. 2015, 48, 498–504. [Google Scholar] [CrossRef]
  5. Balasubramanian, M.; Sridhar, S.G.D.; Ayyamperumal, R.; Karuppannan, S.; Gopalakrishnan, G.; Chakraborty, M.; Huang, X. Isotopic signatures, hydrochemical and multivariate statistical analysis of seawater intrusion in the coastal aquifers of Chennai and Tiruvallur District, Tamil Nadu, India. Mar. Pollut. Bull. 2022, 174, 113232. [Google Scholar] [CrossRef]
  6. Benaafi, M.; Yassin, M.A.; Usman, A.G.; Abba, S.I. Neurocomputing Modelling of Hydrochemical and Physical Properties of Groundwater Coupled with Spatial Clustering, GIS, and Statistical Techniques. Sustainability 2022, 14, 2250. [Google Scholar] [CrossRef]
  7. Cao, T.; Han, D.; Song, X. Past, present, and future of global seawater intrusion research: A bibliometric analysis. J. Hydrol. 2021, 603, 126844. [Google Scholar] [CrossRef]
  8. Maurya, P.; Kumari, R.; Mukherjee, S. Hydrochemistry in integration with stable isotopes (δ18O and δD) to assess seawater intrusion in coastal aquifers of Kachchh district, Gujarat, India. J. Geochem. Explor. 2019, 196, 42–56. [Google Scholar] [CrossRef]
  9. Batayneh, A.; Zaman, H.; Zumlot, T.; Ghrefat, H.; Mogren, S.; Nazzal, Y.; Elawadi, E.; Qaisy, S.; Bahkaly, I.; Al-Taani, A. Hydrochemical facies and ionic ratios of the coastal groundwater aquifer of saudi gulf of aqaba: Implication for seawater intrusion. J. Coast. Res. 2014, 30, 75–87. [Google Scholar]
  10. De Filippis, G.; Foglia, L.; Giudici, M.; Mehl, S.; Margiotta, S.; Negri, S.L. Seawater intrusion in karstic, coastal aquifers: Current challenges and future scenarios in the Taranto area (southern Italy). Sci. Total Environ. 2016, 573, 1340–1351. [Google Scholar] [CrossRef] [PubMed]
  11. Al Naeem, M.F.A.; Yusoff, I.; Ng, T.F.; Maity, J.P.; Alias, Y.; May, R.; Alborsh, H. A study on the impact of anthropogenic and geogenic factors on groundwater salinization and seawater intrusion in Gaza coastal aquifer, Palestine: An integrated multi-techniques approach. J. Afr. Earth Sci. 2019, 156, 75–93. [Google Scholar] [CrossRef]
  12. Xu, X.; Xiong, G.; Chen, G.; Fu, T.; Yu, H.; Wu, J.; Liu, W.; Su, Q.; Wang, Y.; Liu, S. Characteristics of coastal aquifer contamination by seawater intrusion and anthropogenic activities in the coastal areas of the Bohai Sea, eastern China. J. Asian Earth Sci. 2021, 217, 104830. [Google Scholar] [CrossRef]
  13. Benaafi, M.; Al-Shaibani, A. Hydrochemical and Isotopic Investigation of the Groundwater from Wajid Aquifer in Wadi Al-Dawasir, Southern Saudi Arabia. Water 2021, 13, 1855. [Google Scholar] [CrossRef]
  14. Huang, G.; Sun, J.; Zhang, Y.; Chen, Z.; Liu, F. Impact of anthropogenic and natural processes on the evolution of groundwater chemistry in a rapidly urbanized coastal area, South China. Sci. Total Environ. 2013, 463, 209–221. [Google Scholar] [CrossRef] [PubMed]
  15. Kloppmann, W.; Bourhane, A.; Schomburgk, S. Groundwater salinization in France. Procedia Earth Planet. Sci. 2013, 7, 440–443. [Google Scholar] [CrossRef] [Green Version]
  16. Comte, J.-C.; Cassidy, R.; Obando, J.; Robins, N.; Ibrahim, K.; Melchioly, S.; Mjemah, I.; Shauri, H.; Bourhane, A.; Mohamed, I. Challenges in groundwater resource management in coastal aquifers of East Africa: Investigations and lessons learnt in the Comoros Islands, Kenya and Tanzania. J. Hydrol. Reg. Stud. 2016, 5, 179–199. [Google Scholar] [CrossRef]
  17. Ahmed, A.H.; Rayaleh, W.E.; Zghibi, A.; Ouddane, B. Assessment of chemical quality of groundwater in coastal volcano-sedimentary aquifer of Djibouti, Horn of Africa. J. Afr. Earth Sci. 2017, 131, 284–300. [Google Scholar] [CrossRef]
  18. Ziadi, A.; Hariga, N.T.; Tarhouni, J. Mineralization and pollution sources in the coastal aquifer of Lebna, Cap Bon, Tunisia. J. Afr. Earth Sci. 2019, 151, 391–402. [Google Scholar] [CrossRef]
  19. Rajmohan, N.; Al-Futaisi, A.; Al-Touqi, S. Geochemical process regulating groundwater quality in a coastal region with complex contamination sources: Barka, Sultanate of Oman. Environ. Earth Sci. 2009, 59, 385–398. [Google Scholar] [CrossRef]
  20. Abdalla, F. Ionic ratios as tracers to assess seawater intrusion and to identify salinity sources in Jazan coastal aquifer, Saudi Arabia. Arab. J. Geosci. 2016, 9, 1–12. [Google Scholar] [CrossRef]
  21. Nogueira, G.; Stigter, T.Y.; Zhou, Y.; Mussa, F.; Juizo, D. Understanding groundwater salinization mechanisms to secure freshwater resources in the water-scarce city of Maputo, Mozambique. Sci. Total Environ. 2019, 661, 723–736. [Google Scholar] [CrossRef]
  22. Frollini, E.; Parrone, D.; Ghergo, S.; Masciale, R.; Passarella, G.; Pennisi, M.; Salvadori, M.; Preziosi, E. An integrated approach for investigating the salinity evolution in a Mediterranean coastal karst aquifer. Water 2022, 14, 1725. [Google Scholar] [CrossRef]
  23. Missimer, T.M.; Hoppe-Jones, C.; Jadoon, K.Z.; Li, D.; Al-Mashharawi, S.K. Hydrogeology, water quality, and microbial assessment of a coastal alluvial aquifer in western Saudi Arabia: Potential use of coastal wadi aquifers for desalination water supplies. Hydrogeol. J. 2014, 22, 1921–1934. [Google Scholar] [CrossRef]
  24. Alfaifi, H.; Kahal, A.; Albassam, A.; Ibrahim, E.; Abdelrahman, K.; Zaidi, F.; Alhumidan, S. Integrated geophysical and hydrochemical investigations for seawater intrusion: A case study in southwestern Saudi Arabia. Arab. J. Geosci. 2019, 12, 372. [Google Scholar] [CrossRef]
  25. Alhumimidi, M.S. An integrated approach for identification of seawater intrusion in coastal region: A case study of northwestern Saudi Arabia. J. King Saud Univ. 2020, 32, 3187–3194. [Google Scholar] [CrossRef]
  26. Alshehri, F.; Almadani, S.; El-Sorogy, A.S.; Alwaqdani, E.; Alfaifi, H.J.; Alharbi, T. Influence of seawater intrusion and heavy metals contamination on groundwater quality, Red Sea coast, Saudi Arabia. Mar. Pollut. Bull. 2021, 165, 112094. [Google Scholar] [CrossRef]
  27. Ebert, C.H. V Water resources and land use in the Qatif Oasis of Saudi Arabia. Geogr. Rev. 1965, 55, 496–509. [Google Scholar] [CrossRef]
  28. Al-Shaibani, A. Economic potential of brines of Sabkha Jayb Uwayyid, Eastern Saudi Arabia. Arab. J. Geosci. 2013, 6, 2607–2618. [Google Scholar] [CrossRef]
  29. Weijermars, R. Surface geology, lithostratigraphy and Tertiary growth of the Dammam Dome, Saudi Arabia: A new field guide. GeoArabia 1999, 4, 199–226. [Google Scholar] [CrossRef]
  30. Edgell, H.S. Aquifers of Saudi Arabia and their geological framework. Arab. J. Sci. Eng. 1997, 22, 3–31. [Google Scholar]
  31. Abderrahman, W.A.; Rasheeduddin, M.; Al-Harazin, I.M.; Esuflebbe, M.; Eqnaibi, B.S. Impacts of management practices on groundwater conditions in the eastern province, Saudi Arabia. Hydrogeol. J. 1995, 3, 32–41. [Google Scholar] [CrossRef]
  32. USEPA Groundwater Sampling Guidelines. Environ. Prot. Auth. 2000, 36.
  33. Clescerl, L.; Greenberg, A.; Eaton, A. Standard Methods for Examining Water and Wastewater; APHA: Washington, DC, USA, 1999.
  34. Fritz, S.J. A survey of charge-balance errors on published analyses of potable ground and surface waters. Groundwater 1994, 32, 539–546. [Google Scholar] [CrossRef]
  35. Clark, I. Groundwater Geochemistry and Isotopes; CRC Press: Boca Raton, FL, USA, 2015; ISBN 1466591749. [Google Scholar]
  36. Khan, A.F.; Srinivasamoorthy, K.; Rabina, C. Hydrochemical characteristics and quality assessment of groundwater along the coastal tracts of Tamil Nadu and Puducherry, India. Appl. Water Sci. 2020, 10, 1–21. [Google Scholar] [CrossRef] [Green Version]
  37. Mohanty, A.K.; Rao, V.V.S.G. Hydrogeochemical, seawater intrusion and oxygen isotope studies on a coastal region in the Puri District of Odisha, India. Catena 2019, 172, 558–571. [Google Scholar] [CrossRef]
  38. El Waheidi, M.M.; Ghrefat, H.; Qaysi, S.; Batayneh, A.T.; Russo, G.; Jallouli, C.; Badhris, O.; Maeshi, T.; Elawadhi, E.A.; Bahkali, I. Hydrogeophysical Characterization of the Coastal Aquifer System in the Northeast Gulf of Aqaba (Saudi Arabia): An Investigation in the Context of Groundwater Resources Management. J. Coast. Res. 2021, 37, 41–51. [Google Scholar] [CrossRef]
  39. Mondal, N.C.; Singh, V.P.; Singh, V.S.; Saxena, V.K. Determining the interaction between groundwater and saline water through groundwater major ions chemistry. J. Hydrol. 2010, 388, 100–111. [Google Scholar] [CrossRef]
  40. Alfarrah, N.; Walraevens, K. Groundwater overexploitation and seawater intrusion in coastal areas of arid and semi-arid regions. Water 2018, 10, 143. [Google Scholar] [CrossRef] [Green Version]
  41. Appelo, C.; Postma, D. Geochemistry Groundwater and Pollution, 2nd, ed.; Balkema Publication: Leiden, The Netherlands, 2005. [Google Scholar]
  42. Abu Salem, H.S.; Gemail, K.S.; Junakova, N.; Ibrahim, A.; Nosair, A.M. An Integrated Approach for Deciphering Hydrogeochemical Processes during Seawater Intrusion in Coastal Aquifers. Water 2022, 14, 1165. [Google Scholar] [CrossRef]
  43. Piper, A.M. A graphic procedure in the geochemical interpretation of water-analyses. Trans. Am. Geophys. Union 1944, 25, 914. [Google Scholar] [CrossRef]
  44. Mahlknecht, J.; Merchán, D.; Rosner, M.; Meixner, A.; Ledesma-Ruiz, R. Assessing seawater intrusion in an arid coastal aquifer under high anthropogenic influence using major constituents, Sr and B isotopes in groundwater. Sci. Total Environ. 2017, 587, 282–295. [Google Scholar] [CrossRef]
  45. Firat Ersoy, A.; Ayyildiz Turan, N.; Arslan, H.; Kuleyin, A. Assessment of seawater intrusion in Kızılırmak delta coastal area (North Turkey) using hydrochemical and isotopic data. Environ. Earth Sci. 2021, 80, 1–15. [Google Scholar] [CrossRef]
  46. Gibbs, R.J. Mechanisms Controlling World Water Chemistry. Science 1970, 170, 1088–1090. [Google Scholar] [CrossRef]
  47. Gueddari, H.; Akodad, M.; Baghour, M.; Moumen, A.; Skalli, A.; El Yousfi, Y.; Ismail, A.; Chahban, M.; Azizi, G.; Hmeid, H.A. The salinity origin and hydrogeochemical evolution of groundwater in the Oued Kert basin, North-eastern of Morocco. Sci. Afr. 2022, 16, e01226. [Google Scholar] [CrossRef]
  48. Giménez-Forcada, E. Dynamic of sea water interface using hydrochemical facies evolution diagram. Groundwater 2010, 48, 212–216. [Google Scholar] [CrossRef]
  49. Hajji, S.; Allouche, N.; Bouri, S.; Aljuaid, A.M.; Hachicha, W. Assessment of Seawater Intrusion in Coastal Aquifers Using Multivariate Statistical Analyses and Hydrochemical Facies Evolution-Based Model. Int. J. Environ. Res. Public Health 2021, 19, 155. [Google Scholar] [CrossRef] [PubMed]
  50. Giménez-Forcada, E.; Sánchez San Román, F.J. An Excel Macro to Plot the HFE-Diagram to Identify Sea Water Intrusion Phases. Groundwater 2015, 53, 819–824. [Google Scholar] [CrossRef]
  51. Chadha, D.K. A proposed new diagram for geochemical classification of natural waters and interpretation of chemical data. Hydrogeol. J. 1999, 7, 431–439. [Google Scholar] [CrossRef]
  52. Thilagavathi, R.; Chidambaram, S.; Prasanna, M.V.; Thivya, C. A study on groundwater geochemistry and water quality in layered aquifers system of Pondicherry region, southeast India. Appl. water Sci. 2012, 2, 253–269. [Google Scholar] [CrossRef] [Green Version]
  53. Senthilkumar, S.; Vinodh, K.; Johnson Babu, G.; Gowtham, B.; Arulprakasam, V. Integrated seawater intrusion study of coastal region of Thiruvallur district, Tamil Nadu, South India. Appl. Water Sci. 2019, 9, 1–20. [Google Scholar] [CrossRef] [Green Version]
  54. Aju, C.D.; Reghunath, R.; Achu, A.L.; Rajaneesh, A. Understanding the hydrogeochemical processes and physical parameters controlling the groundwater chemistry of a tropical river basin, South India. Environ. Sci. Pollut. Res. 2022, 29, 23561–23577. [Google Scholar] [CrossRef]
  55. Todd, D.K.; Mays, L.W. Groundwater Hydrology; John Wiley & Sons: Hoboken, NJ, USA, 2004; ISBN 0471059374. [Google Scholar]
  56. Moujabber, M.E.; Samra, B.B.; Darwish, T.; Atallah, T. Comparison of different indicators for groundwater contamination by seawater intrusion on the Lebanese coast. Water Resour. Manag. 2006, 20, 161–180. [Google Scholar] [CrossRef]
  57. Chaudhuri, S.; Ale, S. Long term (1960–2010) trends in groundwater contamination and salinization in the Ogallala aquifer in Texas. J. Hydrol. 2014, 513, 376–390. [Google Scholar] [CrossRef]
  58. Abu-Alnaeem, M.F.; Yusoff, I.; Ng, T.F.; Alias, Y.; Raksmey, M. Assessment of groundwater salinity and quality in Gaza coastal aquifer, Gaza Strip, Palestine: An integrated statistical, geostatistical and hydrogeochemical approaches study. Sci. Total Environ. 2018, 615, 972–989. [Google Scholar] [CrossRef]
  59. Tiwari, A.K.; Pisciotta, A.; De Maio, M. Evaluation of groundwater salinization and pollution level on Favignana Island, Italy. Environ. Pollut. 2019, 249, 969–981. [Google Scholar] [CrossRef]
  60. Mercado, A. The use of hydrogeochemical patterns in carbonate sand and sandstone aquifers to identify intrusion and flushing of saline water. Groundwater 1985, 23, 635–645. [Google Scholar] [CrossRef]
  61. Zghibi, A.; Tarhouni, J.; Zouhri, L. Assessment of seawater intrusion and nitrate contamination on the groundwater quality in the Korba coastal plain of Cap-Bon (North-east of Tunisia). J. Afr. Earth Sci. 2013, 87, 1–12. [Google Scholar] [CrossRef]
  62. Arslan, H.; Cemek, B.; Demir, Y. Determination of seawater intrusion via hydrochemicals and isotopes in Bafra Plain, Turkey. Water Resour. Manag. 2012, 26, 3907–3922. [Google Scholar] [CrossRef]
  63. Sankoh, A.A.; Derkyi, N.S.A.; Frazer-Williams, R.A.D.; Laar, C.; Kamara, I. A review on the application of isotopic techniques to trace groundwater pollution sources within developing countries. Water 2022, 14, 35. [Google Scholar] [CrossRef]
  64. Izbicki, J.A. Seawater Intrusion in a Coastal California Aquifer; US Department of the Interior, US Geological Survey: Reston, VA, USA, 1996.
  65. IAEA/WMO Global Network of Isotopes in Precipitation–the GNIP Database. Available online: https://www.iaea.org/services/networks/gnip (accessed on 15 May 2022).
  66. Al-Rashed, M.F.; Sherif, M.M. Water resources in the GCC countries: An overview. Water Resour. Manag. 2000, 14, 59–75. [Google Scholar] [CrossRef]
  67. Todd, D.K. Salt-water intrusion and its control. J. -Am. Water Work. Assoc. 1974, 66, 180–187. [Google Scholar] [CrossRef]
  68. Sun, Q.; Zheng, T.; Zheng, X.; Walther, M. Effectiveness and comparison of physical barriers on seawater intrusion and nitrate accumulation in upstream aquifers. J. Contam. Hydrol. 2021, 243, 103913. [Google Scholar] [CrossRef]
  69. Hussain, M.S.; Abd-Elhamid, H.F.; Javadi, A.A.; Sherif, M.M. Management of Seawater Intrusion in Coastal Aquifers: A Review. Water 2019, 11, 2467. [Google Scholar] [CrossRef]
  70. Abd-Elaty, I.; Javadi, A.A.; Abd-Elhamid, H. Management of saltwater intrusion in coastal aquifers using different wells systems: A case study of the Nile Delta aquifer in Egypt. Hydrogeol. J. 2021, 29, 1767–1783. [Google Scholar] [CrossRef]
  71. Abdalla, O.A.E.; Al-Rawahi, A.S. Groundwater recharge dams in arid areas as tools for aquifer replenishment and mitigating seawater intrusion: Example of AlKhod, Oman. Environ. Earth Sci. 2013, 69, 1951–1962. [Google Scholar] [CrossRef]
  72. Chen, K.P.; Jiao, J.J. Seawater intrusion and aquifer freshening near reclaimed coastal area of Shenzhen. Water Sci. Technol. Water Supply 2007, 7, 137–145. [Google Scholar] [CrossRef]
Figure 1. Map showing the study area and GW sample locations.
Molecules 27 06841 g001
Figure 2. Land use and land cover map of Al-Qatif area.
Molecules 27 06841 g002
Figure 3. Average monthly satellite-gauge precipitation estimates (2001–2021) over Al Qatif watershed.
Molecules 27 06841 g003
Figure 4. Surface geology map of the study area [29].
Molecules 27 06841 g004
Figure 5. General hydrogeological section of the aquifer system in the study area [30].
Molecules 27 06841 g005
Figure 6. Water level maps of (a) shallow and (b) deep aquifers in the study area.
Molecules 27 06841 g006
Figure 7. Spatial distribution maps of EC, TDS, Cl, and Br for (a) shallow GW and (b) deep GW.
Molecules 27 06841 g007
Figure 8. Piper diagram showing the hydrochemical facies of tested GW samples.
Molecules 27 06841 g008
Figure 9. Gibbs plot of the GW samples from shallow and deep aquifers with seawater sample.
Molecules 27 06841 g009
Figure 10. Hydrochemical Facies Evolution Diagram (HFE) of the tested GW samples. Seawater sample indicated with a red circle.
Molecules 27 06841 g010
Figure 11. Chadha diagram shows the hydrochemical facies of tested GW samples from shallow and deep aquifers in the study area.
Molecules 27 06841 g011
Figure 12. Degree of salinization in inverse of Simpson’s ratio plot.
Molecules 27 06841 g012
Figure 13. Ion ratio diagram (a) Na+/Cl ratio vs. Cl, (b) Mg2+/Ca2+ ratio vs. Cl, and (c) Ca2+/HCO3 ratio vs. Cl.
Molecules 27 06841 g013
Figure 14. Diagram shows fraction of seawater for GW samples from shallow and deep coastal aquifers with seawater sample reference.
Molecules 27 06841 g014
Figure 15. Spatial distribution map of seawater fraction of (a) shallow GW and (b) deep GW samples.
Molecules 27 06841 g015
Figure 16. Plot of δ18O vs. δ2H showing stable isotope variation of analyzed GW samples.
Molecules 27 06841 g016
Figure 17. Plot showing the relationship between δ18O and hydrochemical parameters (TDS and Cl) of analyzed GW and seawater samples; (a) TDS vs. δ18O, and (b) Cl vs. δ18O.
Molecules 27 06841 g017
Figure 18. Map showing land reclamation in the study area.
Molecules 27 06841 g018
Table 1. Descriptive statistics of the hydrochemical parameters and isotopes of tested GW samples from both aquifers.
Ca2+ (mg/L)Mg2+ (mg/L)Na+ (mg/L)K+ (mg/L)HCO3 (mg/L)Cl (mg/L)SO42− (mg/L)NO32− (mg/L)Br (mg/L)EC (µS/cm)TDS (mg/L)pHδ18O‰δ2H‰
Shallow aquiferMin319.8136.2498.222.6142.01041.9666.07.56.16475.74220.06.5−3.6−26.8
Max739.91267.65025.5220.5712.68523.74877.745.239.444,420.534,090.07.7−2.3−20.6
Avg479.2292.81328.564.1448.92405.71394.414.812.613,936.110,108.56.8−3.0−23.0
SD479.2292.81328.564.1448.92405.71394.414.812.613,936.110,108.56.80.42.2
Deep aquiferMin129.751.3237.39.9136.0401.8294.210.31.93072.51955.06.8−4.3−31.1
Max183.471.5421.416.4183.4765.8440.515.94.35060.33308.78.0−3.5−25.0
Avg161.661.7315.313.1165.7574.3337.912.83.03993.32544.77.2−3.9−28.2
SD161.661.7315.313.1165.7574.3337.912.83.03993.32544.77.20.21.6
Publisher’s Note: MDPI stays neutral with regard to jurisdictional claims in published maps and institutional affiliations.

