Article

A New Photoacoustic Soot Spectrophone for Filter-Free Measurements of Black Carbon at 880 nm

1
Laboratoire de Physicochimie de l’Atmosphère, Université du Littoral Côte d’Opale, 189A Avenue Maurice Schumann, 59140 Dunkerque, France
2
Center for Energy and Environment, IMT Nord Europe, Institut Mines-Télécom, Univ. Lille, 941 Rue Charles Bourseul, 59500 Douai, France
3
Laser Spectroscopy and Sensing Laboratory, Institute for Quantum Electronics, ETH Zurich, Otto-Stern-Weg 1, 8093 Zurich, Switzerland
*
Author to whom correspondence should be addressed.
Molecules 2022, 27(18), 6065; https://doi.org/10.3390/molecules27186065
Submission received: 30 July 2022 / Revised: 1 September 2022 / Accepted: 14 September 2022 / Published: 16 September 2022
(This article belongs to the Special Issue Recent Advances in Photoacoustic and Photothermal Gas Spectroscopy)

Abstract

:
A new photoacoustic soot spectrometer (PASS) operating at 880 nm was developed, for the first time, for filter-free measurements of black carbon (BC). The performance of the developed PASS was characterized and evaluated using a reference aethalometer AE51 on incense smoke in the air. An excellent correlation on the measurement of incense smoke was found between the two instruments in comparison with a regression coefficient of 0.99. A 1 σ detection limit of 0.8 µg m−3 was achieved for BC measurement at a time resolution of 1 s. It can be further reduced to 0.1 µg m−3, using a longer integration time of 1 min.

1. Introduction

Black carbon (BC) is one of the main short-lived climate pollutants [1]. It is a relatively pure form of carbon, also known as soot [2]. It is formed during an incomplete combustion of biofuels, fossil fuels and biomass products [1]. It is considered to be the second cause of global warming after CO2 with a radiative forcing of 1.1 W m−2 against 1.7 W m−2 for CO2 [3]. Besides its impact on the climate, BC also has detrimental effects on human health, causing respiratory and cardiovascular diseases, as well as lung cancers and premature mortalities [1]. BC also has an indirect impact on agriculture. For instance, it modifies rainfall patterns and disturbs monsoons in many parts of Asia and Africa, which are critical for crop yields [4]. In addition, when it comes into direct contact with vegetation, it reduces sunlight by surface deposition on leaves, and consequently decreases the net photosynthetic rate [5].
Since BC has a short atmospheric lifetime (days to weeks) [2], it is possible to rapidly intervene to decrease its emission, thus, reducing its impact on ecosystems, human health and climate [6]. Among the techniques used for measuring BC, there are mainly three methods: (1) thermal optical analysis, measuring BC mass concentration with the advantage of distinguishing organic and elemental carbon [7]; (2) laser-induced incandescence measuring both particle size and mass concentrations [8] and (3) aethalometers based on direct absorption spectroscopy, commercially available for filter-based measurements of light absorption by BC to determine its concentrations [9]. However, these techniques present significant uncertainties that can reach 20–30%, due to sampling artifacts and biases [10].
Recently, photoacoustic absorption spectroscopy (PAS) was shown to be a valuable technique for direct filter-free measurements of BC, with advantages of high accuracy and portability, and a lower sensitivity to light scattering losses as in filter-based methods [11]. The first photoacoustic soot spectrometer (PASS) dedicated to the detection of BC was presented by Petzold and Niessner in 1996 [12]. The authors used a diode laser which was operated at 802 nm with an optical power of 450 mW. Later on, various PAS instruments operating in the UV–vis and near-IR regions were developed for experimental studies of soot [6,11], as well as for industrial applications [13]. This technique was even deployed on aircraft platforms [14,15], and was commercialized as a multiple wavelength photoacoustic spectrophones: PASS-3 (Droplet Measurement Technologies, Boulder, CO, USA) [16].
In this publication, we report on the development of a PASS operating at 880 nm for the measurement of BC concentrations with a fast time resolution of 1 s. The performances of this instrument were characterized and evaluated using a reference aethalometer and samples consisting of incense smoke in the air.
It is worth noting that the present instrument is the first PA spectrophone developed for the measurement of BC at 880 nm, after the one reported in 2007 that operated at 870 nm for the measurement of BC with a resolution time of 2 min (LoD not reported) [17]. The advantage of choosing this wavelength is that BC is detected without interferences from other types of absorbing particulate species, especially organic carbon [18]. Indeed, 880 nm is the same wavelength used for the reference aethalometer AE51, while the reference instrument uses the filter-based optical measurement method, which is the main limiting factor to the current instrumental measurement accuracy.
This work demonstrates that photoacoustic spectroscopy is a valuable technique, offering the unique capacity of direct and filter-free measurement of absolute light absorption by black carbon, with advantages of high accuracy, high sensitivity, and high portability.

2. Results

2.1. Materials and Methods

2.1.1. Measurement of Particle Absorption by Photoacoustic Spectroscopy

PAS is an analytical technique suitable for absolute absorption measurements of trace gases and particles [6], with advantages of a simple setup and relatively low cost. This technique relies on the measurement of an acoustic signal resulting from the absorption of photons of a modulated light by the targeted species that absorbs photons at specific wavelengths. The recorded signal can then be used to provide information on the absorption properties of the detected species (absorption coefficients and concentration) [6].
The photoacoustic (PA) effect resulting from the absorption of photons by gaseous species or aerosol particles results from [19] (i) localized heat release as a result of the absorbed energy; (ii) periodical thermal expansion of the sample due to the modulation of the exciting light; (iii) the generation of an acoustic signal whose intensity is proportional to the absorbed energy.
The acoustic signal is then quantified using suitable acoustic transducers such as microphones. The measured PA signal S (V) can be expressed using the following equation [6]:
S = P × M × Ccell × α0 × C + Sb
where P (W) is the incident light power, M (V/Pa) the microphone sensitivity. Ccell (Pa m W−1) is the PA absorption cell constant expressing the conversion efficiency of the optical energy into an acoustic energy [13], the latter being a quality indicator for the PA cell [20]. Ccell is independent of the measured absorber (gas or particles) [11]. α0 (Mm−1 ppb−1, Mm−1 = 10−6 m−1) is the specific absorption coefficient of the detected trace gas and C (ppbv) is its concentration. In the case of particle measurements, α0 (m2 g−1) is the aerosol absorption mass coefficient and C (μg m−3) is the aerosol mass concentration [6]. Sb (V) is the background PA noise arising from ambient acoustic noise and is generated by photons hitting the walls/windows of the PA cell.

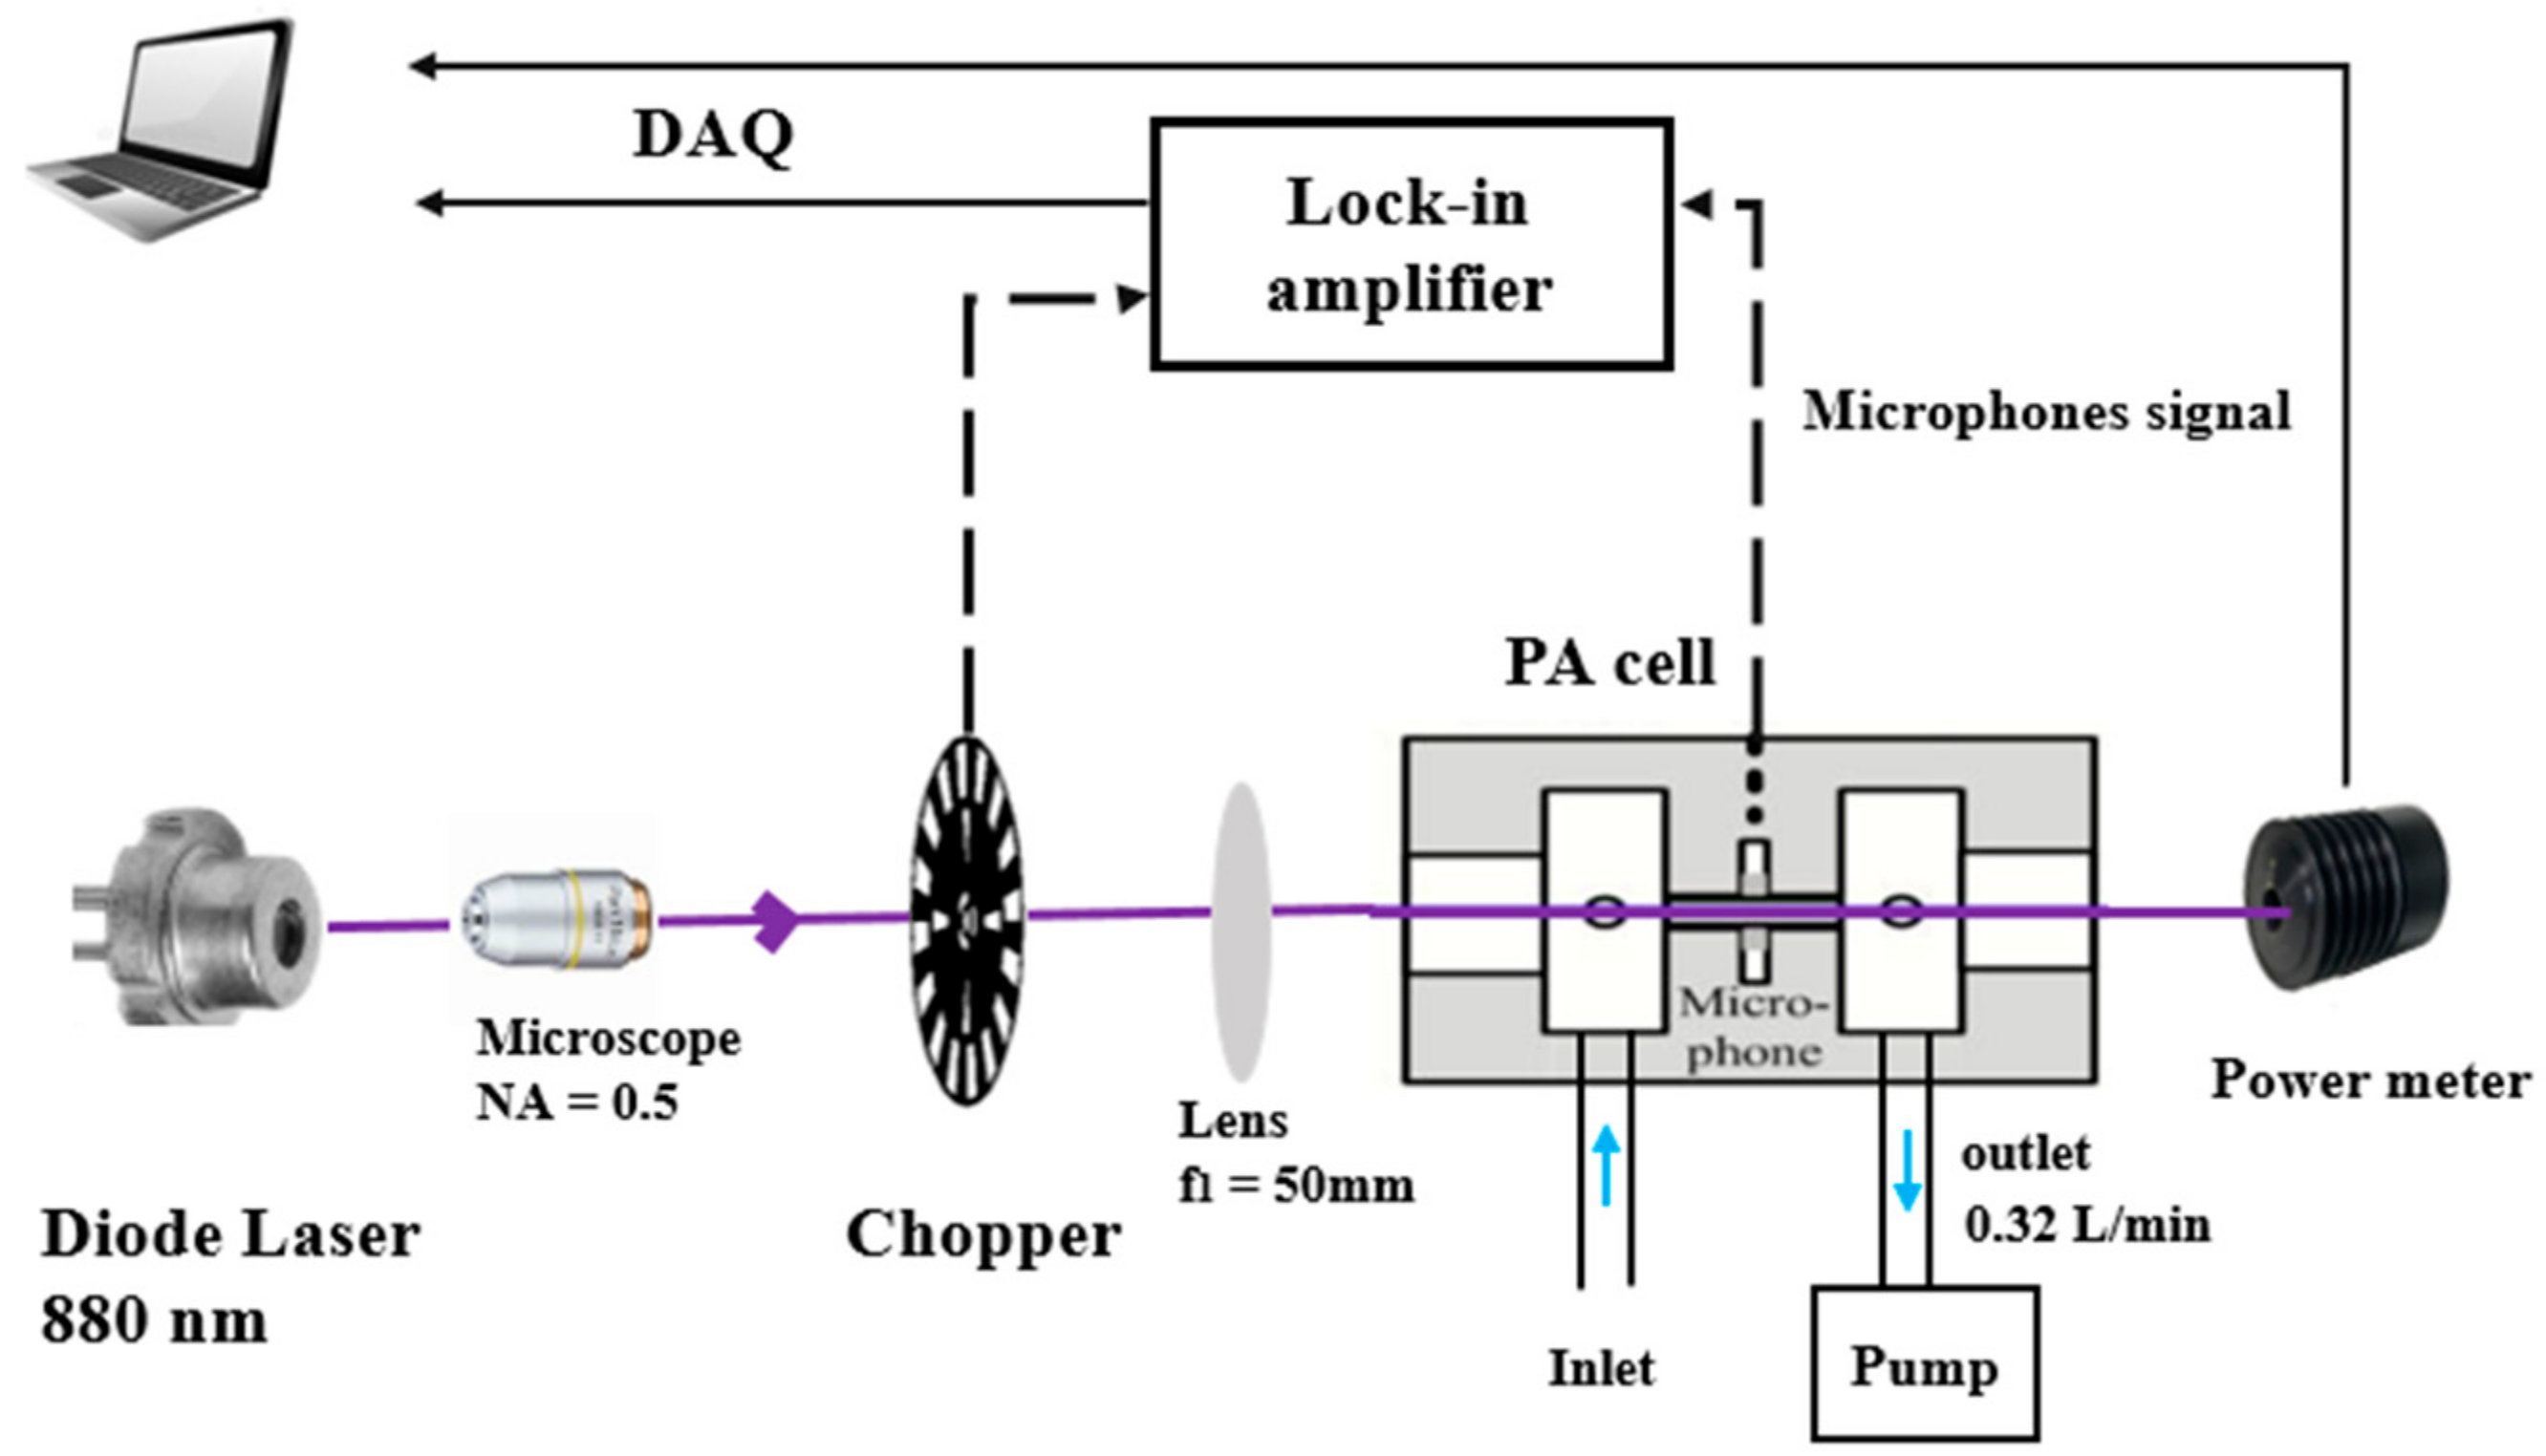
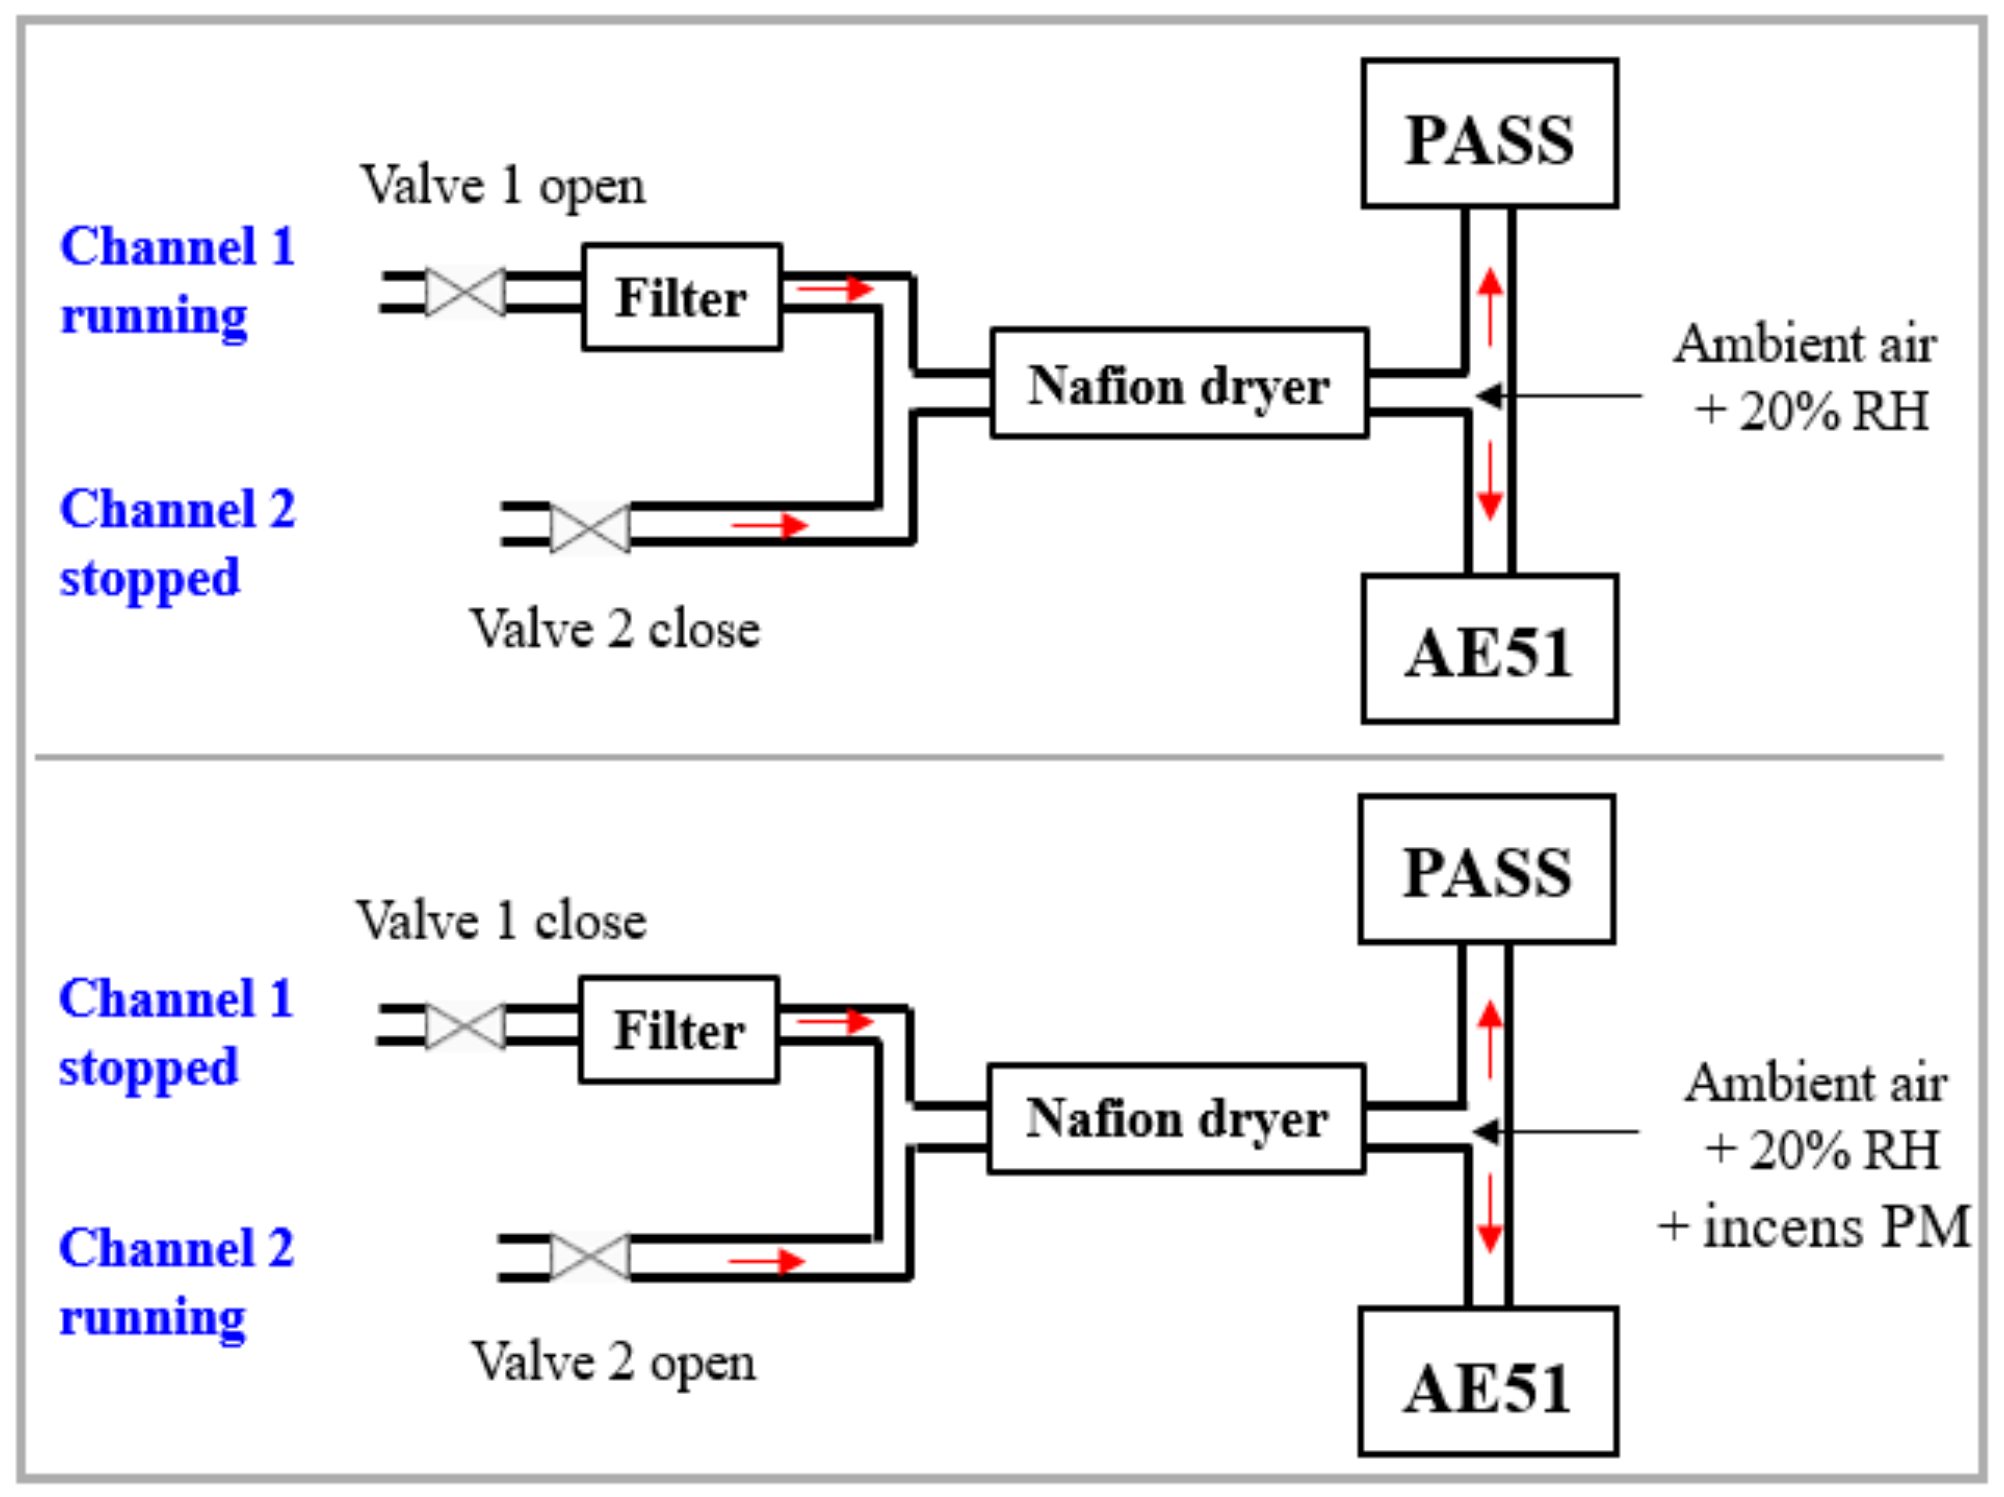
2.1.2. Experimental Setup

The PASS is composed of four main parts: (1) a modulated light source emitting at a specific wavelength, (2) a sampling cell equipped with an acoustic resonator to enhance the PA signal, (3) an acoustic transducer device for the detection of the acoustic signal consisting of microphones, and (4) an electronic unit for signal amplification and data processing [21]. A schematic of the instrument is shown in Figure 1. It includes a laser source, a PA resonator (PA cell incorporating 2 buffer volumes to reduce the background noise resulting from (i) the external environment, (ii) the flowing gas, and (iii) light absorption on the cell windows) and a data processing module.
The light source is a high power TO-3 laser diode (WaveSpectrum, AL0880F1000, Beijing, China), emitting one line in the spectral range of 880 ± 5 nm with an emission linewidth of ~1 nm. Its maximum output optical power is 1 W powered with a current of 1300 mA and a voltage of 2.2 V. These parameters are controlled by a diode laser controller (6340 ComboSource, Arroyo Instruments, San Luis Obispo, CA, USA). A microscope with a numerical aperture (NA) of 0.5 is used to reshape the laser beam and to focus it on a 100-slot mechanical chopper (New focus 3501, Newport/New Focus, Irvine, CA, USA). The chopper modulates the laser light at the resonance frequency of the acoustic resonator. The modulated laser beam is collimated using a lens with a focal length of 50 mm, and then focused into the acoustic resonator in the PA cell. The laser beam at the output of the cell is collected by a power meter (Coherent, Field Master GS, Saxonburg, PA, USA) to monitor the laser power. Four electret microphones (EK-23329-P07, Knowles, Itasca, IL, USA) are set up in the middle of the acoustic resonator to detect the PA signal. These microphones exhibit a sensitivity of 22.4 mV/Pa at sound frequencies ranging from 100 to 10,000 Hz.
The PA signal is first demodulated at the modulation frequency of the laser light using a lock-in amplifier (SR 830, Stanford Research Systems, Sunnyvale, CA, USA). The signal is then sampled using a data acquisition card (National Instrument PCI-6251, Austin, TX, USA) and a laptop allowing real-time data processing and display via a Labview program. The quantified acoustic signal is finaly normalized by the measured laser power.
To characterize and optimize the performances of the PASS instrument, a series of experiments were performed to optimize the operating parameters, including the modulation frequency and the sampling flow rate, and to evaluate the effect of ambient humidity on the PA signal.

2.1.3. Calibration of the PA Cell

To calibrate the photoacoustic cell, an absorber (gas or particulate matter) with a known concentration and absorption cross section was needed [22]. In the visible up to the near-infrared regions, NO2 is commonly used for this purpose [23,24,25]. At 880 nm, NO2 exhibits a small absorption, therefore, it is essential to work at a relatively high concentration. Overnight flushing of the PA cell with N2 at the end of the experiment was performed to avoid its contamination.
Equation (1) was rearranged to derive Ccell from calibration experiments. The measured PA signal (S) for a NO2 mixing ratio of 3000 ± 60.6 ppm and the background signal (Sb) observed when only pure N2 was passed through the cell are 25.34 µV (±0.20 µV) and 16.28 μV (±0.22 µV), respectively. The specific absorption coefficient α0 (Mm−1 ppm−1) of NO2 was derived from the following equation:
α 0 = N   ×   σ λ C NO 2  
where N = 7.5 × 10¹⁶ molecules cm−3 is the NO2 number concentrations at T = 293.5 K and P = 1 atm, and CNO2 = 3000 ± 60.6 ppm is the NO2 mixing ratio. According to the MPI-Mainz UV/VIS Spectral Atlas of Gaseous Molecules of Atmospheric Interest, the absorption cross section σ(λ) of NO2 at 880 nm is 3.51 × 10⁻²³ cm2 molecules−1 [26]. The specific absorption coefficient α0 of NO2 was then found to be 0.088 Mm−1 ppm−1. The PA cell constant was deduced to be Ccell = 2.21 ± 0.05 Pa m W−1. The uncertainty for the cell constant was calculated from a quadratic propagation of errors associated to the PA signal (precision), the NO2 mixing ratio, and the laser power. Where Δ S PA S PA = 0.8% (from the lock-in amplifier) is the relative uncertainty of the PA signal, Δ C NO 2 C NO 2 = 2% is the relative uncertainty in the NO2 concentration, and Δ P P = 0.10% is the uncertainty in the laser power ΔP. The uncertainties from the microphone sensitivity M and the specific absorption coefficient α0 are considered negligible. A value of 2.2% was estimated as the relative uncertainty of the cell constant, corresponding to a Δ C cell = 0.05 Pa m W−1.

2.1.4. Modulation Frequency Optimization

The resonant PAS approach is widely employed to enhance the signal-to-noise ratio (SNR) of the PA signal for which an acoustic resonator is used. The frequency of the laser beam modulation should be well matched to the resonance frequency of the acoustic resonator. The resonance frequency of the acoustic resonator can be expressed by the following equations:
f = c 2 × L   +   Δ L
Δ L = 16 3 Π   ×   R
where c (m s−1) is the sound speed, L (m) is the length of the resonator, ΔL is the end correction factor, and R (m) is the resonator radius [21].
For an ideal gas, the sound speed c can be expressed as follows:
c = Ɣ ×   p ρ
where Ɣ is the adiabatic index, also known as the isentropic expansion factor, and p (Pa) and ρ (kg m−3) are the gas pressure and density, respectively. The sound speed c is, therefore, dependent on the medium composition; in particular, on the nature of the most abundant species present in the sampled gas, i.e., N2, O2, and to some extent H2O in ambient air.
To experimentally determine the resonance frequency of the PASS instrument, PA signals were monitored vs. modulation frequencies for three types of carrier gases:
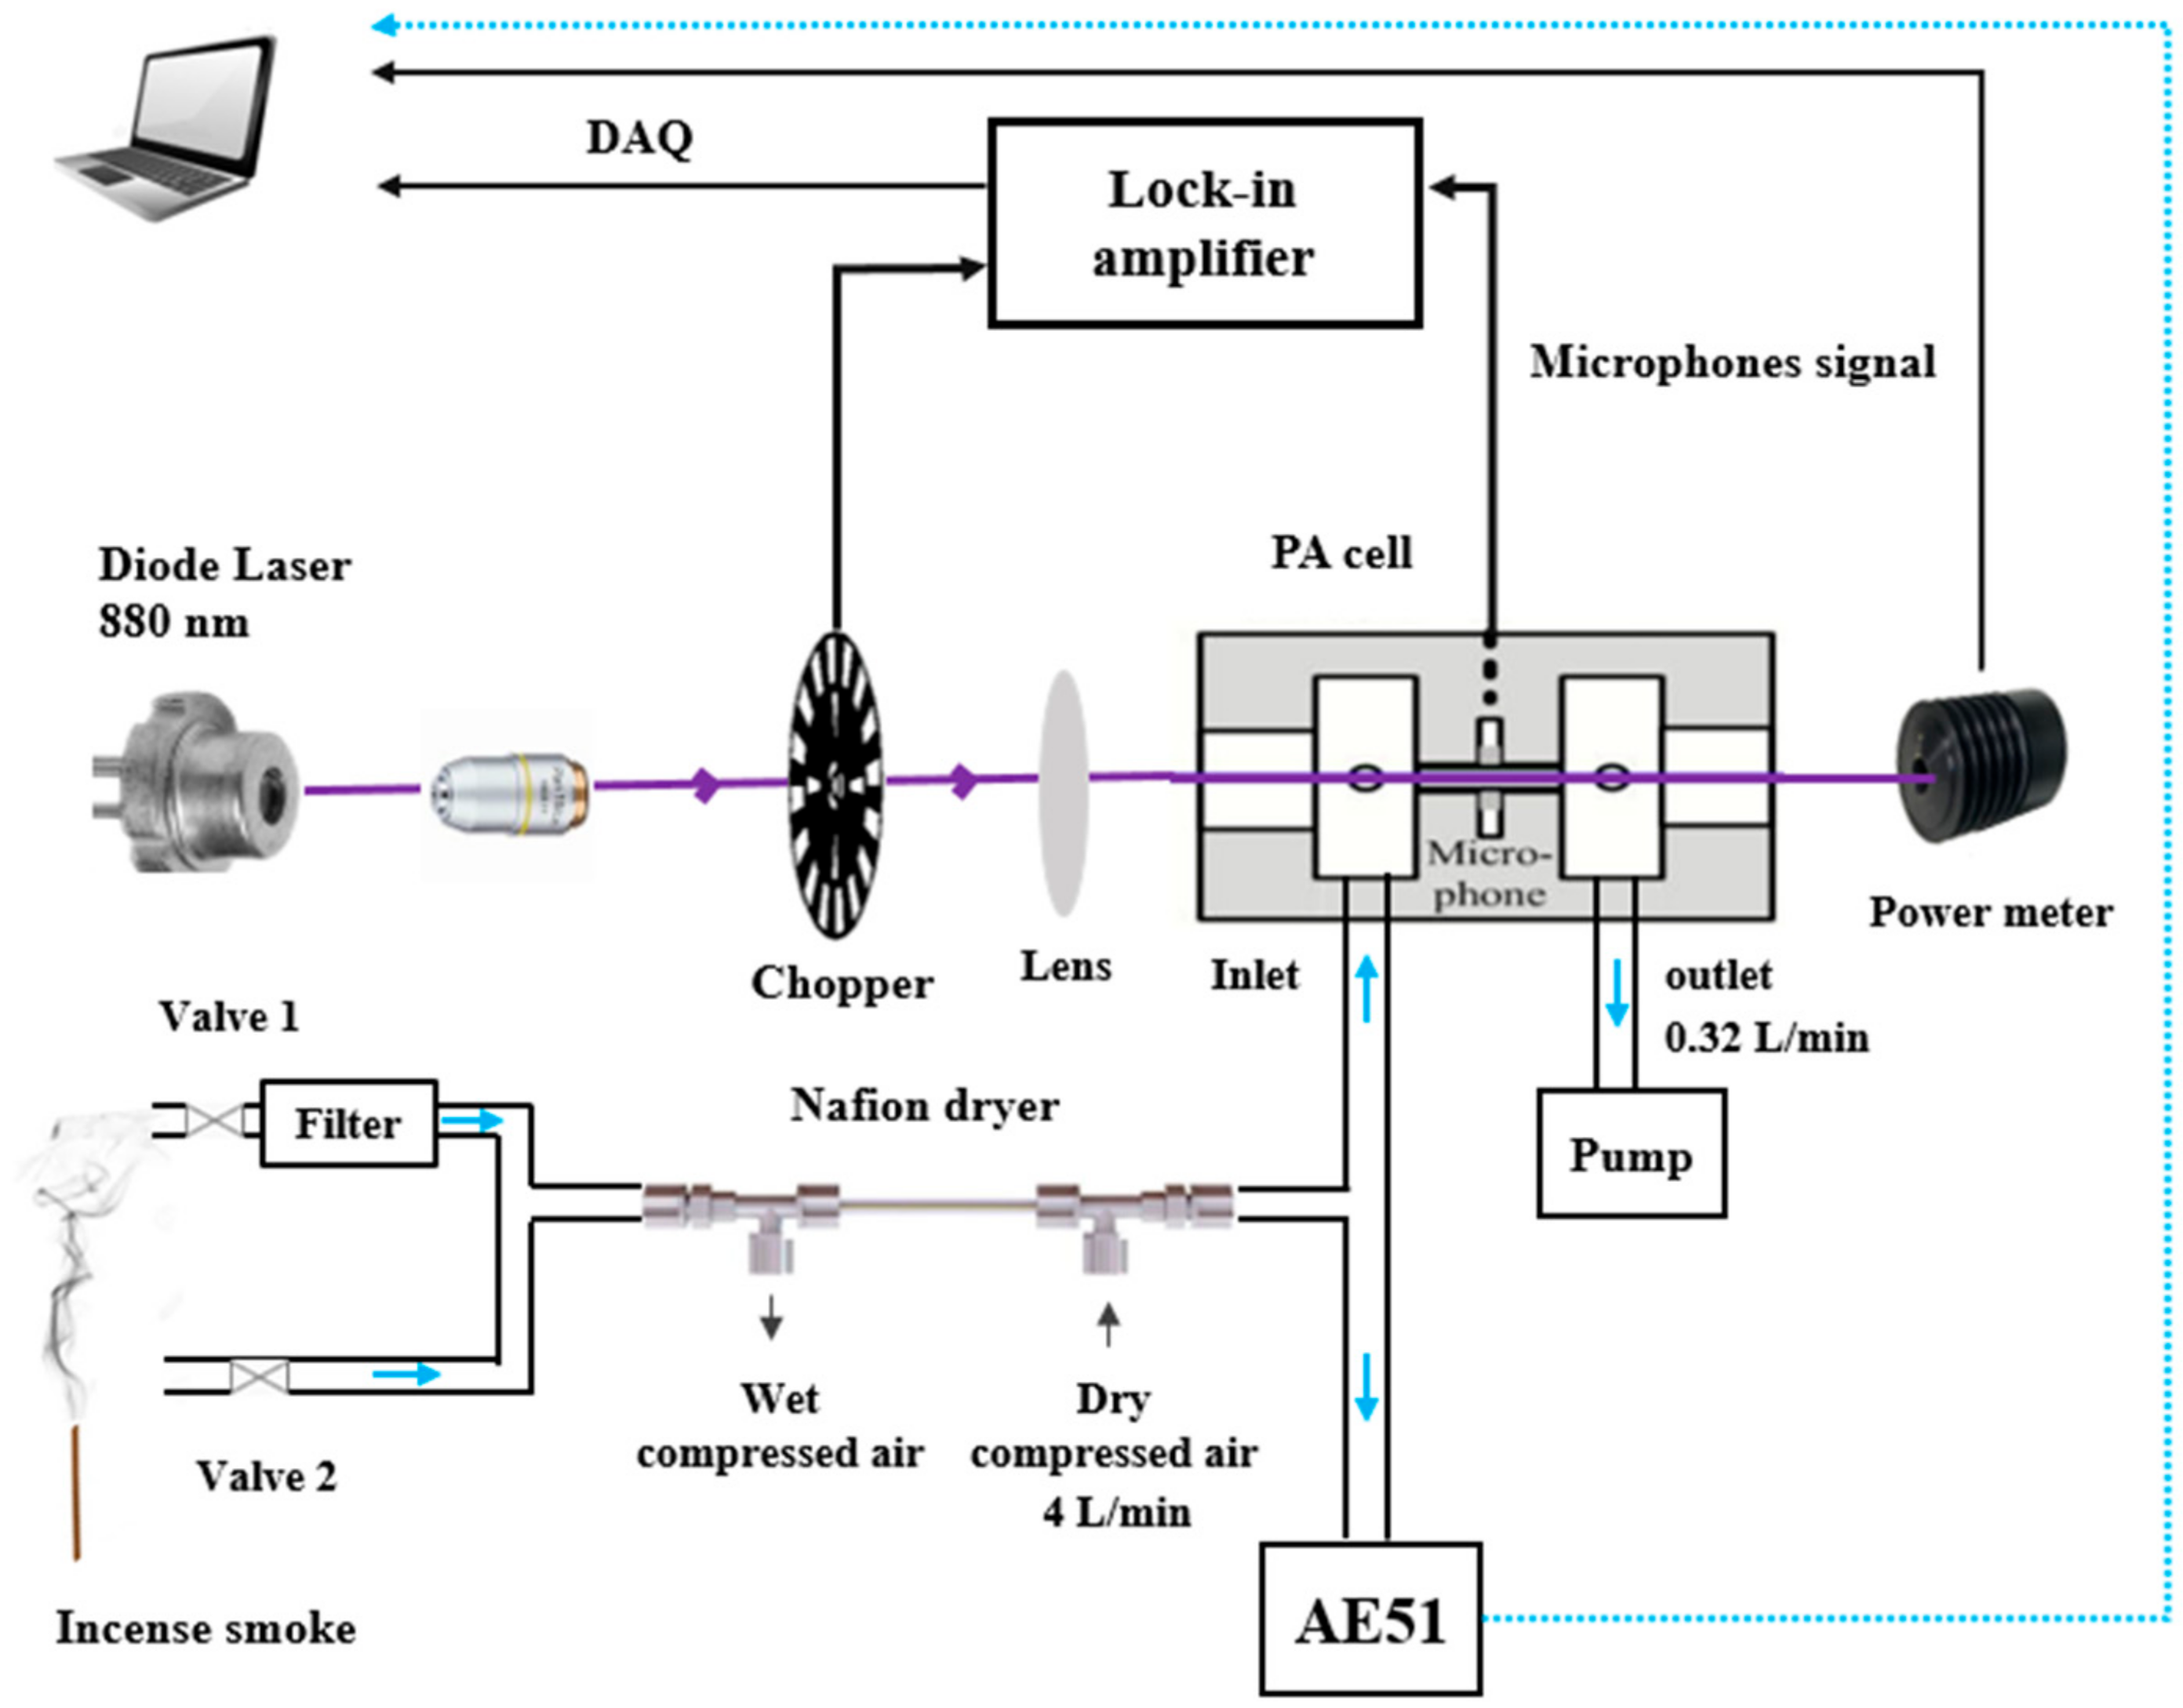
  • Nitrogen (N2) with low water content (RH = 9.5%, T = 27 °C)—Referred to as dry N2 in the following sections;
  • Compressed air with low water content (RH = 12%, T = 27 °C)—Referred to as dry compressed air in the following sections;
  • Humid filtered indoor ambient air (RH = 34%, T = 27 °C), filtered by a PTFE membrane filter (0.2 μm) to remove particles, assuming that the mass concentration of particles with a size less than 0.2 μm is negligible (<1 μg.m−3) given their small size; hence, their effects on the PA signal are also negligible.
It is worth noting that a photoacoustic signal is observed during these experiments, even in the absence of BC, due to the absorption of photons by water vapor, as discussed in Section 2.1.5.
Figure 2 shows the normalized PA signals at modulation frequencies ranging from 5.90 to 6.27 kHz. Based on Equations (4) and (6), the calculated resonance frequencies are 6.21 kHz for dry N2 and 6.05 kHz for dry compressed air, given a resonator length of 23 mm and a radius R of 3 mm, and a sound speed of 349 and 340 m s−1 in N2 and air, respectively ( Ɣ   = 1.4, p = 1.013 × 10⁵ Pa, ρ (N2) = 1.15 kg m3, ρ (air) = 1.21 kg m3). Consistently, the experimental resonance frequencies (6.19 kHz for N2 and 6.06 kHz for dry air) are within 0.3% of the theoretical values. A modulation frequency of 6.06 kHz (for measurements in air) was chosen as the operating parameter for further experiments and field applications.
It is clear from Figure 2 that water vapor has an impact on the resonance frequency [27] and should be taken into consideration for ambient measurements. In fact, at 6.06 kHz, an increase in the RH from 12 to 34% would lead to a relative decrease in the instrument response of approximately 10%, which is significant.

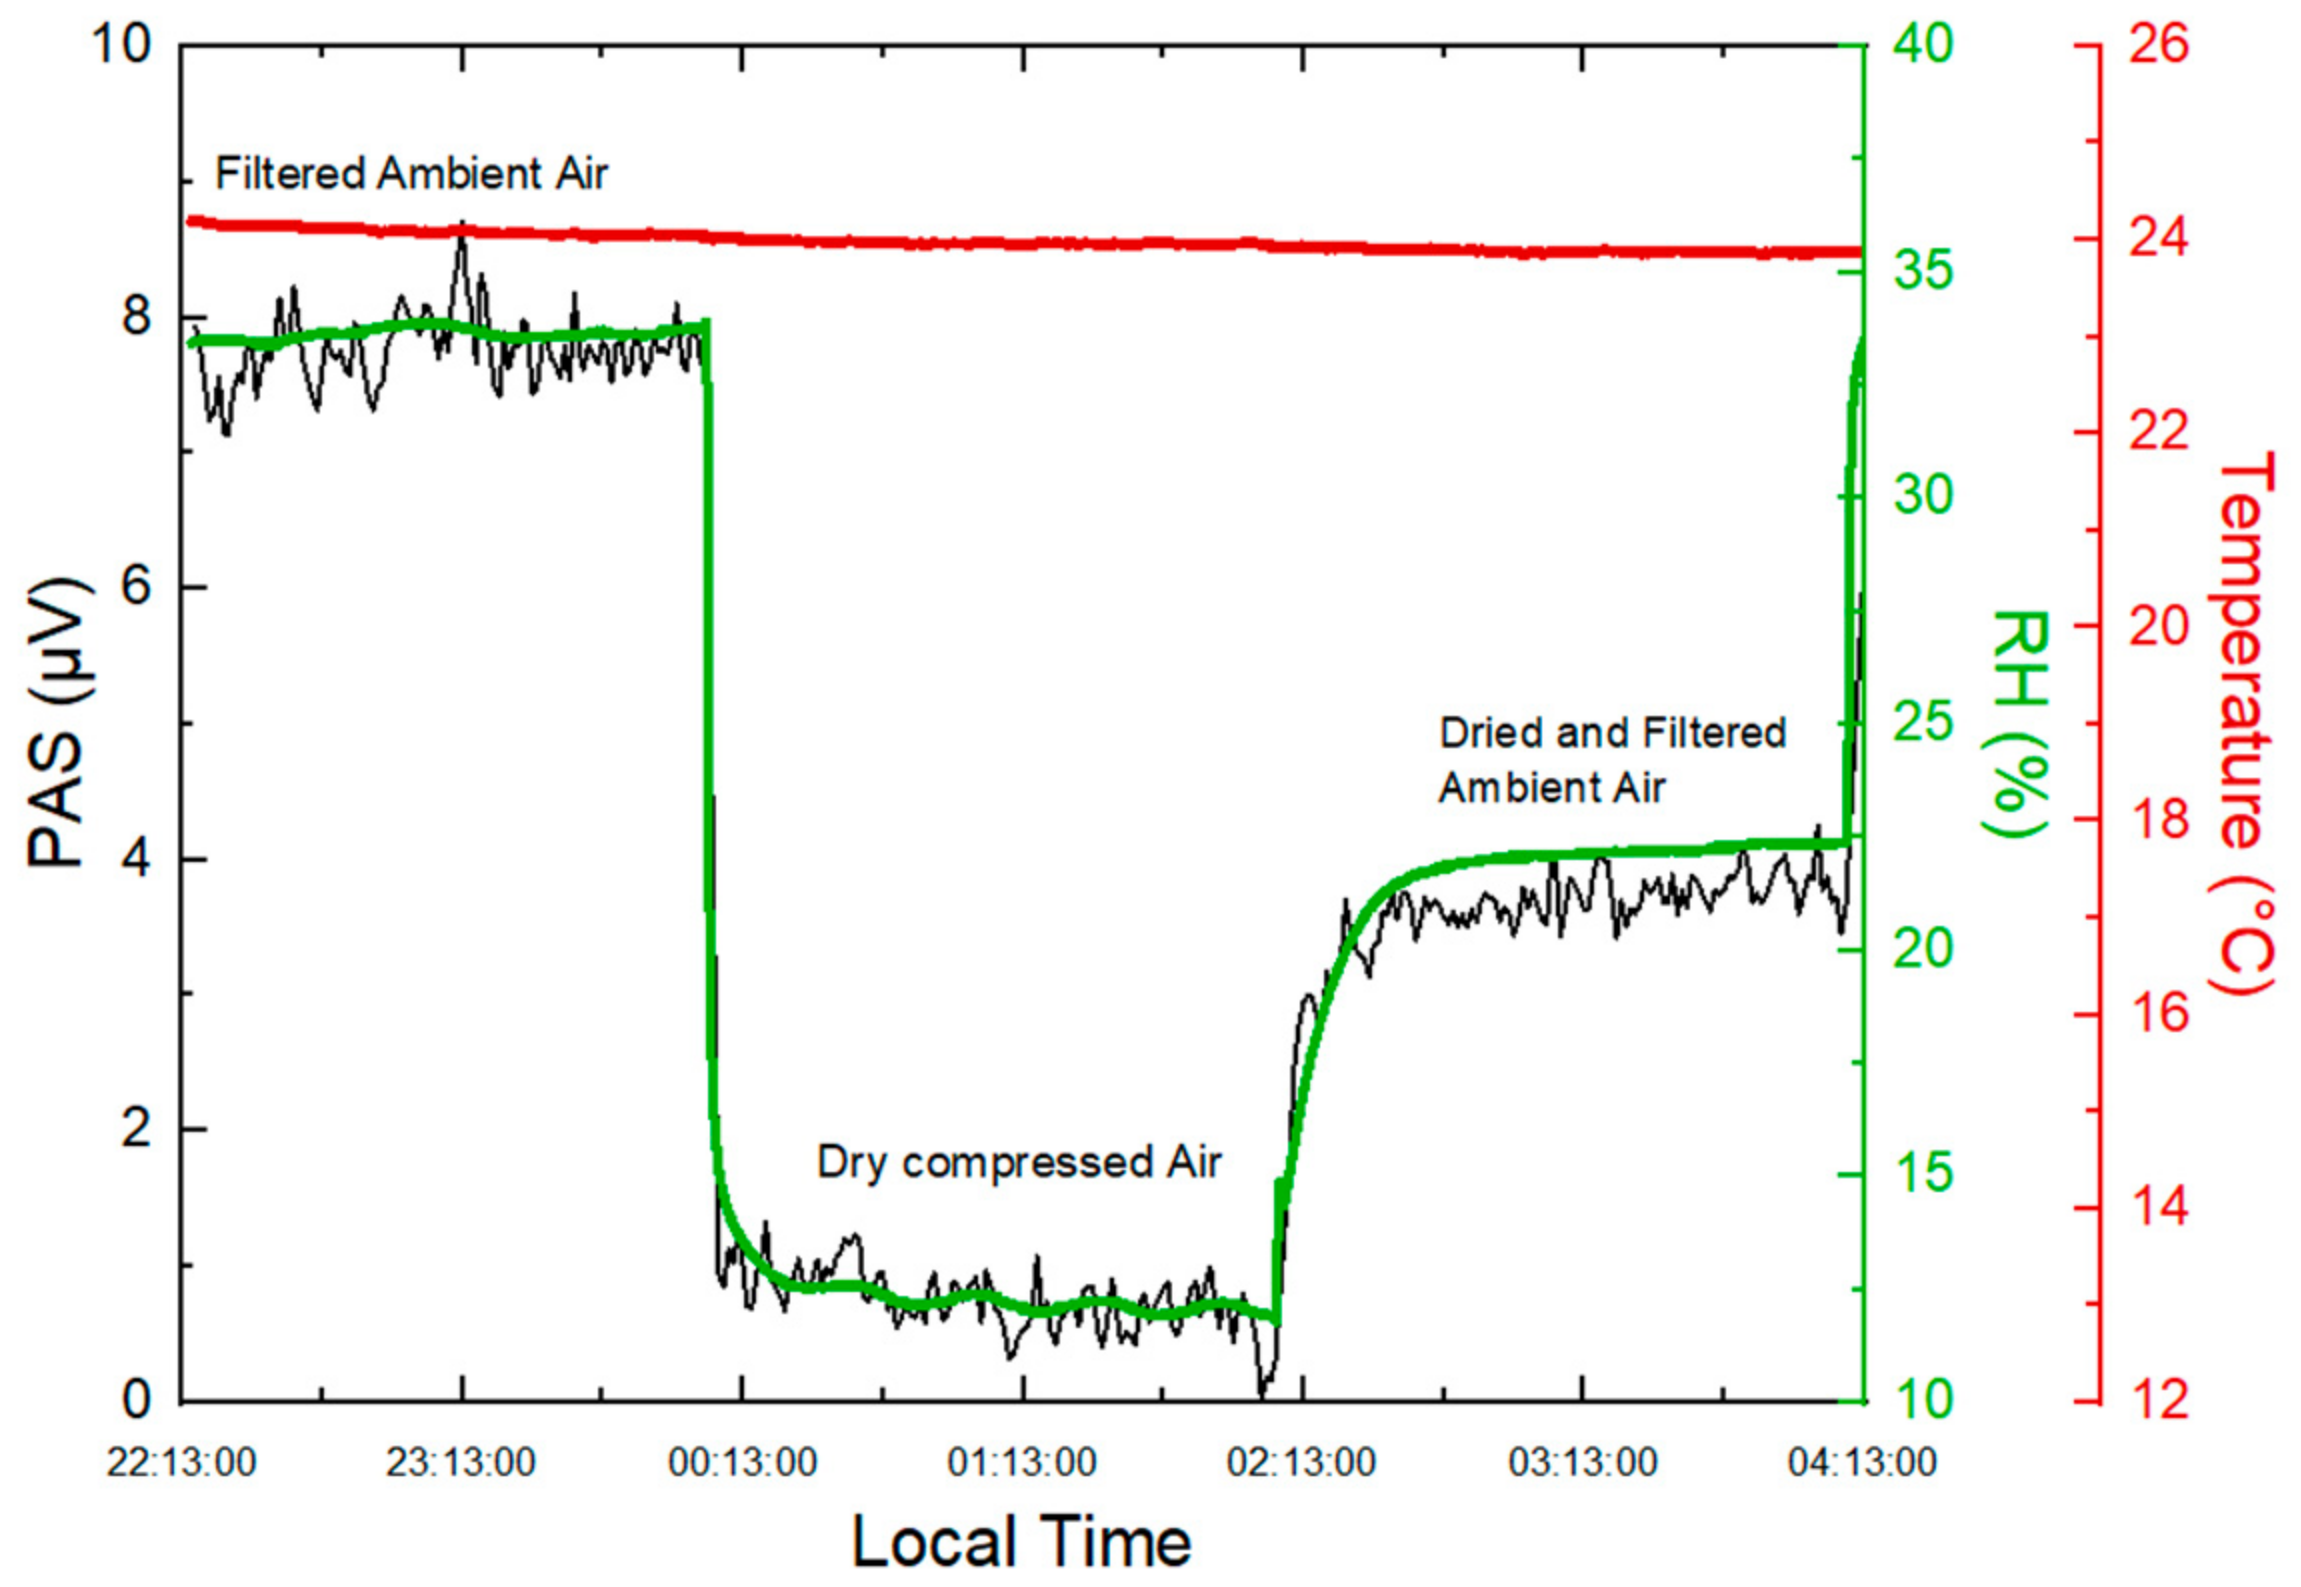
2.1.5. Impact of Relative Humidity on PA Signal

The PA signal depends on the vibration-to-translation (V-T) relaxation rate of the target absorber [27]. In this regard, water vapor is considered as a promoter to accelerate this process and it can considerably enhance the PA signal [28]. In addition, if H2O vapor absorbs the laser light at the operating wavelength, it will further “increase” the PA signal due to its direct absorption. According to the HITRAN database, H2O vapor presents an absorption line at 880 nm with a cross section of ~10−27 cm2 mol−1. Considering the high H2O concentrations in the atmosphere, H2O absorption may lead to a significant interference on the measurements of PA signals.
In the present work, the impact of H2O vapor was experimentally investigated. Ambient RH was monitored using a temperature and humidity sensor (Sensirion, SHT71, Stäfa, Switzerland) connected to the outlet of the PA cell. Increasing RH compressed air by 22% at a constant temperature results in an increase of 7 µV in the PA signal (Figure 3), which would be equivalent to a concentration of 32.13 µg m−3 of BC on the basis of the sensitivity reported in Section 2.2.
In order to reduce the impact of ambient humidity, a Nafion dryer (Perma pure, 30 cm monotube MD-110-12S-4 dryer, Lakewood, NJ, USA) was used to dry the samples before the inlet of the PA cell. Dry compressed air was used as purge gas at an optimal flow rate of 4 L min−1, as recommended by the manufacturer.
An overnight experiment was carried out to monitor the variation of the PA signal depending on the change in RH. The sampling was controlled automatically with a Labview-based program to measure the PA signals resulting from three different carrier gases: dry compressed air, ambient air filtered with a PTFE membrane filter, and ambient air dried by the Nafion dryer (also particle-filtered with a PTFE filter). A reduction in RH from 34% to 22% was observed after drying ambient air by the Nafion dryer, as shown in Figure 3.
In the present work, the use of the Nafion dryer allowed to stabilize RH at a constant level of 22% in the samples and the PA signal generated by residual RH was considered as a background signal that was then subtracted from BC measurements in ambient air to deduce the absorption generated only from BC (effective PA signal: SEPA).

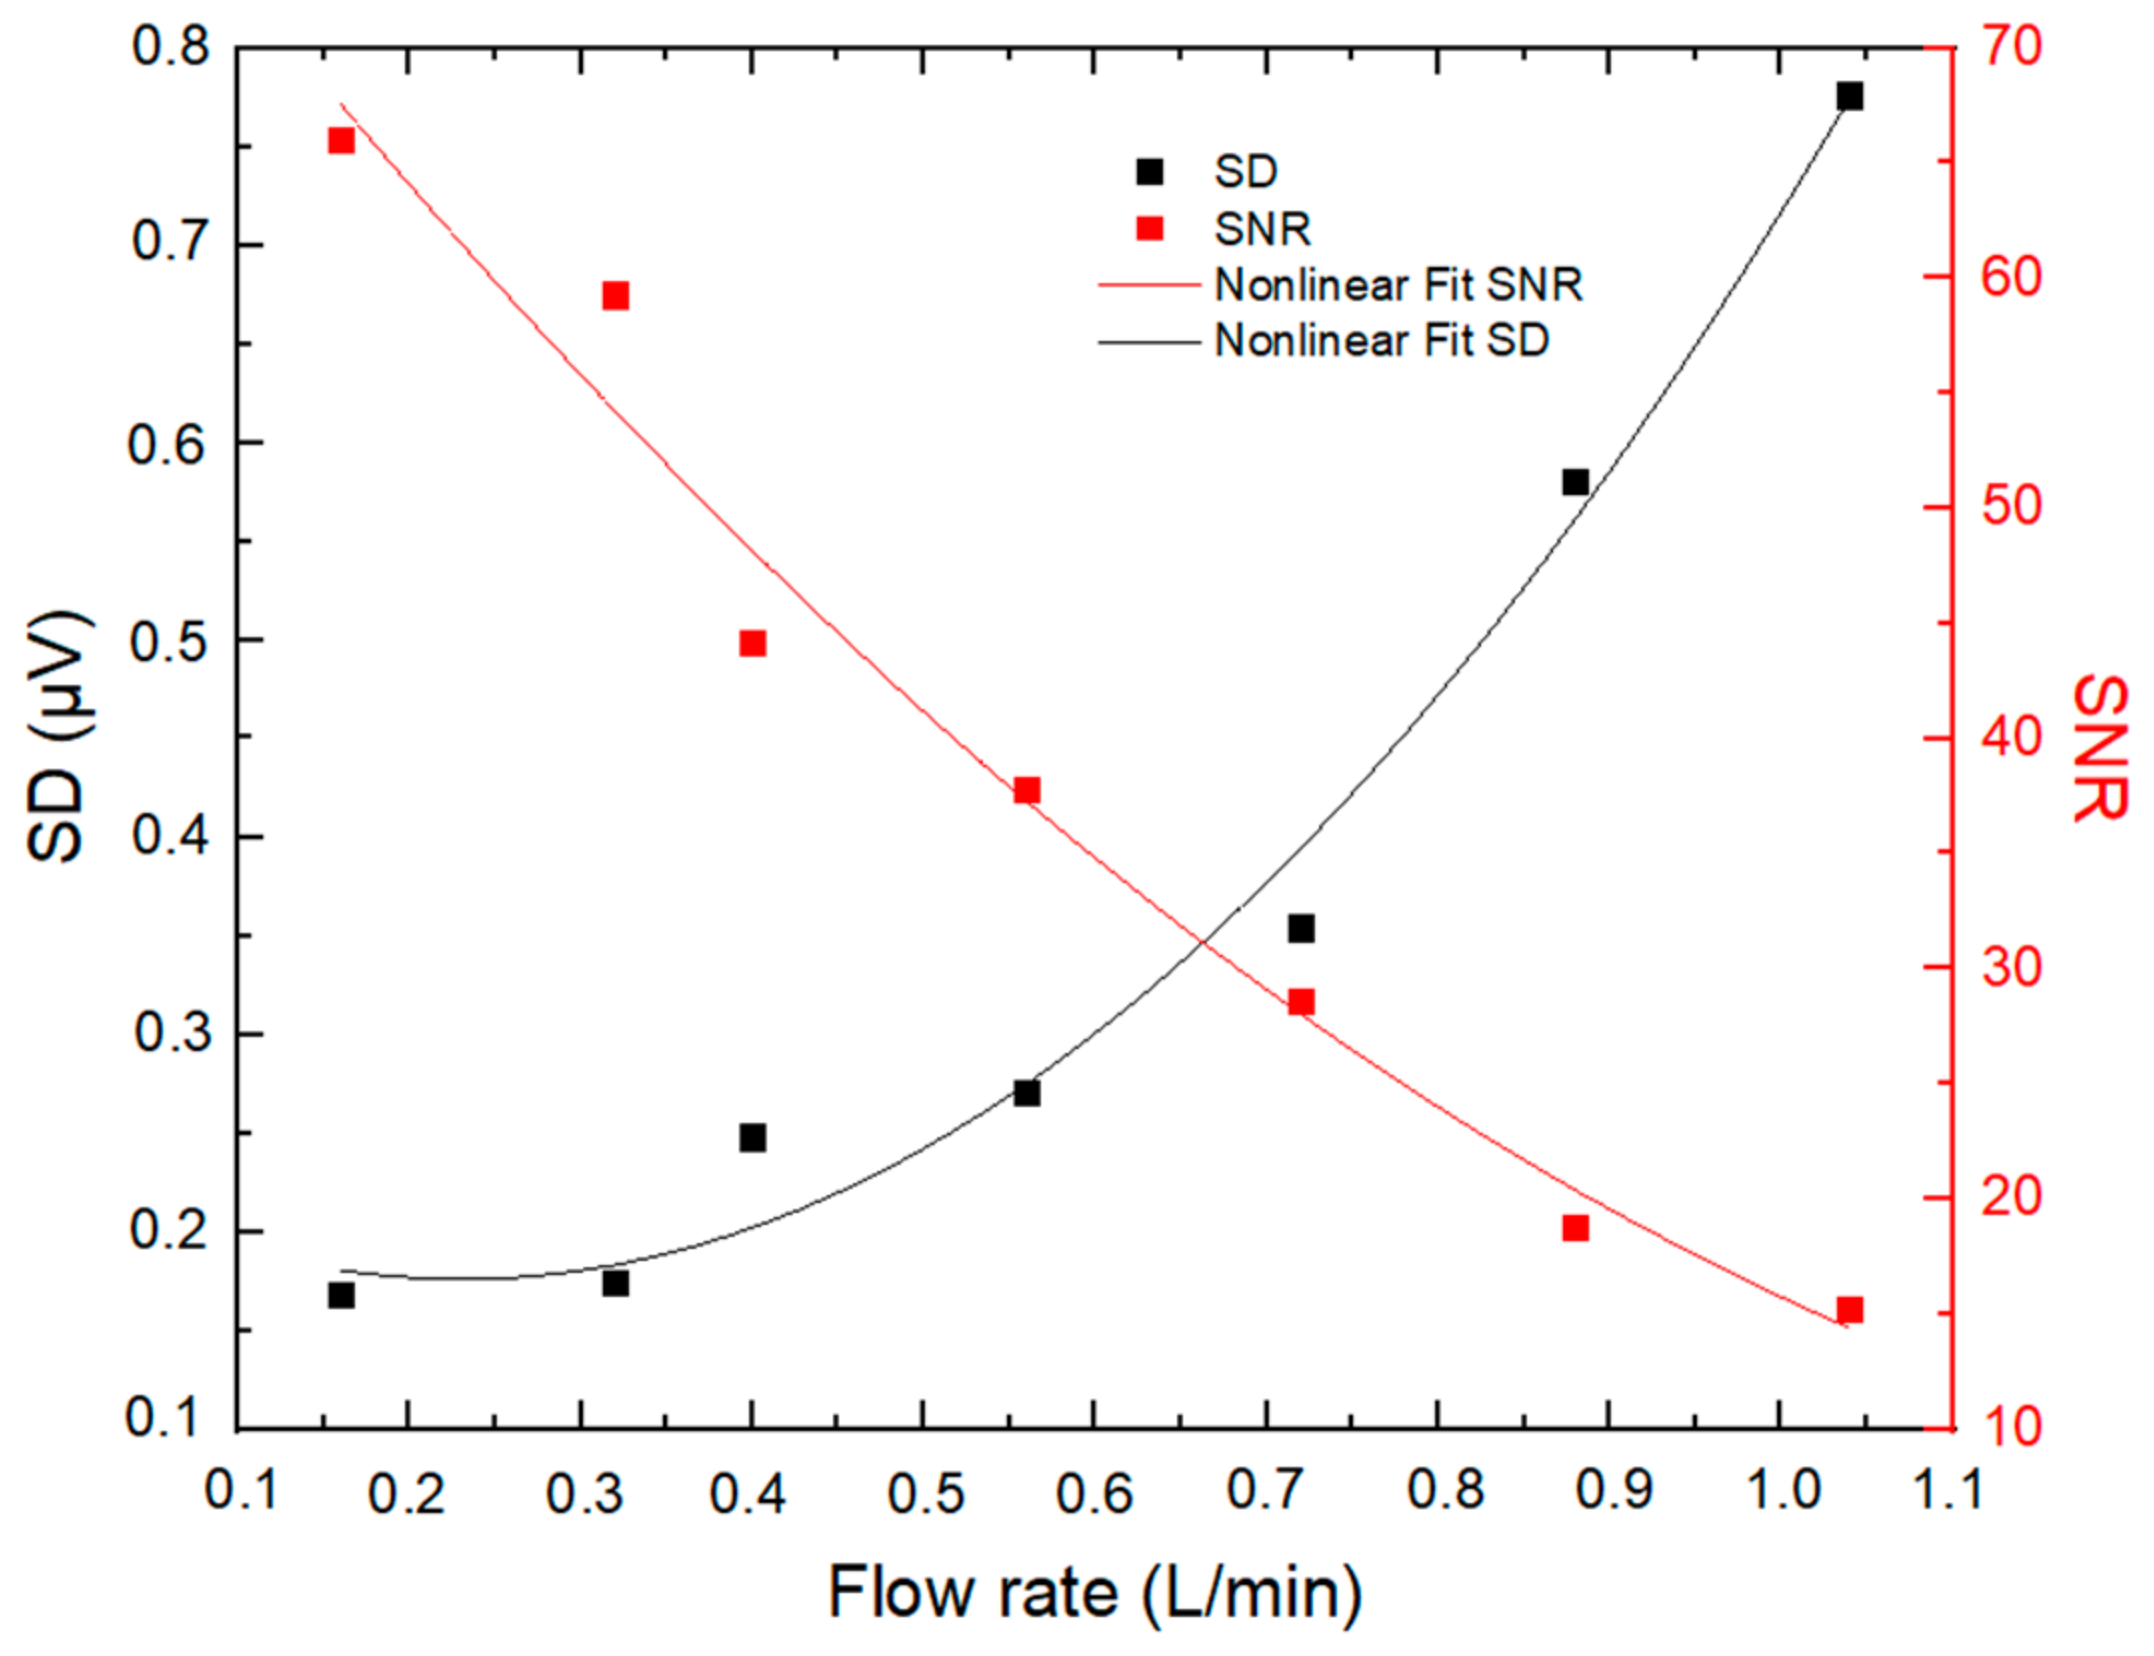
2.1.6. Sampling Flow Rate

For PA measurements regarding the majority of other measurement techniques, the noise level is the limiting factor to the quantification of low concentrations [19]. Several factors can contribute to the noise in PA measurements, one major contribution coming from acoustic noise generated from turbulence when air is sampled through the PA cell. The dependence of the noise level in PA signal (standard deviation, SD, observed during blank measurements) and the SNR of the PA signal on the sampling flow rate were investigated within the range of approximately 0.1–1 L min−1 using particle-filtered ambient air (RH = 33 ± 1%, T = 28 °C), as shown in Figure 4.
It has been noticed that noise increases with the flow rate in a nonlinear way, while the SNR exhibits inverse behavior, decreasing with higher flow rates. In this regard, it is essential to indicate that, in the PA system, above a certain value of the flow rate (typically about 0.5 L min−1 [19] and 0.4 L min−1 in our case), the flow becomes turbulent and generates large acoustic noise that degrades the SNR of the PA signal [20]. According to our investigation, a sampling flow rate of 0.32 L min−1 was selected as a good tradeoff between SNR and air residence time in the PA resonator (0.12 s).

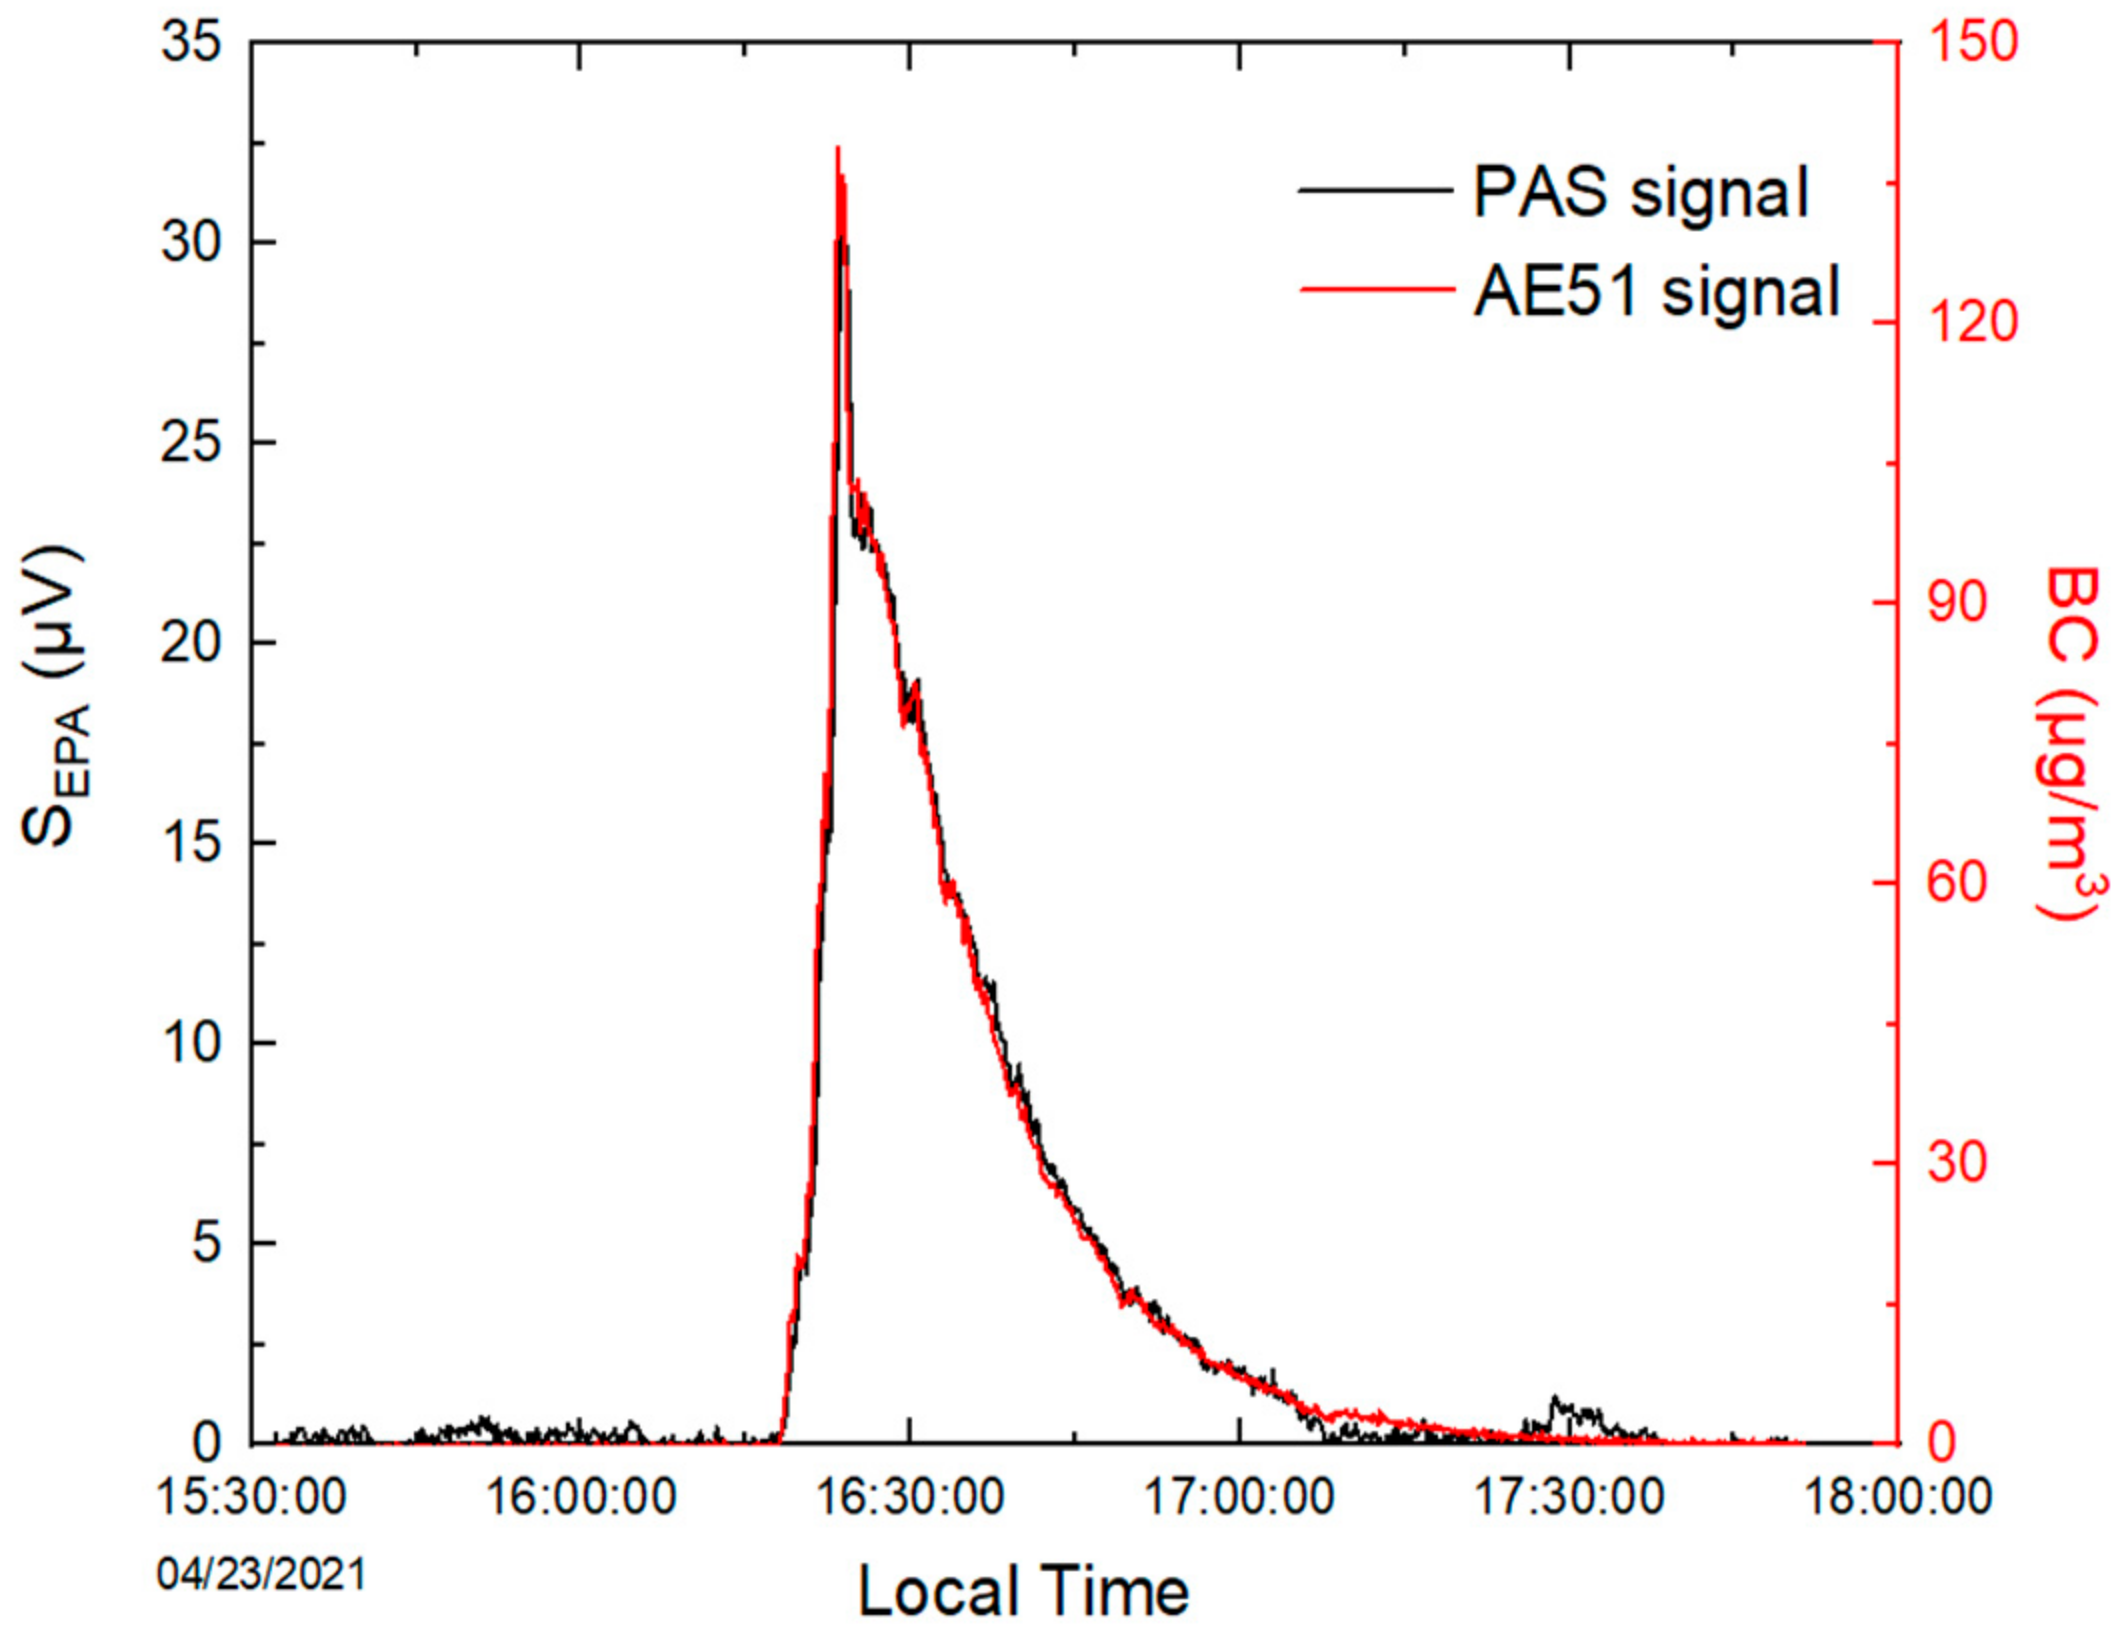
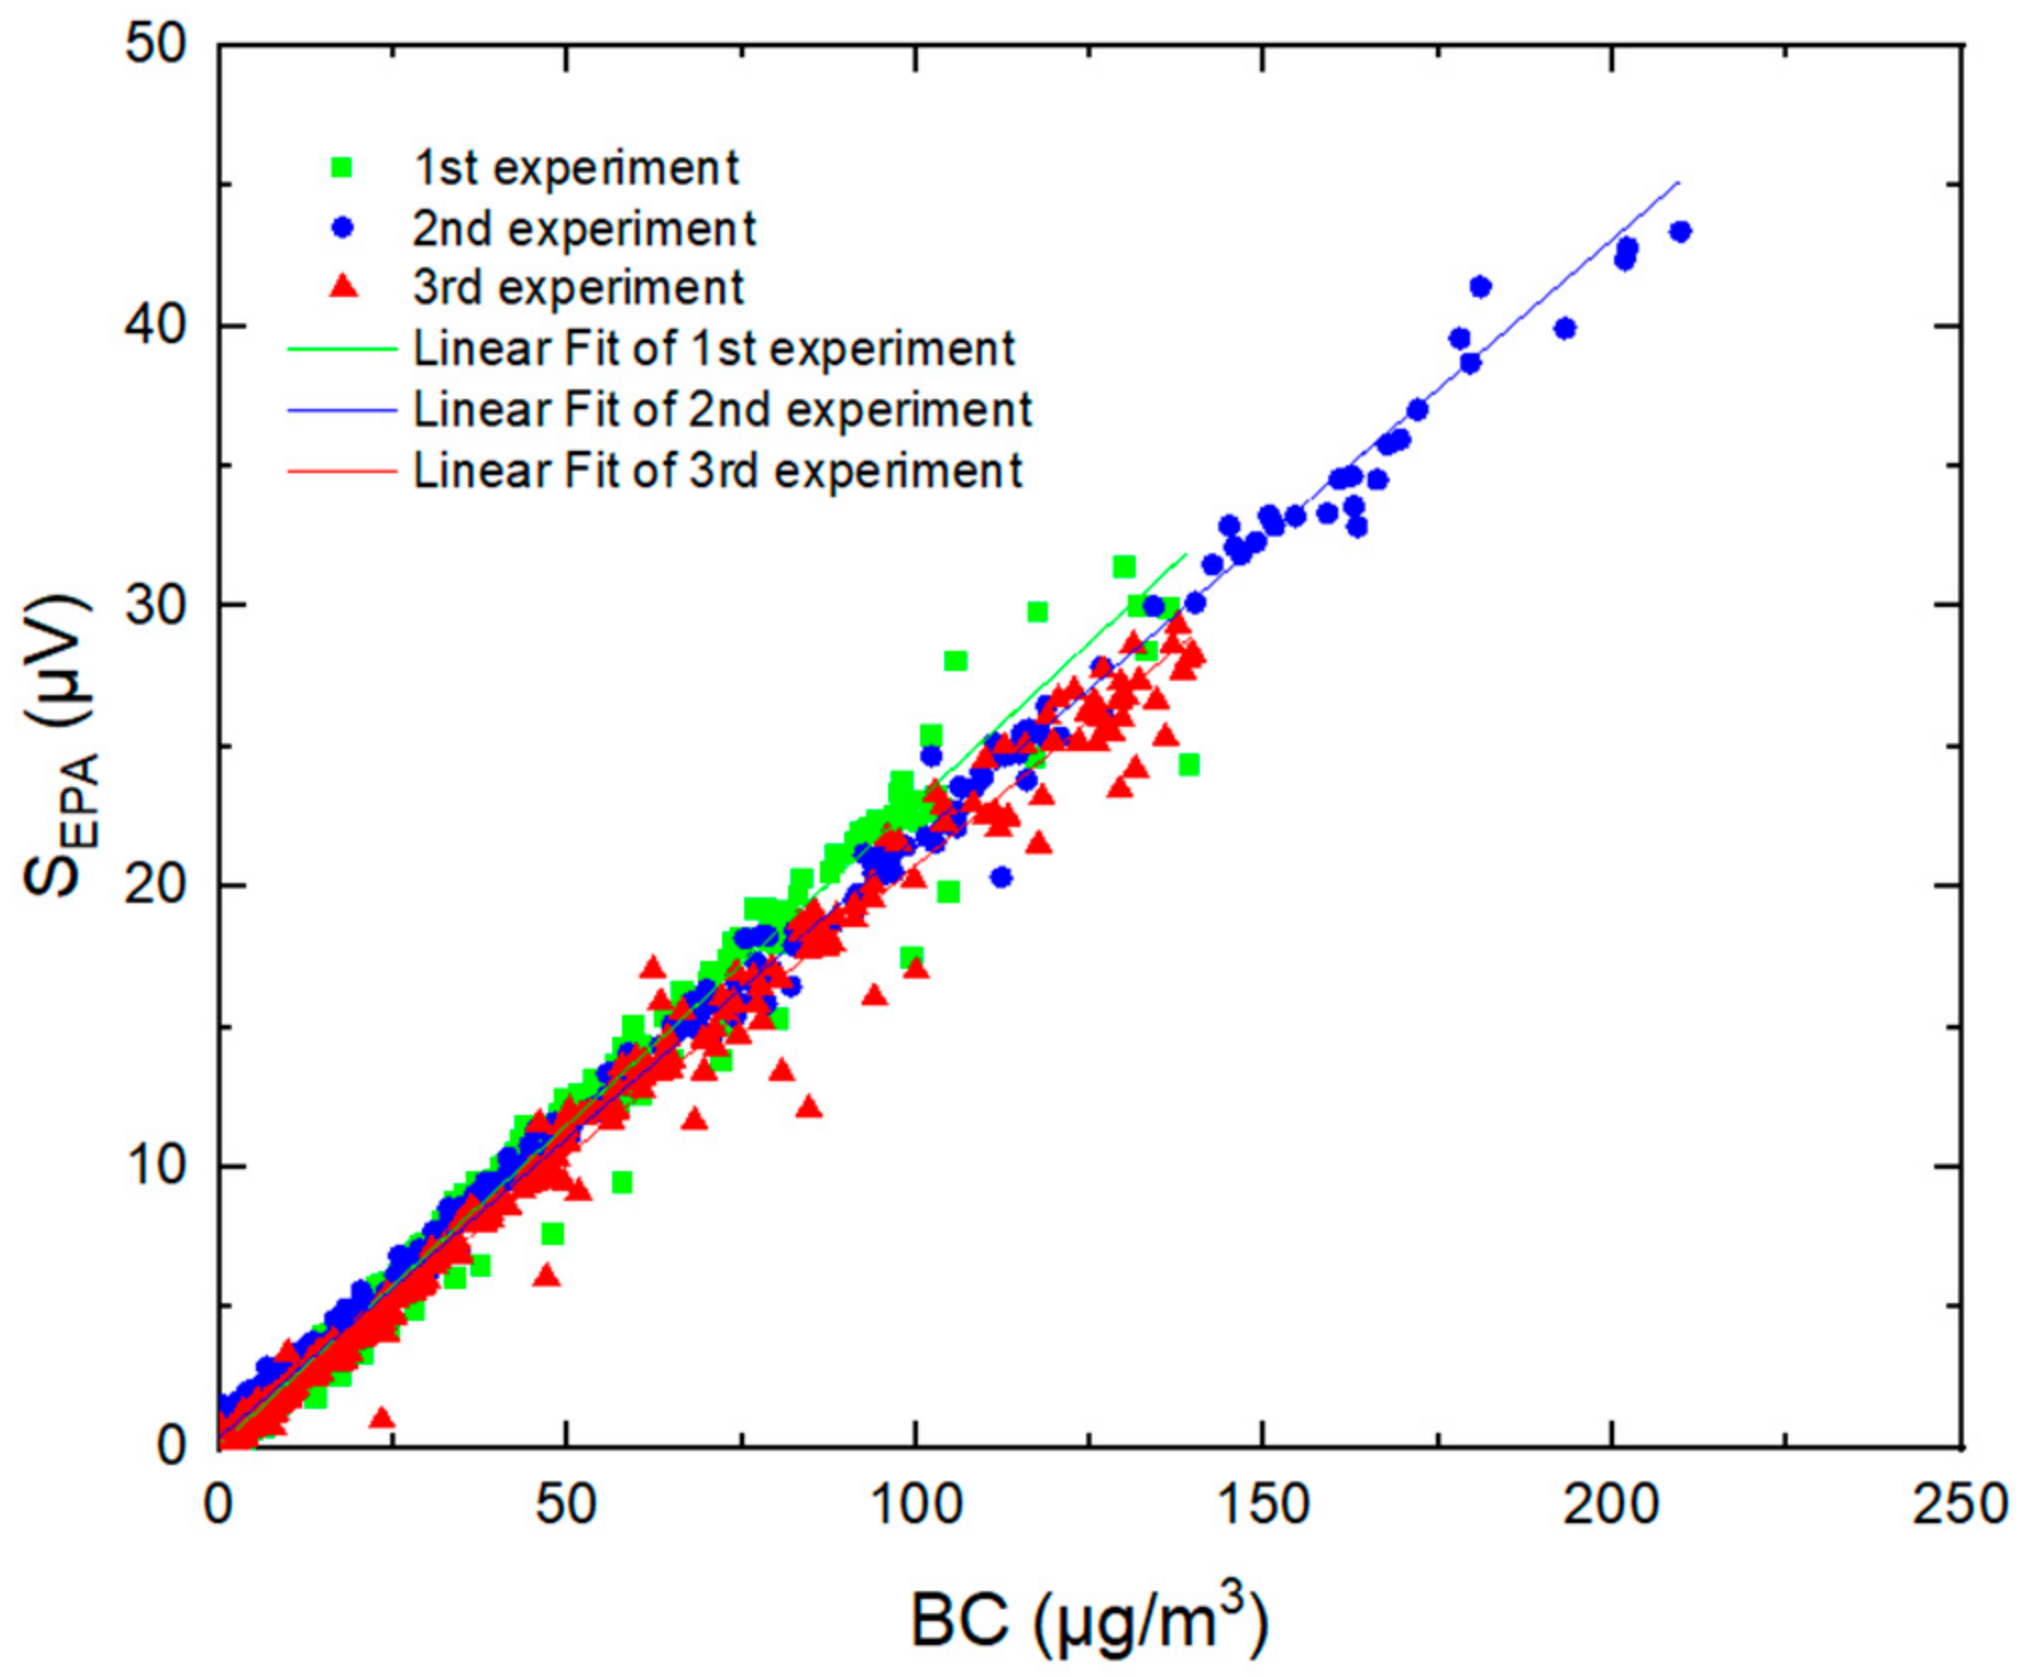
2.2. Evaluation of the PASS Performances

Side-by-side measurements of BC emitted from incense smoke have been performed using the PASS instrument and a reference aethalometer (microAeth, AE51). This experiment allowed for the following: (1) calibration of the PASS instrument; (2) checking of the linearity of the PA signal with BC concentration; (3) estimation of the limit of detection (LoD) of the PASS for BC measurements in ambient air.
Burning incense in indoor ambient air led to the formation of BC with concentrations ranging from 0 to 200 µg m−3. The reference aethalometer is a filter-based spectrometer operating at 880 nm. At 880 nm, the absorption is interpreted as BC deposition on the filter [18]. Its operation principle is based on optical measurement of light absorption by the particles collected on a filter. The BC concentration can be measured in the range of 0–1 mg m−3. A schematic presentation of the experimental setup is shown in Figure 5. The inlets of both PASS and aethalometer were connected to a Nafion dryer, where dry compressed air was injected in the countercurrent at a flow rate of 4 L min−1 in order to reduce RH and maintain its stability at approximately 20%. As mentioned above, this setup is required to avoid the impact of humidity changes on the PA signal.
To obtain the PA signal resulting only from BC absorption without the contribution of gas species in air, a two-channel measurement method (presented in Figure 6) was carried out: (1) channel one, equipped with a particle matter (PM) filter, allows for the measuring of the potential contribution of gas species in air and was considered for background measurements; (2) channel two, without a PM filter, allows for the measuring of the contribution of both BC and gas species in air. The difference in signal between the two channels represents the absorption of BC (SEPA in Figure 7).
Time series of PASS measurements for incense-generated BC at a time resolution of 1 s (averaged to 10 s) are shown in Figure 7, together with 10 s measurements from the aethalometer. The PA signal was found to be well correlated with BC concentrations measured by the AE51, with a linear regression coefficient of 0.99 in the range of LoD up to 200 μg m−3 (green plot Figure 8). The repeatability of the measurements was also evaluated by reproducing the same experiment two more times. Figure 8 shows good repeatability, with slopes ranging from 0.207 to 0.229 μV/(μg m−3).
The LoD was estimated using the following equation:
LoD = SD/SSlope
where Sslope (μV/(μg m−3)) is the slope of the linear regression between the PA signal and the BC concentration, also called sensitivity (shown in Figure 8). Using SD = 0.20 μV determined from blank measurements (RH = 21%, T = 24 °C) and slopes derived from the calibration experiments, the 1 σ minimum detectable mass concentration (SNR = 1) was evaluated to be in the range of 0.75–0.86 µg m−3 at a time resolution of 1 s (that can be enhanced to 0.1 μg.m−3 when working at a time resolution of 1 min). This limit of detection shows that the PASS instrument is suitable for measurements of BC in the troposphere, especially in areas where BC concentrations vary from 12 μg m−3 [29] to 60 μg m−3 [30].
Wavelength-dependent mass absorption coefficient (αMAC) of the incense particles can be estimated using the following equation:
α MAC = S slope P   ×   M   ×   C cell
where Sslope = 0.217 µV/(µg m−3) (derived from the average of the three fits in Figure 8) and P = 174 mW. The value of αMAC was determined to be 6.3 ± 0.44 m2 g−1, which corresponds to a minimum measurable absorption coefficient of 5.23 Mm−1 ± 0.36 (1 σ) (=LoD × αMAC).
The uncertainty associated with the mass absorption coefficient was derived from a quadratic propagation of errors from the precision of the PA signal, the power measurement accuracy, and errors associated to the cell constant and the fluctuations in BC concentrations. The latter was calculated from the aethalometer measurements using the following equation [31]:
Δ BC BC = ( Δ σ ATN σ ATN ) 2 + ( Δ A A ) 2 + ( Δ Q Q ) 2 + ( Δ dt dt ) 2 + 2 ( ( Δ I 0 I 0 ) ) 2 + 2 ( Δ I I ) 2
where Δ σ ATN σ ATN is the relative uncertainty from the attenuation cross section; it is assumed to be negligible for the microAeth® AE51 [31]. Δ A A = 2% is the uncertainty from the spot area on the filter [31]. Δ Q Q = 5% is the uncertainty related to the sampling flow rate [31]. Δ dt dt = 0% is the measurement time uncertainty [31]. Δ I 0 I 0 = 2.1% and Δ I I = 1.55% are, respectively, the uncertainties of the reference signal (= SD/mean of the reference signal) and the sensing signal (= SD/mean of the sensing signal of the entire measurement). The relative uncertainty from the fluctuation in BC concentration was evaluated to be 6.5%. The relative uncertainty in αMAC was found to be 6.9%, which corresponds to Δ αMAC = 0.44 m2 g−1.
The obtained values of the mass absorption coefficient and the minimum measurable absorption coefficient are in good agreement with those reported by [32] consisting of 7.5 ± 1.2 m2 g−1 and 6.23 ± 1 Mm−1, respectively.
However, the obtained results are higher than those calculated on the basis of a power law, as shown in the following equation [33]:
α MAC   =   k 0   ×   ( λ 500   nm ) AAE
where k0 (=7 ± 0.4 m2 g−1) is a constant including the aerosol mass concentration and AAE (=1.2 ± 0.4) is the Absorption Angstrom Exponent (an important parameter to characterize the variation of the aerosol absorption with respect to the wavelength). αMAC was found to be 3.55 ± 1.17 m2 g−1, corresponding to a minimum measurable absorption coefficient of 2.94 ± 0.97 Mm−1. The difference between the experimental values and the theoretical ones is likely due to a low fraction in the soot considered by the theoretical equation (valid for aerosols in general) [33].

3. Conclusions and Outlooks

A photoacoustic soot spectrophone operating at 880 nm was developed for the measurement of black carbon. This instrument has the advantage of low uncertainties compared to the filter-based techniques routinely used for aerosol measurements, and has a faster time resolution (1 s) compared to aethalometers (usually operating at 10 s).
The calibration of this instrument was performed by analyzing BC emitted from incense smoke using an aethalometer as a reference instrument. The sensitivity factor derived from these calibration experiments is 0.22 μV/(μg m−3). Taking into account the measurement noise, which was minimized through an optimization of the sampling flow rate and a reduction of RH in the sample, it has led to a 1 σ LoD (SNR = 1) of approximately 0.8 µg m−3 at a time resolution of 1 s. This LoD can be improved to 0.1 μg m−3 using a longer integration time of 1 min.
Further improvements in the sensitivity of the current PASS instrument can be achieved by increasing the number of microphones in the PA cell and using higher laser power. The RH effects can be further reduced using a longer and more efficient Nafion dryer.

Author Contributions

Conceptualization, W.C., G.W. and M.W.S.; methodology, W.C, G.A, T.N.B., A.T. and S.D.; validation, W.C., A.T. and S.D.; formal analysis, W.C., G.A., T.N.B., A.T., S.D., P.F., K.D. and S.H.N.; investigation, W.C., G.A., T.N.B., S.D. and A.T.; data curation, G.A., W.C., T.N.B., S.D., A.T., P.F., K.D. and S.H.N.; writing- original draft preparation, G.A.; writing—review and editing, G.A., W.C., S.D. and A.T.; supervision, W.C., A.T. and S.D.; project administration, W.C., funding acquisition, W.C. All authors have read and agreed to the published version of the manuscript.

Funding

This work is supported by the French national research agency (ANR) under MABCaM (ANR-166-CE04-0009) and LABEX-CaPPA (ANR-11-LABX-005-01), the CPER-CLIMIBIO and CPER-IRENE (project “PAS-NO2”) programs. Goufrane Abichou thanks the Region Hauts-de-France and IMT Nord Europe for PhD fundings.

Conflicts of Interest

The authors declare no conflict of interest.

References

  1. Zaelke, D. Primer on Short-Lived Climate Pollutants; IGSD: Washington, DC, USA, 2013. [Google Scholar]
  2. Boucher, O.; Randall, D.; Artaxo, P.; Bretherton, C.; Feingold, G.; Forster, P.; Kerminen, V.M.; Kondo, Y.; Liao, H.; Lohmann, U.; et al. Clouds and aerosols. In Climate Change 2013: The Physical Science Basis. Contribution of Working Group I to the Fifth Assessment Report of the Intergovernmental Panel on Climate Change; Cambridge University Press: Cambridge, UK, 2013; pp. 572–657. [Google Scholar]
  3. Bond, T.C.; Doherty, S.J.; Fahey, D.W.; Foster, P.M.; Berntsen, T.; DeAngelo, B.J.; Flanner, M.G.; Ghan, S.; Kärcher, B.; Koch, D.; et al. Bounding the role of black carbon in the climate system: A scientific assessment: Black carbon in the climate system. J. Geophys. Res. Atmos. 2013, 118, 5380–5552. [Google Scholar] [CrossRef]
  4. Black Carbon, Climate & Clean Air Coalition. Available online: https://www.ccacoalition.org (accessed on 15 September 2022).
  5. Yamaguchi, M.; Izuta, T. Effects of Black Carbon and Ammonium Sulfate Particles on Plants. In Air Pollution Impacts on Plants in East Asia; Izuta, T., Ed.; Springer: Tokyo, Japan, 2017; pp. 295–308. [Google Scholar] [CrossRef]
  6. Wang, G.; Shen, F.; Yi, H.; Hubert, P.; Deguine, A.; Petitprez, D.; Maamary, R.; Augustin, P.; Fourmentin, M.; Fertein, E.; et al. Laser absorption spectroscopy applied to monitoring of hort-lived climate pollutants (SLCPs). J. Mol. Spectrosc. 2018, 348, 142–151. [Google Scholar] [CrossRef]
  7. Boparai, P.; Lee, J.; Bond, T.C. Revisiting Thermal-Optical Analyses of Carbonaceous Aerosol Using a Physical Model. Aerosol Sci. Technol. 2008, 42, 930–948. [Google Scholar] [CrossRef]
  8. Schulz, C.; Kock, B.F.; Hofmann, M.; Michelsen, H.; Will, S.; Bougie, B.; Suntz, R.; Smallwood, G. Laser-induced incandescence: Recent trends and current questions. Appl. Phys. B 2006, 83, 333–354. [Google Scholar] [CrossRef]
  9. Müller, T.; Henzing, J.S.; de Leeuw, G.; Wiedensohler, A.; Alastuey, A.; Angelov, H.; Bizjak, M.; Coen, M.C.; Engström, J.E.; Gruening, C.; et al. Characterization and intercomparison of aerosol absorption photometers: Result of two intercomparison workshops. Atmos. Meas. Tech. 2011, 4, 245–268. [Google Scholar] [CrossRef]
  10. Schmid, O.; Artaxo, P.; Arnott, W.P.; Chand, D.; Gatti, L.V.; Frank, G.P.; Hoffer, A.; Schnaiter, M.; Andreae, M.O. Spectral light absorption by ambient aerosols influenced by biomass burning in the Amazon Basin. I: Comparison and field calibration of absorption measurement techniques. Atmos. Chem. Phys. 2006, 20, 3443–3462. [Google Scholar] [CrossRef]
  11. Wang, G.; Kulinski, P.; Hubert, P.; Deguine, A.; Petitprez, D.; Crumeyrolle, S.; Fertein, E.; Deboudt, K.; Flament, P.; Sigrist, M.W.; et al. Filter-free light absorption measurement of volcanic ashes and ambient particulate matter using multi-wavelength photoacoustic spectroscopy. PIER 2019, 166, 59–74. [Google Scholar] [CrossRef]
  12. Petzold, A.; Niessner, R. Photoacoustic soot sensor for in-situ black carbon monitoring. Appl. Phys. B 1996, 63, 191–197. [Google Scholar] [CrossRef]
  13. Beck, H.A.; Niessner, R.; Haisch, C. Development and characterization of a mobile photoacoustic sensor for on-line soot emission monitoring in diesel exhaust gas. Anal. Bioanal. Chem. 2003, 375, 1136–1143. [Google Scholar] [CrossRef]
  14. Arnott, W.P.; Walker, J.W.; Moosmüller, H.; Elleman, R.A.; Jonsson, H.H.; Buzorius, G.; Conant, W.C.; Flagan, R.C.; Seinfeld, J.H. Photoacoustic insight for aerosol light absorption aloft from meteorological aircraft and comparison with particle soot absorption photometer measurements: DOE Southern Great Plains climate research facility and the coastal stratocumulus imposed perturbation experiments. J. Geophys. Res. 2006, 111, D05S02. [Google Scholar] [CrossRef]
  15. Lack, D.A.; Richardson, M.S.; Law, D.; Langridge, J.M.; Cappa, C.D.; McLanghlin, R.J.; Murphy, D.M. Aircraft Instrument for Comprehensive Characterization of Aerosol Optical Properties, Part 2: Black and Brown Carbon Absorption and Absorption Enhancement Measured with Photo Acoustic Spectroscopy. Aerosol Sci. Technol. 2012, 46, 555–568. [Google Scholar] [CrossRef]
  16. Lewis, K.; Arnott, W.P.; Moosmüller, H.; Wold, C.E. Strong spectral variation of biomass smoke light absorption and single scattering albedo observed with a novel dual-wavelength photoacoustic instrument. J. Geophys. Res. 2008, 113, D16203. [Google Scholar] [CrossRef]
  17. Hamasha, K.M.; Arnott, W.P. Photoacoustic measurements of black carbon light absorption coefficients in Irbid city, Jordan. Environ. Monit. Assess. 2010, 166, 485–494. [Google Scholar] [CrossRef]
  18. Kirchstetter, T.W.; Novakov, T.; Hobbs, P.V. Evidence that the spectral dependence of light absorption by aerosols is affected by organic carbon: Spectral light absorption by aerosols. J. Geophys. Res. 2004, 109, D21208. [Google Scholar] [CrossRef]
  19. Miklós, A.; Hess, P.; Bozóki, Z. Application of acoustic resonators in photoacoustic trace gas analysis and metrology. Rev. Sci. Instrum. 2001, 72, 1937–1955. [Google Scholar] [CrossRef]
  20. Ajtai, T.; Filep, Á.; Schnaiter, M.; Linke, C.; Vragel, M.; Bozóki, Z.; Szabó, G.; Leisner, T. A novel multi−wavelength photoacoustic spectrometer for the measurement of the UV–vis-NIR spectral absorption coefficient of atmospheric aerosols. J. Aerosol Sci. 2010, 41, 1020–1029. [Google Scholar] [CrossRef]
  21. Bozóki, Z.; Pogány, A.; Szabó, G. Photoacoustic Instruments for Practical Applications: Present, Potentials, and Future Challenges. Appl. Spectrosc. Rev. 2011, 46, 1–37. [Google Scholar] [CrossRef]
  22. Arnott, W.P.; Moosmüller, H.; Walker, J.W. Nitrogen dioxide and kerosene-flame soot calibration of photoacoustic instruments for measurement of light absorption by aerosols. Rev. Sci. Instrum. 2000, 71, 4545. [Google Scholar] [CrossRef]
  23. Nakayama, T.; Suzuki, H.; Kagamitani, S.; Ikeda, Y.; Uchiyama, A.; Matsumi, Y. Characterization of a Three Wavelength Photoacoustic Soot Spectrometer (PASS-3) and a Photoacoustic Extinctiometer (PAX). J. Meteorol. Soc. Jpn. 2015, 93, 285–308. [Google Scholar] [CrossRef] [Green Version]
  24. Linke, C.; Ibrahim, I.; Schleicher, N.; Hitzenberger, R.; Andreae, M.O.; Leisner, T.; Schnaiter, M. A novel single-cavity three-wavelength photoacoustic spectrometer for atmospheric aerosol research. Atmos. Meas. Tech. 2016, 9, 5331–5346. [Google Scholar] [CrossRef]
  25. Fischer, D.A.; Smith, G.D. A portable, four-wavelength, single-cell photoacoustic spectrometer for ambient aerosol absorption. Aerosol Sci. Technol. 2018, 52, 393–406. [Google Scholar] [CrossRef]
  26. Vandaele, A.C.; Hermans, C.; Simon, P.C.; Carleer, M.; Colin, R.; Fally, S.; Mérienne, M.F.; Jenouvrier, A.; Coquart, B. Measurements of the NO2 absorption cross-section from 42,000 cm−1 to 10,000 cm−1 (238–1000 nm) at 220 K and 294 K. J. Quant. Spectrosc. Radiat. Transf. 1998, 59, 171–184. [Google Scholar] [CrossRef]
  27. Kosterev, A.A.; Mosely, T.S.; Tittel, F.K. Impact of humidity on quartz-enhanced photoacoustic spectroscopy based detection of HCN. Appl. Phys. B 2006, 85, 295–300. [Google Scholar] [CrossRef]
  28. Lang, B.; Breitegger, P.; Brunnhofer, G.; Valero, J.P.; Schweighart, S.; Klug, A.; Hassler, W.; Bergmann, A. Molecular relaxation effects on vibrational water vapor photoacoustic spectroscopy in air. Appl. Phys. B. 2020, 126, 64. [Google Scholar] [CrossRef]
  29. Babu, S.S.; Moorthy, K.K.; Manchanda, R.K.; Sinha, P.R.; Satheesh, S.K.; Vajja, D.P.; Srinivasan, S.; Kumar, V.H.A. Free tropospheric black carbon aerosol measurements using high altitude balloon: Do BC layers build “their own homes” up in the atmosphere? Geophys. Res. Lett. 2011, 38, L08803. [Google Scholar] [CrossRef]
  30. Chilinski, M.T.; Markowicz, K.M.; Markowicz, J. Observation of vertical variability of black carbon concentration in lower troposphere on campaigns in Poland. Atmos. Environ. 2016, 137, 155–170. [Google Scholar] [CrossRef]
  31. Lee, J. Performance Test of MicroAeth® AE51 at Concentrations Lower than 2 μg/m3 in Indoor Laboratory. Appl. Sci. 2019, 9, 2766. [Google Scholar] [CrossRef]
  32. Bond, T.C.; Bergstrom, R.W. Light Absorption by Carbonaceous Particles: An Investigative Review. Aerosol Sci. Technol. 2006, 40, 27–67. [Google Scholar] [CrossRef]
  33. Radney, J.G.; Zangmeister, C.D. Measurement of Gas and Aerosol Phase Absorption Spectra across the Visible and Near-IR Using Supercontinuum Photoacoustic Spectroscopy. Anal. Chem. 2015, 87, 7356–7363. [Google Scholar] [CrossRef]
Figure 1. Schematic of the PASS instrument for BC measurements.
Molecules 27 06065 g001
Figure 2. Dependence of the PA signal on the modulation frequency.
Molecules 27 06065 g002
Figure 3. Time series of PAS measurements from filtered ambient air, dry compressed air, and dried and filtered ambient air.
Molecules 27 06065 g003
Figure 4. Dependence of the PA noise (Standard Deviation—SD of 1 s blank measurements) and SNR of the PA signal on the sampling flow rate.
Molecules 27 06065 g004
Figure 5. Schematic of the experimental setup for the measurement of incense generated BC with the PASS instrument and the reference aethalometer (AE51).
Molecules 27 06065 g005
Figure 6. Schematic representation of the 2-channel measurement approach.
Molecules 27 06065 g006
Figure 7. Time series of measurements for incense-generated BC by PASS and AE51.
Molecules 27 06065 g007
Figure 8. PA signals from the PASS versus BC mass concentrations measured by the AE51 during three experiences.
Molecules 27 06065 g008
Publisher’s Note: MDPI stays neutral with regard to jurisdictional claims in published maps and institutional affiliations.

