Article

Interaction between Heavy Water and Single-Strand DNA: A SERS Study

1
College of Pharmacy, Naval Medical University, Shanghai 200433, China
2
College of Pharmacy, Fujian University of Traditional Chinese Medicine, Fuzhou 350122, China
3
College of Basic Medical Sciences, Naval Medical University, Shanghai 200433, China
4
Shanghai Key Laboratory for Pharmaceutical Metabolite Research, Naval Medical University, Shanghai 200433, China
*
Author to whom correspondence should be addressed.
Molecules 2022, 27(18), 6023; https://doi.org/10.3390/molecules27186023
Submission received: 30 July 2022 / Revised: 3 September 2022 / Accepted: 9 September 2022 / Published: 15 September 2022
(This article belongs to the Section Molecular Structure)

Abstract

:
The structure and function of biological macromolecules change due to intermolecular deuterium bond formation or deuterium substitution with environmental D2O. In this study, surface-enhanced Raman spectroscopy (SERS) was used to detect interaction sites between D2O and ssDNA and their action mechanisms. SERS peaks of ssDNA changed with increasing D2O proportions, and the site of action mainly involved A and G bases, whose number strengthened the interaction between sequences and D2O and hence the SERS peak intensities. Fixing the number of A and G bases prevented changes in their positions from significantly altering the map. We also identified the interaction between ssDNA sequences that easily formed a G-quadruplex structure and D2O. The amplitude of the SERS peak intensity change reflected the ssDNA structural stability and number of active sites. These findings are highly significant for exploring genetic exchanges and mutations and could be used to determine the stability and structural changes of biological macromolecules.

Graphical Abstract

1. Introduction

Heavy water (D2O) impacts the metabolism of organisms, and its consumption is hazardous to humans. Microbes and fish cannot survive in pure D2O or water containing a high proportion of D2O (>80%) and can die within hours of exposure. In contrast, light water with very little D2O, such as melted snow, stimulates biological growth. D2O is not believed to be toxic, but certain processes such as mitosis [1] require light water, and therefore, drinking only D2O can be detrimental to health. As D2O has an additional neutron, the mass of deuterium atoms in D2O is twice that of the hydrogen atoms in light water, which changes its properties. The various bonds formed by deuterium atoms are stronger than those of hydrogen atoms; for example, deuterium hydrogen bonds are 5% stronger than hydrogen bonds [2]. Furthermore, the transfer rate of the heavier deuterium atoms is much slower than that of hydrogen atoms, which slows down the biochemical reaction of deuterium atoms, interfering with the normal metabolism of organisms.
The metabolic process of DNA, the main genetic material of living organisms, is also affected by D2O. Presently, research on the effects of D2O on DNA, which has mainly focused on D2O as an isotope tracer, has revealed the metabolic kinetics of DNA by detecting the formed C-D bond [3,4]. Alternatively, adding an appropriate amount of D2O to the biological culture enables the elucidation of the effect of D2O on DNA metabolism by detecting changes in the metabolite levels or in the cell proliferation rate [5,6]. Drinking deuterium-depleted water has also been reported to reduce the breakage of single-stranded DNA (ssDNA) [7]. To date, studies have focused on examining the effect of D2O as a raw material for the synthesis of DNA and metabolic activities. D2O is used by organisms as a raw material in the synthesis of DNA, thereby affecting DNA replication and transcription processes. Furthermore, when DNA is placed in a D2O-containing environment, these molecules have a “weak interaction” that causes some groups to vibrate and chemical bond energy to change, which, in turn, affects the structure and function of DNA.
The effects of D2O on the stability of biomolecules are likely mediated by the following two mechanisms: one is the “solvent isotope effect”, where the hydrogen bond network in D2O is stronger than that in light water. The other mechanism is the “deuterium isotope effect”, which is caused by H/D isotope exchange between biomolecules and D2O [8]. D2O is 23% more viscous than H2O, which is important at the nanometer scale because the dynamic behavior of biomolecular machines is dominated by Brownian motion and solvent viscosity [9]. For double-stranded DNA (dsDNA), aromatic π-π stacking and hydrogen bonding between bases are the two key interactive forces that stabilize the double helix structure of DNA [10].
D2O affects hydrogen bonds; due to the rapid exchange of hydrogen and deuterium atoms, deuterium atoms are introduced into the double helix hydrogen bond structure of the DNA molecule [11]. This process affects the reading time of stored genetic information (the ratio of reading time of stored genetic information before and after hydrogen–deuterium exchange was 0.43), especially by changing the state of the genetic material (the “on” and “off” states of individual base pairs in DNA molecules) [11]. Replacing hydrogen atoms with deuterium atoms in the hydrogen bonds between the nitrogen base pairs of DNA molecules changes the frequency of the open states [12]. The frequency of open states is critical to molecular functionality, including promoting DNA–protein interactions between specific molecules during transcription, folding, and replication [12]. The probability of an open state between nitrogen bases in dsDNA depends on the concentration of deuterium in the liquid medium surrounding the molecule and the energy generated during hydrogen bond breakage [11]. The action of D2O on RNA is also mediated by the solvent isotope and deuterium isotope effects. The polyanionic nature of RNA induces a strong interaction with water, both H2O and D2O, destroying the stability of the folded configuration. However, it also prolongs the water bridge between residues, generating stronger water–water hydrogen bonds, which, in turn, penetrate the extended hydration shell of the RNA, producing a weaker RNA–water movement coupling, thereby providing stability [8]. After the hydrogen–deuterium exchange between RNA and D2O, the RNA stability is relatively increased because of the increase in the bond energy and overall mass of the chemical bond formed by the deuterium atoms.
Although exploring the interaction between D2O and ssDNA is essential, only a few studies have focused on their interactions [13,14]. Surface-enhanced Raman spectroscopy (SERS) is an ultra-sensitive molecular detection method that generates strong Raman scattering signals when the molecules are close to the rough surface of precious metals [15,16]. Numerous studies, such as those by Papadopoulou and Xu [17,18,19], have used SERS to detect and analyze DNA. Li [20] detected ssDNA sequences that could form G-quadruplex structures and further identified different G-quadruplex structures. Song [21] used Raman-Deuterium Isotope Probing (Raman-DIP) to identify antibiotic-resistant super bacteria in the Thames River. However, the study of D2O–ssDNA interactions based on SERS has not yet been reported.
The study of the interaction between D2O and ssDNA is of significance, as it can provide information on the effects of D2O on processes such as DNA replication and transcription; it also provides new insights into methods for the preservation, transportation, and stability research of oligonucleotide drugs (such as antisense oligonucleotides that contain ssDNA sequences). Therefore, in this study, SERS was used to explore the direct interaction between D2O and ssDNA. Furthermore, we identified and explored the sites and mechanism of action of both molecules and provided a relatively comprehensive description of the structural and functional changes of DNA exposed to D2O. To this end, the influence of D2O on the physiologically significant G-quadruplex structure was explored, which identified some potential mechanisms of the effect of D2O on ssDNA.

2. Results and Discussion

2.1. Detection of Random Sequences and Pure Base Sequences

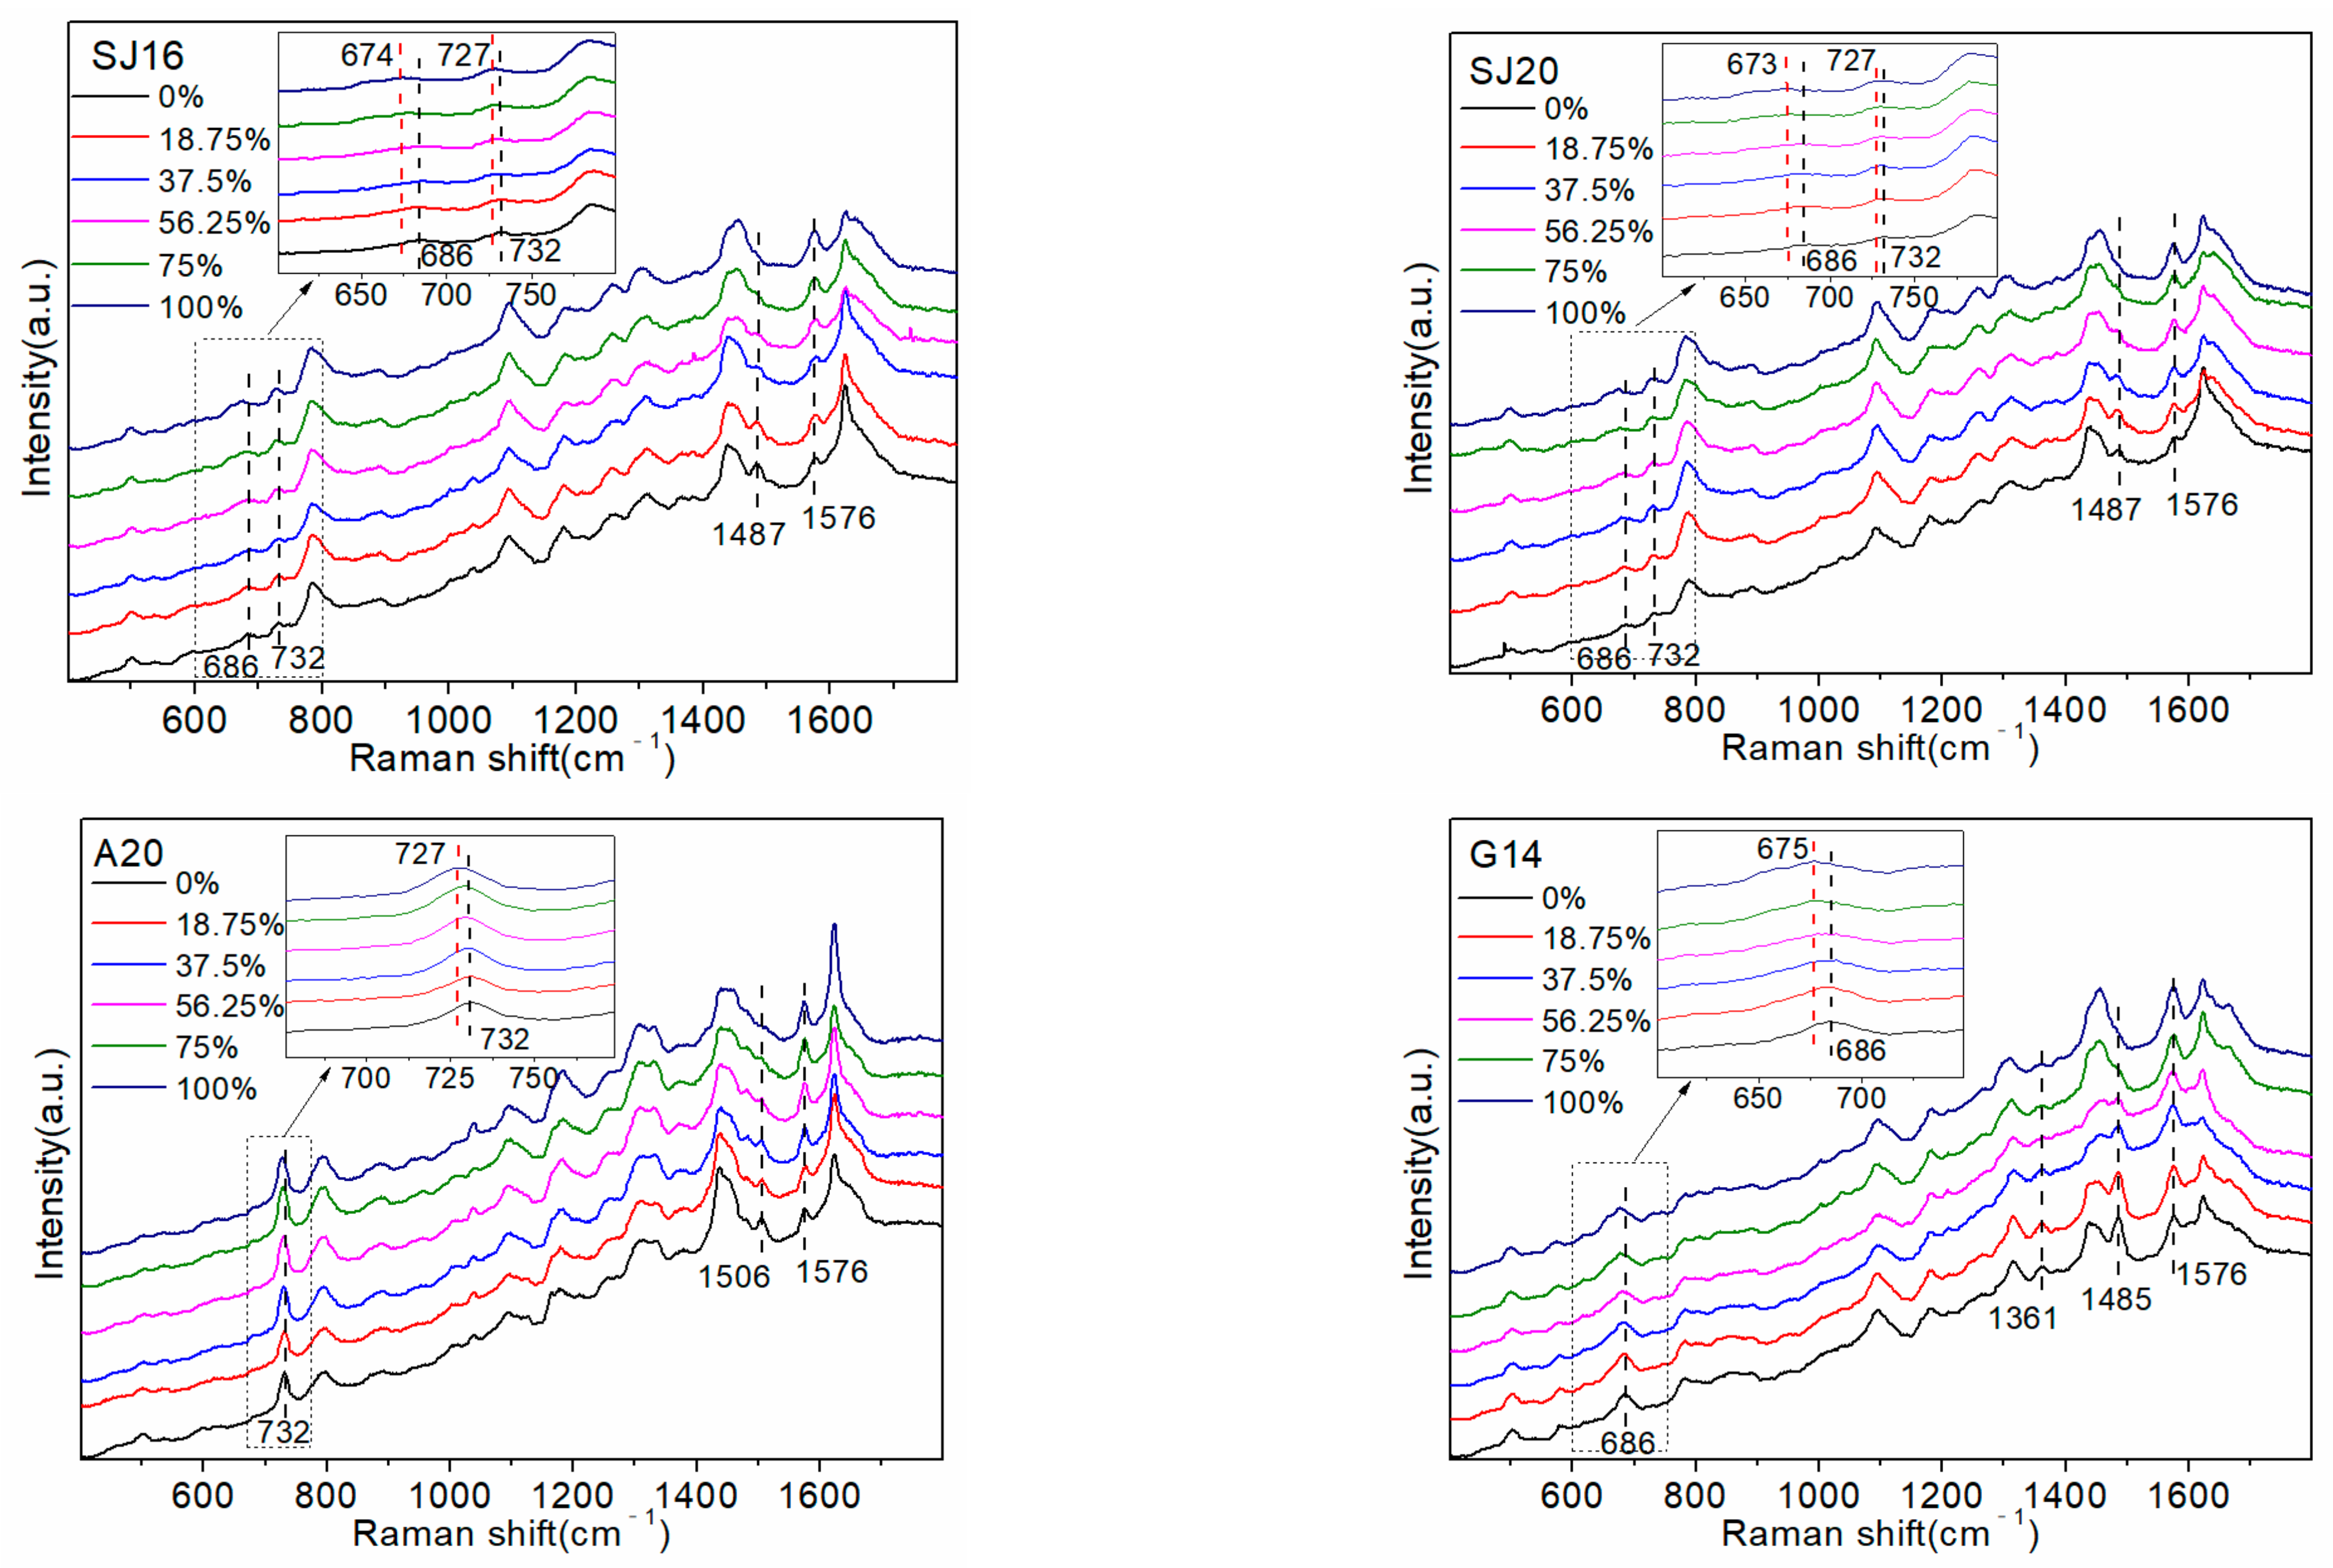
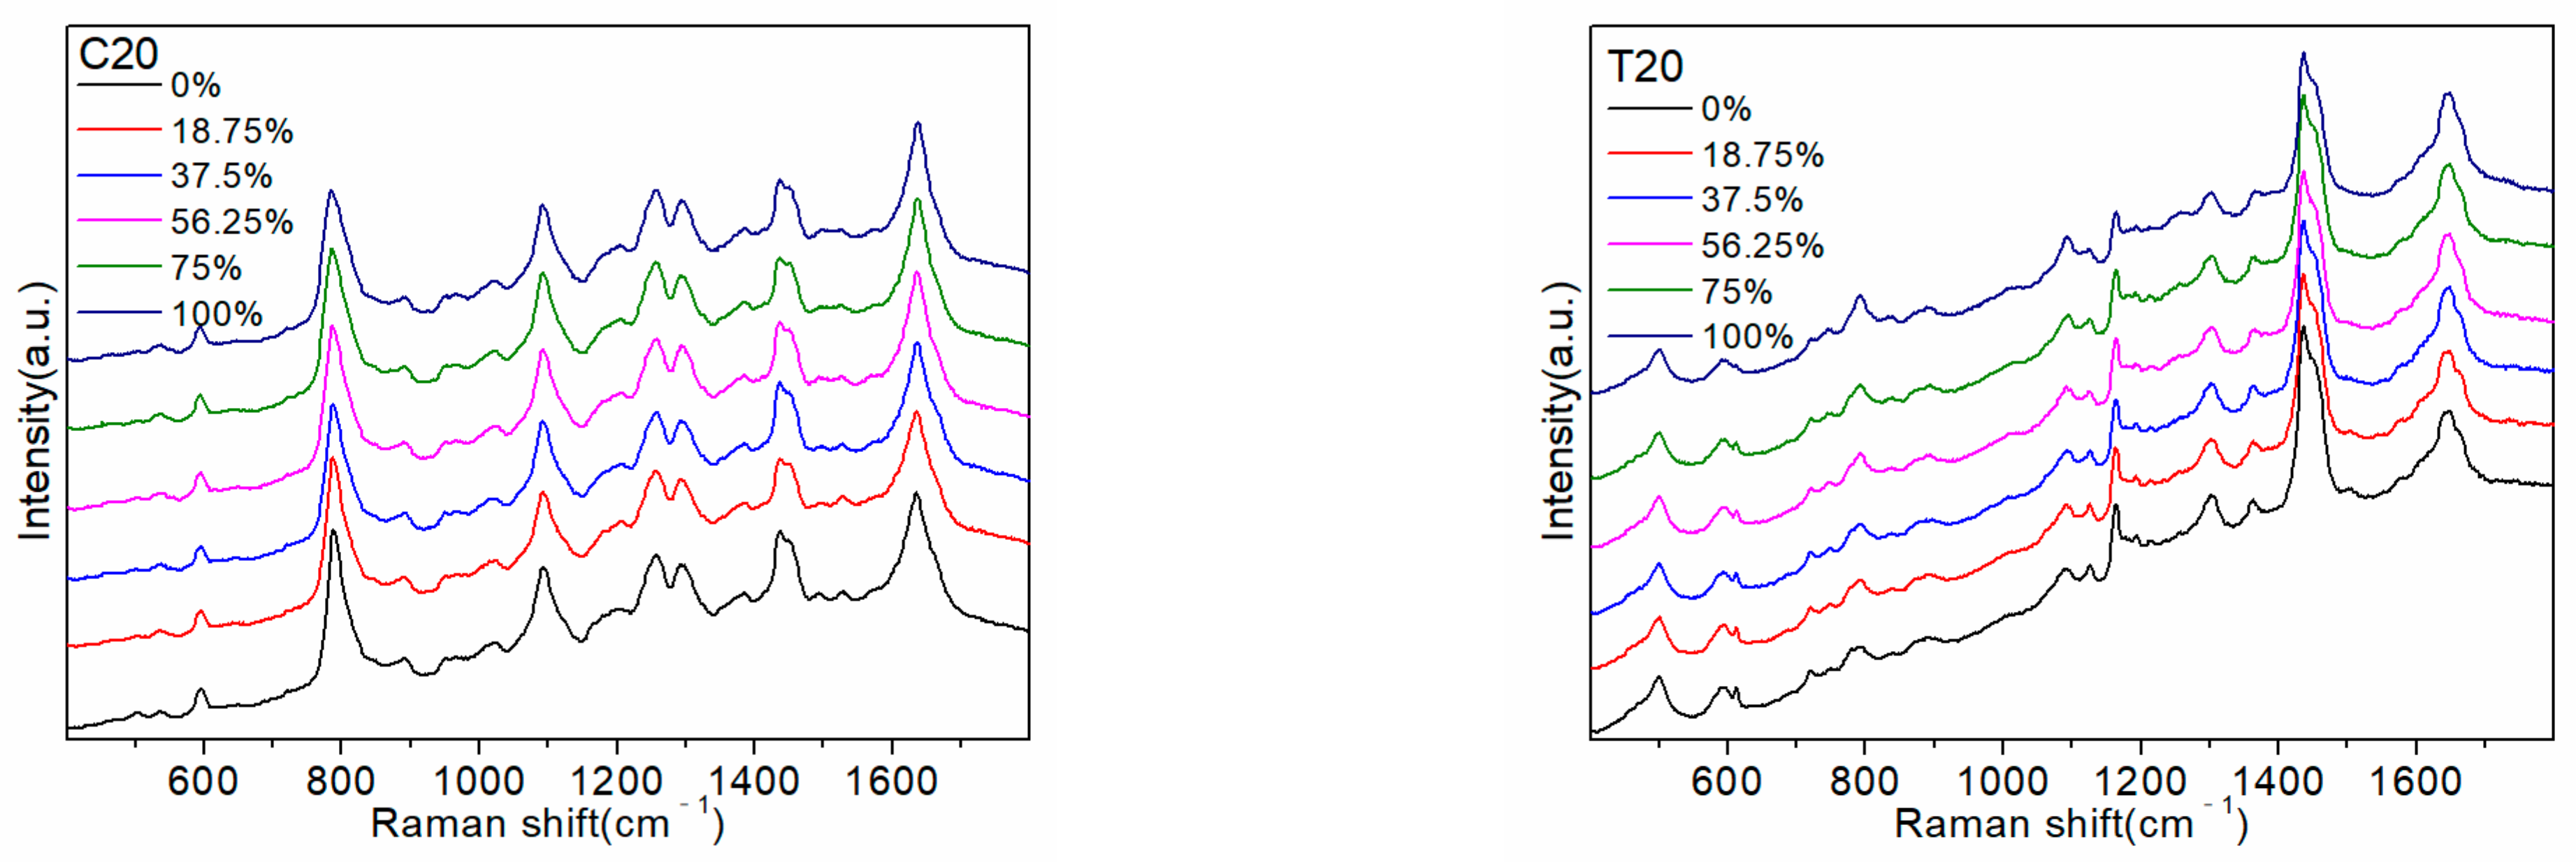
To explore the interaction between D2O and ssDNA, two random sequences, SJ16 and SJ20, were detected first. The specific sequences SJ16 and SJ20 represent are shown in Table 1. Subsequently, pure base sequences A20, G14 (the number of consecutive G bases did not exceed 14), C20, and T20 were detected to attribute the SERS peaks and determine the common active sites between them. The results are shown in Figure 1.
Replacing the atoms of the molecular vibrating group with their isotopes shifted the vibration frequency and changed the spectral intensity. Figure 1 shows the 686 cm−1 signal belonging to the G base ring respiratory vibration peak [19,22,23], which gradually shifted to 675 cm−1 as the D2O proportion increased. This likely occurred because some hydrogen atoms in the G base were replaced by deuterium atoms, which increased the overall mass, reduced the vibration frequency, and caused a red shift in the peak. The peak at 732 cm−1 was attributed to the A base ring respiratory vibration peak [19,23,24], which gradually decreased with the increase in the proportion of D2O, and the frequency shifted to 727 cm−1 (100% D2O).
The decrease in the intensity of the peak at 732 cm−1 occurred because D2O has a higher viscosity than ordinary water, making it more conducive to nucleic acid folding [8]. Therefore, the A base is squeezed by the surrounding groups, its ring breathing vibration is affected, and the peak intensity is weakened. The frequency shift is affected by the H/D isotope exchange, which increases the overall mass and decreases the vibration frequency. Therefore, there was a slight red shift in the peak position. In the pure A base, the peak at 732 cm−1 did not weaken because all sequences were A bases, which would be difficult to fold. The respiratory vibration of the A base ring was only slightly affected by the environmental D2O, and therefore, the peak at 732 cm−1 did not change markedly.
The peak at 1485 cm−1 was attributed to the hydrogen bond formed by N7 on the G base and the surrounding H2O/D2O [20,22]. Gradually decreasing the surrounding H2O concentration (i.e., gradually increasing the D2O concentration) increases the number of deuterium–hydrogen bonds formed by N7 and D2O. This action causes the isotopic effect to weaken the vibration tendency of the deuterium–hydrogen bonds and the peak intensity. As the hydrogen bonds formed between both molecules are not tetrahedral, there is no peak frequency shift [25]. The peak intensity at 1576 cm−1 increased with an increasing proportion of D2O in both the A20 and G14 sequences, but the change in the G14 sequence was more obvious.
Therefore, the change in the peak at 1576 cm−1 was caused by the interaction between the NH2 group on the A and G bases in the sequence and D2O. Furthermore, deuterium atoms do not directly participate in the formation of hydrogen bonds, which are still NH…O, and the O-D bond in D2O has higher energy and a shorter bond length than the O-H bond in H2O. Therefore, the NH…O bond polarizability, Raman activity, and Raman strength increase.
The following two interesting phenomena were observed: the peaks at 1506 cm−1 and 1361 cm−1 changed with increasing D2O proportion in pure base sequences A20 and G14. However, these changes were not evident in the SERS spectra of random sequences, i.e., SJ16 and SJ20. The 1506 cm−1 peak in the SERS spectrum of the A20 sequence was attributed to the A base. As the number of A bases in the sequences SJ16 and SJ20 (three and four, respectively) and the Raman intensity of this peak was relatively low, it did not appear in the SERS spectra of SJ16 and SJ20. Increasing the number of A bases in the sequence, such as with the sequence A12GTC in 3.3 (including 12 A bases), caused the peak at 1506 cm−1 to appear in the SERS spectra, and the intensity increased with the increasing proportion of D2O in the environment. A comparison of the SERS spectra of SJ16, SJ20, and the four pure base sequences showed that the 1361 cm−1 peak was attributable to the G and T bases [24]. Increasing the proportion of D2O did not change the peak of the pure T base at 1361 cm−1, whereas the peak intensity of the pure G base changed significantly, but the change was very weak in the SJ16 and SJ20 sequences. This likely occurred because the number of G bases in the sequence was relatively low (seven and eight, respectively). Although a total of eight G bases is small, it accounts for 40% of all bases, and the intensity of the peak in G14 was not high. Therefore, the change caused by eight G bases would not be very obvious. In the G12ATC sequence of the follow-up experiment, there were 12 G bases, accounting for 60% of the total number of bases, and the peak intensity change of 1361 cm−1 was more visible than that of SJ16 and SJ20. However, the apparent degree was still less than that of G14 (100% G base) at the 1361 cm−1 peak.
In summary, the Raman peaks that changed with an increasing proportion of D2O in the random sequence SERS spectrum were almost all related to the A and G bases. Therefore, we preliminarily inferred that the interaction site of D2O and DNA was mainly at the A and G bases. A comparison of the structures of the four bases determined that the A and G bases had a unique five-membered ring structure (as shown in Figure 2), which increased the site of interaction with water. Owing to their hydrophobicity, the bases in DNA gather in water to reduce contact with water [26]. As the number of sites on the A and G bases that interact with water is higher than that on the C and T bases, the A and G bases are less hydrophobic (more hydrophilic) than the C and T bases, and their ability to bind to H2O is stronger. C and T bases have fewer interaction sites with H2O than A and G bases; therefore, they are more hydrophobic, which is not conducive to interaction with H2O. When the concentration of D2O in the environment increases, more sites of action not only increase the number of hydrogen–deuterium exchanges between A and G bases and D2O and the number of deuterium–hydrogen bonds formed, but also reduce the total energy of the formed complex and thus improve its stability. Simultaneously, they increase the influence of D2O on the group vibration in the A and G bases, which is conducive to the capture of the SERS instrument. As the C and T bases and D2O interact with fewer sites, it not only reduces the number of hydrogen–deuterium exchanges and the formation of deuterium–hydrogen bonds between the two but also makes the total energy of the complex higher and lowers its stability. This leads to a reduction in the influence of D2O on the group vibration of C and T bases, which is not conducive to the capturing of changes by the SERS instrument. Therefore, the SERS peaks related to the C and T bases barely changed, except the 1170 cm−1 peak belonging to T bases was weakened.

2.2. Detection of Only C and T Base Sequences

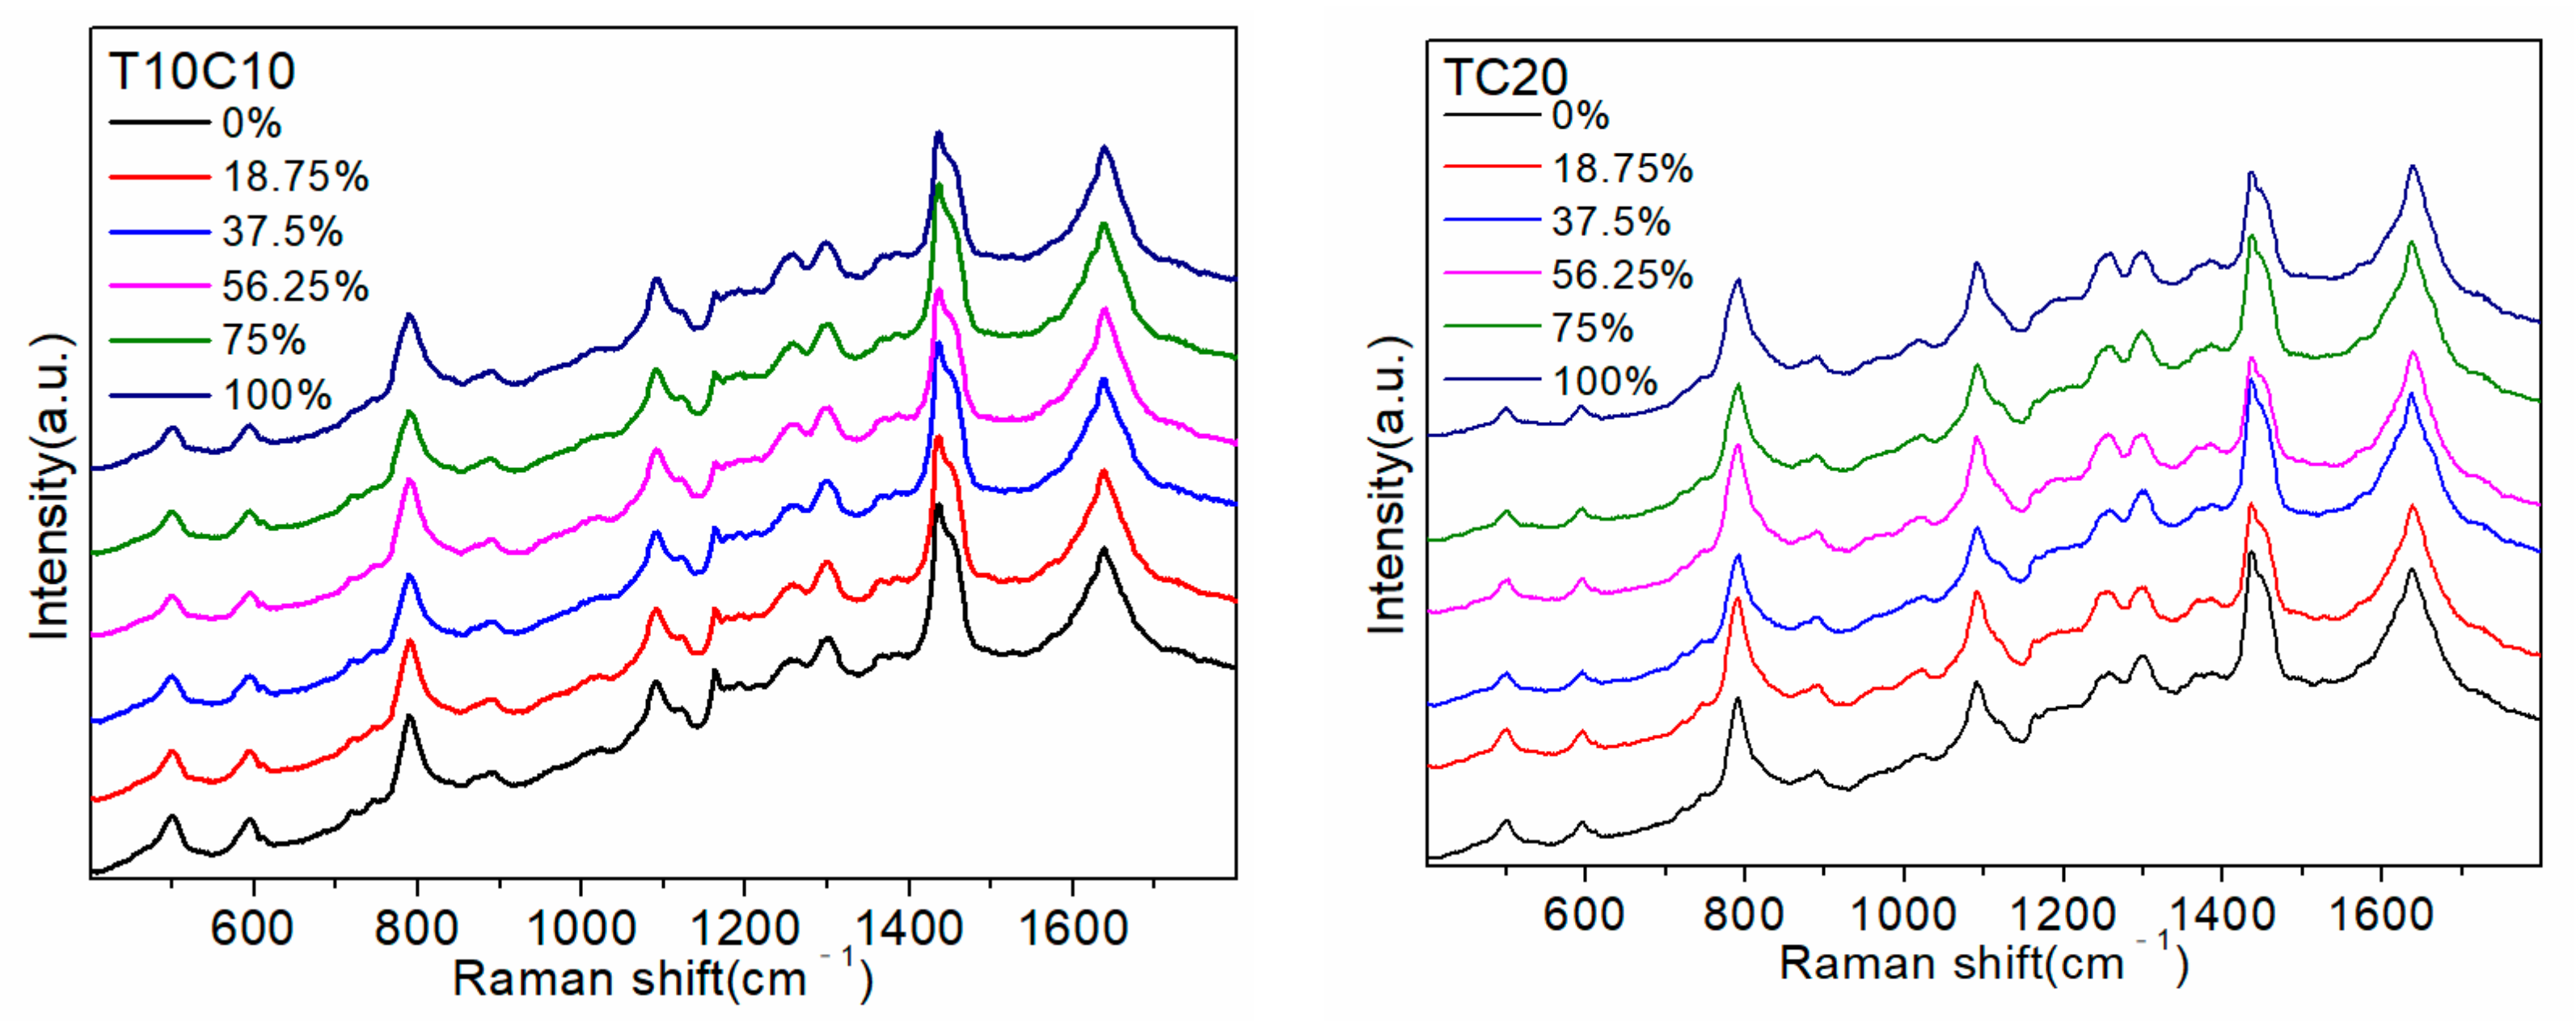
To verify that the site of action between D2O and DNA identified in Section 2.1 involves mainly A and G bases, two sequences, T10C10 and TC20, containing only C and T bases were designed. The two sequences were subsequently detected using the same process, and the results are shown in Figure 3.
Figure 3 shows that the T10C10 and TC20 sequences only contained C and T bases, with the same number of each, but their different order resulted in different SERS spectra. However, the SERS spectrum was almost unchanged—only the intensity of the 1170 cm−1 peak showed a small change with an increase in the proportion of D2O in the environment where the sequence was located. Consequently, the SERS spectrum containing only C and T base sequences was rarely affected by D2O, which also verified the conclusion reached in Section 2.1 that the site of interaction between D2O and DNA was mainly at the A and G bases.

2.3. Effect of Number and Position of G Base in Sequence

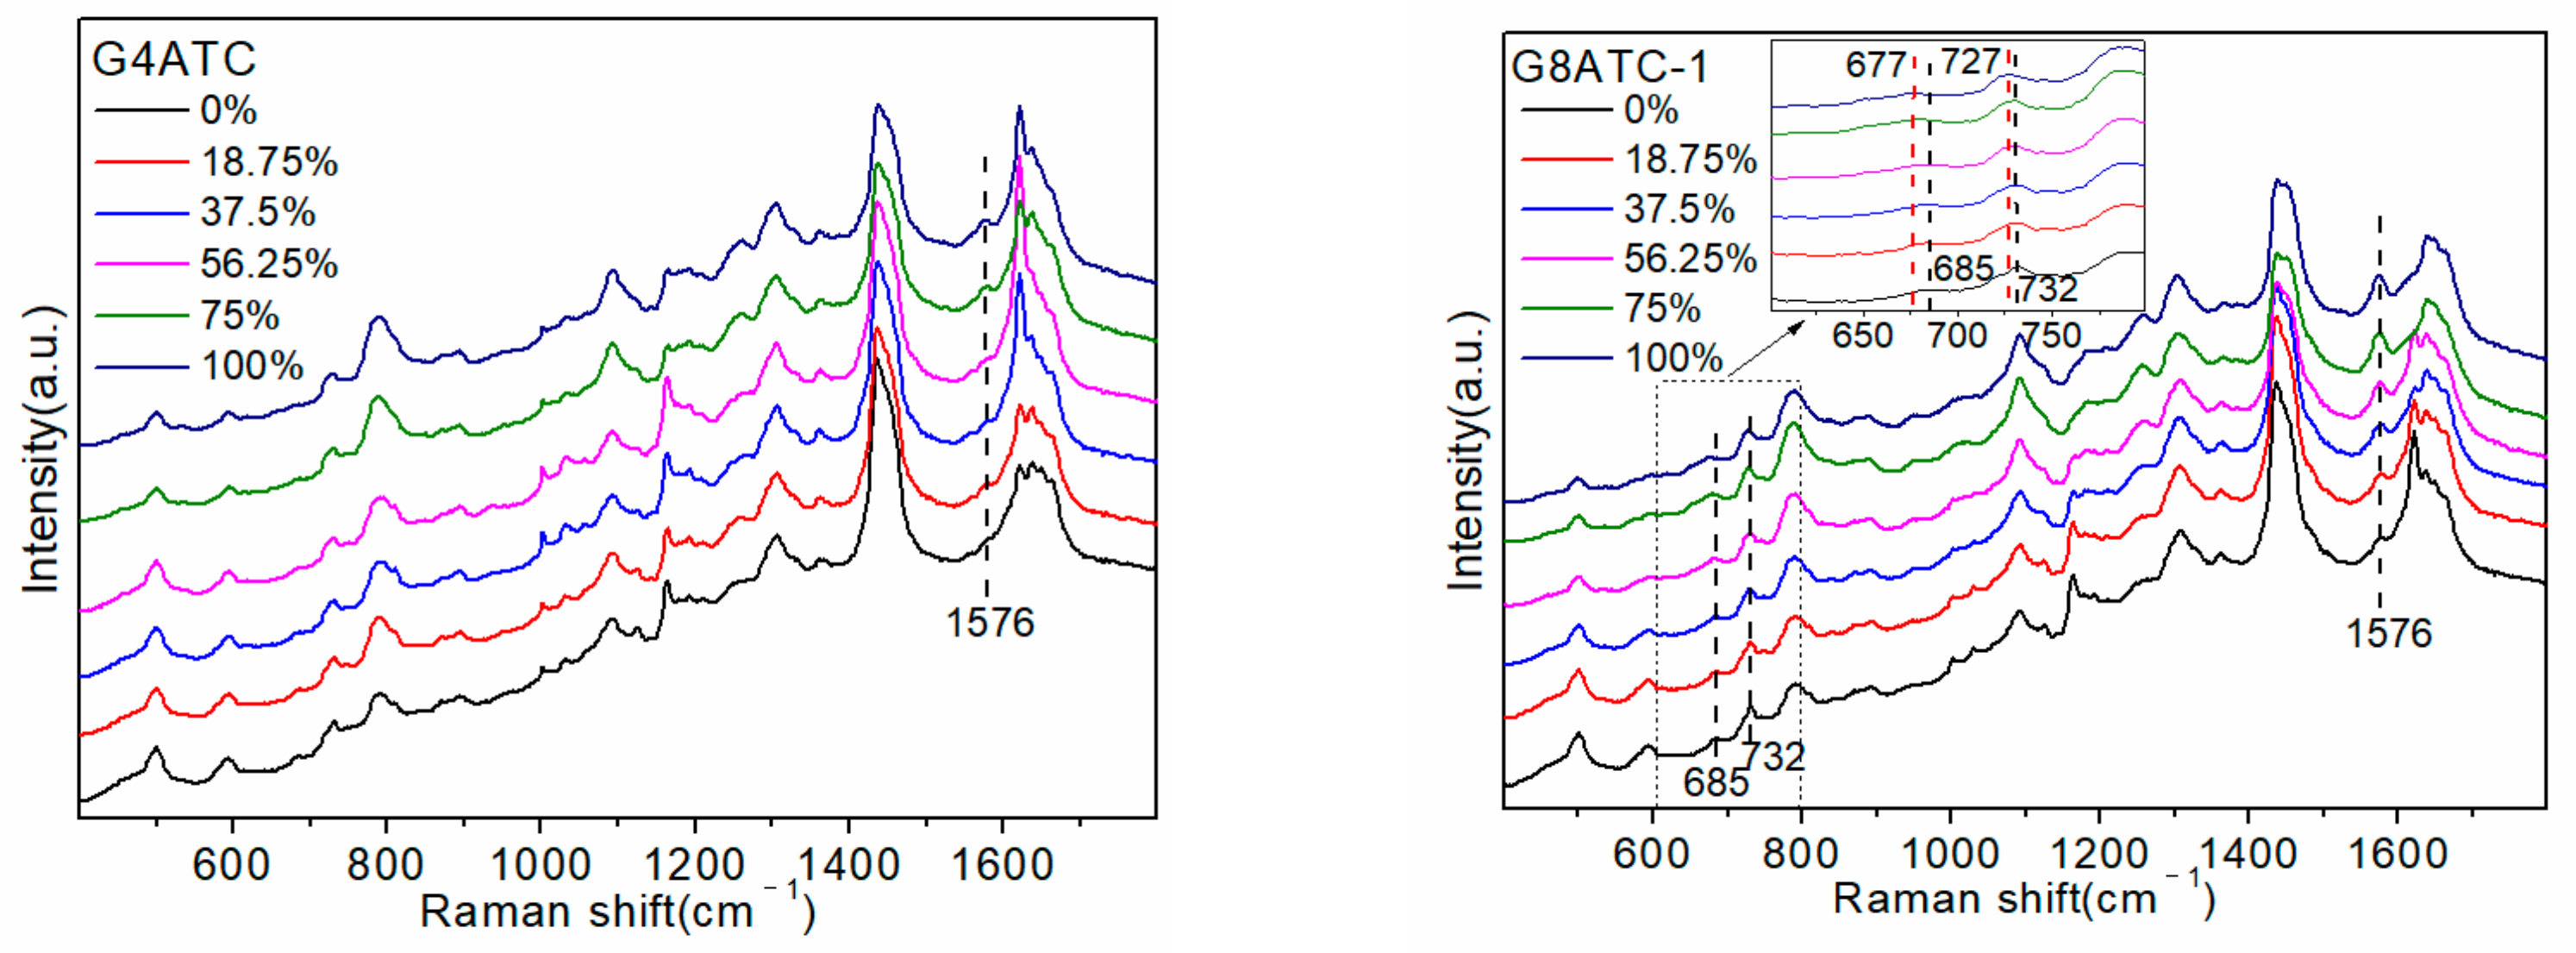
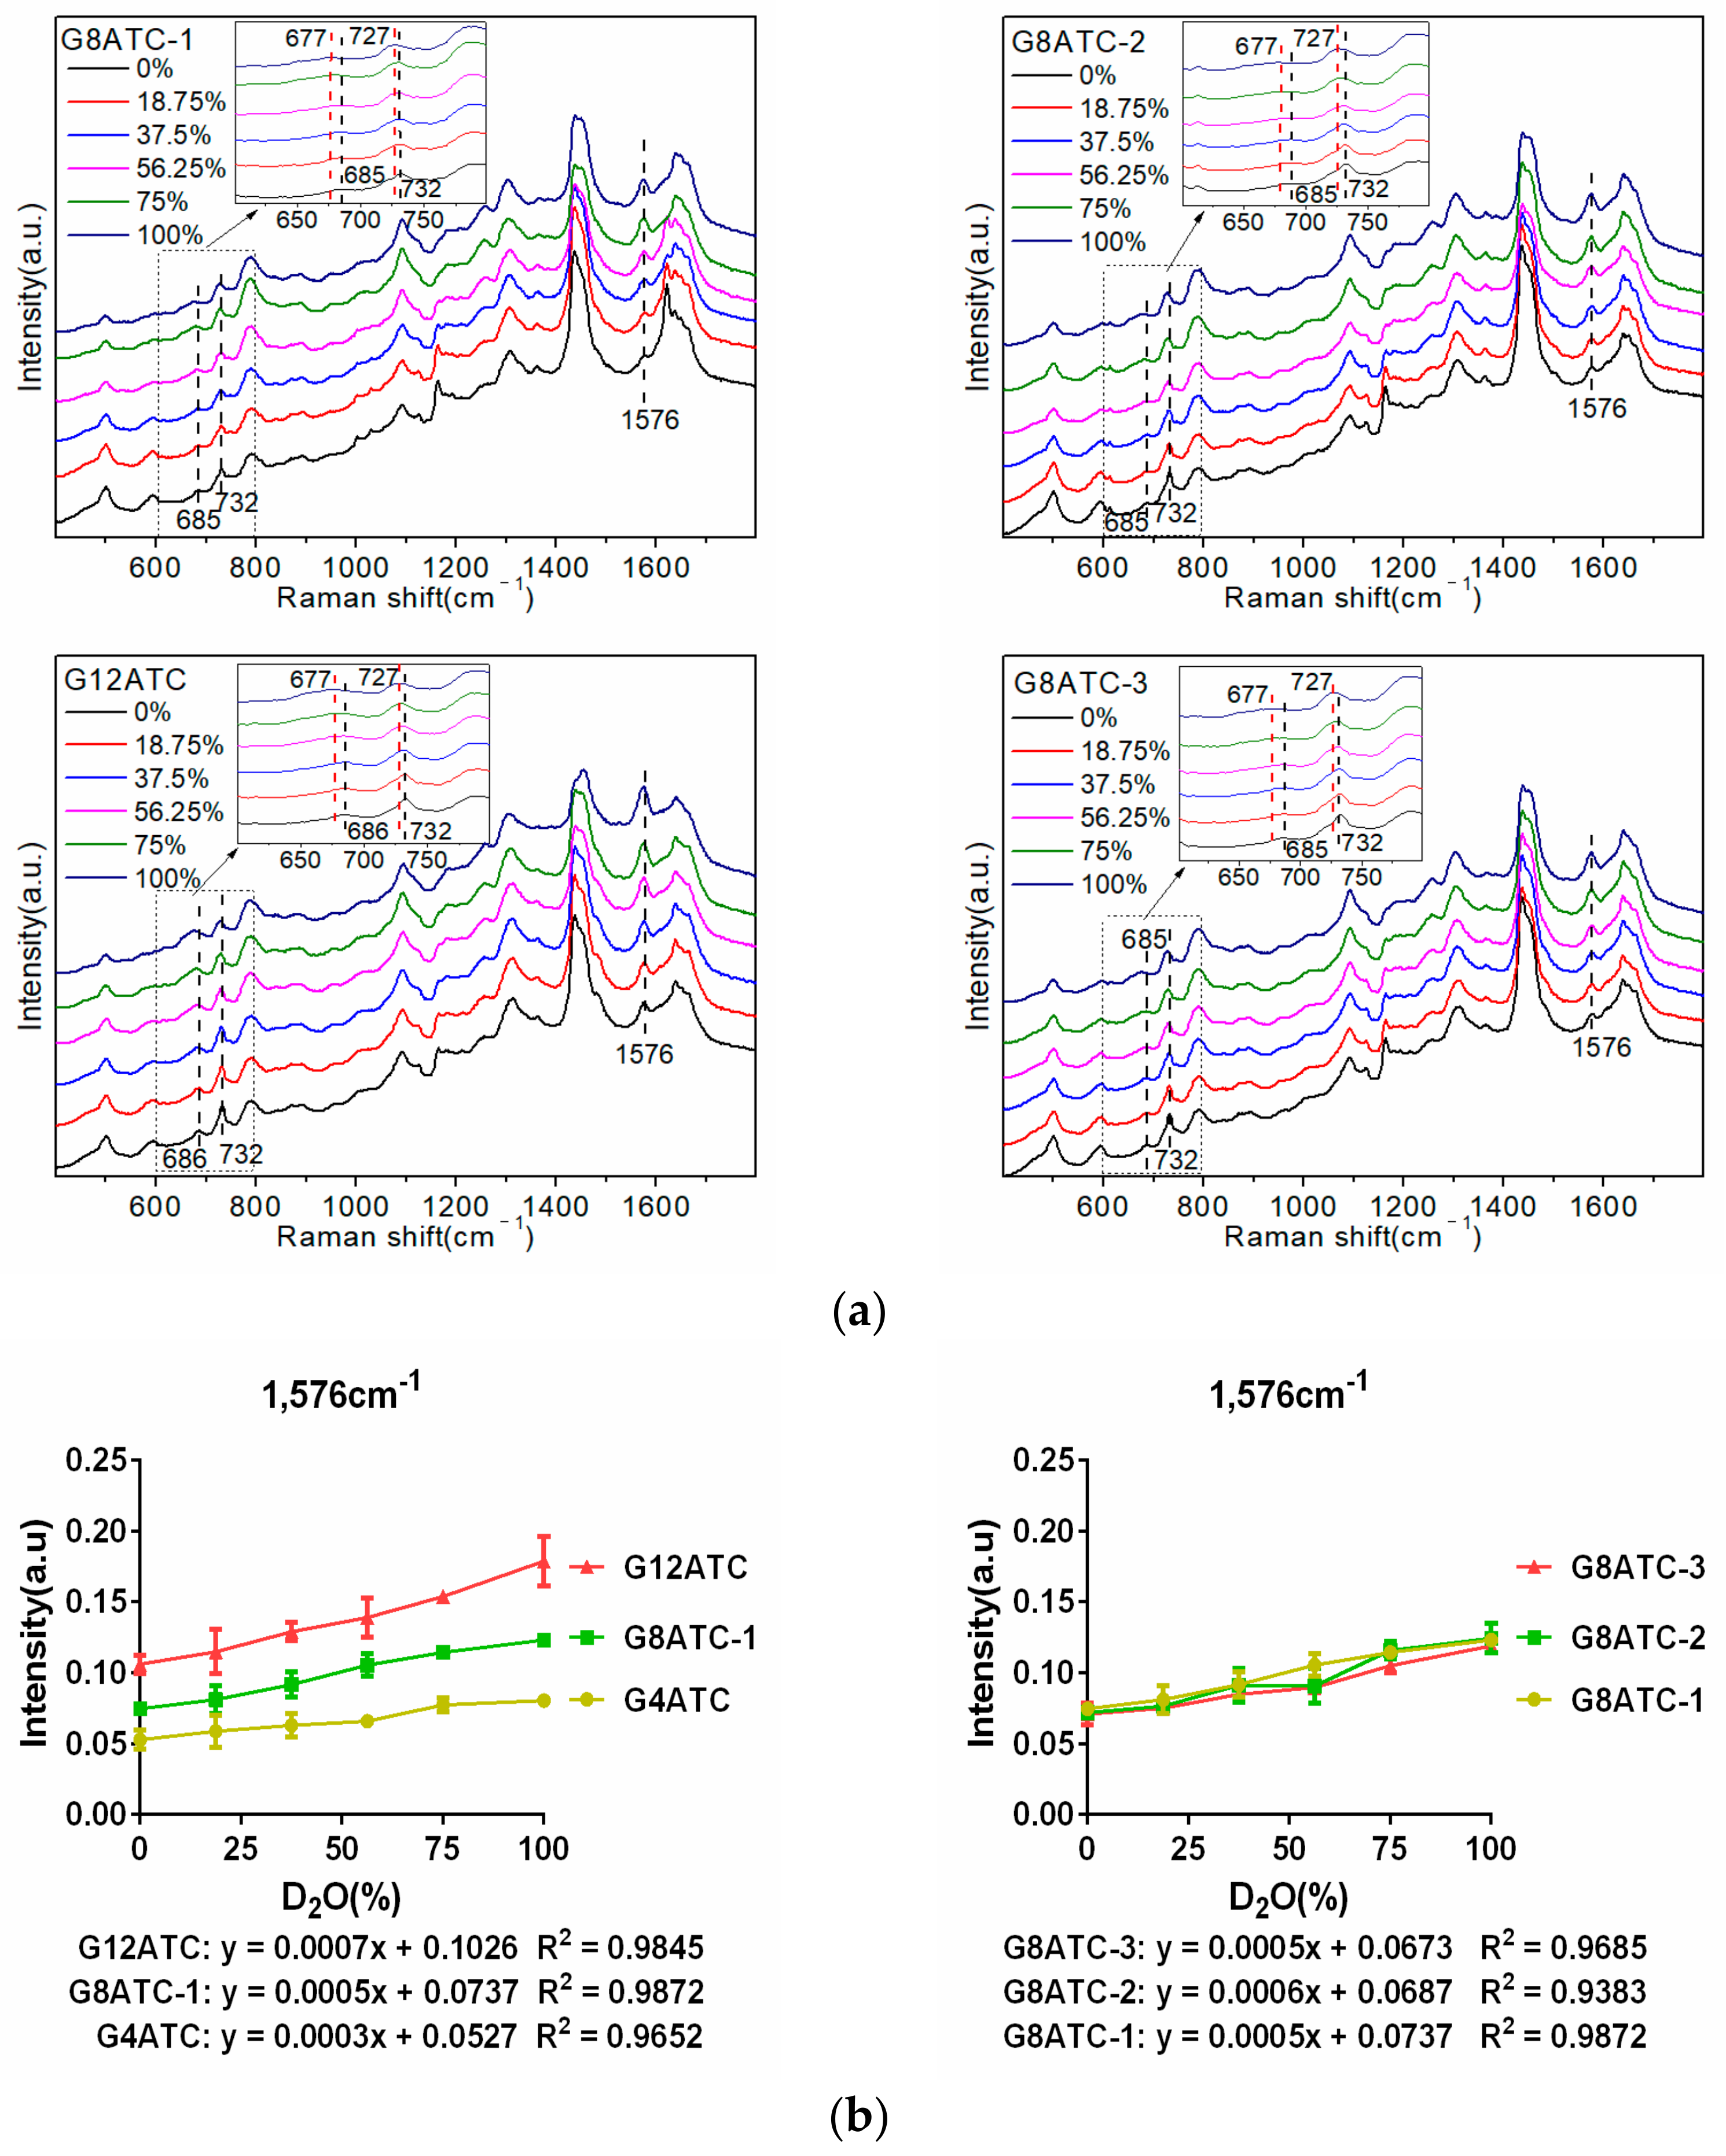
To explore the effects of the number and position of G bases in the sequence, the following five sequences were designed: G4ATC, G8ATC-1, G8ATC-2, G8ATC-3, and G12ATC, as shown in Table 1. All sequences contained 20 bases, and the number of G bases was 4, 8, 8, 8, and 12, respectively. The four G and eight G bases replaced the C bases that did not interact with D2O. The three G8ATC (-1, -2, and -3) sequences contained the same number and types of bases, but the order of arrangement was different. The five ssDNAs detected are shown in Figure 4a.
The increase in the proportion of D2O produced a Raman peak in the spectrum that was consistent with that of SJ16 and SJ20. Specifically, the 686 cm−1 and 732 cm−1 peaks had a red shift, and the intensities of the 732 cm−1 and 1485 cm−1 peaks gradually weakened, whereas that of the peak at 1576 cm−1 gradually increased. The largest change was in the intensity of the 1576 cm−1 peak. Using the peak intensity as a reference, we explored the influence of the number and position of G bases in the sequence on their interaction with D2O. The change in the peak intensity with the increasing proportion of D2O in the different sequences and the linear relationship between the peak intensity and the proportion of D2O are shown in Figure 4b.
The G4ATC, G8ATC-1, and G12ATC sequences are all 20 bases long. The extra G bases of the latter two were replaced by C bases that did not interact with D2O; therefore, the changes in the three maps were mostly caused by the increase in the number of G bases. In the SERS spectrum, when the proportion of D2O was 0%, the difference in the SERS spectra of the three sequences was mainly reflected in the peaks at 1485 cm−1 and 1576 cm−1, which were both attributed to the G base. In contrast, the peak at 732 cm−1 attributed to the A base showed almost no difference. Figure 4b shows that the 1576 cm−1 peak intensity of the three sequences was positively correlated with the number of G bases, and the slopes of the linear equations of the three sequences were 0.0003, 0.0005, and 0.0007, respectively, which showed an upward trend. Specifically, increasing the number of G bases also increased the amplitude of the intensity of the 1576 cm−1 peak with an increase in the proportion of D2O. Therefore, the greater the number of G bases, the stronger the interaction between the sequence and D2O.
Differences in the arrangement of sequences produced slight variations in the intensities of some peaks in the SERS spectra of the three G8ATC sequences. For example, for the 732 cm−1 peak, a D2O proportion of 0% produced an A8GTC-2 sequence that had a stronger intensity than the A8GTC-1 sequence. However, under D2O conditions, the trend of peak intensity and displacement in the three sequences was the same as the proportion of the D2O increase. Figure 4b shows that the 1576 cm−1 peak intensity of the three G8ATC sequences was between 0.075 and 0.135, and the slopes of the linear equation were almost equal (0.0005–0.0006). Therefore, when the number of G bases in the sequence was constant, the difference in the amplitude of the 1576 cm−1 peak intensity of the three sequences was very small and was smaller than the difference caused by the difference in the number of G bases. We believe that this phenomenon occurred because the volume of the D2O molecules was small relative to the base and ssDNA sequences in the system. Regardless of the position of the base in the sequence, the active site of both molecules was always “exposed”, and the small D2O molecule always localized to and interacted with the active site. Therefore, the sequence interaction with D2O was not affected by the positions of the A and G bases in the sequence.

2.4. Effect of Number and Position of A Base in Sequence

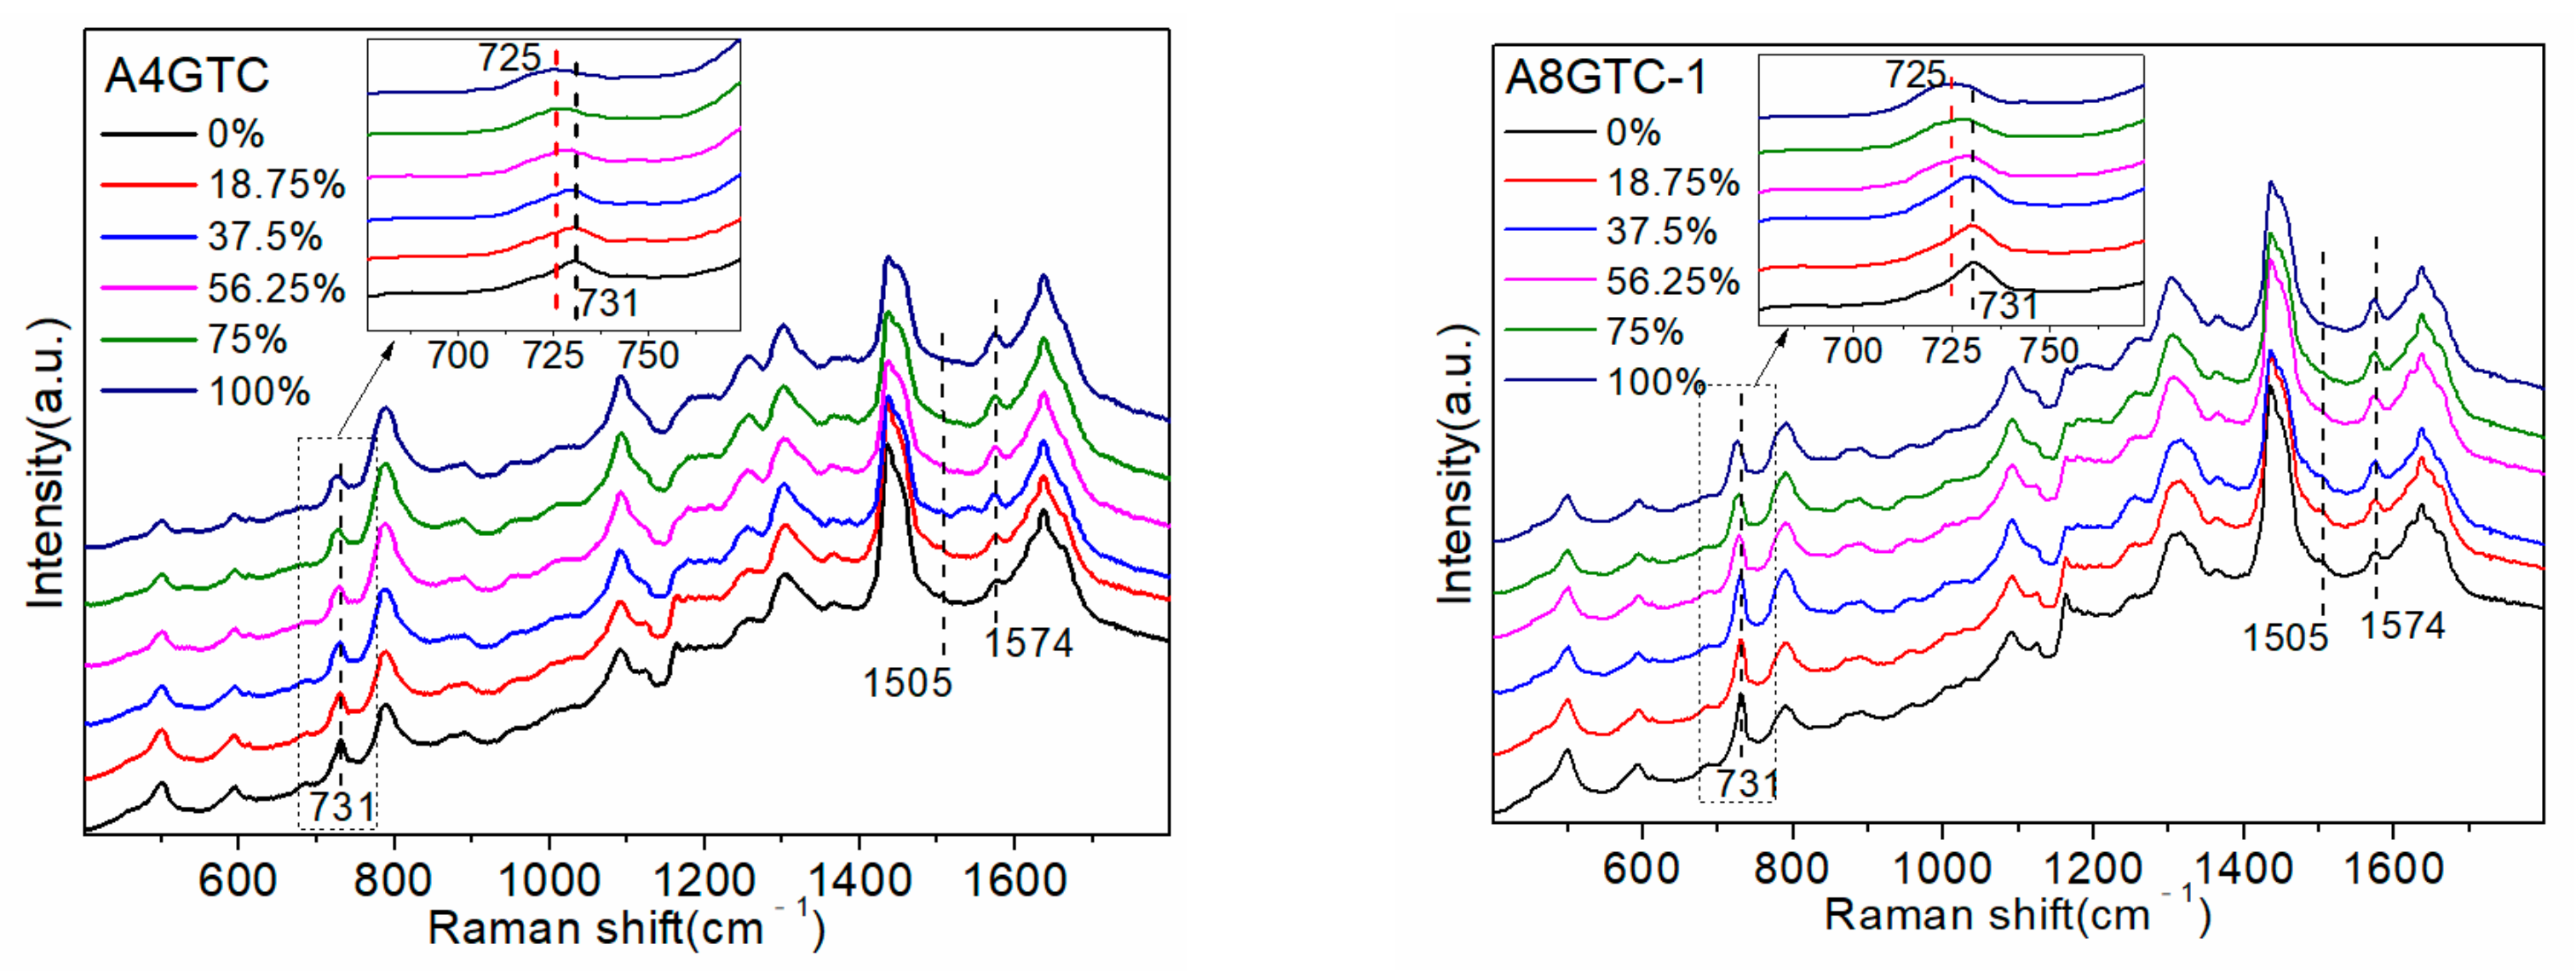
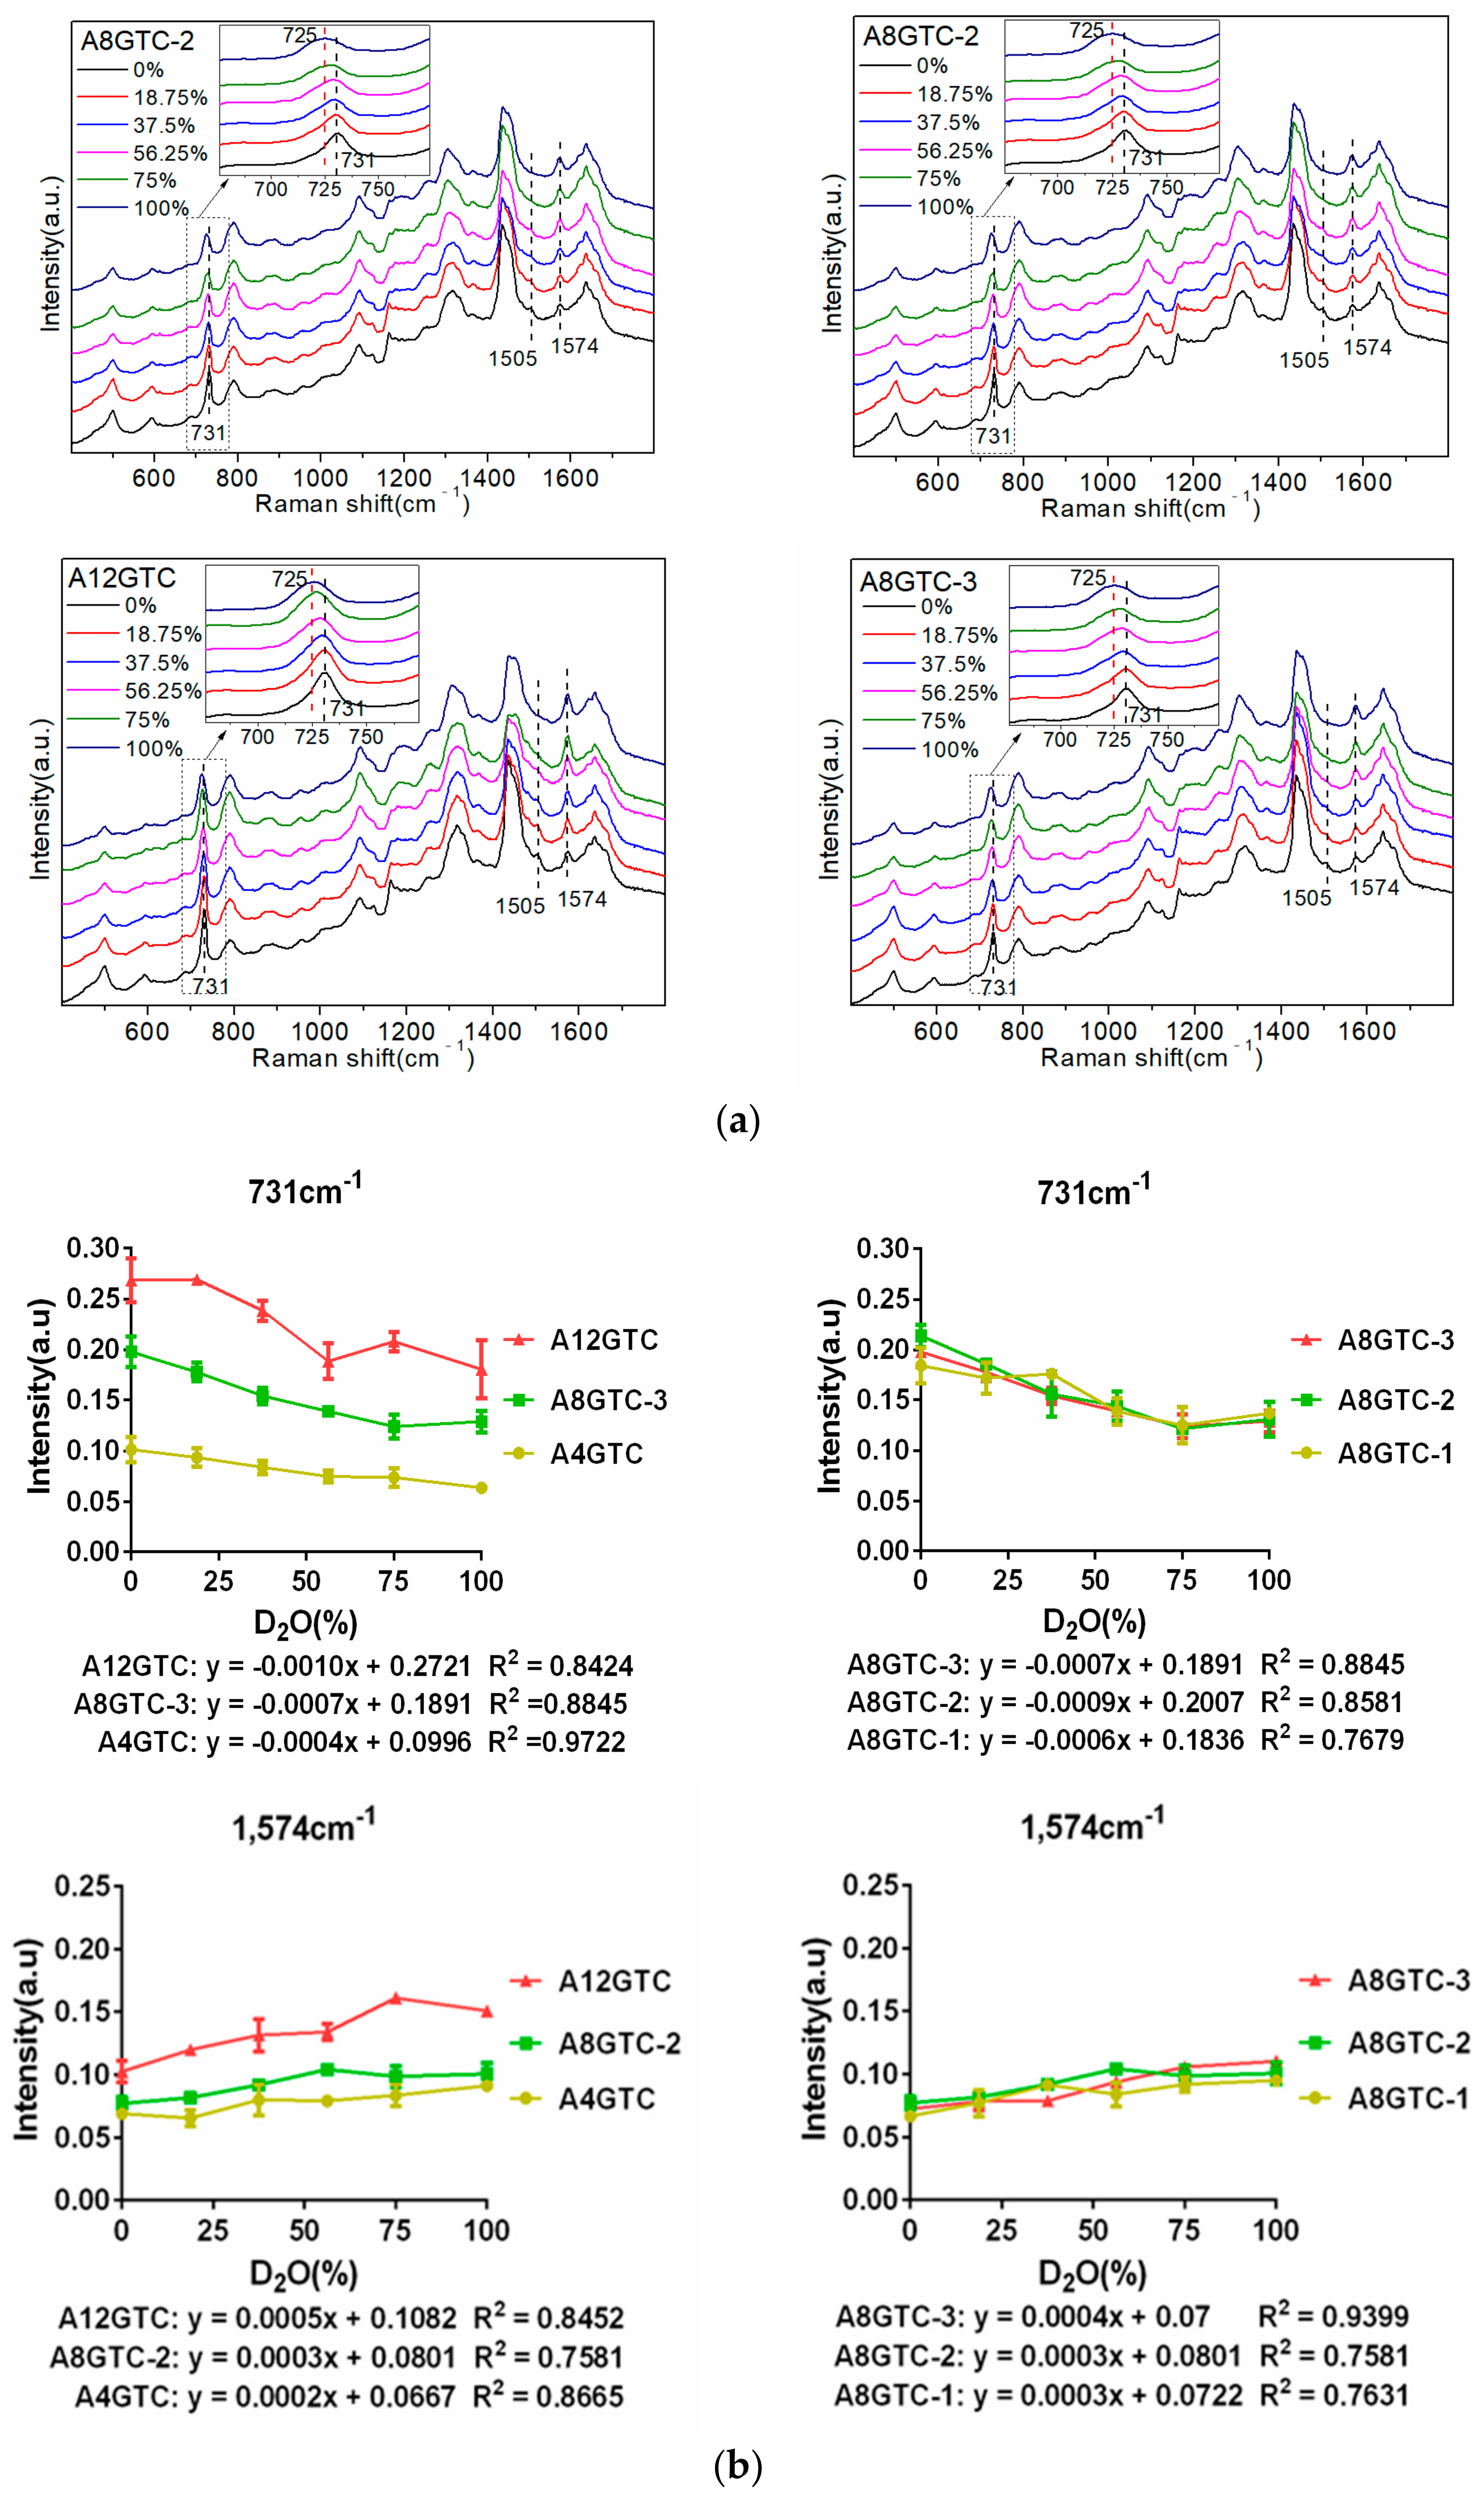
In addition, to explore the influence of the number and position of the A bases, the following five sequences were designed: A4GTC, A8GTC (-1, -2, and -3), and A12GTC; the specific sequences they represent are shown in Table 1. All sequences contained 20 bases, and the number of A bases was 4, 8, 8, 8, and 12, respectively. The increase in four and eight A bases replaced the C bases that did not interact with D2O. Three A8GTC (-1, -2, and -3) sequences contained the same number and types of bases, but they were arranged in a different order. The five ssDNAs detected are shown in Figure 5a.
As all sequences had the same number of G bases, their position did not affect the intensity of the 1574 cm−1 peak, which was only altered by a change in the A base. Increasing the proportion of D2O resulted in changes in the Raman peak spectrum that were consistent with those observed in the SJ16 and SJ20 spectra. Specifically, the peak at 731 cm−1 had a red shift, and the intensities of the 731 cm−1 and 1505 cm−1 peaks gradually decreased, whereas that of the 1574 cm−1 peak gradually increased. We used the peaks at 731 cm−1 and 1574 cm−1, which had the largest intensity changes, as references to explore the influence of the number of A bases and their positions in the sequence on the interaction between the sequence and D2O. The trend of change in the peak intensities at 731 cm−1 and 1574 cm−1 with increasing D2O proportion and the linear equation of the peak intensity with respect to the proportion of D2O are shown in Figure 5b.
The A4GTC, A8GTC-2, and A12GTC sequences were all 20 bases long. The extra A bases in the A8GTC-2 and A12GTC sequences were included by replacing the C bases that do not interact with D2O. Therefore, the changes in the three SERS maps could almost all be attributed to an increase in the number of A bases. Figure 5b shows that the 731 cm−1 peak intensity of the three sequences was positively correlated with the number of A bases and decreased with an increase in the D2O proportion. The linear equation slopes of the peak intensity with respect to the proportion of D2O were −0.0004, −0.0007, and −0.0010, respectively, and the absolute value showed an increasing trend. Moreover, as the number of A bases increased, the reduction in the intensity of the 731 cm−1 peak increased with an increase in the proportion of D2O. The 1574 cm−1 peak intensity of the three sequences was positively correlated with the number of A bases and increased with an increase in the proportion of D2O. The linear equation slopes of the peak intensity with respect to the proportion of D2O were 0.0002, 0.0004, and 0.0005, respectively: i.e., they showed an upward trend. Specifically, as the number of A bases increased, the magnitude of enhancement of the intensity of the 1574 cm−1 peak increased with an increase in the proportion of D2O. Therefore, the greater the number of A bases in the sequence, the stronger the interaction between the sequence and D2O. In Section 2.3, it was shown that the linear equation slopes of the 1576 cm−1 peak intensity of the G4ATC, G8ATC, and G12ATC sequences increased with the proportion of D2O, i.e., 0.0003, 0.0005, and 0.0007, respectively. Importantly, these values were greater than the linear equation slopes of the 1574 cm−1 peak intensity of the A4GTC, A8GTC-2, and A12GTC sequences and the proportion of D2O. Therefore, the interaction between the G base and D2O was stronger, causing a greater change in the intensity of the 1576 cm−1 peak than that caused by the A base.
Differences in the order of arrangement induced slight differences in the intensities of some peaks of the SERS spectra of the three A8GTC sequences. However, the peaks and trends of changes for the three sequences with respect to the proportion of D2O were consistent. Furthermore, the 731 cm−1 and 1574 cm−1 peaks with pronounced changes were similarly analyzed. The intensity of the 731 cm−1 peak of the three sequences was between 0.11 and 0.21 (linear equation slopes: −0.0006, −0.0009, and −0.0007), and that of the 1574 cm−1 peak was between 0.06 and 0.11 (linear equation slopes: 0.0003, 0.0003, and 0.0004). The absolute slopes of the linear equation were not significantly different, and the slopes of the 1574 cm−1 peak were almost equal. Therefore, when the number of A bases in the sequence was constant, the difference in the peak intensities of the three sequences at 731 cm−1 and 1574 cm−1 was very small (smaller than the difference induced in response to variations in the number of A bases).
Investigation of the number and position of the A and G bases in the sequence suggests that the interaction between D2O and sequences with the same length was affected by the change in the number of A and G bases. In contrast, changes in the position of the A and G bases had less pronounced effects. Owing to the volatility of SERS, for sequences that cannot be folded into specific secondary structures, such as G-quadruplexes and i-motifs, their interaction with D2O is unaffected by the position of A and G bases.

2.5. Interaction between G-Quadruplex Sequence and D2O

We concluded that D2O mainly interacts with the A and G bases in the sequence and is mainly affected by their number rather than location, provided that the sequence does not form specific secondary structures. Therefore, we investigated the outcome when the sequence formed a secondary structure.
We selected the G-quadruplex as the paradigm for investigating the interaction between D2O and the ssDNA secondary structure. G-quadruplexes are unique secondary structures formed by guanine-rich nucleic acids. Considerable in vitro biophysical and structural evidence supports the formation of a G-quadruplex [27,28]. Computer research and sequencing methods have revealed the ubiquity of G4 sequences in the gene regulatory regions of different genomes, including human genomes [29,30]. Experiments using chemical, molecular, and cellular biological methods have demonstrated the presence of G4 sequences in chromatin, DNA, and RNA, and the formation of G-quadruplexes is very important for key biological processes, such as transcription, translation, genome instability, and cancer development [31,32,33].
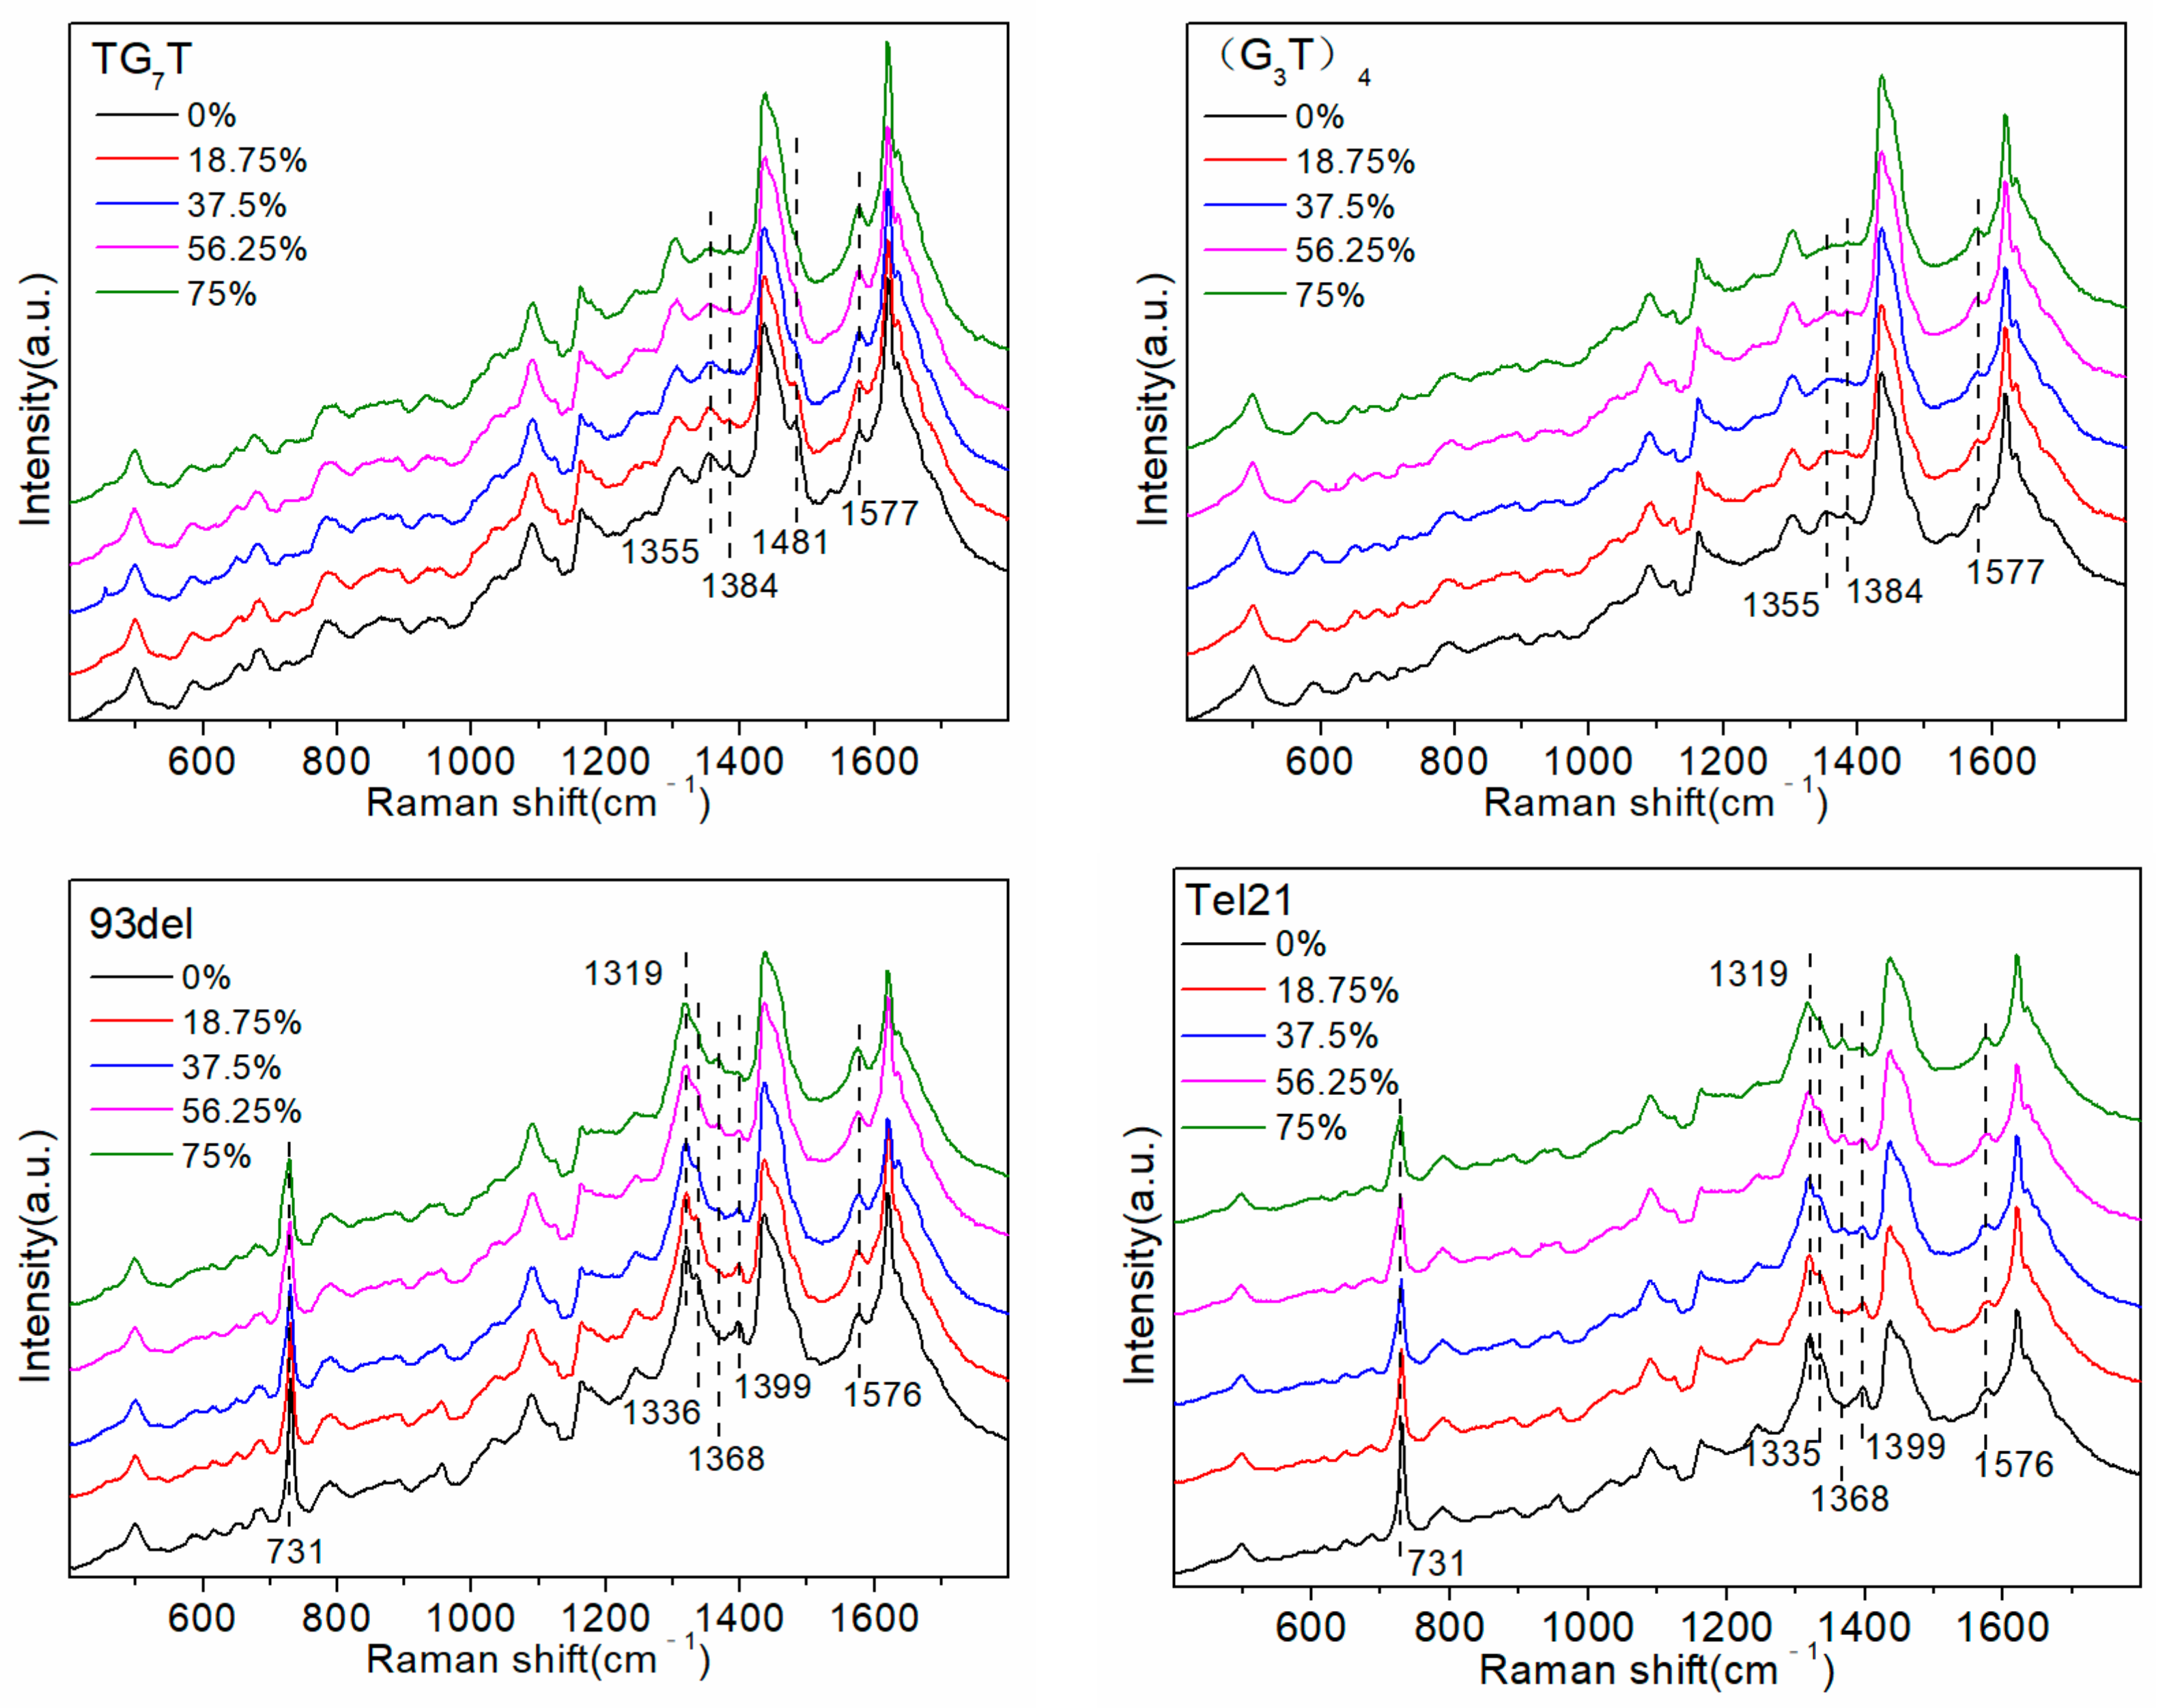
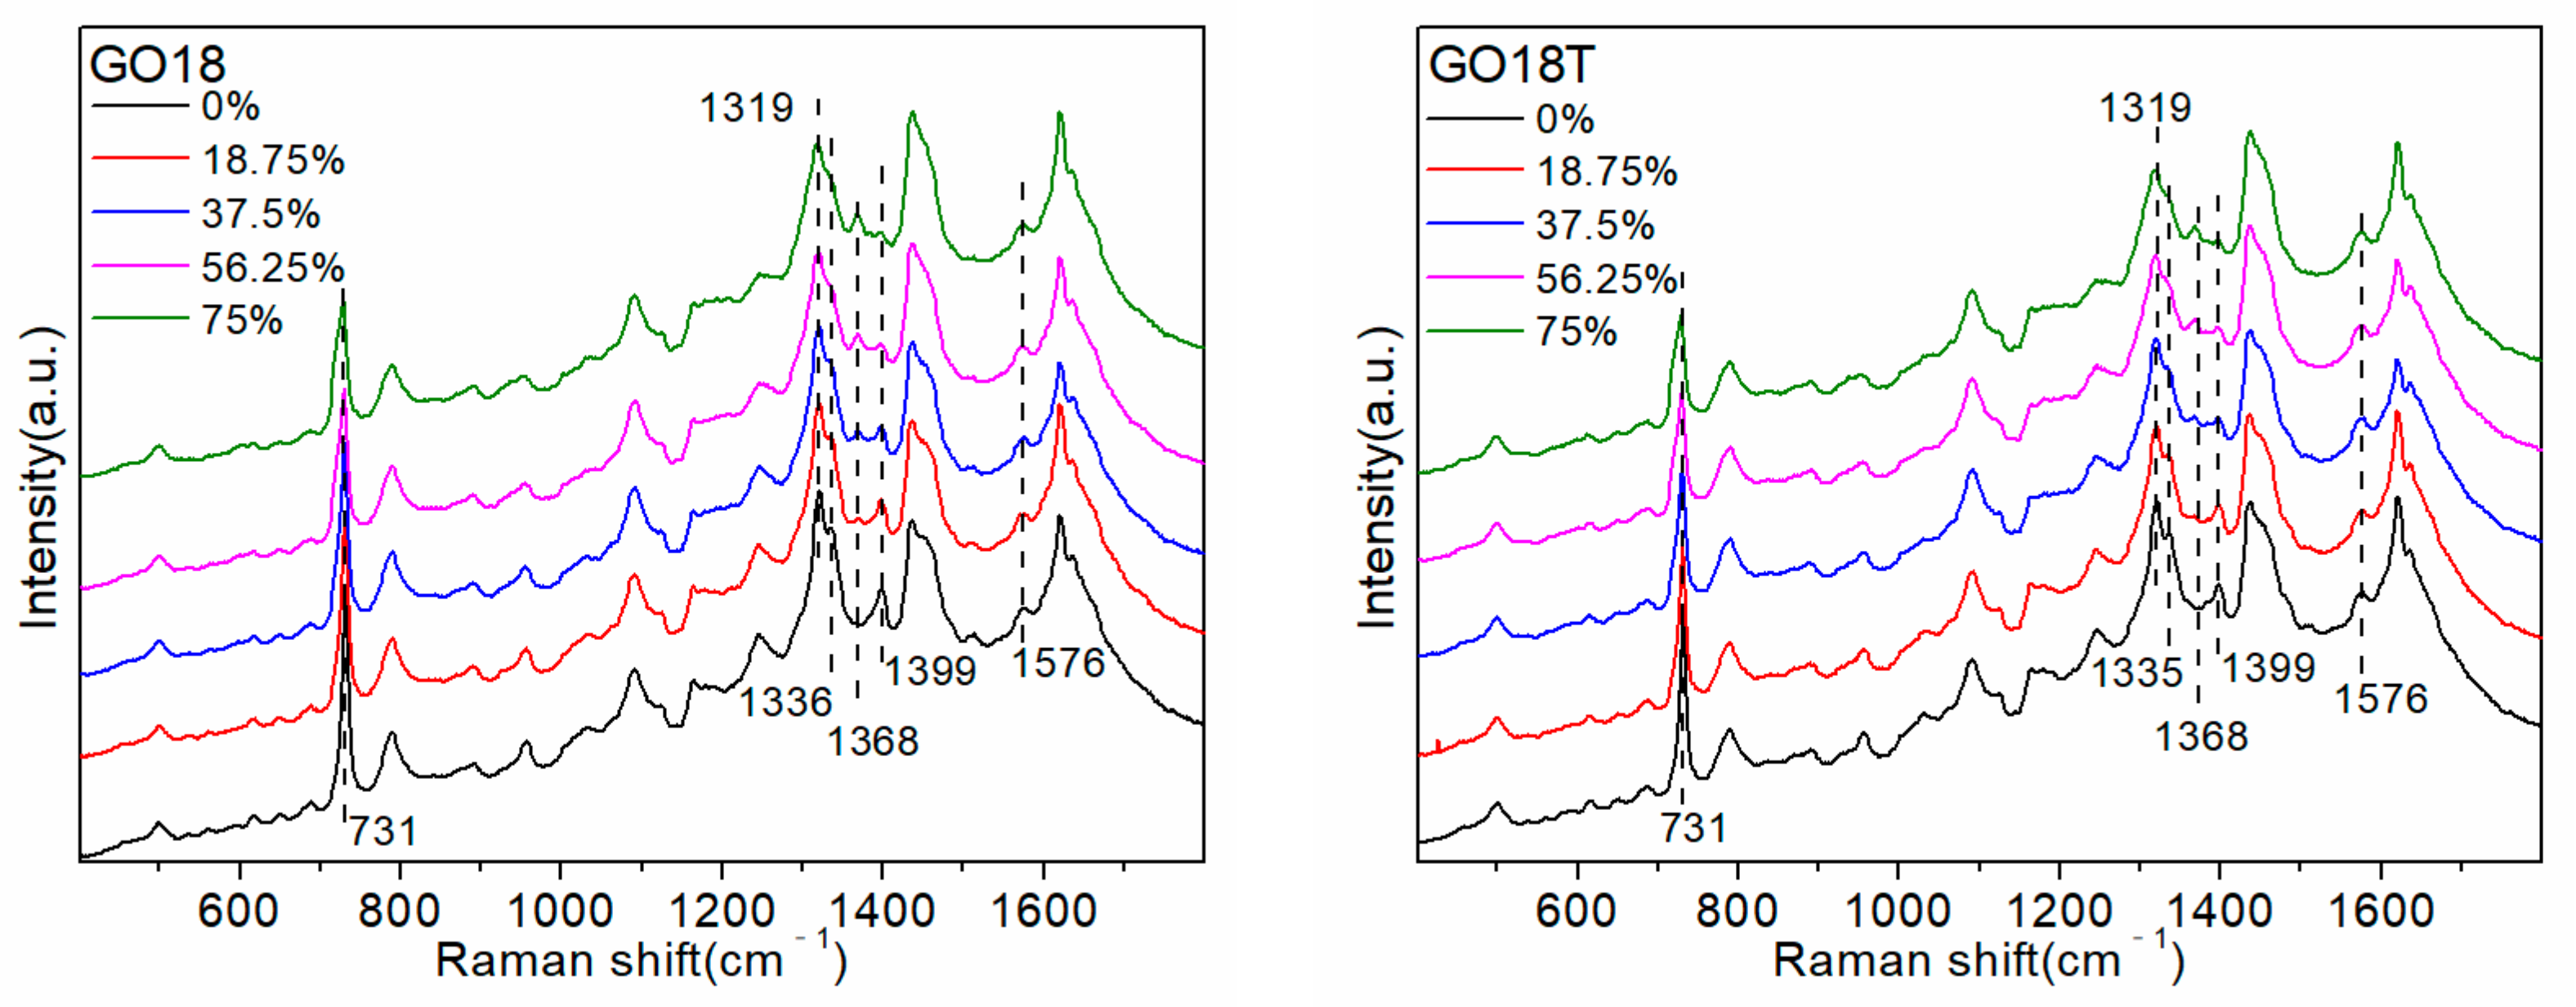
In addition, G-quadruplexes can also serve as potential therapeutic targets for human diseases, thereby improving the therapeutic effect on diseases such as cancer and genetic diseases [34]. Therefore, it is necessary to explore the interaction between D2O and G4 sequences, which would contribute to enhancing our understanding of the structure and properties of G-quadruplexes. Furthermore, such studies would provide partial theoretical guidance for further studies of various biological processes that require the simultaneous involvement of D2O and G-quadruplexes. We synthesized six sequences that form G-quadruplexes, i.e., (G3T)4, TG7T, Tel21, 93del [20], GO18, and GO18T [35] (Table 1 shows the specific sequences they represent) and explored their interaction with D2O. The results are shown in Figure 6.
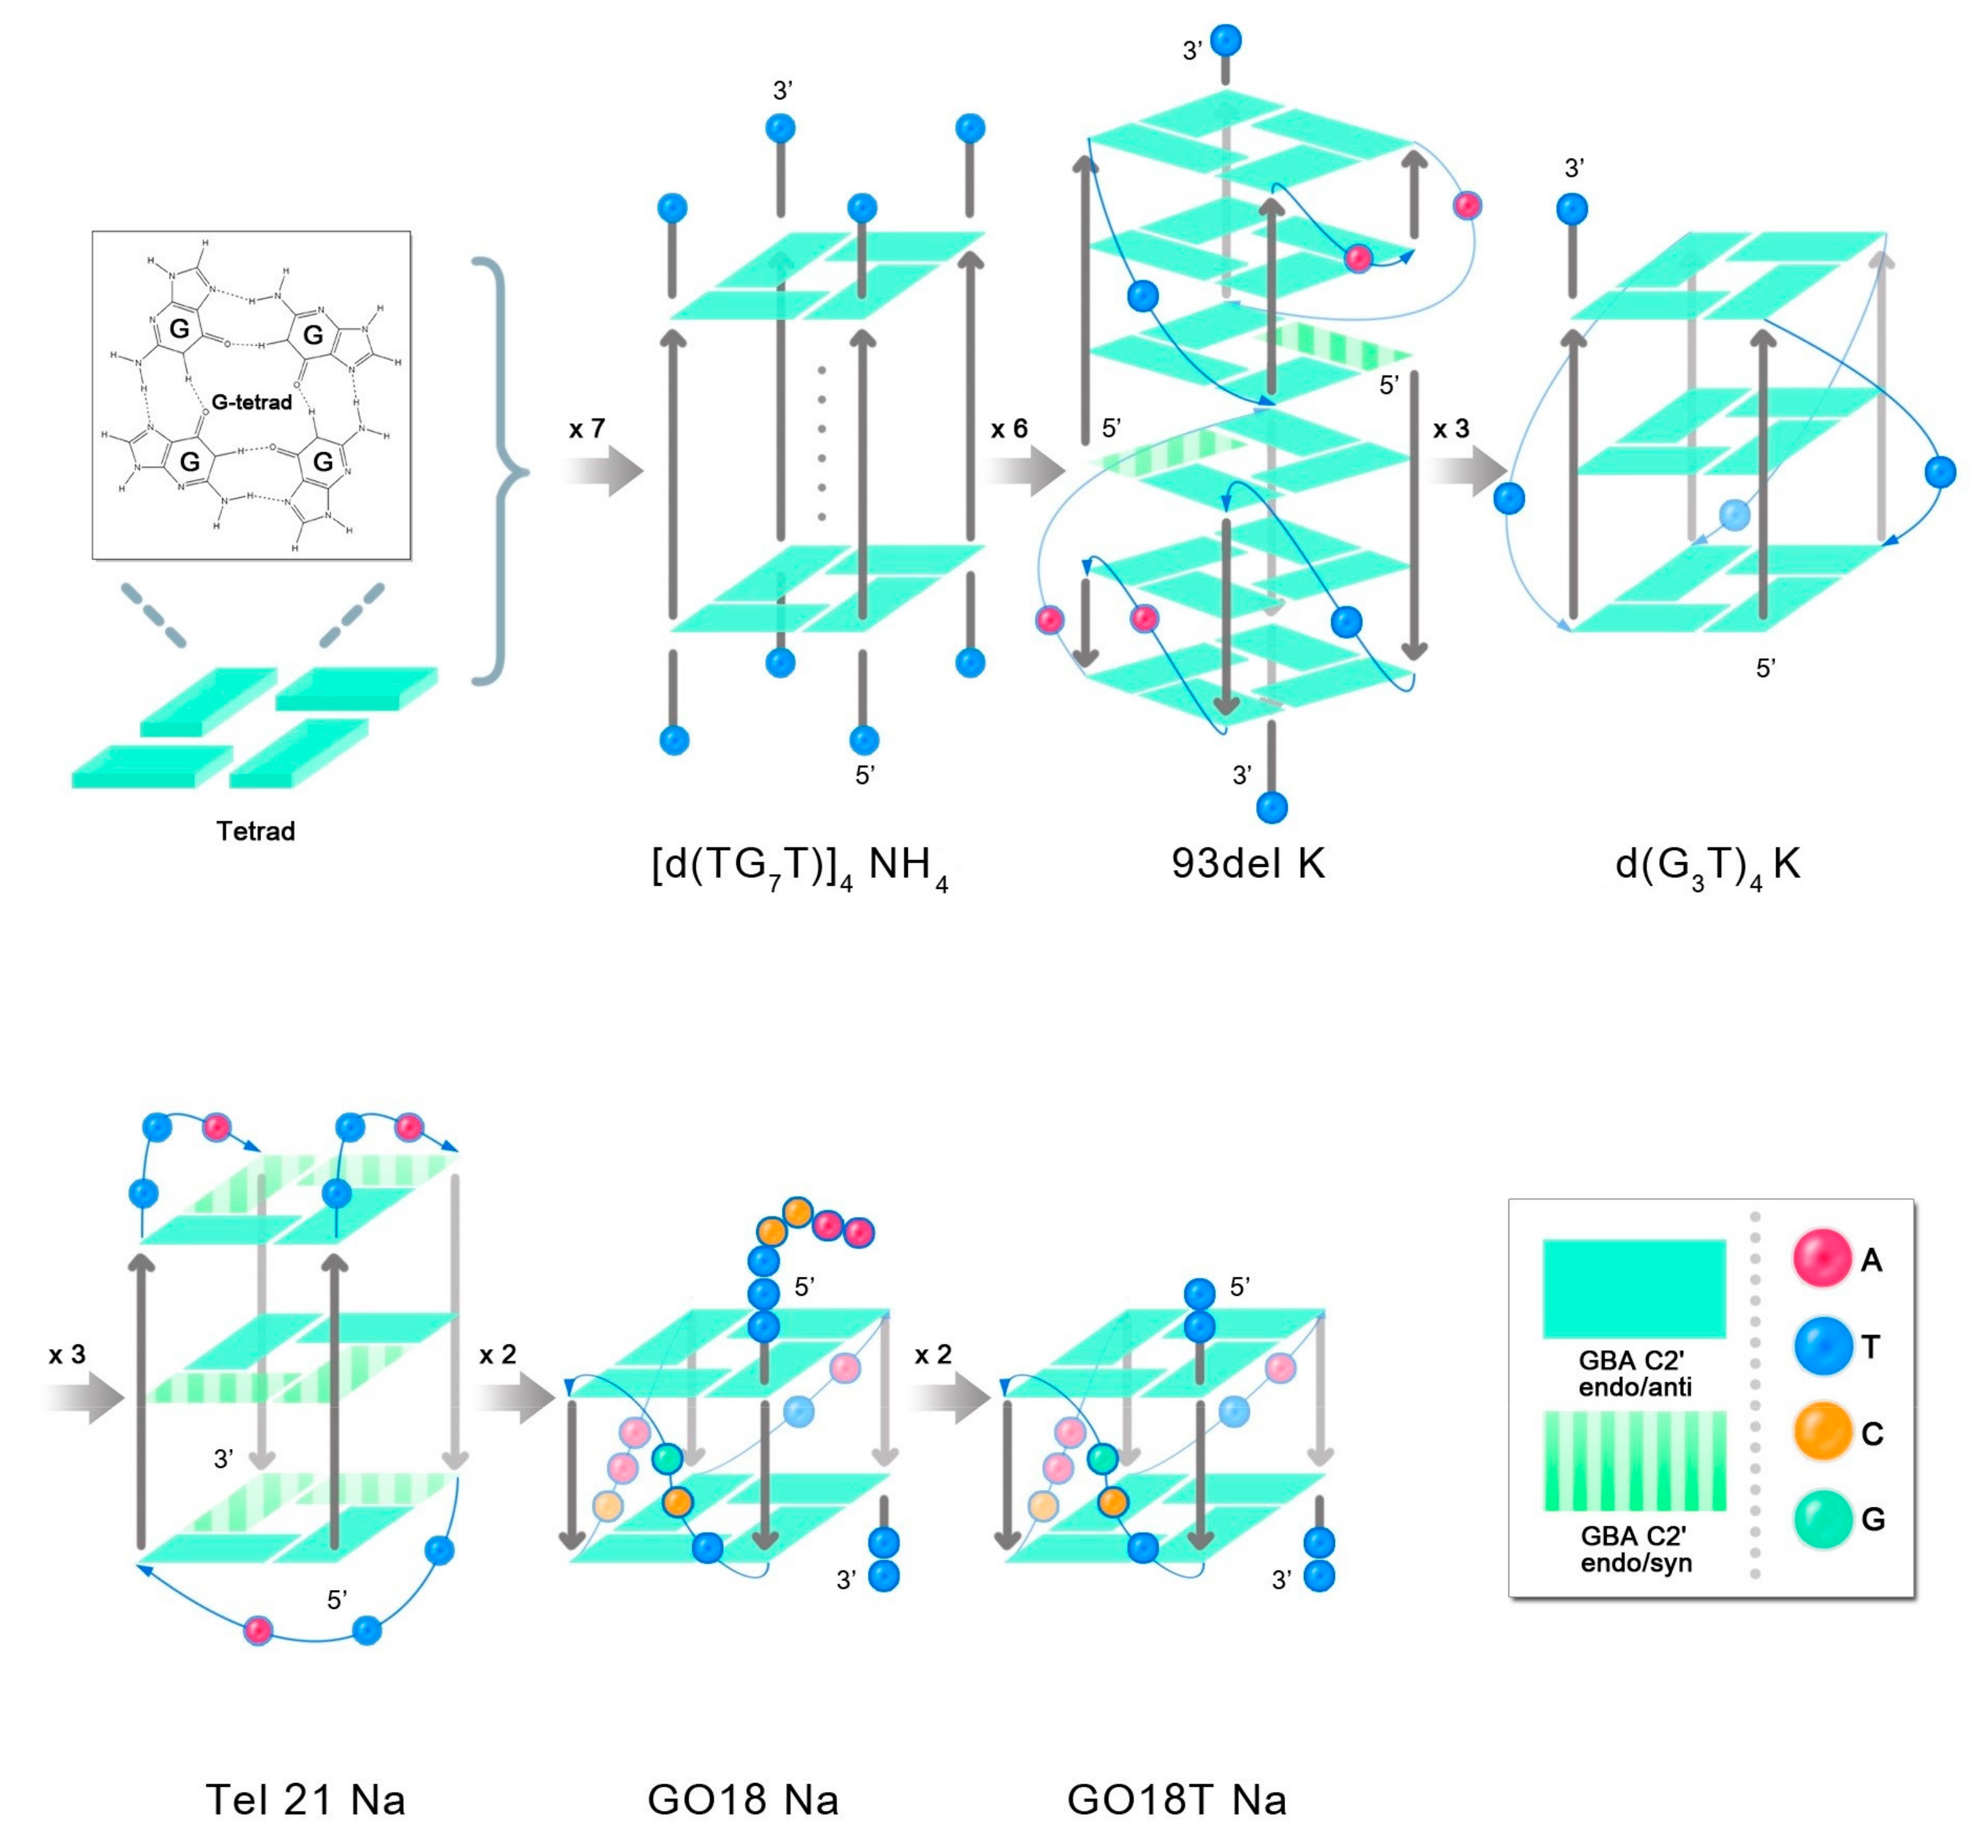
After adding a cationic acetate buffer (pH 4.5), the ssDNA formed a G-quadruplex structure [20,23], which is shown in Figure 7, thereby inducing partial changes in the sites where it interacted with D2O. First, the intensity of the 1576 cm−1 peak changed very slightly with a change in the D2O proportion, as the sites that originally interacted with D2O were involved in the formation of intramolecular hydrogen bonds, forming a G-quadruplex structure, and showed no intermolecular hydrogen bonding interactions with D2O. Although the A base also interacts with D2O to induce an alteration in the intensity of the 1574 cm−1 peak, the number of A bases in the G4 sequence is often very small. The smaller the number of A bases, the weaker the interaction with D2O. Therefore, there was almost no change in the intensity of the 1576 cm−1 peak with a change in the proportion of D2O. The 1399 cm−1 peak, attributable to the T base [20,23], only appeared in the G-quadruplex sequence, and its intensity decreased with the increasing proportion of D2O. This was because after the G-quadruplex structure was formed, T bases were located outside the G-tetrad or even in the G-quadruplex, which enabled them to move closer to the surface of the silver nanoparticles. Furthermore, the SERS signal of the T bases was enhanced more strongly, and therefore, the signal was revealed in the SERS spectra. Moreover, compared to that of the sequence that did not form the G-quadruplex structure, the intensity of the 731 cm−1 peak of the G-quadruplex sequence was exceptionally strong ([G3T]4 and TG7T did not contain A bases, and this shift was not associated with any peak). This observation was also likely due to the fact that after the G-quadruplex structure is formed, more A bases are located outside the G-tetrad or even the G-quadruplex. Consequently, they are located closer to the surface of the silver nanoparticles, and the A base SERS signal is more strongly enhanced. Therefore, in the G-quadruplex sequence containing A and T bases, the intensities of the 1399 cm−1 and 731 cm−1 peaks reflected the number and stability of G-quadruplex structures. The greater the number and stability of G-quadruplexes, the greater the strength of these two peaks. Figure 6 shows that as the proportion of D2O increased, the intensities of the 1399 cm−1 and 730 cm−1 peaks were gradually reduced, indicating that D2O reduced the number and stability of G-quadruplex structures.
In addition, increasing the proportion of D2O in the solution gradually resulted in reduced intensities of the 1319 cm−1 and 1336 cm−1 peaks, whereas that of the 1368 cm−1 peak gradually increased. The positions and intensities of the Raman bands in the ranges 550–700 cm−1 and 1300–1380 cm−1 have been reported to be related to the glycosidic bond angle (GBA) conformation of all G, A, and T bases [36]. The number and type of GBAs contained in different G-quadruplexes are different, resulting in differences in the Raman shifts attributed to the GBA structure in the Raman signal of the G4 sequence. In the literature, the 1319 cm−1 and 1336 cm−1 peaks are assigned to dG C2′-endo/anti, and the 1368 cm−1 peak is assigned to dG C2′-endo/syn; (G3T)4 and TG7T does not contain the C2′-endo/syn structure, and therefore, the 1355 cm−1 peak was assigned to the C2′-endo/anti-structure [20,22]. The changes in the peak intensities at 1319 cm−1, 1336 cm−1, 1355 cm−1, and 1368 cm−1 indicated alterations in the C2′-endo/anti and C2′-endo/syn structures of the G base, which further reflected changes in the syn/anti-GBA conformation of the G-quadruplex.
In the G-quadruplex structure formed by (G3T)4 and TG7T, all sequences were arranged 5′-3′, and all GBAs adopted a trans conformation. Increasing the proportion of D2O gradually resulted in the reduced intensity of the 1355 cm−1 peak, indicating that the number of GBAs in the trans conformation gradually decreased, and the number or stability of G-quadruplexes decreased. In the G-quadruplex structure formed by the sequences of 93del, Tel21, GO18, and GO18T, the arrangement direction of the DNA strands was not uniform, and a few cis conformations were formed in the GBAs. (In the G-quadruplex structure formed by GO18 and GO18T, GBA is a trans conformation, but the cis-GBA signal also appears in the spectrum. Our guess is that their two-layer G-quadruplex structure is very close due to π-π stacking, which squeezes the three bases on the connecting chain, presenting a conformation quite similar to cis-GBA.) The SERS signal of the trans conformation GBAs was dominant in the SERS spectrum of the four G-quadruplex sequences. As the proportion of D2O increased, the intensities of the 1319 cm−1 and 1336 cm−1 peaks greatly decreased, indicating that the number of GBAs in the trans conformation decreased, whereas the intensity of the 1368 cm−1 peak, representing the cis conformation of GBAs, only slightly increased, indicating that the quantity or stability of the G-quadruplexes decreased.
In summary, D2O was not conducive to the formation and stability of the G-quadruplex structure, which is inconsistent with the conclusion that D2O stabilizes the folded structure of nucleic acids, as reported in the literature [8]. We believe that because of the increased viscosity, D2O induces DNA to fold, but this fold is not necessarily fixed and only randomly forms a part of the intramolecular hydrogen bonds. In the presence of the cationic buffer, the G-quadruplex structure formed by a specific sequence was fixed. However, D2O negatively affected this “fixation”, as it increased the tendency of DNA to fold into other random structures.
Therefore, for ssDNA that cannot form a specific structure, D2O promotes its random folding, whereas for ssDNA that does form a specific structure, D2O inhibits the process of folding into specific structures. This discovery has important implications for certain biological processes involving G-quadruplexes. For example, the human chromosome telomere sequence contains numerous G-quadruplex structures, and this is of particular importance, as telomeres have a significant impact on the occurrence of cancer, cell senescence, and apoptosis.
D2O reduces the number and stability of G-quadruplex structures, which provides a new demonstration to prove that D2O is not conducive to the survival, growth, and reproduction of organisms [37,38,39] but can lead to the occurrence of genetic mutations [40] and other deleterious physiological effects. In addition, D2O can also be used as a “regulatory switch” for G-quadruplexes, which could reduce the D2O content around the sequence when more G-quadruplexes are needed. Furthermore, the amount of D2O around the sequence would be decreased when fewer G-quadruplexes are needed, which would have potential applicability in research, including genetics, in vitro studies, and nucleotide medicine.
The above conclusion highlights the significance of studies on the interaction between D2O and ssDNA. Here are six conclusions that summarize the interactions between D2O and ssDNA. 1. D2O may have the following effects on DNA transcription and replications: (i) A small exchange of hydrogen and deuterium alters the bond energy and molecular activity of some bonds. (ii) The deuterium bond formed between the DNA molecule and D2O is stronger than the hydrogen bond, and the binding strength between DNA molecules, and consequently, the surface water, changes. (iii) D2O could alter the number of secondary structures such as G-quadruplexes that form part of the DNA, and these changes could affect DNA transcription, replication, and other processes. 2. The dsDNA forms numerous intramolecular hydrogen bonds through base pair complementation, but numerous groups can form intermolecular deuterium bonds with environmental D2O. Both RNA and ssDNA are single-stranded structures, and their interactions with D2O should be similar. Therefore, this study could enhance our understanding of the interactions between dsDNA, RNA, and H2O/D2O. 3. Oligonucleotide drugs are relatively stable, but it is also important to ensure stability during long-term storage and transportation. The interaction between D2O and ssDNA could change the activity of some groups. For some ssDNAs that can form a specific secondary structure, the number of secondary structures can also be changed. This can affect the interaction of ssDNA with other substances in the environment, thereby ensuring its stability. 4. Nucleic acid aptamers can bind to ligands with high affinity and strong specificity, which makes the slight change in the aptamer have a remarkable influence on binding. The effect of D2O on nucleic acids is almost constant, where there is a small hydrogen–deuterium exchange and numerous intermolecular hydrogen bonds, and the number of secondary structures is affected, which can serve as a means to appropriately alter the aptamer. This would increase the power and specificity of nucleic acid aptamers and ligand recognition, improving the sensitivity and specificity of aptamer-based biosensing. 5. The number of active H atoms or the number and type of groups capable of forming H bonds in different compounds vary; thus, the strength of the interaction between the bonds and D2O is theoretically different. By determining the intensity of the SERS peak or the degree of shift change, the active H of the compound and the number or type of groups that can form H bonds can be compared to identify the compound and determine whether the structure of the compound has changed. 6. Biological macromolecules contain numerous active H groups capable of forming hydrogen bonds, which are D2O active sites. As D2O and these active sites basically exhibit the same activity, an understanding of the interaction between D2O and ssDNA could provide a reference when studying the interaction between D2O and other biological macromolecules.
3. Materials and Methods

3.1. Samples and Reagents

ssDNA was purchased from Sangon Biotech Co., Ltd. (Shanghai, China), and Table 1 shows the sequences. Analytically pure silver nitrate (AgNO3), sodium citrate (Na3C6H5O7·2H2O), and nitric acid (HNO3) were purchased from Sinopharm Chemical Reagent Co., Ltd. (Shanghai, China). Analytically pure potassium iodide (KI) and MgSO4 and all other experimental reagents were purchased from Shanghai Titan Technology Co., Ltd. (Shanghai, China). Deionized water was used for all the experiments.

3.2. Instruments and Equipment

A Renishaw inVia confocal Raman spectrometer (Renishaw plc, London, UK), high-speed centrifuge (TG16-WS, Shanghai Lu Xiangyi Centrifuge Instrument Co., Ltd., Shanghai, China), multifunctional vortex mixer (Vortex-Genie2, Scientific Industries, Inc., New York, NY, USA), laboratory pure water system (Smart-D UV, Shanghai Hetai Instrument Co., Ltd., Shanghai, China), collector-type constant-temperature heating magnetic stirrer (ZNCL-TS, Shanghai Yike Instrument Co., Ltd., Shanghai, China), and an electronic balance are some of the main equipment used.

3.3. Sample Processing

In this experiment, the classic method of Lee [41] was used to prepare a nano-silver collagen solution, which was subsequently stored at 26 °C for 7 days before use. Appropriate volumes of water and D2O were added to the powdered ssDNA to prepare sample solutions with D2O proportions of 0%, 18.75%, 37.5%, 56.25%, 75%, and 100%. The ssDNA concentration was 25 μM. The prepared sample solutions were placed in a 90 °C water bath for 10 min, cooled to room temperature, and then placed at a temperature of 4 °C for 48 h. Then, 10 mL of silver collagen solution was centrifuged (7000 rpm, 10 min), and 100 μL of the supernatant was added to the same volume of KI (1 mM) solution, thoroughly mixed, and then incubated at room temperature for 30 min to clean the surface of the silver nanoparticles for later use. Furthermore, 5 μL of a concentrated gel was placed in an EP tube and mixed thoroughly with 5μL of the sample solution, followed by the addition of 0.8 μL of MgSO4 (20 mM) solution, and the mixture was allowed to stand before it was detected.

3.4. Raman Detection and Microscopy

A Renishaw inVia Raman confocal microscope coupled to a Leica DMi8/SP8 laser scanning confocal microscope system with a 532 nm diode laser as the excitation source (power of 25 mW) was directed at the sample, and an 1800 L/mm grating was used for the measurements. The laser was focused on the sample using an xL50 objective.

3.5. Data Processing

The collected raw data were normalized with the 1091 cm−1 peak (attributable to PO2 stretching vibration) as the standard. The spectra were not smoothed before they were graphed using the Origin software. Linear data were obtained by normalization and background subtraction.

4. Conclusions

ssDNA interacts with D2O in the environment, thereby affecting its structure and function. D2O mainly interacts with ssDNA through the A and G bases, and the higher their number, the greater the influence of D2O on the sequence structure. In the absence of certain specific secondary structures, the positions of the A and G bases in the sequence had almost no effect on the D2O–ssDNA interaction. Furthermore, D2O showed an inhibitory effect on the formation of the G-quadruplex structure based on the sequence. The interaction between the two can be leveraged to develop various new functional strategies and be used for the determination of secondary structures. ssDNA is not the only biomacromolecule of interest, as the interaction of RNAs (and proteins) with water also plays a significant role in determining their stability. In the future, SERS could be used to further explore the interactions of RNA, protein, and water.

Author Contributions

Conceptualization, C.J., Y.L., L.W. and F.L.; methodology, C.J. and Y.L.; software, C.J. and Y.L.; validation, C.J., F.L. and L.W.; formal analysis, C.J. and L.W.; investigation, C.J. and F.L.; resources, Y.L., L.W. and F.L.; data curation, C.J.; writing—original draft preparation, C.J. and Y.L.; writing—review and editing, C.J. and F.L.; visualization, Y.L.; supervision, L.W.; funding acquisition, F.L. All authors have read and agreed to the published version of the manuscript.

Funding

This research was funded by the Ministry of Science and Technology of the People’s Republic of China, grant number [2019YFC0312603] and Shanghai Military-Civilian Integration Development Project, grant number [2020-jmrh1-kj11].

Institutional Review Board Statement

Not applicable.

Informed Consent Statement

Not applicable.

Data Availability Statement

The data presented in this study are available on request from the corresponding author.

Acknowledgments

We thank Qiang Huang from Fudan University for helpful discussions on this manuscript.

Conflicts of Interest

The authors declare no conflict of interest.

Sample Availability

Samples of the compounds are available from the authors.

References

  1. Vorozhtsova, S.V.; Abrosimova, A.N.; Kulikova, E.I.; Dorozhkina, O.V.; Kovalenko, M.A.; Kriuchkova, D.M.; Severiukhin, Y.S.; Gaevskiĭ, V.N.; Siniak, I.E.; Ivanov, A.A. Modification of the Cytogenetic Effects of Irradiation by Water with the Reduced Content of Deuterium and Heavy Isotopes of Oxygen. Radiats. Biol. Radioecol. 2014, 54, 21–26. [Google Scholar] [PubMed]
  2. Pedersen, L.G.; Bartolotti, L.; Li, L. Deuterium and Its Role in the Machinery of Evolution. J. Theor. Biol. 2006, 238, 914–918. [Google Scholar] [CrossRef] [PubMed]
  3. Zhang, L.; Shi, L.; Shen, Y.; Miao, Y.; Wei, M.; Qian, N.; Liu, Y.; Min, W. Spectral Tracing of Deuterium for Imaging Glucose Metabolism. Nat. Biomed. Eng. 2019, 3, 402–413. [Google Scholar] [CrossRef] [PubMed]
  4. Shi, L.; Zheng, C.; Shen, Y.; Chen, Z.; Silveira, E.S.; Zhang, L.; Wei, M.; Liu, C.; de Sena-Tomas, C.; Targoff, K.; et al. Optical Imaging of Metabolic Dynamics in Animals. Nat. Commun. 2018, 9, 2995. [Google Scholar] [CrossRef]
  5. Voogt, J.N.; Awada, M.; Murphy, E.J.; Hayes, G.M.; Busch, R.; Hellerstein, M.K. Measurement of Very Low Rates of Cell Proliferation by Heavy Water Labeling of DNA and Gas Chromatography/Pyrolysis/Isotope Ratio-Mass Spectrometric Analysis. Nat. Protoc. 2007, 2, 3058–3062. [Google Scholar] [CrossRef]
  6. Farthing, D.E.; Buxbaum, N.P.; Lucas, P.J.; Maglakelidze, N.; Oliver, B.; Wang, J.; Hu, K.; Castro, E.; Bare, C.V.; Ronald, E.; et al. Comparing DNA Enrichment of Proliferating Cells Following Administration of Different Stable Isotopes of Heavy Water. Sci. Rep. 2017, 7, 4043. [Google Scholar] [CrossRef]
  7. Basov, A.; Fedulova, L.; Baryshev, M.; Dzhimak, S. Deuterium-Depleted Water Influence on the Isotope 2H/1H Regulation in Body and Individual Adaptation. Nutrients 2019, 11, 1903. [Google Scholar] [CrossRef]
  8. Pathak, A.K.; Bandyopadhyay, T. Water Isotope Effect on the Thermostability of a Polio Viral RNA Hairpin: A Metadynamics Study. J. Chem. Phys. 2017, 146, 165104. [Google Scholar] [CrossRef]
  9. Watson, M.A.; Cockroft, S.L. DNA Modulates Solvent Isotope Effects in a Nanopore. Chem. Commun. 2015, 51, 12243–12246. [Google Scholar] [CrossRef]
  10. Every, A.E.; Russu, I.M. Probing the Role of Hydrogen Bonds in the Stability of Base Pairs in Double-Helical DNA. Biopolymers 2007, 87, 165–173. [Google Scholar] [CrossRef]
  11. Dzhimak, S.S.; Drobotenko, M.I.; Basov, A.A.; Svidlov, A.A.; Fedulova, L.V.; Lyasota, O.M.; Baryshev, M.G. Mathematical Modeling of Open States in DNA Molecule Depending on the Deuterium Concentration in the Surrounding Liquid Media at Different Values of Hydrogen Bond Disruption Energy. Dokl. Biochem. Biophys. 2018, 483, 359–362. [Google Scholar] [CrossRef]
  12. Dzhimak, S.S.; Svidlov, A.A.; Basov, A.A.; Baryshev, M.G.; Drobotenko, M.I. The Effect of Single Deuterium Substitutions for Protium in a DNA Molecule on the Occurrence of Open States. Biophysics 2018, 63, 497–500. [Google Scholar] [CrossRef]
  13. Miyamoto, K.I.; Onodera, K.; Yamaguchi, R.T.; Ishibashi, K.; Kimura, Y.; Niwano, M. Hydration of Single-Stranded DNA in Water Studied by Infrared Spectroscopy. Chem. Phys. Lett. 2007, 436, 233–238. [Google Scholar] [CrossRef]
  14. Cheng, B.; Cui, S. Supramolecular Chemistry and Mechanochemistry of Macromolecules: Recent Advances by Single-Molecule Force Spectroscopy. Top. Curr. Chem. 2015, 369, 97–134. [Google Scholar]
  15. Schwartzberg, A.M.; Grant, C.D.; Wolcott, A.; Talley, C.E.; Huser, T.R.; Bogomolni, R.; Zhang, J.Z. Unique Gold Nanoparticle Aggregates as a Highly Active Surface-Enhanced Raman Scattering Substrate. J. Phys. Chem. B 2004, 108, 19191–19197. [Google Scholar] [CrossRef]
  16. Albrecht, M.G.; Creighton, J.A. Anomalously Intense Raman Spectra of Pyridine at a Silver Electrode. J. Am. Chem. Soc. 1977, 99, 5215–5217. [Google Scholar] [CrossRef]
  17. Papadopoulou, E.; Bell, S.E.J. Label-Free Detection of Single-Base Mismatches in DNA by Surface-Enhanced Raman Spectroscopy. Angew. Chem. Int. Ed. Engl. 2011, 50, 9058–9061. [Google Scholar] [CrossRef]
  18. Papadopoulou, E.; Bell, S.E. Label-Free Detection of Nanomolar Unmodified Single- and Double-Stranded DNA by Using Surface-Enhanced Raman Spectroscopy on Ag and Au Colloids. Chemistry 2012, 18, 5394–5400. [Google Scholar] [CrossRef]
  19. Xu, L.J.; Lei, Z.C.; Li, J.; Zong, C.; Yang, C.J.; Ren, B. Label-Free Surface-Enhanced Raman Spectroscopy Detection of DNA with Single-Base Sensitivity. J. Am. Chem. Soc. 2015, 137, 5149–5154. [Google Scholar] [CrossRef]
  20. Li, Y.; Han, X.; Zhou, S.; Yan, Y.; Xiang, X.; Zhao, B.; Guo, X. Structural Features of DNA G-Quadruplexes Revealed by Surface-Enhanced Raman Spectroscopy. Phys. Chem. Lett. 2018, 9, 3245–3252. [Google Scholar] [CrossRef]
  21. Song, Y.; Cui, L.; López, J.A.S.; Xu, J.; Zhu, Y.-G.; Thompson, I.P.; Huang, W.E. Raman-Deuterium Isotope Probing for In-Situ Identification of Antimicrobial Resistant Bacteria in Thames River. Sci. Rep. 2017, 7, 16648. [Google Scholar] [CrossRef] [Green Version]
  22. Palacký, J.; Orlíčková, M.V.; Kejnovská, I.; Mojzeš, P. Polymorphism of Human Telomeric Quadruplex Structure Controlled by DNA Concentration: A Raman Study. Nucleic Acids Res. 2013, 41, 1005–1016. [Google Scholar] [CrossRef]
  23. Miljanić, S.; Ratkaj, M.; Matković, M.; Piantanida, I.; Gratteri, P.; Bazzicalupi, C. Assessment of Human Telomeric G-Quadruplex Structures Using Surface-Enhanced Raman Spectroscopy. Anal. Bioanal. Chem. 2017, 409, 2285–2295. [Google Scholar] [CrossRef]
  24. Friedman, S.J.; Terentis, A.C. Analysis of G-Quadruplex Conformations Using Raman and Polarized Raman Spectroscopy. J. Raman Spectrosc. 2016, 47, 259–268. [Google Scholar] [CrossRef]
  25. Gao, Y.; Gong, N.; Sun, C.; Fang, W.; Wang, S.; Men, Z. Stimulated Raman Scattering Investigation of Isotopic Substitution H2O/D2O System. J. Mol. Liq. 2020, 297, 111923. [Google Scholar] [CrossRef]
  26. Feng, B.; Sosa, R.P.; Mårtensson, A.K.F.; Jiang, K.; Tong, A.; Dorfman, K.D.; Takahashi, M.; Lincoln, P.; Bustamante, C.J.; Westerlund, F.; et al. Hydrophobic Catalysis and a Potential Biological Role of DNA Unstacking Induced by Environment Effects. Proc. Natl. Acad. Sci. USA 2019, 116, 17169–17174. [Google Scholar] [CrossRef]
  27. Raiber, E.A.; Kranaster, R.; Lam, E.; Nikan, M.; Balasubramanian, S. A Non-Canonical DNA Structure Is a Binding Motif for the Transcription Factor SP1 In Vitro. Nucleic Acids Res. 2012, 40, 1499–1508. [Google Scholar] [CrossRef]
  28. Lin, L.Y.; McCarthy, S.; Powell, B.M.; Manurung, Y.; Xiang, I.M.; Dean, W.L.; Chaires, B.; Yatsunyk, L.A. Biophysical and X-Ray Structural Studies of the (GGGTT)3GGG G-Quadruplex in Complex with N-Methyl Mesoporphyrin IX. PLoS ONE 2020, 15, e0241513. [Google Scholar] [CrossRef]
  29. Ray, A.; Panigrahi, S.; Bhattacharyya, D. A Comparison of Four Different Conformations Adopted by Human Telomeric G-Quadruplex Using Computer Simulations. Biopolymers 2016, 105, 83–99. [Google Scholar] [CrossRef]
  30. Xiaolong, S.; Weitong, Z.; Ishaq, U.M.; Yuen, W.H.; Zijing, S.; Yingpeng, X.; Yingchao, Z.; Liang, Y.; Kit, K.C.; Xin, D. RNA G-Quadruplex Structures Mediate Gene Regulation in Bacteria. mBio 2020, 11, e02926-19. [Google Scholar]
  31. Liu, G.; Du, W.; Xu, H.; Sun, Q.; Tang, D.; Zou, S.; Zhang, Y.; Ma, M.; Zhang, G.; Du, X.; et al. RNA G-Quadruplex Regulates microRNA-26a Biogenesis and Function. J. Hepatol. 2020, 73, 371–382. [Google Scholar] [CrossRef] [PubMed]
  32. Masai, H.; Kanoh, Y.; Kakusho, N.; Fukatsu, R. Detection of Cellular G-Quadruplex by Using a Loop Structure as a Structural Determinant. Biochem. Biophys. Res. Commun. 2020, 531, 75–83. [Google Scholar] [CrossRef] [PubMed]
  33. Kouzine, F.; Wojtowicz, D.; Yamane, A.; Casellas, R.; Przytycka, T.M.; Levens, D.L. In Vivo Chemical Probing for G-Quadruplex Formation. Methods Mol. Biol. 2019, 2035, 369–382. [Google Scholar] [PubMed]
  34. Comez, L.; Bianchi, F.; Libera, V.; Longo, M.; Petrillo, C.; Sacchetti, F.; Sebastiani, F.; D’Amico, F.; Rossi, B.; Gessini, A.; et al. Polymorphism of Human Telomeric Quadruplexes with Drugs: A Multi-Technique Biophysical Study. Phys. Chem. Chem. Phys. 2020, 22, 11583–11592. [Google Scholar] [CrossRef]
  35. Gao, S.; Hu, B.; Zheng, X.; Liu, D.; Sun, M.; Qin, J.; Zhou, H.; Jiao, B.; Wang, L. Study of the Binding Mechanism Between Aptamer GO18-T-d and Gonyautoxin 1/4 by Molecular Simulation. Phys. Chem. Chem. Phys. 2016, 18, 23458–23461. [Google Scholar] [CrossRef]
  36. Benevides, J.M.; Overman, S.A.; Thomas, G.J., Jr. Raman, Polarized Raman and Ultraviolet Resonance Raman Spectroscopy of Nucleic Acids and Their Complexes. J. Raman Spectrosc. 2005, 36, 279–299. [Google Scholar] [CrossRef]
  37. Kselíková, V.; Zachleder, V.; Bišová, K. To Divide or Not to Divide? How Deuterium Affects Growth and Division of Chlamydomonas reinhardtii. Biomolecules 2021, 11, 861. [Google Scholar] [CrossRef]
  38. Kampmeyer, C.; Johansen, J.V.; Holmberg, C.; Karlson, M.; Gersing, S.K.; Bordallo, H.N.; Kragelund, B.B.; Lerche, M.H.; Jourdain, I.; Winther, J.R.; et al. Mutations in a Single Signaling Pathway Allow Cell Growth in Heavy Water. ACS Synth. Biol. 2020, 9, 733–748. [Google Scholar] [CrossRef]
  39. Lee, P.J.; Park, H.J.; Cho, N.; Kim, H.P. Aquaporin 11-Dependent Inhibition of Proliferation by Deuterium Oxide in Activated Hepatic Stellate Cells. Molecules 2018, 23, 3209. [Google Scholar] [CrossRef]
  40. Ajibola, W.; Karcagi, I.; Somlyai, G.; Somlyai, I.; Fehér, T. Deuterium-depletion has no significant impact on the mutation rate of Escherichia coli, deuterium abundance therefore has a probabilistic, not deterministic effect on spontaneous mutagenesis. PLoS ONE 2021, 16, e0243517. [Google Scholar] [CrossRef]
  41. Lee, P.C.; Meisel, D. Adsorption and Surface-Enhanced Raman of Dyes on Silver and Gold Sols. J. Phys. Chem. 1982, 86, 3391–3395. [Google Scholar] [CrossRef]
Figure 1. Surface-enhanced Raman spectroscopy (SERS) spectra of random and pure base sequences.
Molecules 27 06023 g001aMolecules 27 06023 g001b
Figure 2. Structural diagram of the four bases. Among them, A bases and G bases contain five-membered ring structures, which increase the sites of interaction with D2O.
Molecules 27 06023 g002
Figure 3. Detection of T10C10 and TC20 sequences.
Molecules 27 06023 g003
Figure 4. SERS detection of sequences. (a) G4ATC, G8ATC (-1, -2, -3), and G12ATC sequences detected at different concentrations of heavy water (D2O). (b) Trend of changes in intensity of the peak at 1576 cm−1 in G4ATC, G8ATC-1, G12ATC, G8ATC-1, G8ATC-2, and G8ATC-3 sequences with different concentrations of D2O and linear equation of the peak intensity at 1576 cm−1 related to heavy water (D2O) proportion.
Molecules 27 06023 g004aMolecules 27 06023 g004b
Figure 5. SERS detection of sequences. (a) A4GTC, A8GTC (-1, -2, and -3), and A12GTC sequences in heavy water (D2O) with different concentrations. (b) Trend of changes in intensities of the peaks at 731 and 1574 cm−1 of A4GTC, A8GTC-2(-3), A12GTC, A8GTC-1, A8GTC-2, and A8GTC-3 sequences in different concentrations of D2O and linear equation of peak intensities at 731 and 1574 cm−1 with respect to heavy water (D2O) proportion.
Molecules 27 06023 g005aMolecules 27 06023 g005b
Figure 6. Detection of the G-quadruplex sequence in the presence of different concentrations of heavy water (D2O).
Molecules 27 06023 g006aMolecules 27 06023 g006b
Figure 7. G-quadruplex structures formed by TG7T, 93del, (G3T)4, Tel21, GO18, and GO18T. In the presence of the corresponding cation, sequence d(TG7T) forms a tetramolecular structure, all chains are arranged in the 5′-3′ direction, and all GBAs adopt the trans conformation. 93del K: Parallel embedded bimolecular interlocking structure with cis–trans alternating GBAs and multiple loop structures; d(G3T)4 K: parallel single-molecule structure with three loop structures, and all GBAs adopt the trans conformation; Tel21 Na: antiparallel monomolecular structure, GBAs with cis–trans alternate conformation, three loop structures; GO18 Na and GO18T Na: parallel single-molecule structure with three loop structures, and all GBAs adopt the trans conformation.
Molecules 27 06023 g007
Table 1. Single-stranded DNA (ssDNA) sequences and the sequences they represent.
NameSequence (5′-3′)NameSequence (5′-3′)
SJ16GTGAGCTGGCGGCAACG12ATCGAGCGATGGGAGCGGAGTGG
SJ20CAGGTCCAGGCTGCAGGTAGA4GTCATCCGATCCGATCCGATCCG
A20AAAAAAAAAAAAAAAAAAAAA8GTC-1ATCAGATCAGATCAGATCAG
G14GGGGGGGGGGGGGGA8GTC-2ATACGATACGATACGATACG
C20CCCCCCCCCCCCCCCCCCCCA8GTC-3TACAGTACAGTACAGTACAG
T20TTTTTTTTTTTTTTTTTTTTA12GTCATAAGAACAGAACAGATAAG
T10C10TTTTTTTTTTCCCCCCCCCC(G3T)4GGGTGGGTGGGTGGGT
TC20TCTCTCTCTCTCTCTCTCTCTG7TTGGGGGGGT
G4ATCATCCGATCCGATCCGATCCGTel21GGGTTAGGGTTAGGGTTAGGG
G8ATC-1ATCGGATCGGATCGGATCGG93delGGGGTGGGAGGAGGGT
G8ATC-2ATGCGATGCGATGCGATGCGGO18AACCTTTGGTCGGGCAAGGTAGGTT
G8ATC-3AGTCGAGTCGAGTCGAGTCGGO18TTTGGTCGGGCAAGGTAGGTT
Publisher’s Note: MDPI stays neutral with regard to jurisdictional claims in published maps and institutional affiliations.