
A Liquid Chromatography-Mass Spectrometry Method to Study the Interaction between Membrane Proteins and Low-Molecular-Weight Compound Mixtures

 , ,
, ,
Abstract
:
1. Introduction
2. Results
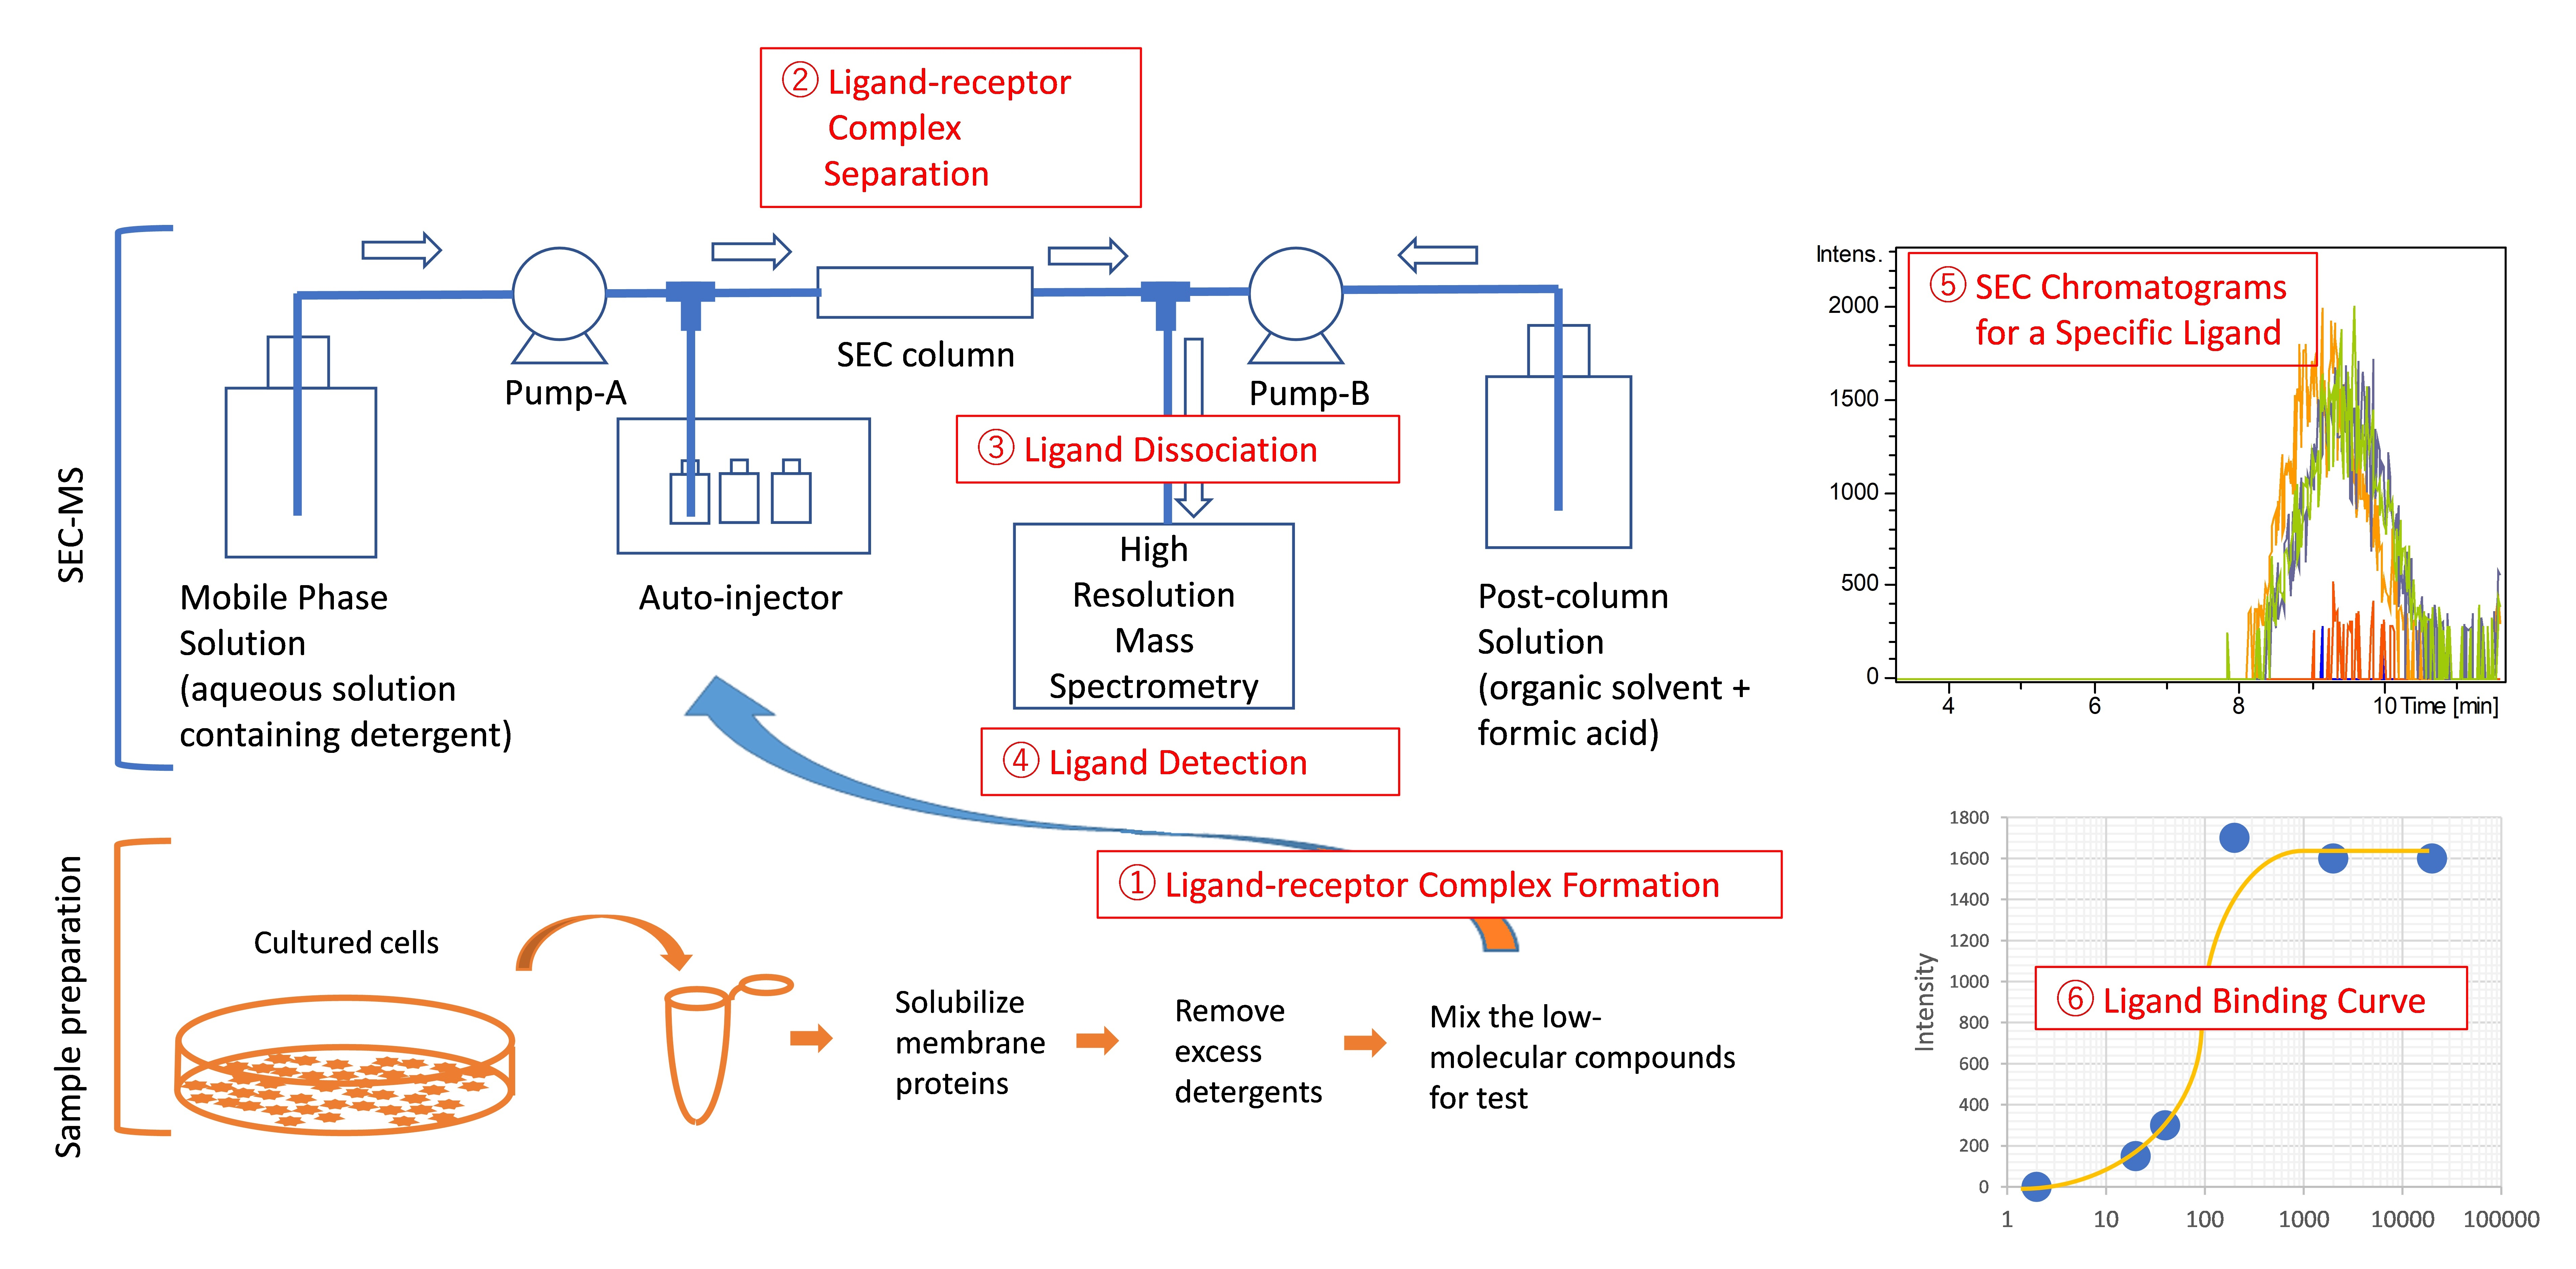
2.1. Development of a SEC-MS Method for Detecting Interactions between A431 Cell-Derived Membrane Proteins and Lapatinib
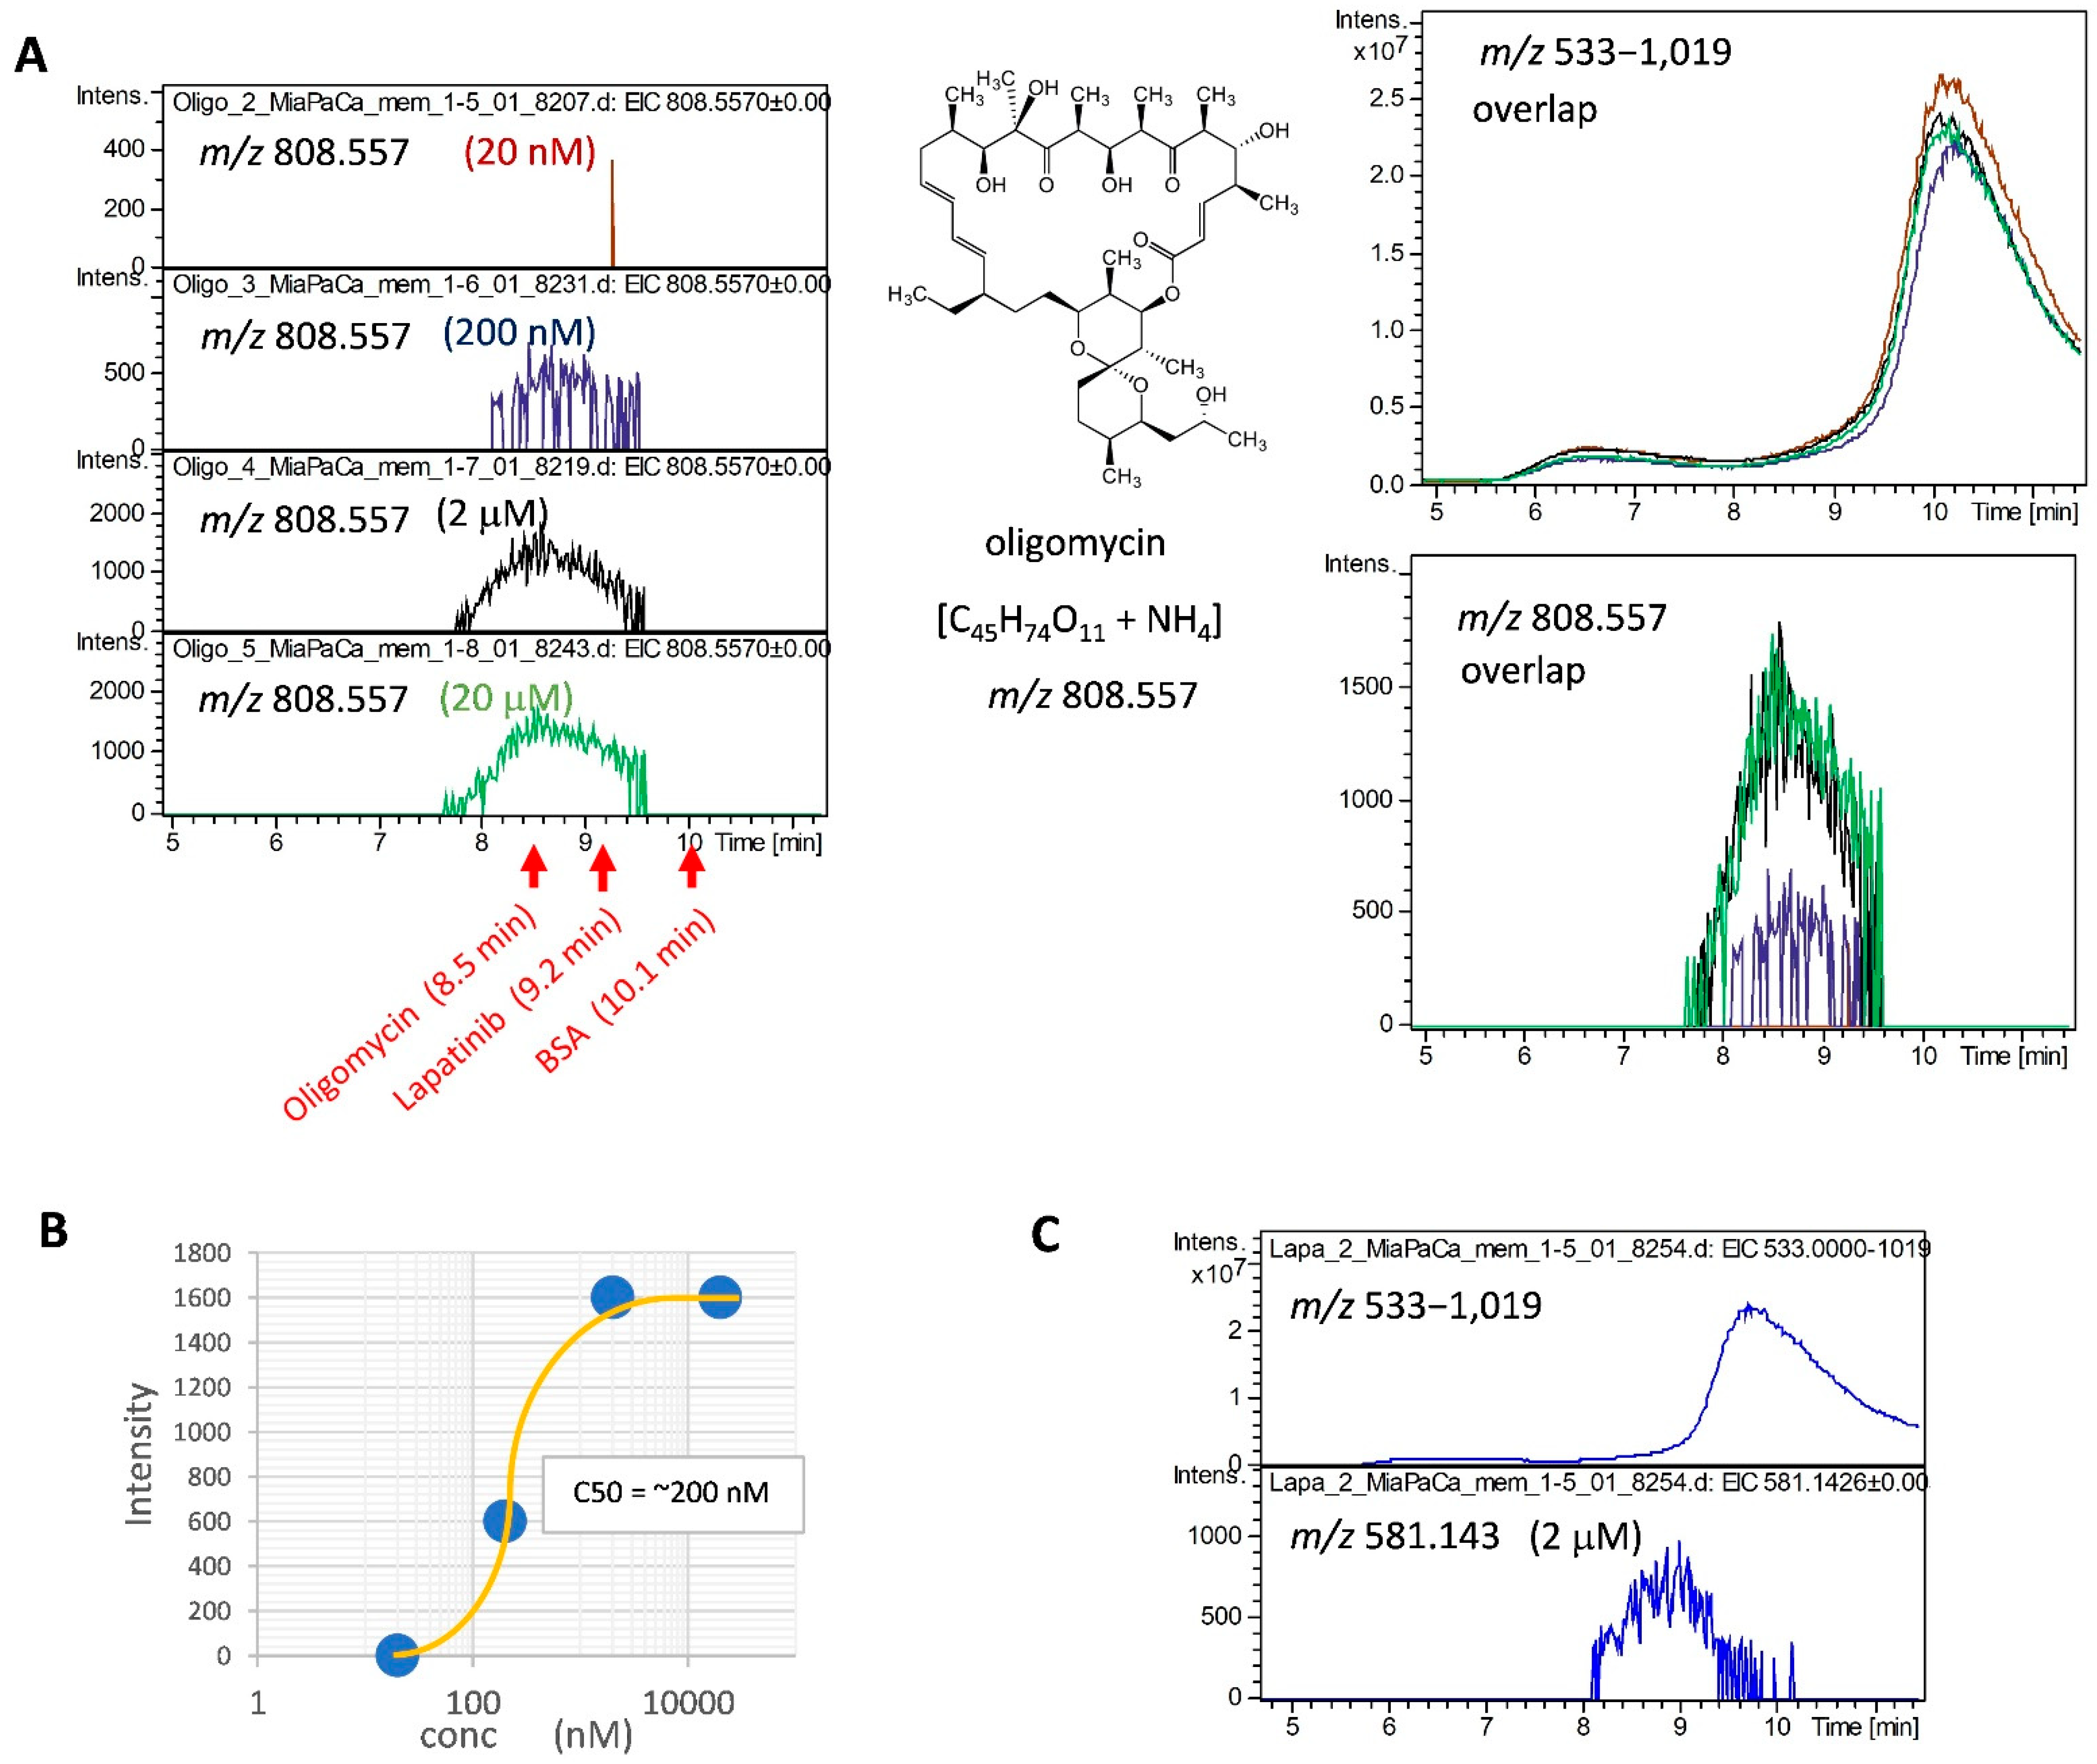
2.2. Detection of MiaPaCa Cell-Derived Membrane Protein Interactions with LMW Inhibitors
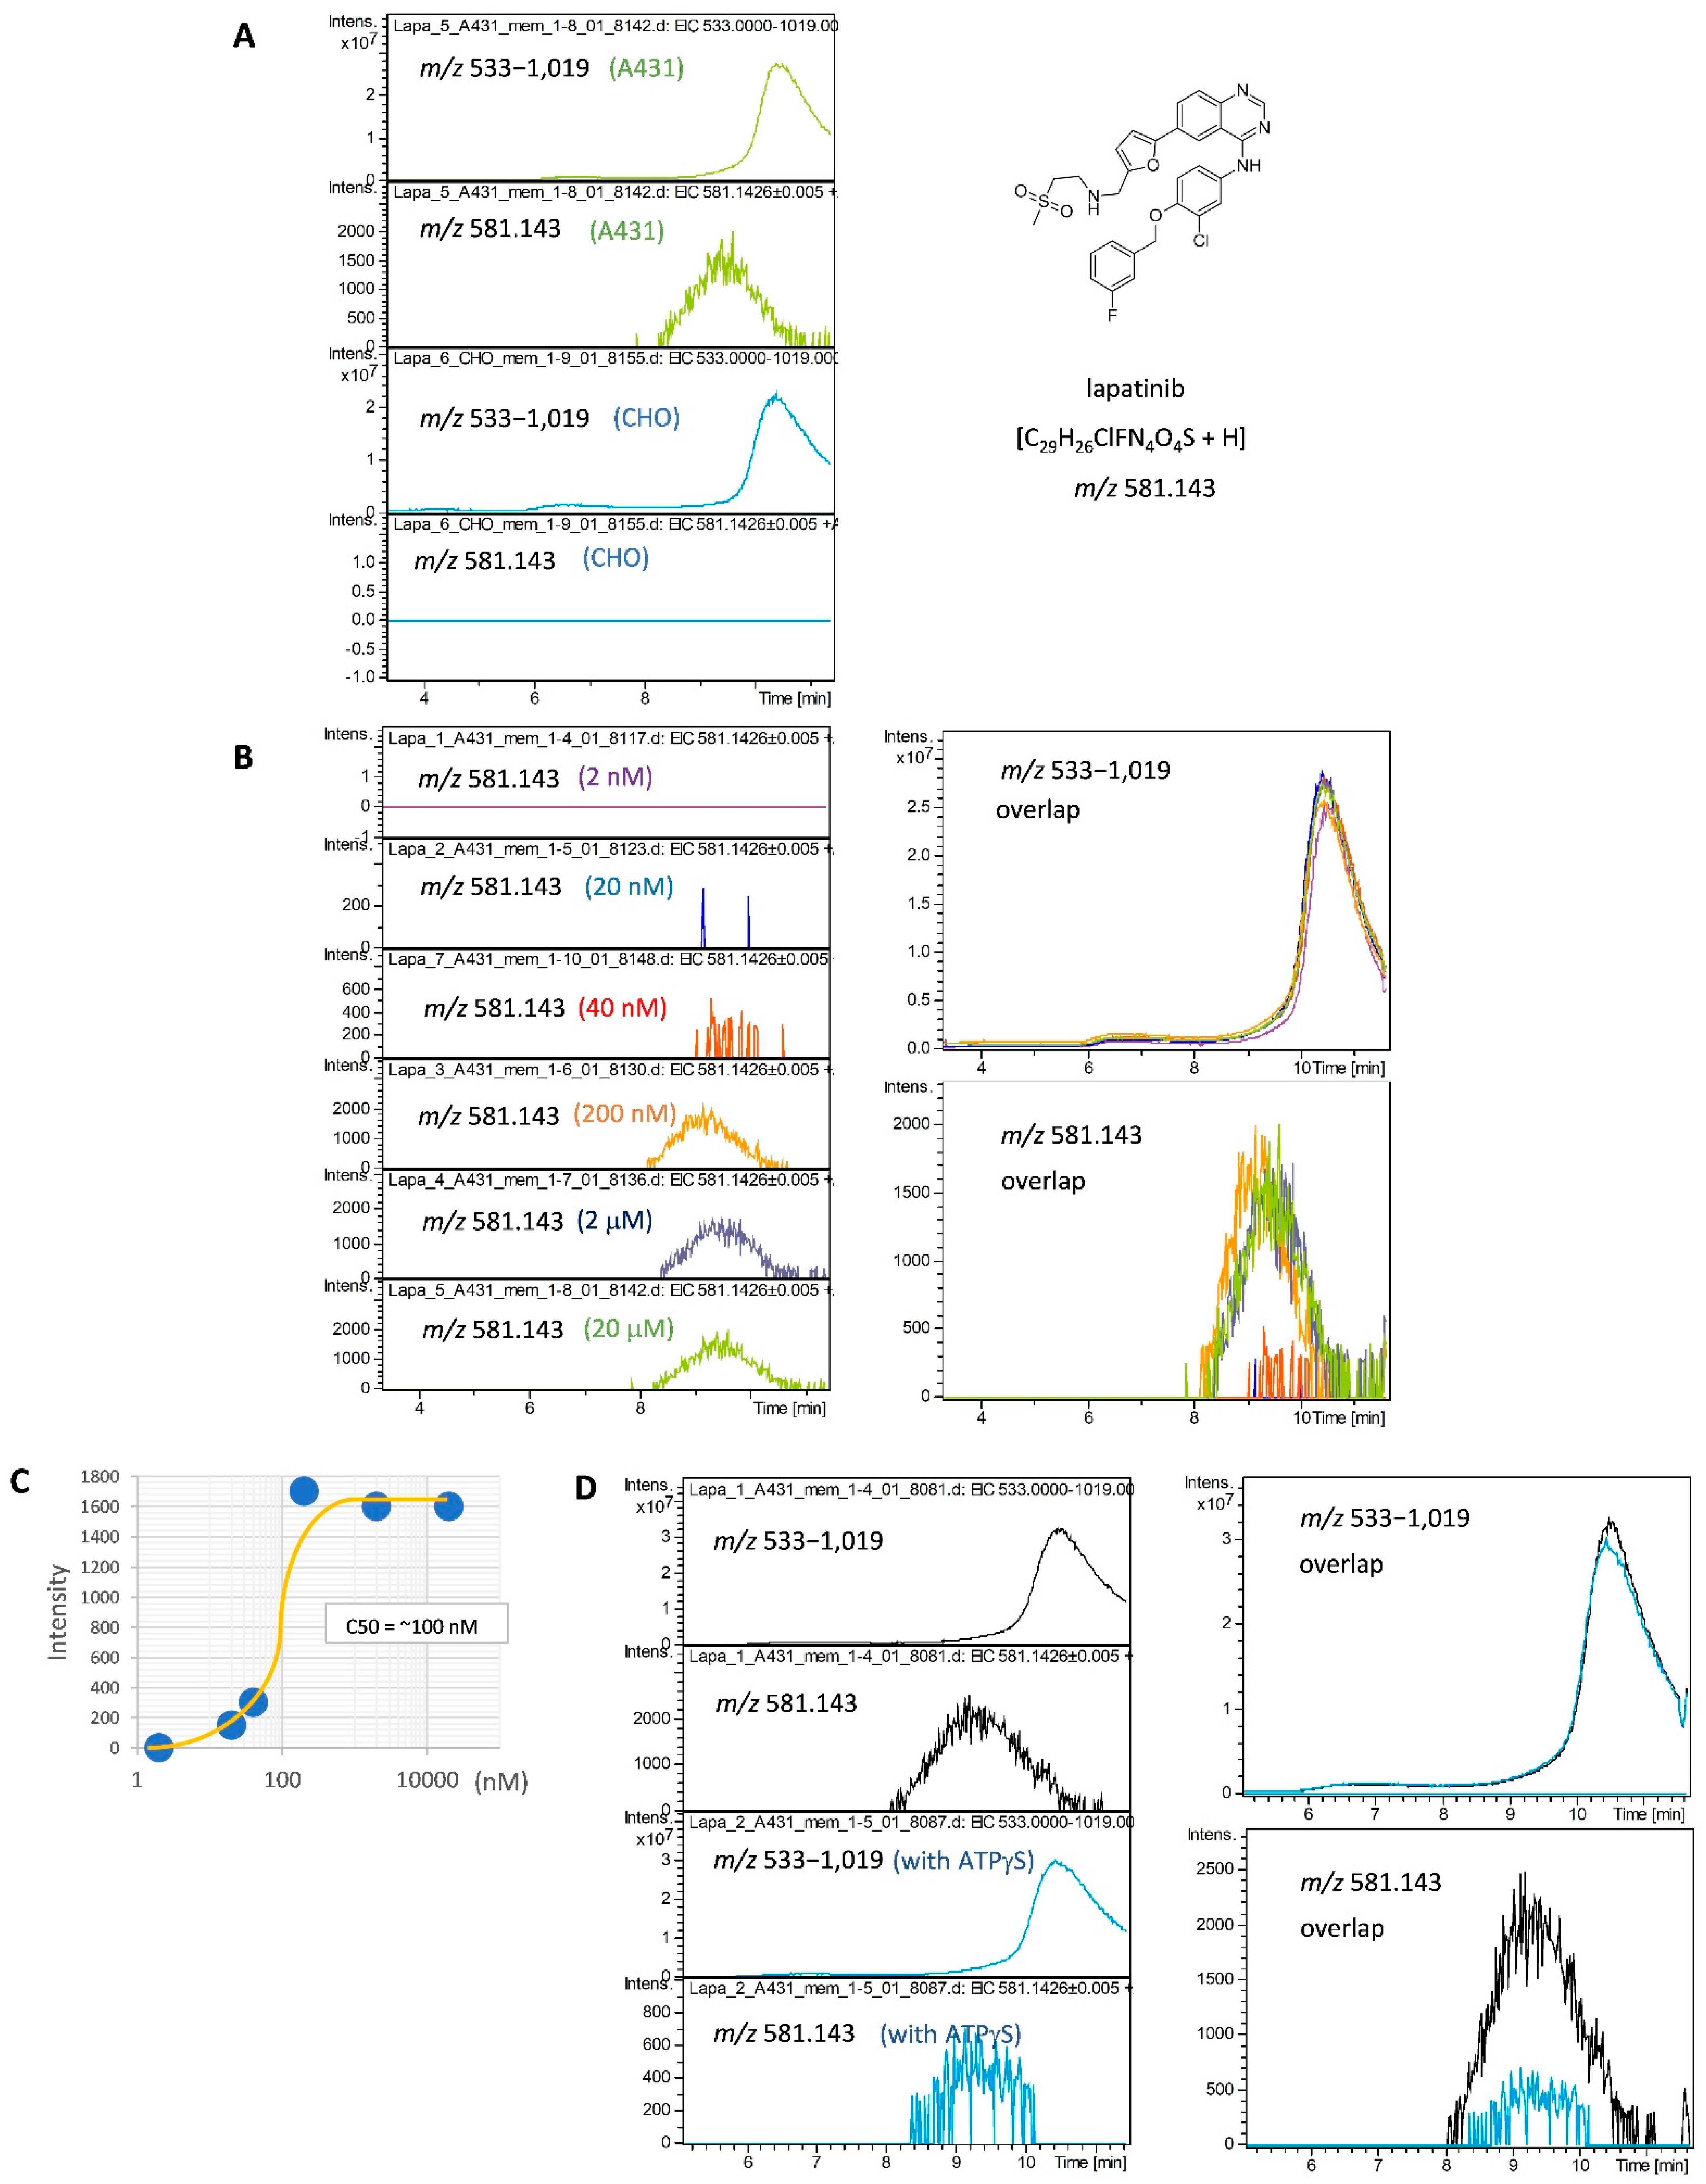
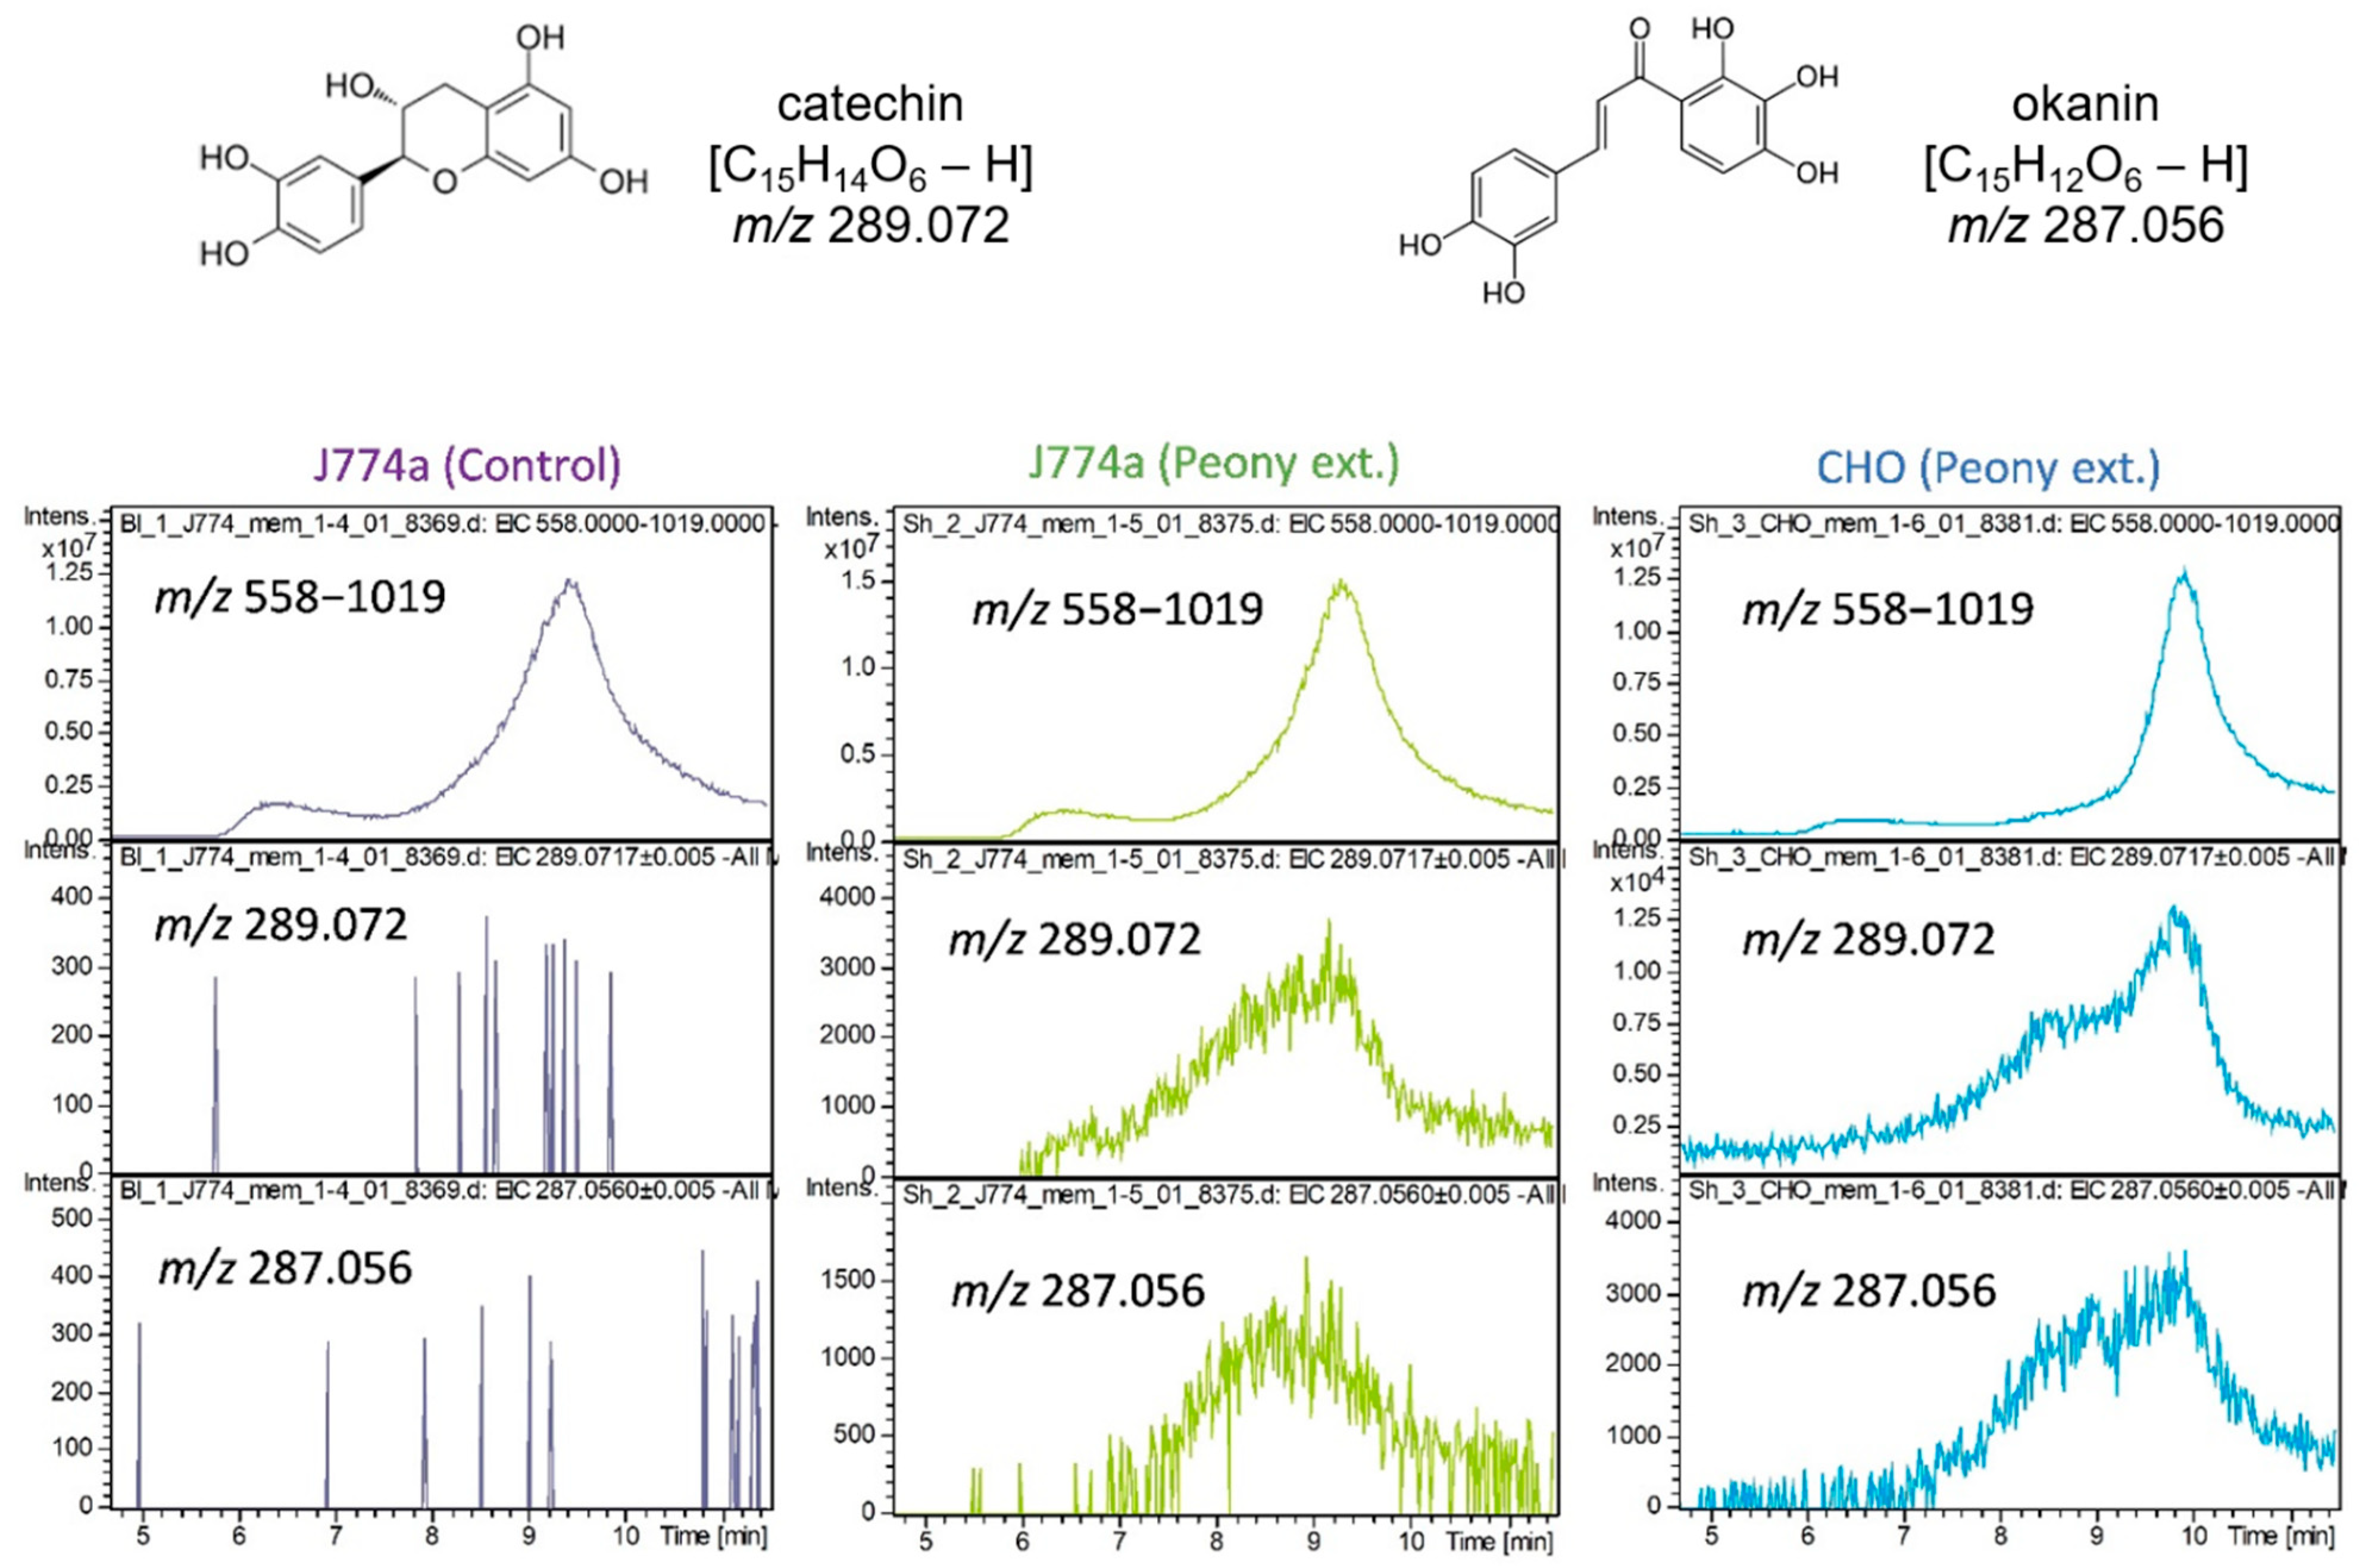
2.3. Interaction of Cultured Cell-Derived Membrane Proteins with Ingredients Extracted from Paeonia lactiflora
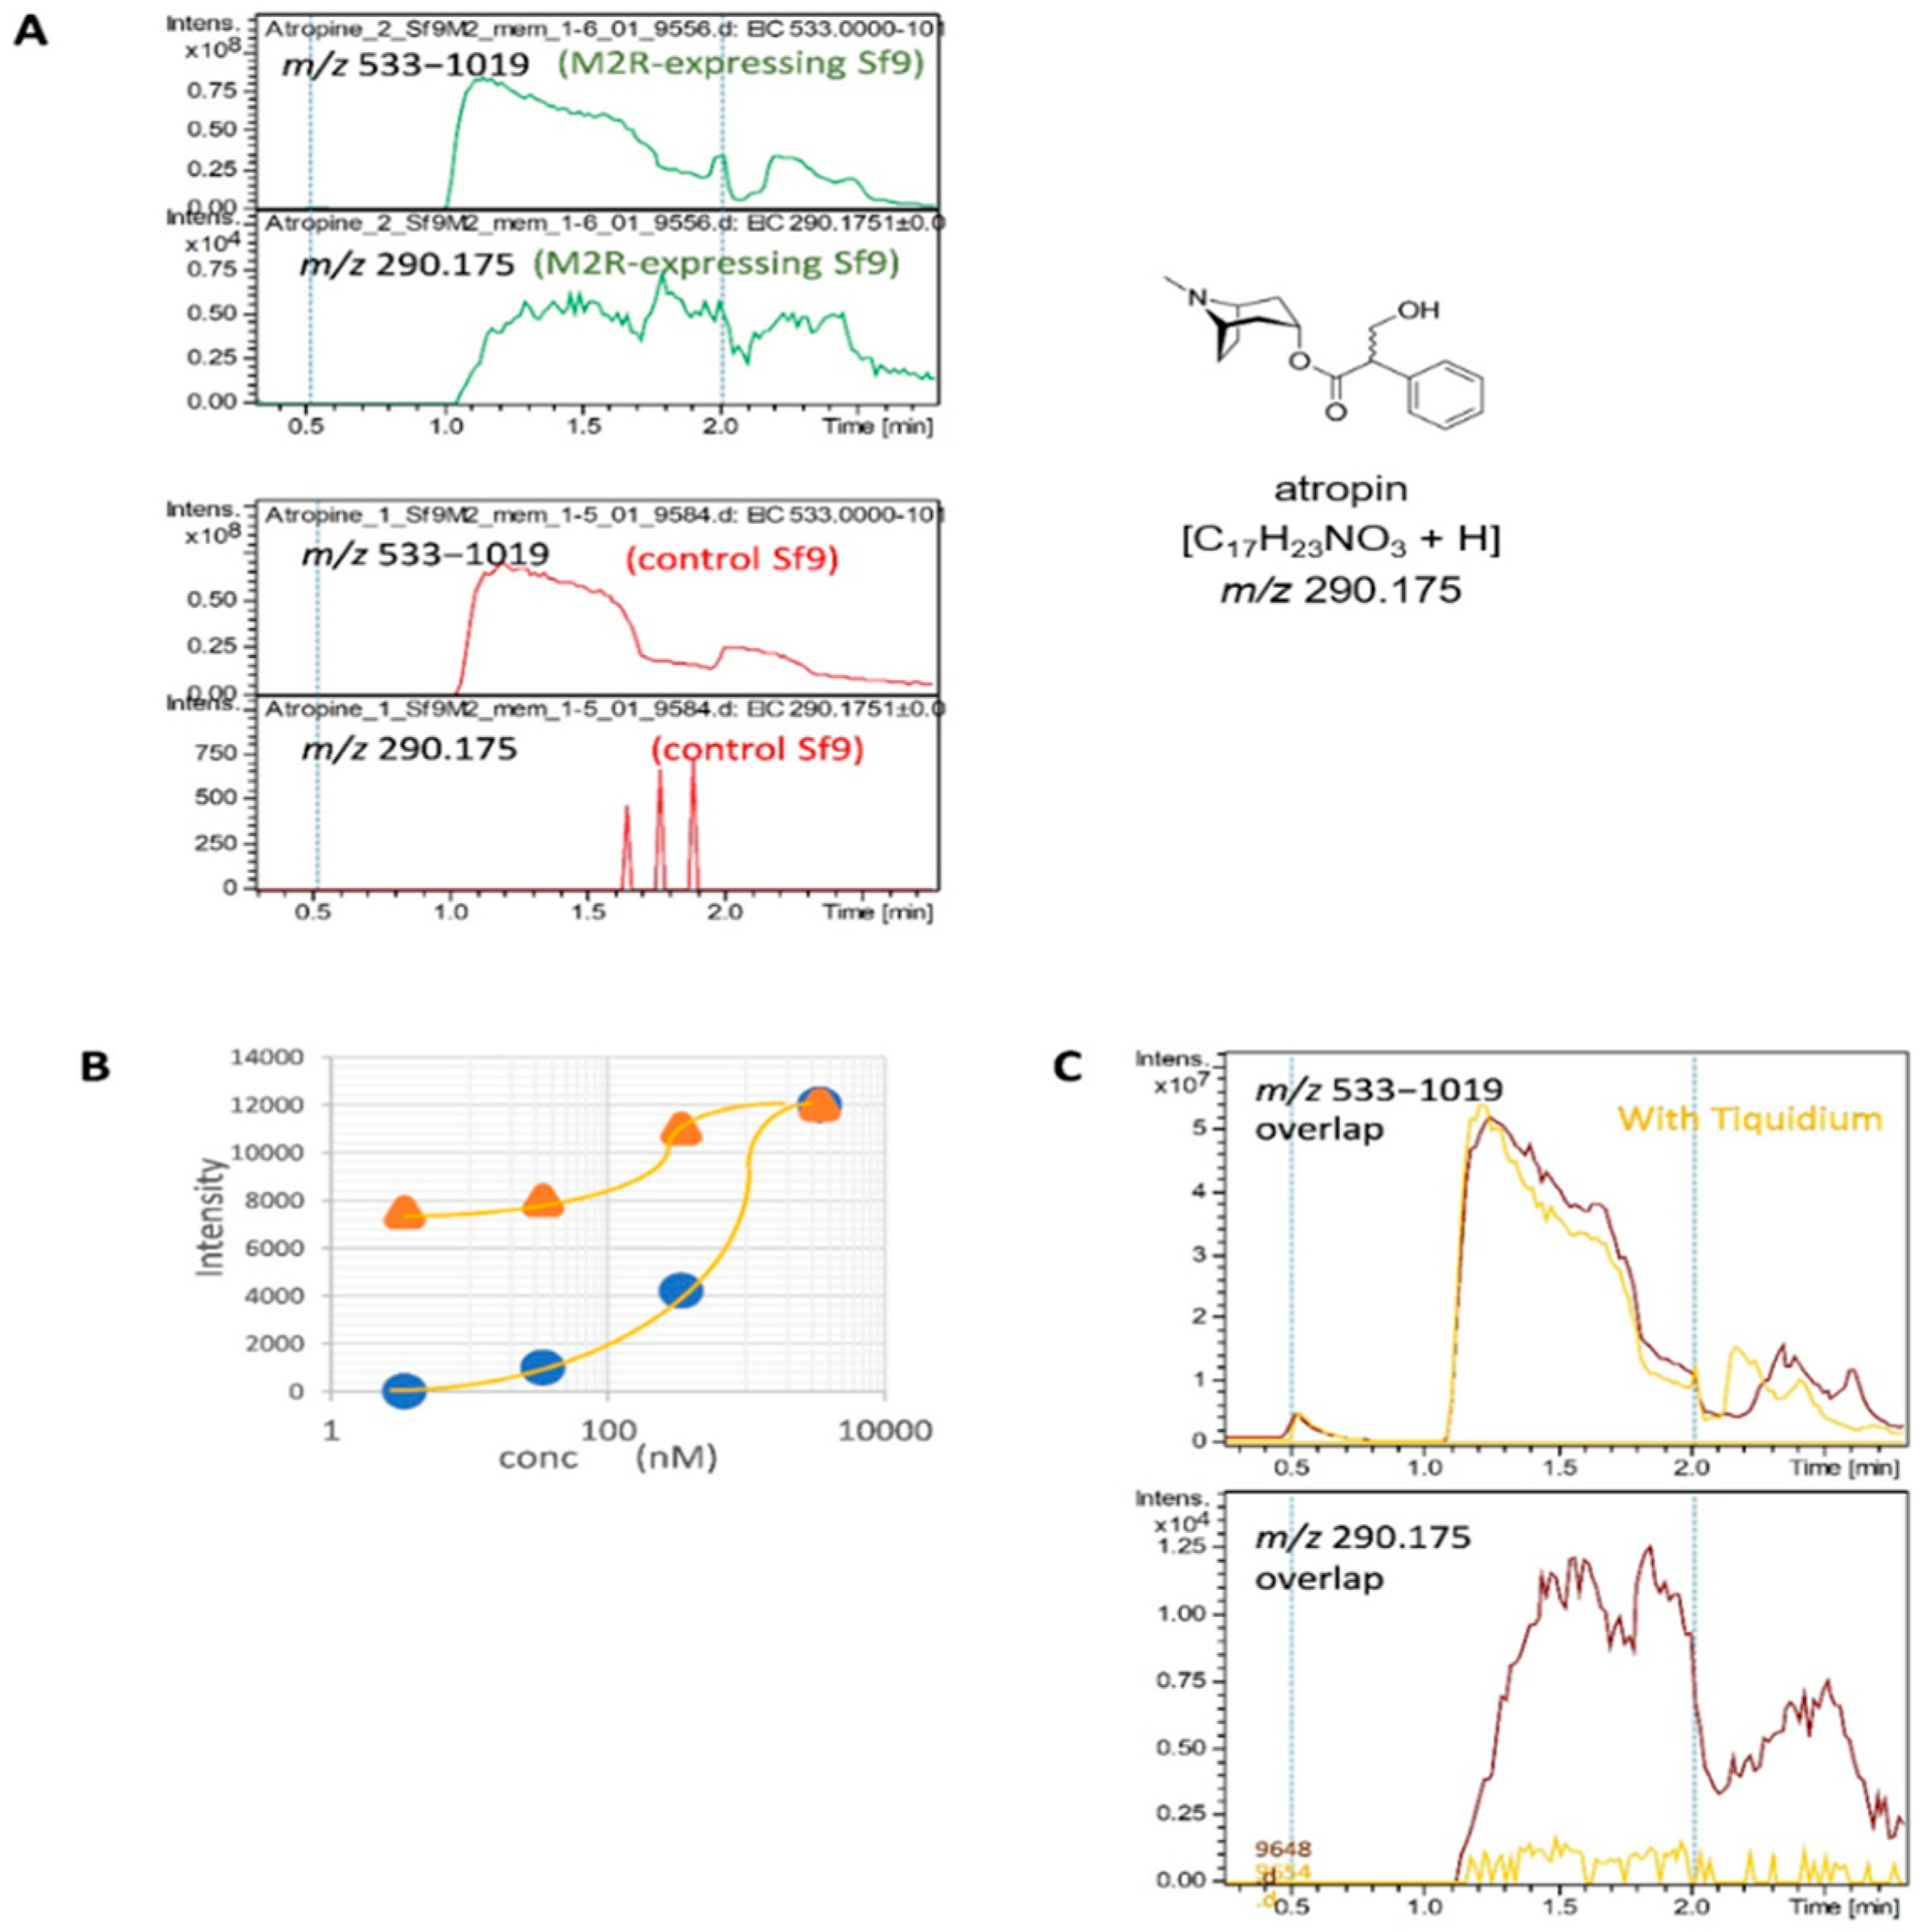
2.4. Detection of the Interaction of Human M2 Muscarinic Acetylcholine Receptor-Overexpressing Sf9 Cell-Derived Membrane Proteins with Atropine
3. Discussion
Limitations of the Study
4. Materials and Methods
4.1. Key Materials
4.2. Cell Culture
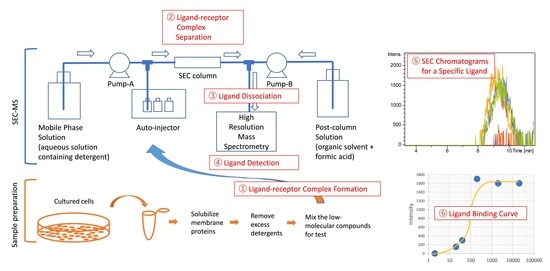
4.3. Method Details
4.3.1. Preparation of Membrane Protein-Enriched Fractions
4.3.2. Ligand-Receptor Complex Formation
4.3.3. Liquid Chromatography
4.3.4. Mass Spectrometry
4.3.5. Profiling Membrane Proteins
4.3.6. Profiling Peony Ingredients
4.3.7. Method Modification for GPCR (Sf9 Cells Overexpressing M2R)
5. Conclusions
Supplementary Materials
Author Contributions
Funding
Data Availability Statement
Acknowledgments
Conflicts of Interest
Sample Availability
References
- McFedries, A.; Schwaid, A.; Saghatelian, A. Methods for the elucidation of protein-small molecule interactions. Chem. Biol. 2013, 20, 667–673. [Google Scholar] [CrossRef] [PubMed] [Green Version]
- Patching, S.G. Surface plasmon resonance spectroscopy for characterisation of membrane protein-ligand interactions and its potential for drug discovery. Biochim. Biophys. Acta Biomembr. 2014, 1838, 43–55. [Google Scholar] [CrossRef] [PubMed] [Green Version]
- Hevener, K.E.; Pesavento, R.; Ren, J.H.; Lee, H.; Ratia, K.; Johnson, M.E. Hit-to-Lead: Hit Validation and Assessment. Methods Enzymol. 2018, 610, 265–309. [Google Scholar] [CrossRef] [PubMed]
- Migoń, D.; Wasilewski, T.; Suchy, D. Application of QCM in Peptide and Protein-Based Drug Product Development. Molecules 2020, 15, 3950. [Google Scholar] [CrossRef] [PubMed]
- Schettini, N.; Jaroszeski, M.J.; West, L.; Saddow, S.E. Hemocompatibility Assessment of 3C-SiC for Cardiovascular Applications. Silicon Carbide Biotechnol. 2012, 153–208. [Google Scholar] [CrossRef] [Green Version]
- Krell, T.; Lacal, J.; García-Fontana, C.; Silva-Jiménez, H.; Rico-Jiménez, M.; Lugo, A.C.; Darias, J.A.R.; Ramos, J.-L. Characterization of molecular interactions using isothermal titration calorimetry. In Pseudomonas Methods and Protocols. Methods in Molecular Biology; Filloux, A., Ramos, J.L., Eds.; Humana: New York, NY, USA, 2014; Volume 1149, pp. 193–203. [Google Scholar] [CrossRef]
- Rich, R.L.; Errey, J.; Marshall, F.; Myszka, D.G. Biacore analysis with stabilized G-protein-coupled receptors. Anal. Biochem. 2011, 409, 267–272. [Google Scholar] [CrossRef] [PubMed] [Green Version]
- Kitagawa, D.; Gouda, M.; Kirii, Y. Quick evaluation of kinase inhibitors by surface plasmon resonance using single-site specifically biotinylated kinases. J. Biomol. Screen. 2014, 19, 453–461. [Google Scholar] [CrossRef] [PubMed] [Green Version]
- Gavriilidou, A.F.M.; Gülbakan, B.; Zenobi, R. Influence of Ammonium Acetate Concentration on Receptor-Ligand Binding Affinities Measured by Native Nano ESI-MS: A Systematic Study. Anal. Chem. 2015, 87, 10378–10384. [Google Scholar] [CrossRef] [PubMed]
- Gault, J.; Donlan, J.; Liko, I.; Hopper, J.T.; Gupta, K.; Housden, N.G.; Struwe, W.; Marty, M.; Mize, T.; Bechara, C.; et al. High-resolution mass spectrometry of small molecules bound to membrane proteins. Nat. Methods 2016, 13, 333–336. [Google Scholar] [CrossRef] [Green Version]
- Mehmood, S.; Marcoux, J.; Gault, J.; Quigley, A.; Michaelis, S.; Young, S.G.; Carpenter, E.P.; Robinson, C.V. Mass spectrometry captures off-target drug binding and provides mechanistic insights into the human metalloprotease ZMPSTE24. Nat. Chem. 2016, 8, 1152–1158. [Google Scholar] [CrossRef] [PubMed]
- Ren, C.; Bailey, A.O.; VanderPorten, E.; Oh, A.; Phung, W.; Mulvihill, M.M.; Harris, S.F.; Liu, Y.; Han, G.; Sandoval, W. Quantitative Determination of Protein-Ligand Affinity by Size Exclusion Chromatography Directly Coupled to High-Resolution Native Mass Spectrometry. Anal. Chem. 2019, 91, 903–911. [Google Scholar] [CrossRef] [PubMed]
- Deng, G.; Sanyal, G. Applications of mass spectrometry in early stages of target based drug discovery. J. Pharm. Biomed. Anal. 2006, 40, 528–538. [Google Scholar] [CrossRef] [PubMed]
- Annis, D.A.; Nickbarg, E.; Yang, X.; Ziebell, M.R.; Whitehurst, C.E. Affinity selection-mass spectrometry screening techniques for small molecule drug discovery. Curr. Opin. Chem. Biol. 2007, 11, 518–526. [Google Scholar] [CrossRef] [PubMed]
- Chen, X.; Qin, S.; Chen, S.; Li, J.; Li, L.; Wang, Z.; Wang, Q.; Lin, J.; Yang, C.; Shui, W. A Ligand-observed Mass Spectrometry Approach Integrated into the Fragment Based Lead Discovery Pipeline. Sci. Rep. 2015, 5, srep08361. [Google Scholar] [CrossRef] [PubMed] [Green Version]
- He, J.; Meng, L.; Ruppel, J.; Yang, J.; Kaur, S.; Xu, K. Automated, Generic Reagent and Ultratargeted 2D-LC-MS/MS Enabling Quantification of Biotherapeutics and Soluble Targets down to pg/mL Range in Serum. Anal. Chem. 2020, 92, 9412–9420. [Google Scholar] [CrossRef] [PubMed]
- Zhou, J.L.; An, J.J.; Li, P.; Li, H.J.; Jiang, Y.; Cheng, J.F. Two-dimensional turbulent flow chromatography coupled on-line to liquid chromatography-mass spectrometry for solution-based ligand screening against multiple proteins. J. Chromatogr. A 2009, 1216, 2394–2403. [Google Scholar] [CrossRef] [PubMed]
- Zhang, K.; Wang, J.; Tsang, M.; Wigman, L.; Chetwyn, N. Two-dimensional HPLC in pharmaceutical analysis. Am. Pharm. Rev. 2013, 16, 39–44. Available online: https://www.americanpharmaceuticalreview.com/Featured-Articles/151949-Two-Dimensional-HPLC-in-Pharmaceutical-Analysis/ (accessed on 14 July 2022).
- Flarakos, J.; Morand, K.L.; Vouros, P. High-throughput solution-based medicinal library screening against human serum albumin. Anal. Chem. 2005, 77, 1345–1353. [Google Scholar] [CrossRef] [PubMed]
- VanAernum, Z.L.; Busch, F.; Jones, B.J.; Jia, M.; Chen, Z.; Boyken, S.E.; Sahasrabuddhe, A.; Baker, D.; Wysocki, V.H. Rapid online buffer exchange for screening of proteins, protein complexes and cell lysates by native mass spectrometry. Nat. Protoc. 2020, 15, 1132–1157. [Google Scholar] [CrossRef] [PubMed] [Green Version]
- Gavriilidou Agni, A.F.M.; Sokratous, K.; Yen, H.-Y.; De Colibus, L. High-Throughput Native Mass Spectrometry Screening in Drug Discovery. Front. Mol. Biosci. 2022, 9, 837901. [Google Scholar] [CrossRef] [PubMed]
- Rogawski, R.; Rogel, A.; Bloch, I.; Gal, M.; Horovitz, A.; London, N.; Sharon, M. Intracellular Protein–Drug Interactions Probed by Direct Mass Spectrometry of Cell Lysates. Angew. Chem. Int. Ed. 2021, 60, 19637–19642. [Google Scholar] [CrossRef] [PubMed]
- Takano, K.; Arai, S.; Sakamoto, S.; Ushijima, H.; Ikegami, T.; Saikusa, K.; Konuma, T.; Hamachi, I.; Akashi, S. Screening of protein-ligand interactions under crude conditions by native mass spectrometry. Anal. Bioanal. Chem. 2020, 412, 4037–4043. [Google Scholar] [CrossRef]
- Vousdoukas, M.; Mentaschi, L.; Voukouvalas, E.; Verlaan, M.; Jevrejeva, S.; Jackson, L.; Feyen, L. Native Desorption Electrospray Ionization Liberates Soluble and Membrane Protein Complexes from Surfaces. Angew. Chem. Int. Ed. 2017, 56, 14463–14468. [Google Scholar] [CrossRef] [Green Version]
- Chorev, D.S.; Robinson, C.V. Response to Comment on “Protein assemblies ejected directly from native membranes yield complexes for mass spectrometry”. Science 2019, 366, 829–834. [Google Scholar] [CrossRef] [PubMed] [Green Version]
- Mullard, A. What does AlphaFold mean for drug discovery? Nat. Rev. Drug Discov. 2021, 20, 725–727. [Google Scholar] [CrossRef] [PubMed]
- Rajak, P.; Roy, S.; Pal, A.K.; Paramanik, M.; Dutta, M.; Podder, S.; Sarkar, S.; Ganguly, A.; Mandi, M.; Dutta, A.; et al. In silico study reveals binding potential of rotenone at multiple sites of pulmonary surfactant proteins: A matter of concern. Curr. Res. Toxicol. 2021, 2, 411–423. [Google Scholar] [CrossRef] [PubMed]
- Wiseman, D.N.; Otchere, A.; Patel, J.H.; Uddin, R.; Pollock, N.L.; Routledge, S.J.; Rothnie, A.J.; Slack, C.; Poyner, D.R.; Bill, R.M.; et al. Expression and purification of recombinant G protein-coupled receptors: A review. Protein Expr. Purif. 2020, 167, 105524. [Google Scholar] [CrossRef]
- O’Connell, N. Protein Ligand Interactions Using Surface Plasmon Resonance. Methods Mol. Biol. 2021, 2365, 3–20. [Google Scholar]
- Rusnak, D.W.; Lackey, K.; Affleck, K.; Wood, E.R.; Alligood, K.J.; Rhodes, N.; Keith, B.R.; Murray, D.M.; Knight, W.B.; Mullin, R.J.; et al. The effects of the novel, reversible epidermal growth factor receptor/ErbB-2 tyrosine kinase inhibitor, GW2016, on the growth of human normal and tumor-derived cell lines in vitro and in vivo. Mol. Cancer Ther. 2001, 1, 85–94. [Google Scholar]
- Polier, S.; Samant, R.S.; Clarke, P.A.; Workman, P.; Prodromou, C.; Pearl, L.H. ATP-competitive inhibitors block protein kinase recruitment to the Hsp90-Cdc37 system. Nat. Chem. Biol. 2013, 9, 307–312. [Google Scholar] [CrossRef] [Green Version]
- Ishihama, Y.; Oda, Y.; Tabata, T.; Sato, T.; Nagasu, T.; Rappsilber, J.; Mann, M. Exponentially modified protein abundance index (emPAI) for estimation of absolute protein amount in proteomics by the number of sequenced peptides per protein. Mol. Cell Proteom. 2005, 4, 1265–1272. [Google Scholar] [CrossRef] [Green Version]
- Xu, C.-H.; Wang, P.; Wang, Y.; Yang, Y.; Li, D.-H.; Li, H.-F.; Sun, S.-Q.; Wu, X.-Z. Pharmacokinetic comparisons of two different combinations of Shaoyao-Gancao Decoction in rats: Competing mechanisms between paeoniflorin and glycyrrhetinic acid. J. Ethnopharmacol. 2013, 149, 443–452. [Google Scholar] [CrossRef] [PubMed]
- Kaifuchi, N.; Omiya, Y.; Kushida, H.; Fukutake, M.; Nishimura, H.; Kase, Y. Effects of shakuyakukanzoto and its absorbed components on twitch contractions induced by physiological Ca2+ release in rat skeletal muscle. J. Nat. Med. 2015, 69, 287–295. [Google Scholar] [CrossRef] [PubMed] [Green Version]
- Xu, Q.; Fu, Q.; Li, Z.; Liu, H.; Wang, Y.; Lin, X.; He, R.; Zhang, X.; Ju, Z.; Campisi, J.; et al. The flavonoid procyanidin C1 has senotherapeutic activity and increases lifespan in mice. Nat. Metab. 2021, 3, 1706–1726. [Google Scholar] [CrossRef] [PubMed]
- Ogiso, H.; Association, T.P.R. Component analysis of herbal medicines using liquid chromatography/time-of flight mass spectrometry. Annu. Rep. Toyama Prefect Inst. Pharm. Res. 2019, 46, 28–31. Available online: https://www.pref.toyama.jp/documents/10535/h30shoho.pdf (accessed on 14 July 2022).
- Suno, R.; Lee, S.; Maeda, S.; Yasuda, S.; Yamashita, K.; Hirata, K.; Horita, S.; Tawaramoto, M.S.; Tsujimoto, H.; Murata, T.; et al. Structural insights into the subtype-selective antagonist binding to the M2 muscarinic receptor. Nat. Chem. Biol. 2018, 14, 1150–1158. [Google Scholar] [CrossRef]
- Dias, D.A.; Urban, S.; Roessner, U. A Historical overview of natural products in drug discovery. Metabolites 2012, 2, 303–336. [Google Scholar] [CrossRef] [PubMed] [Green Version]
- Chung, V.C.H.; Wu, X.; Hui, E.P.; Ziea, E.T.C.; Ng, S.-M.; Ho, R.S.T.; Tsoi, K.K.F.; Wong, S.Y.-S.; Wu, J.C.Y. Effectiveness of Chinese herbal medicine for cancer palliative care: Overview of systematic reviews with meta-analyses. Sci. Rep. 2015, 5, 1–15. [Google Scholar] [CrossRef] [Green Version]
- Wang, Y.; Wang, Q.; Li, C.; Lu, L.; Zhang, Q.; Zhu, R.; Wang, W. A Review of Chinese Herbal Medicine for the Treatment of Chronic Heart Failure. Curr. Pharm. Des. 2017, 23, 5115–5124. [Google Scholar] [CrossRef]
- Dong, Y.; Chen, H.; Gao, J.; Liu, Y.; Li, J.; Wang, J. Bioactive ingredients in Chinese herbal medicines that target non-coding RNAs: Promising new choices for disease treatment. Front. Pharmacol. 2019, 10, 515. [Google Scholar] [CrossRef] [Green Version]
- Miyahara, Y.; Shintani, K.; Hayashihara-Kakuhou, K.; Zukawa, T.; Morita, Y.; Nakazawa, T.; Yoshida, T.; Ohkubo, T.; Uchiyama, S. Effect of UVC Irradiation on the Oxidation of Histidine in Monoclonal Antibodies. Sci. Rep. 2020, 10, 6333. [Google Scholar] [CrossRef] [PubMed]


Publisher’s Note: MDPI stays neutral with regard to jurisdictional claims in published maps and institutional affiliations. |
© 2022 by the authors. Licensee MDPI, Basel, Switzerland. This article is an open access article distributed under the terms and conditions of the Creative Commons Attribution (CC BY) license (https://creativecommons.org/licenses/by/4.0/).
Share and Cite
Ogiso, H.; Suno, R.; Kobayashi, T.; Kawami, M.; Takano, M.; Ogasawara, M. A Liquid Chromatography-Mass Spectrometry Method to Study the Interaction between Membrane Proteins and Low-Molecular-Weight Compound Mixtures. Molecules 2022, 27, 4889. https://doi.org/10.3390/molecules27154889
Ogiso H, Suno R, Kobayashi T, Kawami M, Takano M, Ogasawara M. A Liquid Chromatography-Mass Spectrometry Method to Study the Interaction between Membrane Proteins and Low-Molecular-Weight Compound Mixtures. Molecules. 2022; 27(15):4889. https://doi.org/10.3390/molecules27154889
Chicago/Turabian StyleOgiso, Hideo, Ryoji Suno, Takuya Kobayashi, Masashi Kawami, Mikihisa Takano, and Masaru Ogasawara. 2022. "A Liquid Chromatography-Mass Spectrometry Method to Study the Interaction between Membrane Proteins and Low-Molecular-Weight Compound Mixtures" Molecules 27, no. 15: 4889. https://doi.org/10.3390/molecules27154889
APA StyleOgiso, H., Suno, R., Kobayashi, T., Kawami, M., Takano, M., & Ogasawara, M. (2022). A Liquid Chromatography-Mass Spectrometry Method to Study the Interaction between Membrane Proteins and Low-Molecular-Weight Compound Mixtures. Molecules, 27(15), 4889. https://doi.org/10.3390/molecules27154889