
GPR183 Regulates 7α,25-Dihydroxycholesterol-Induced Oxiapoptophagy in L929 Mouse Fibroblast Cell

 ,
, 
Abstract
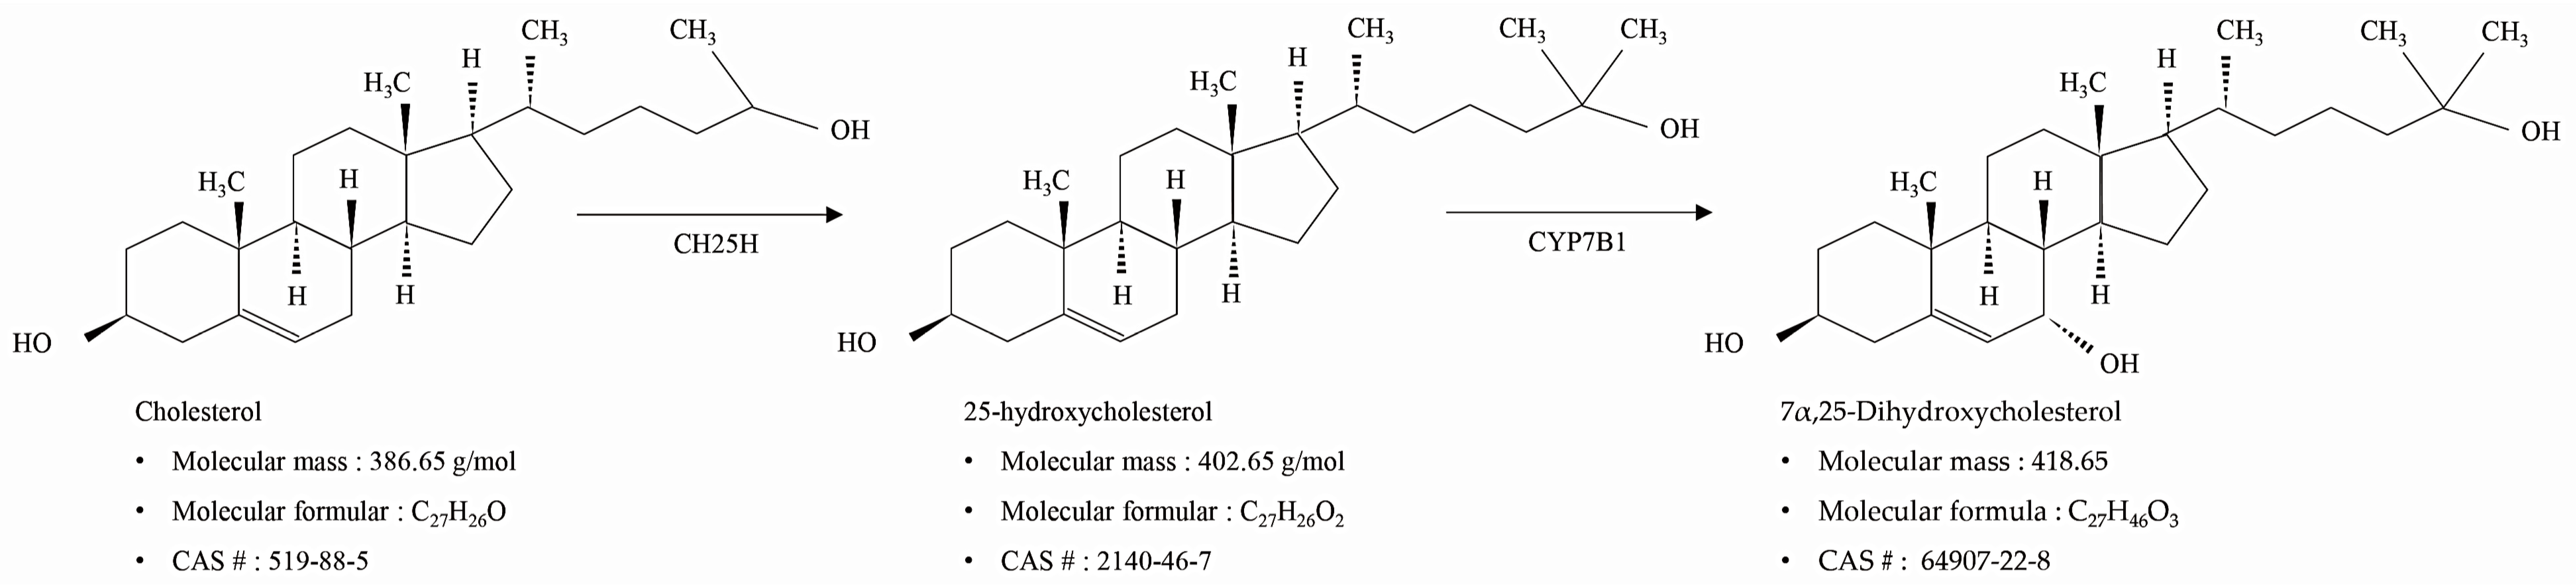
:1. Introduction
2. Results
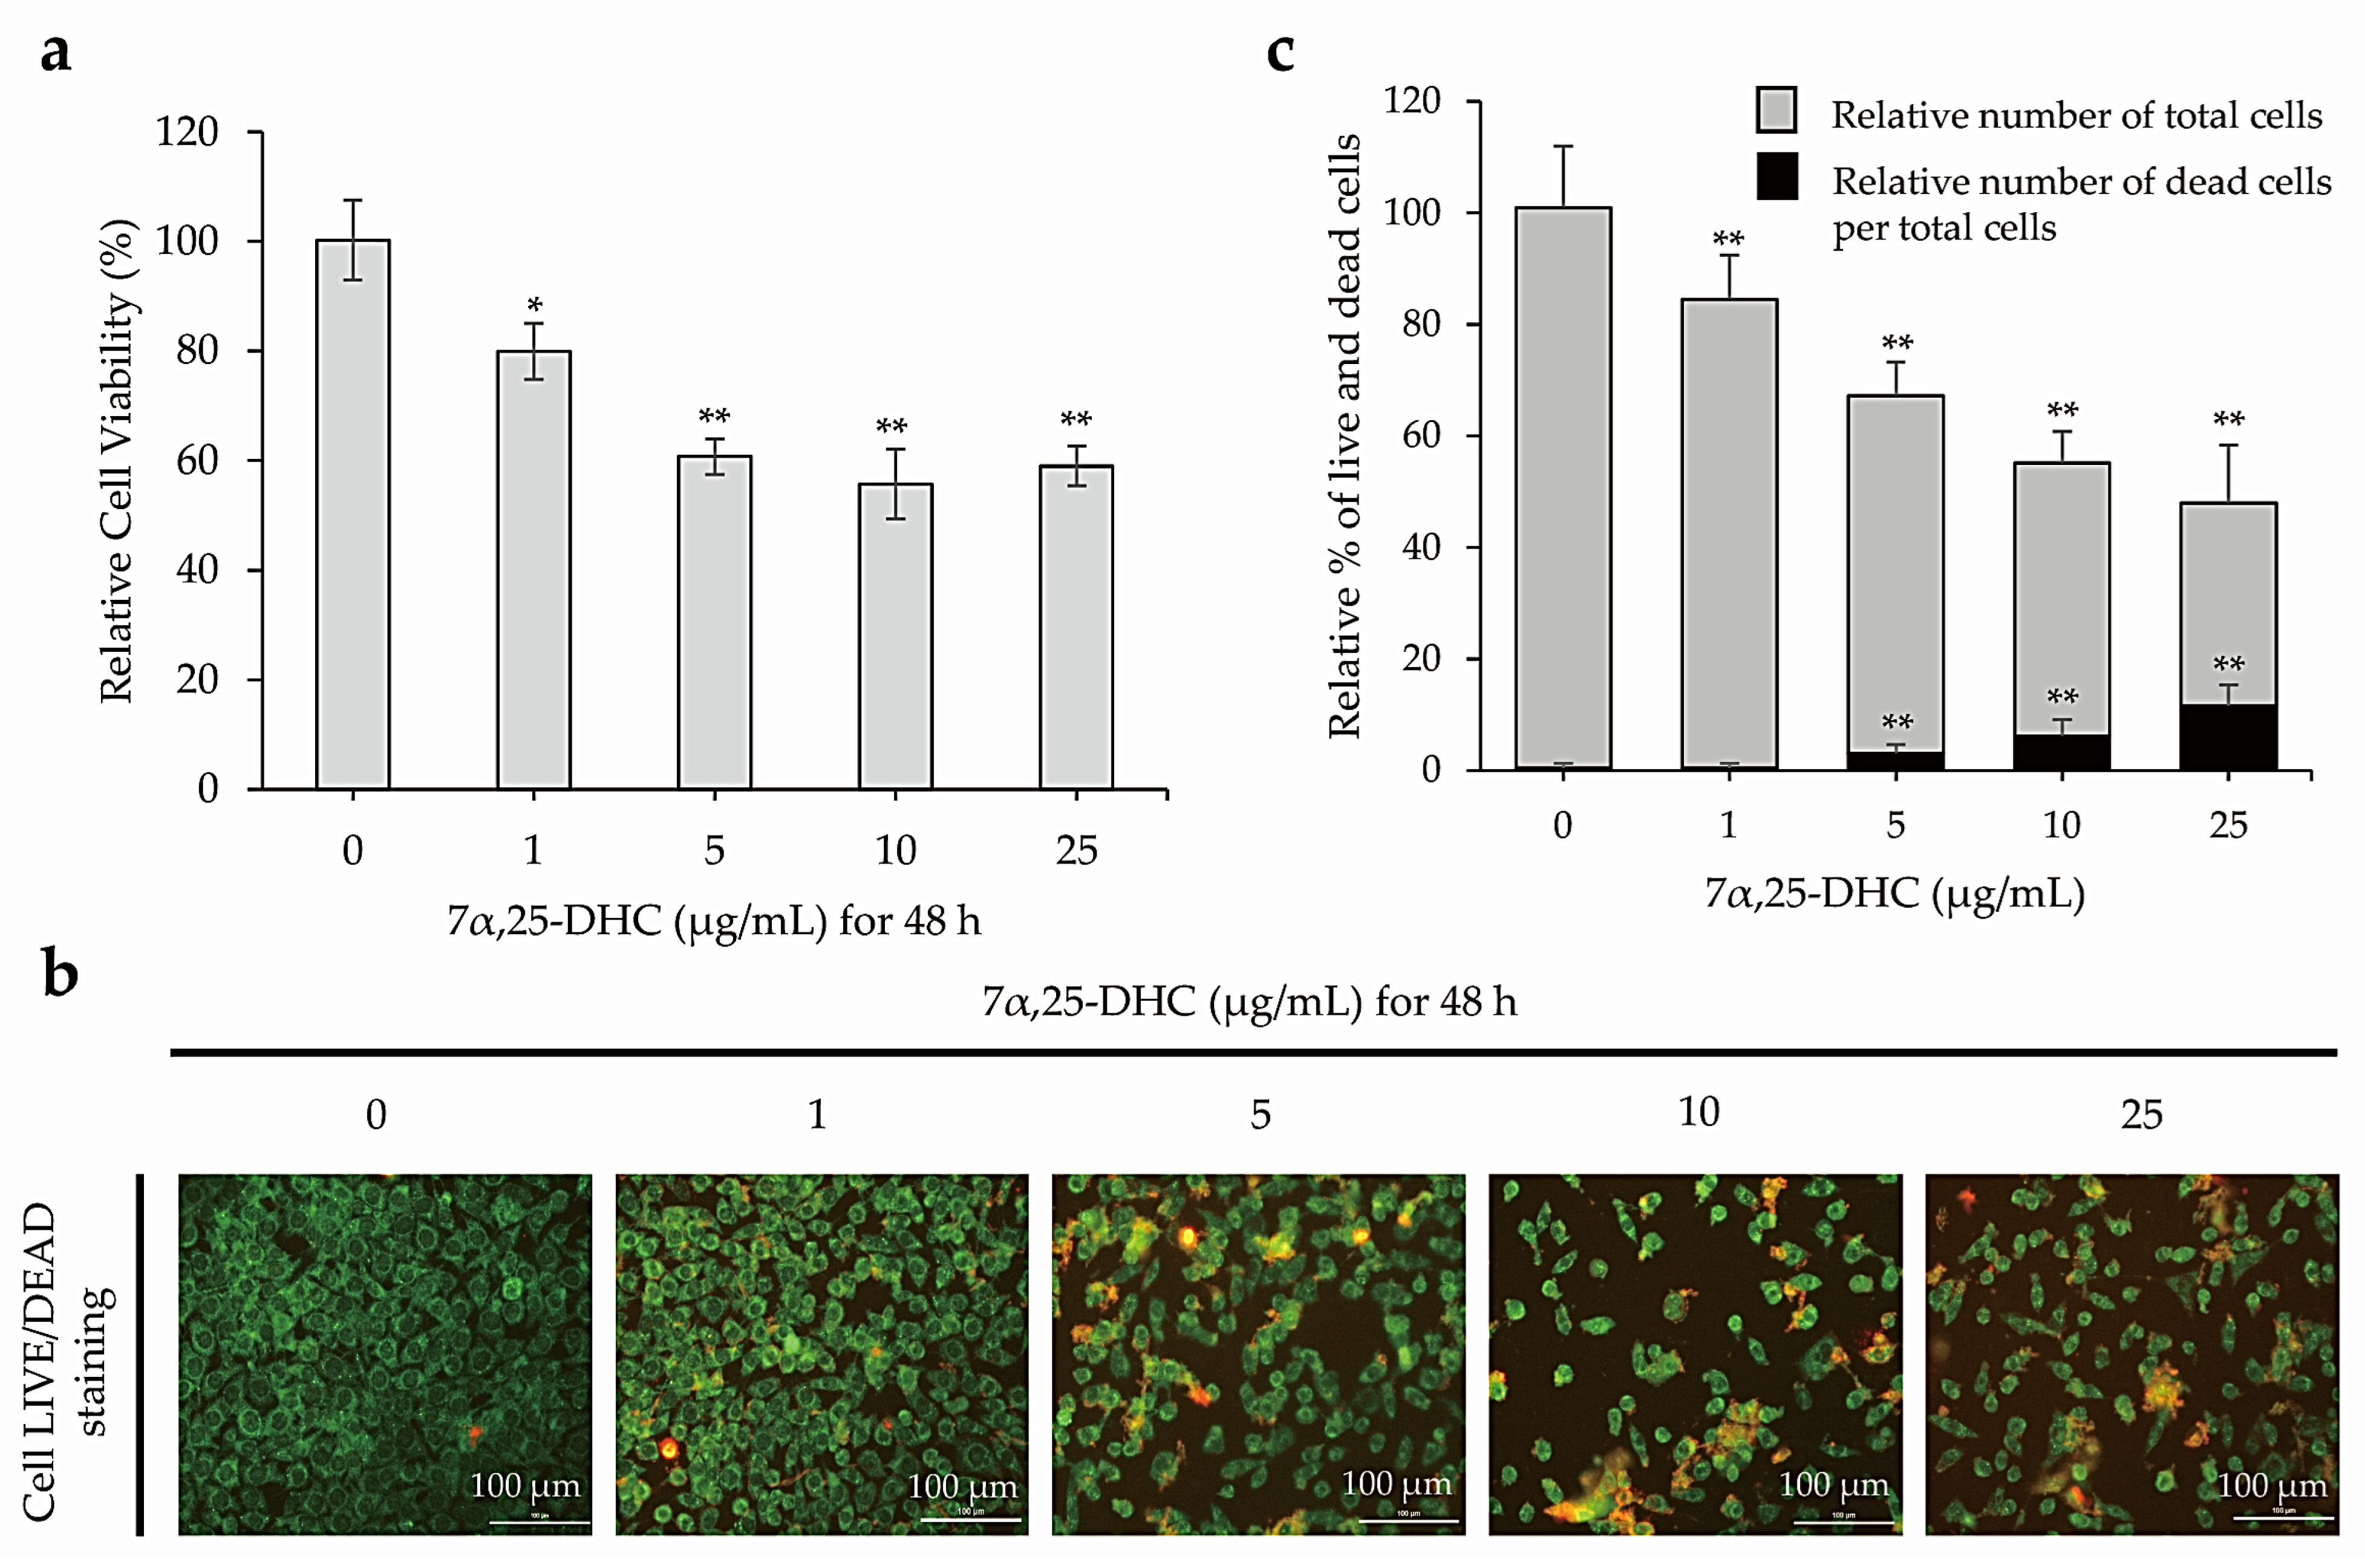
2.1. 7α,25-DHC Increased the Cytotoxicity of L929 Cells
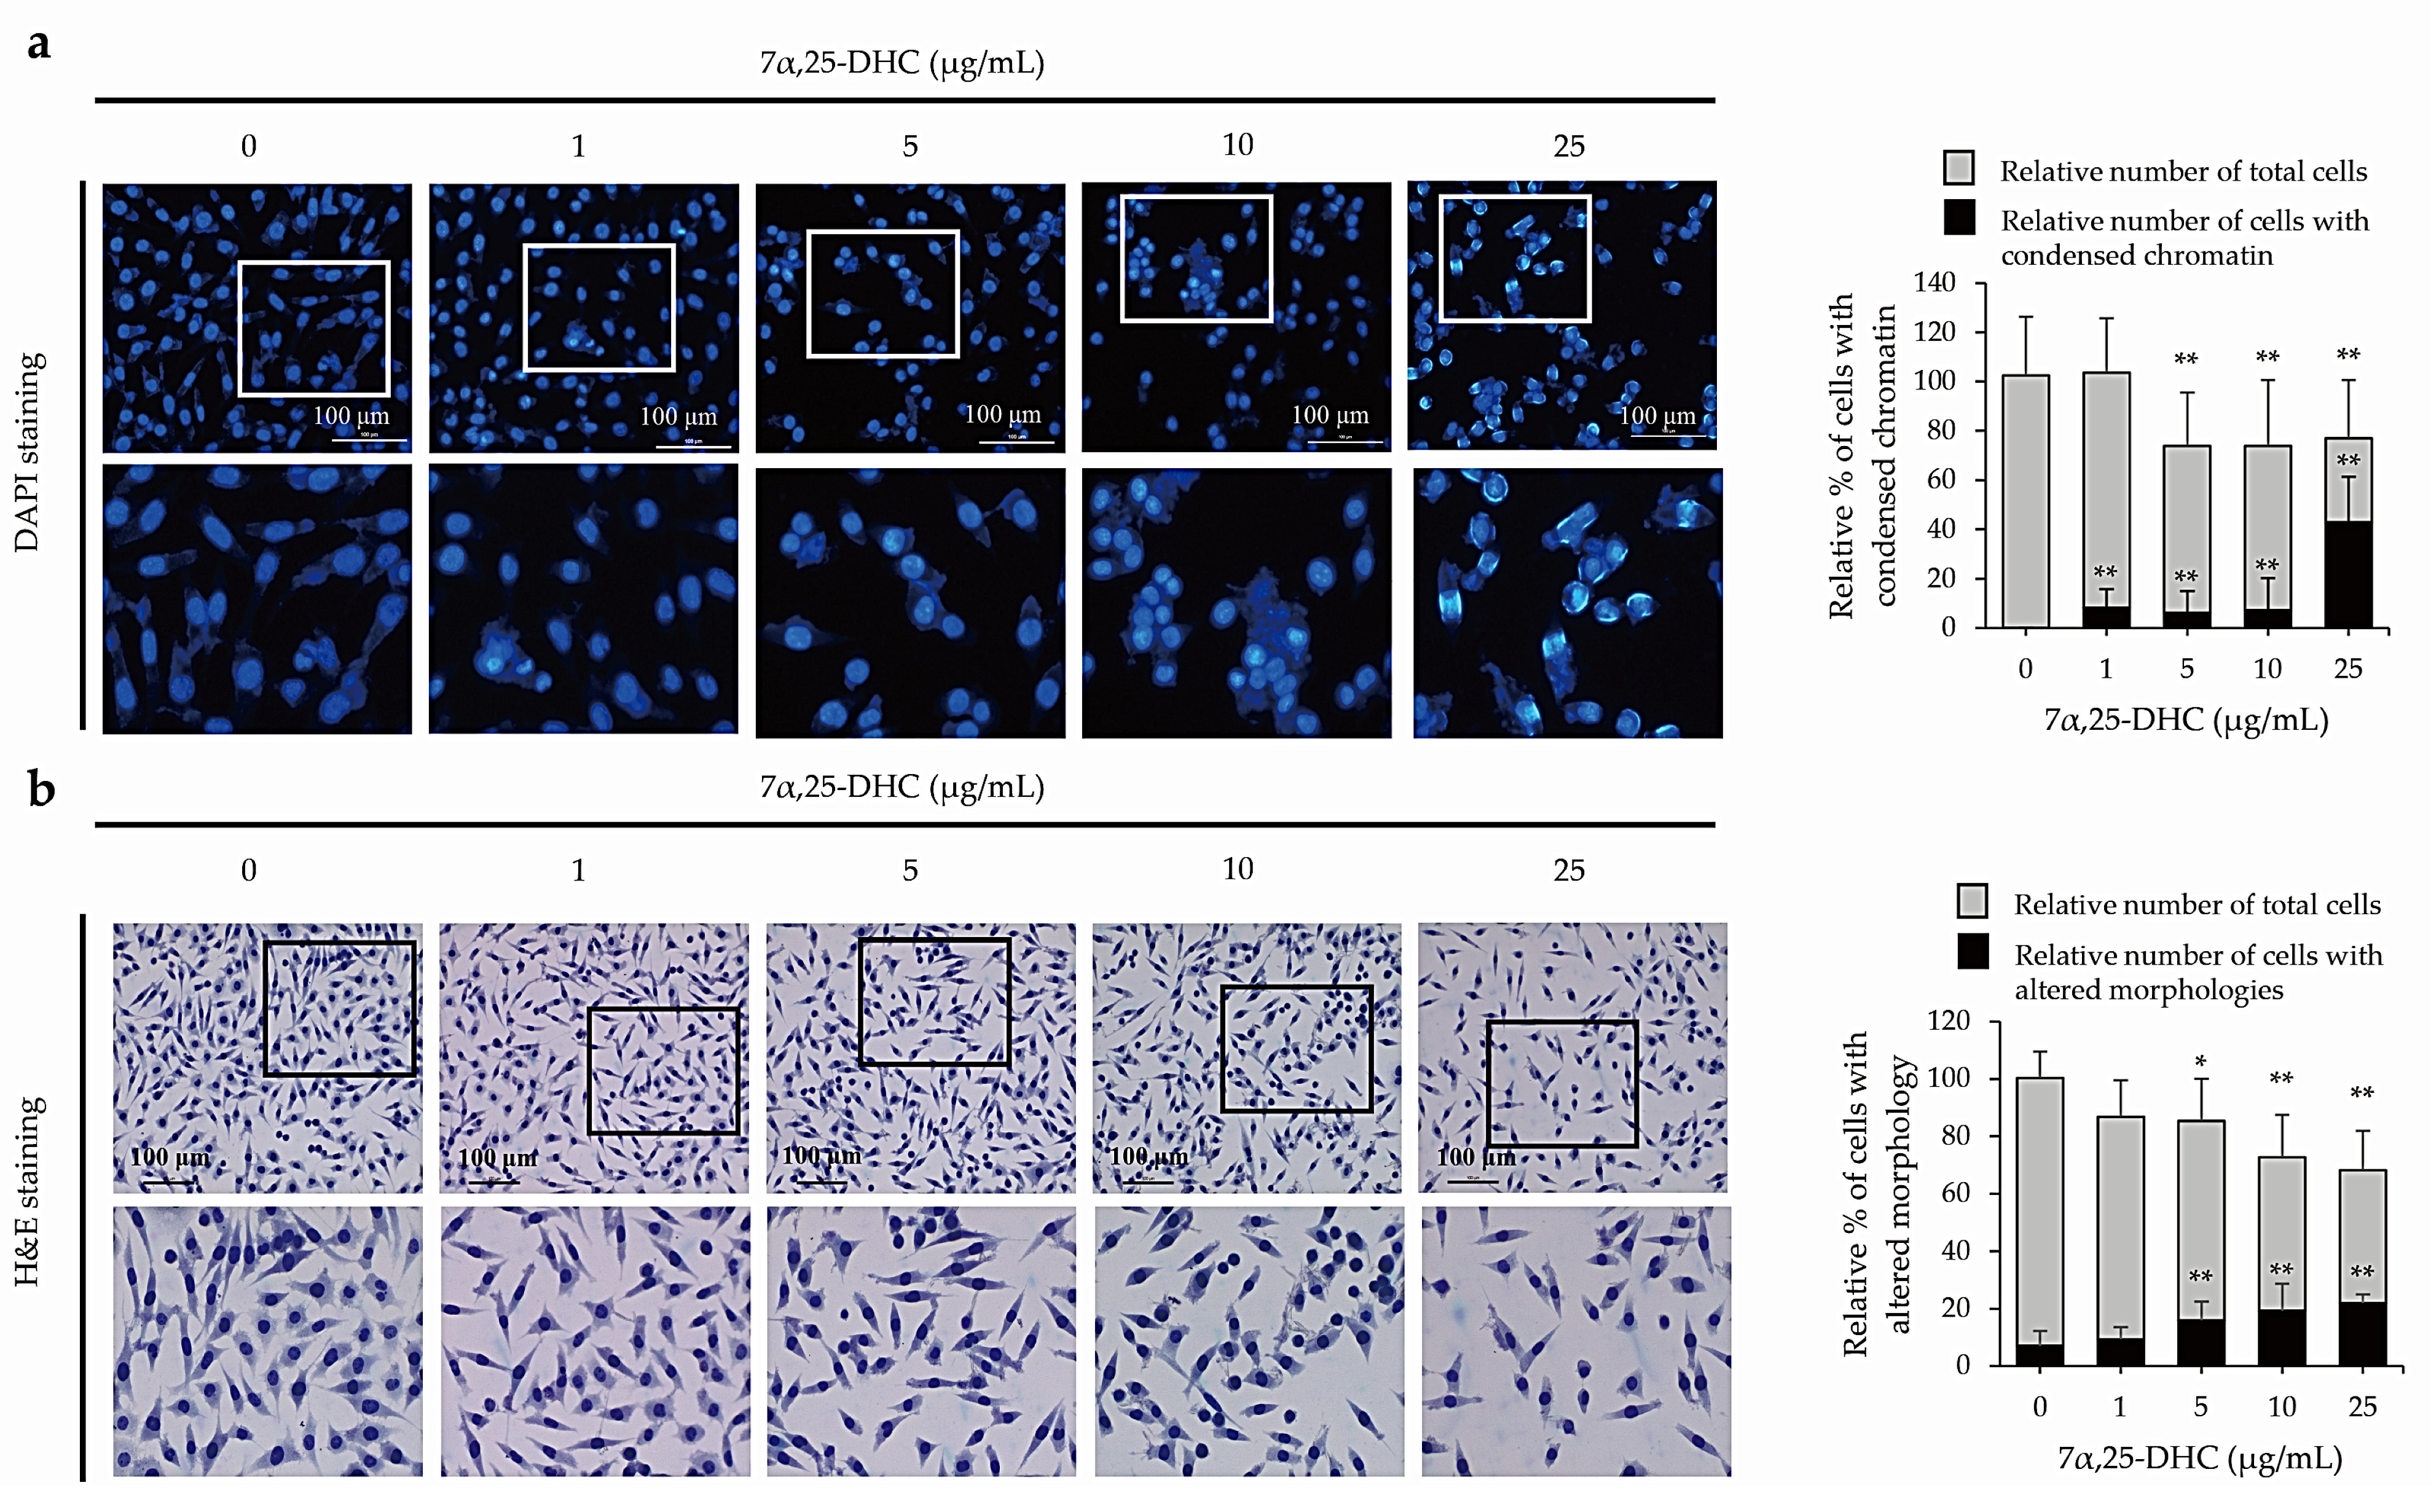
2.2. 7α,25-DHC Induced Apoptosis in L929 Cells
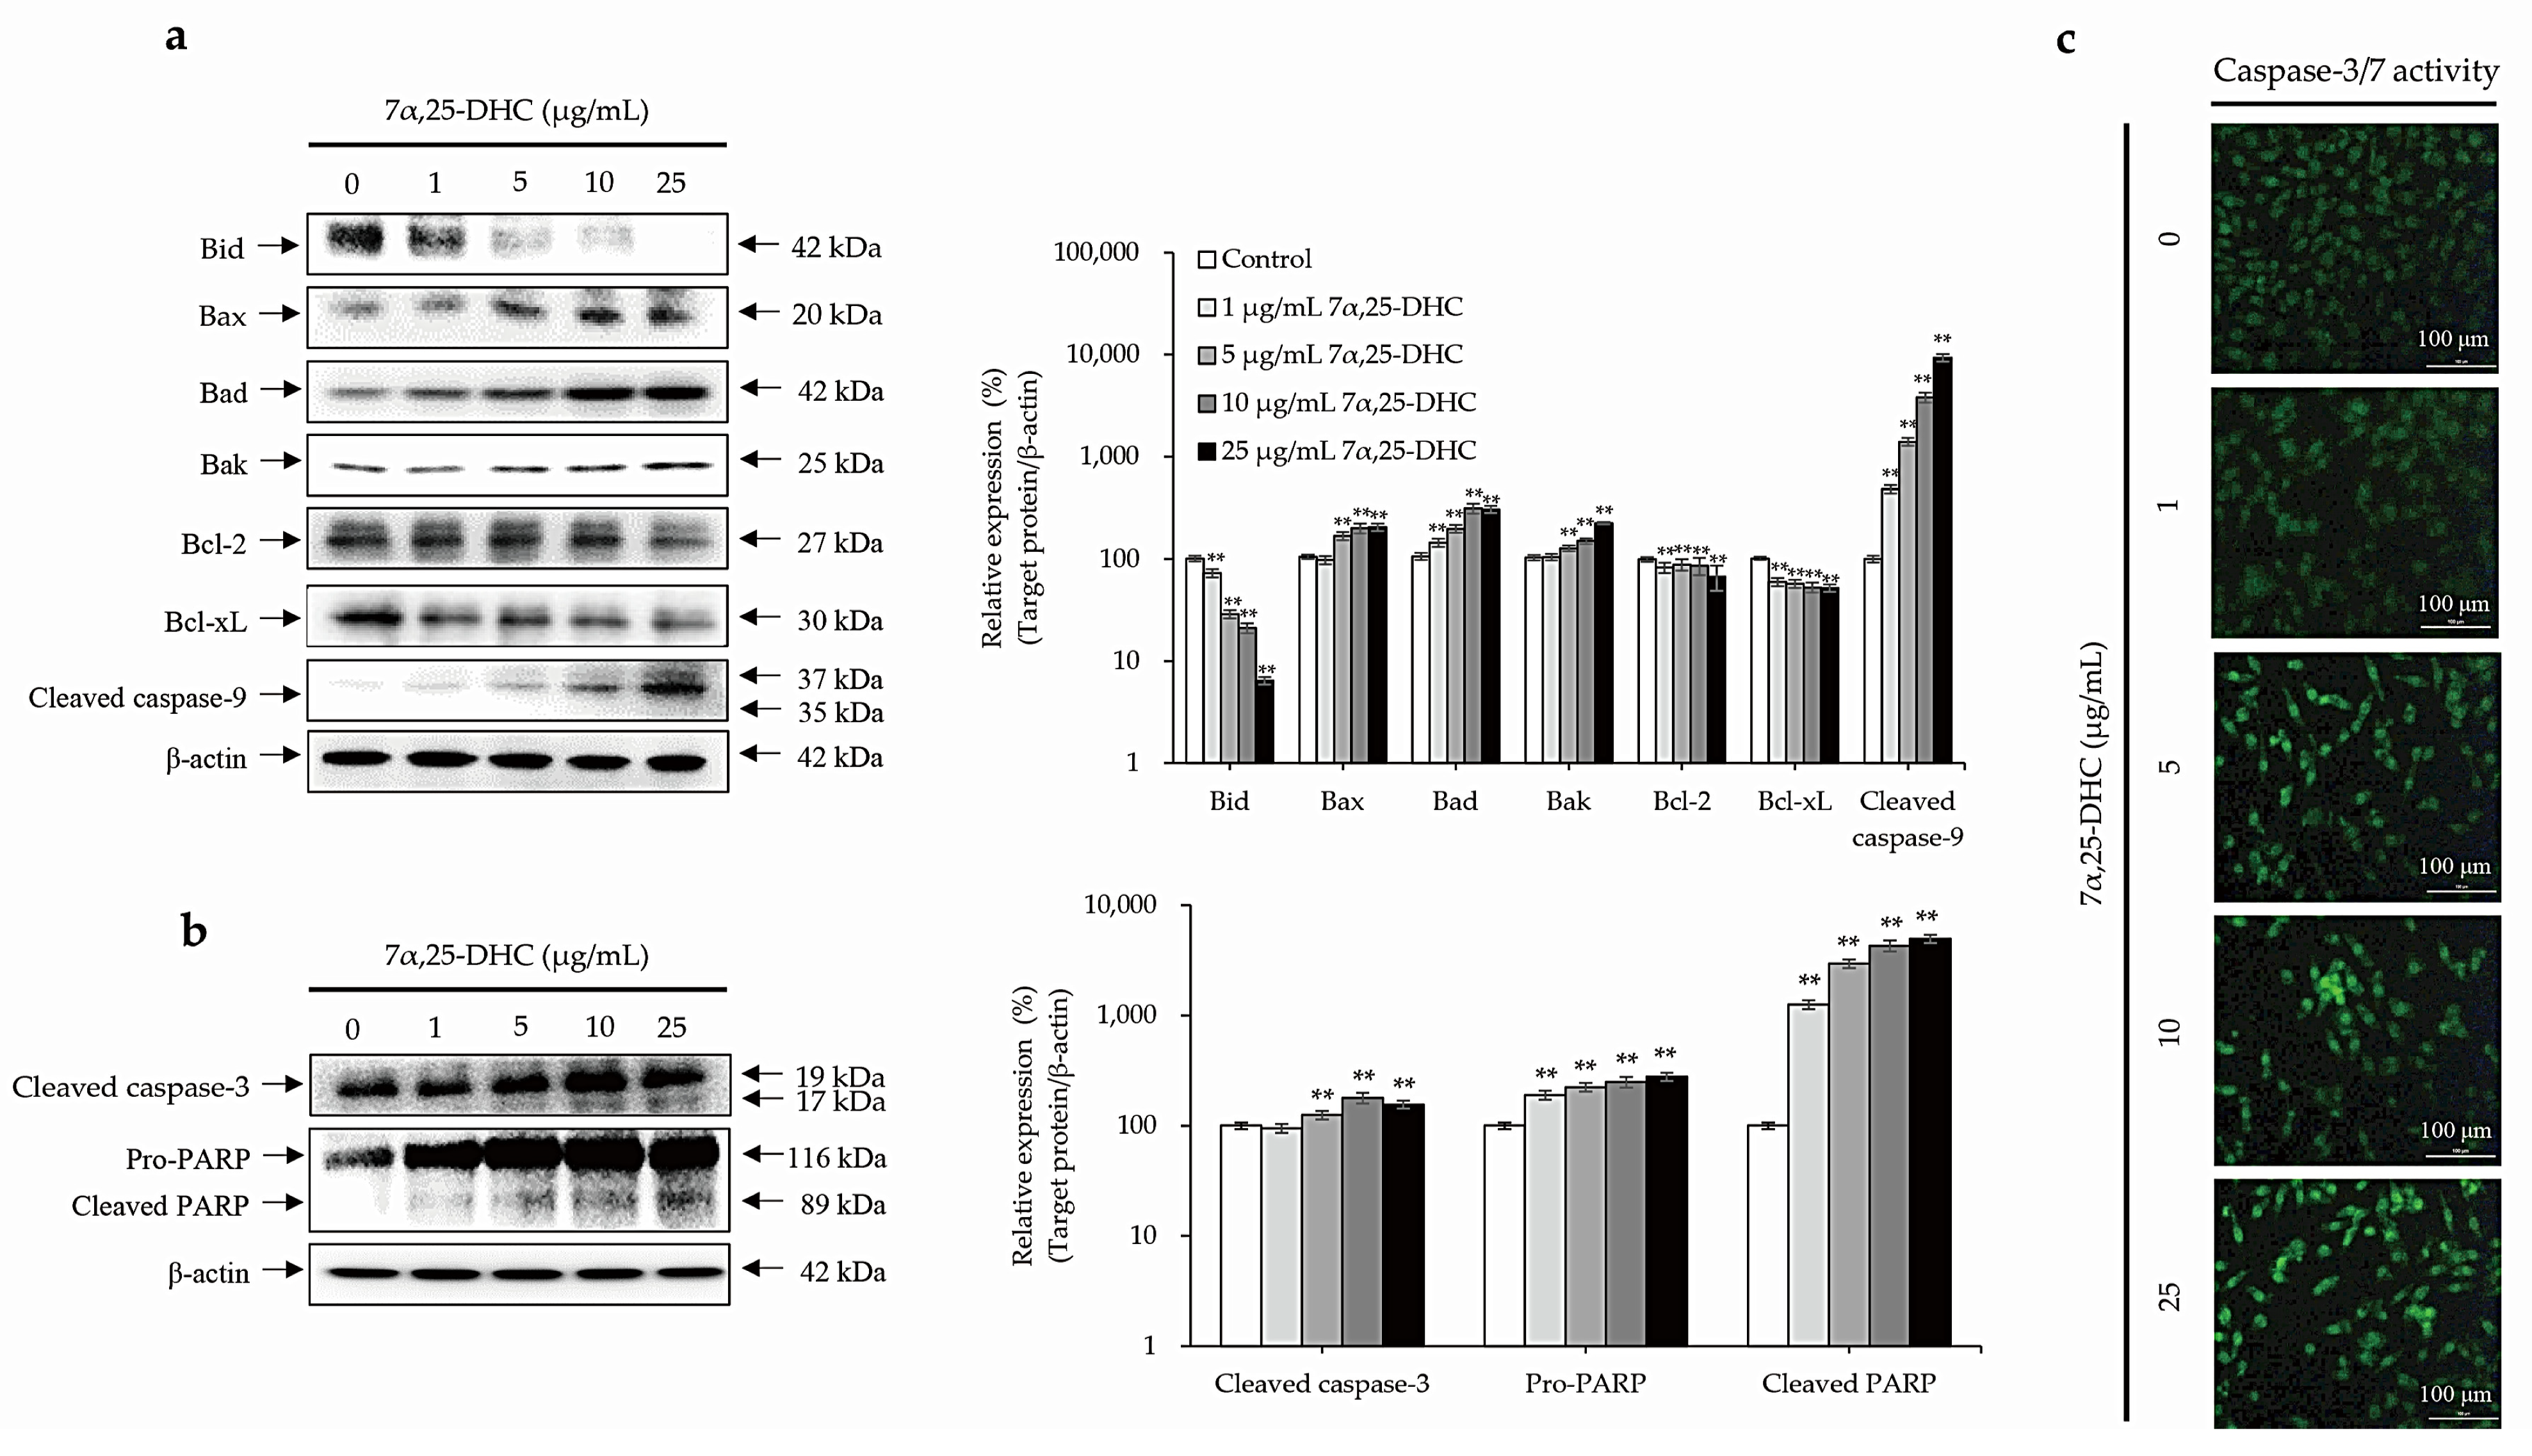
2.3. Cell Death Is Mediated by the Intrinsic Pathway of Apoptosis in L929 Cells Incubated with 7α,25-DHC
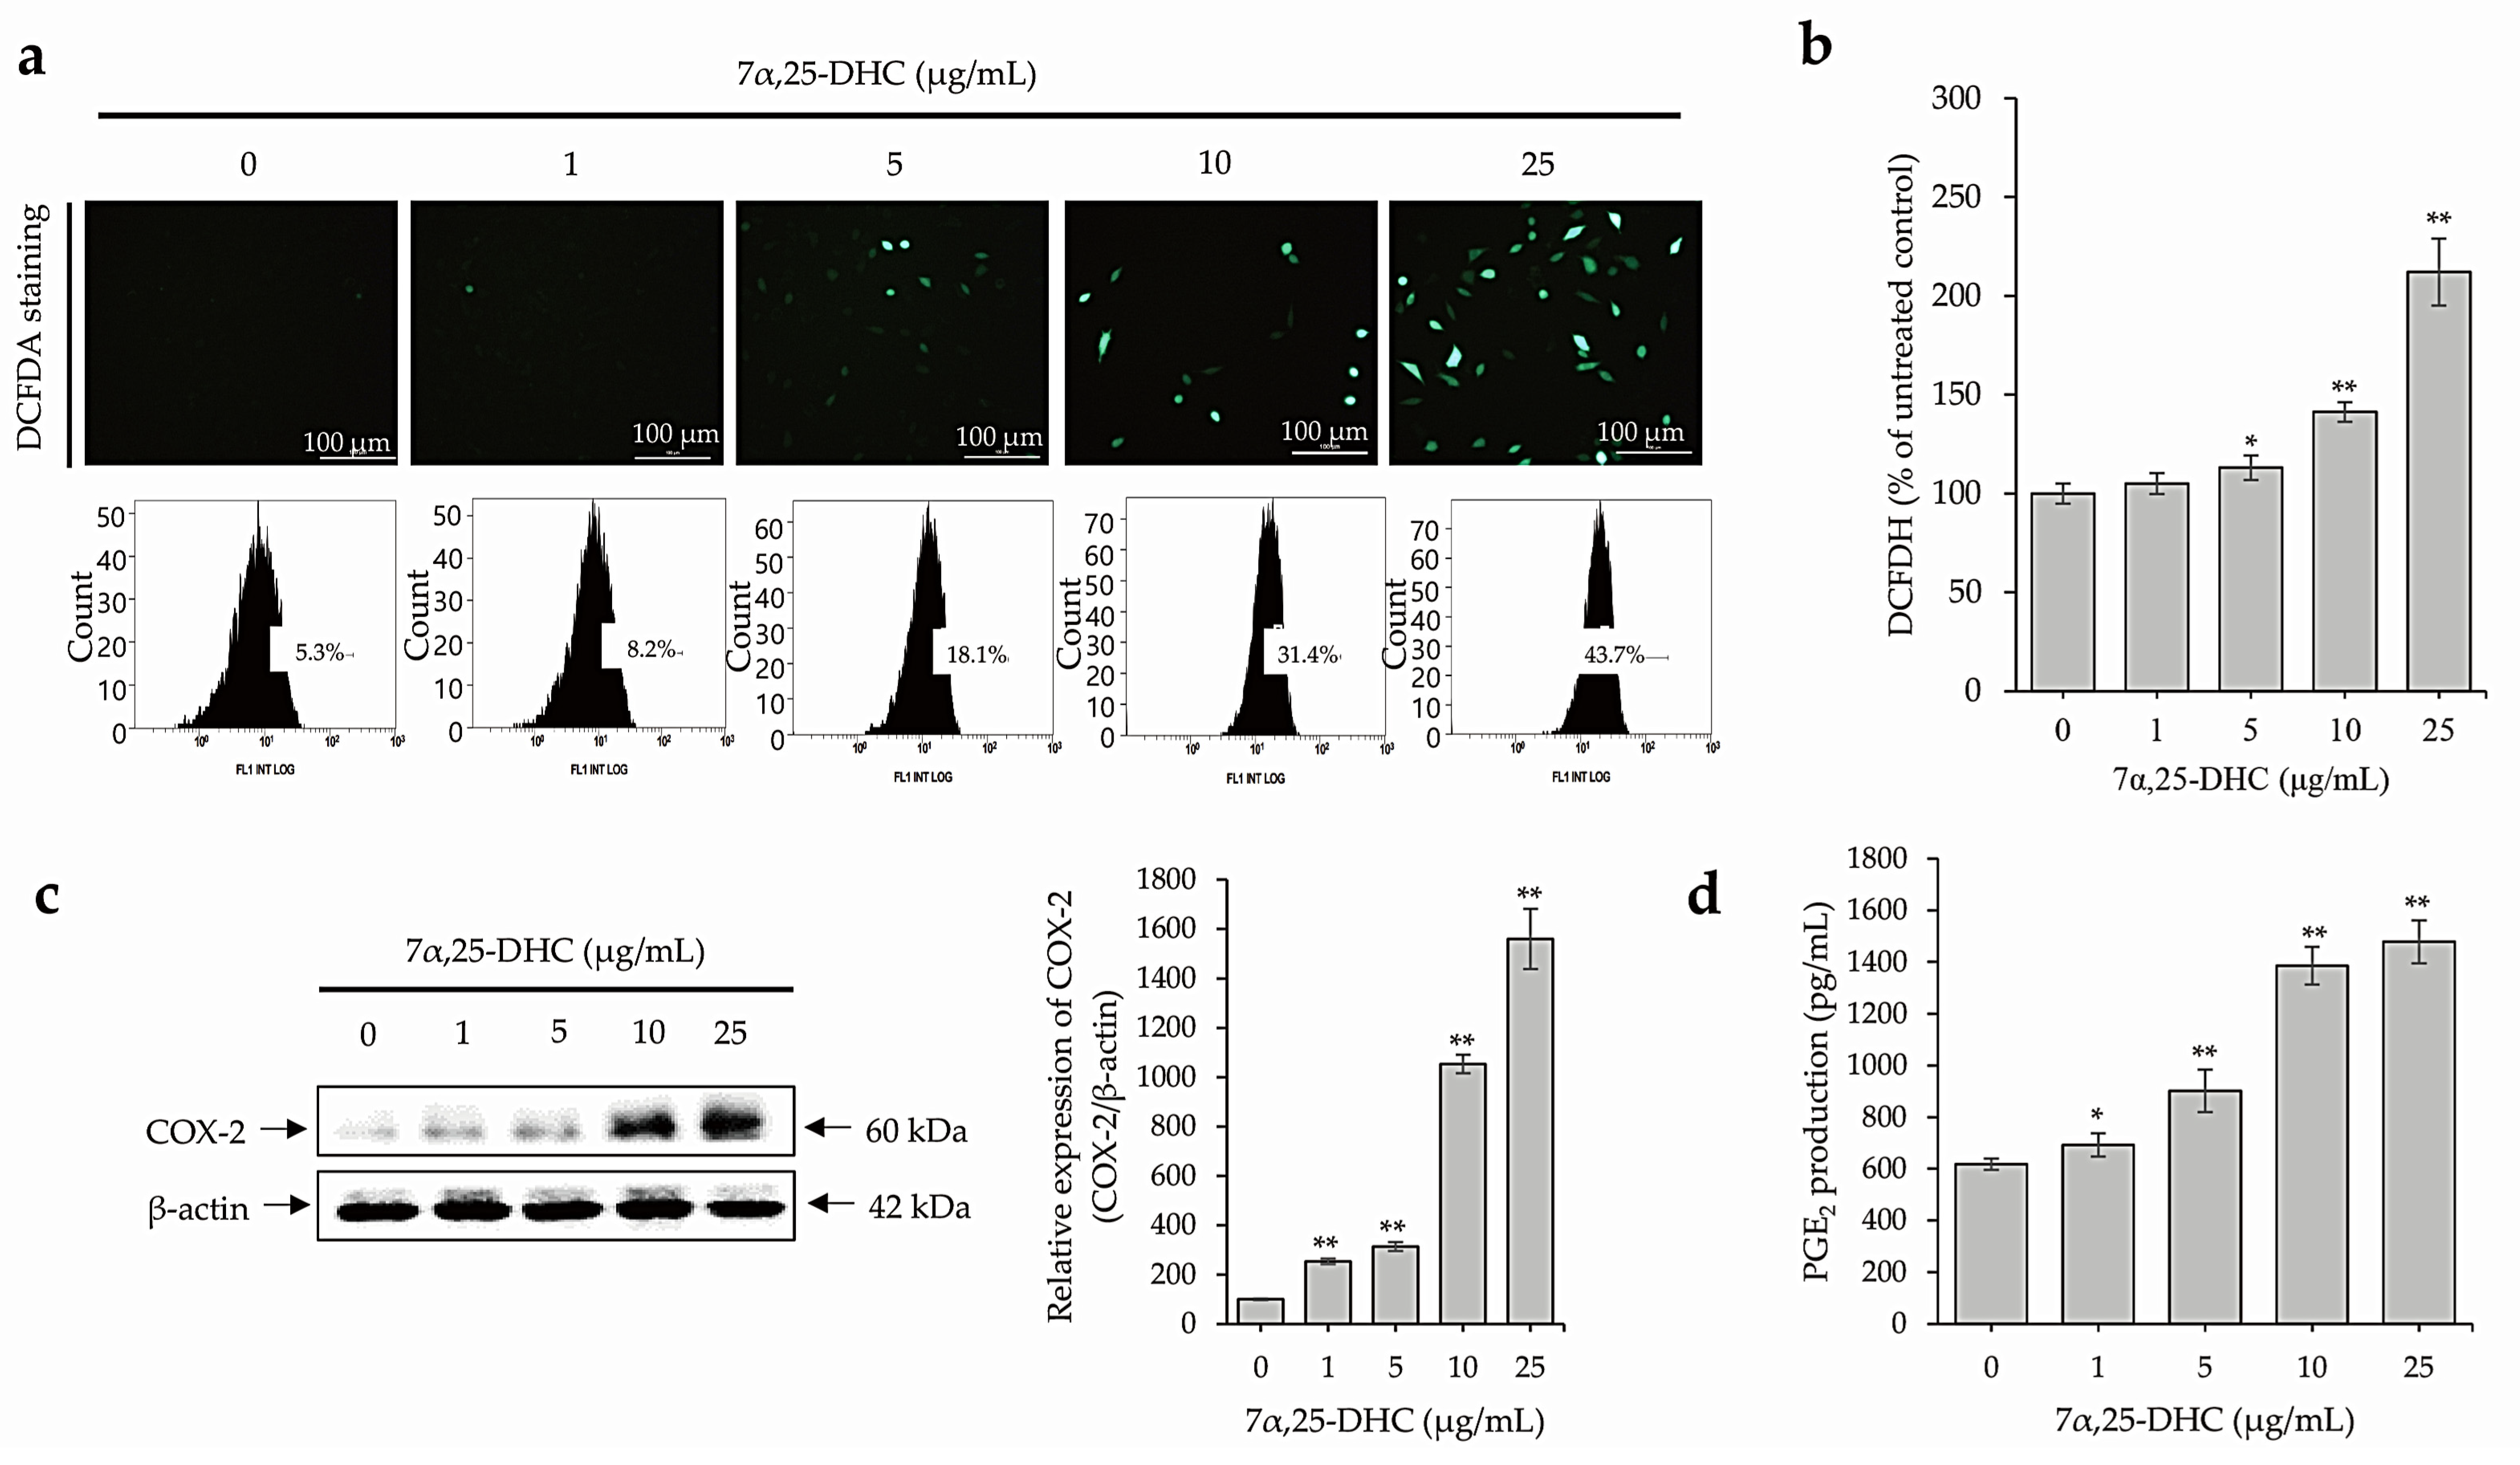
2.4. 7α,25-DHC Induces Inflammation through the Upregulation of ROS and Inflammatory Mediators in L929 Cells
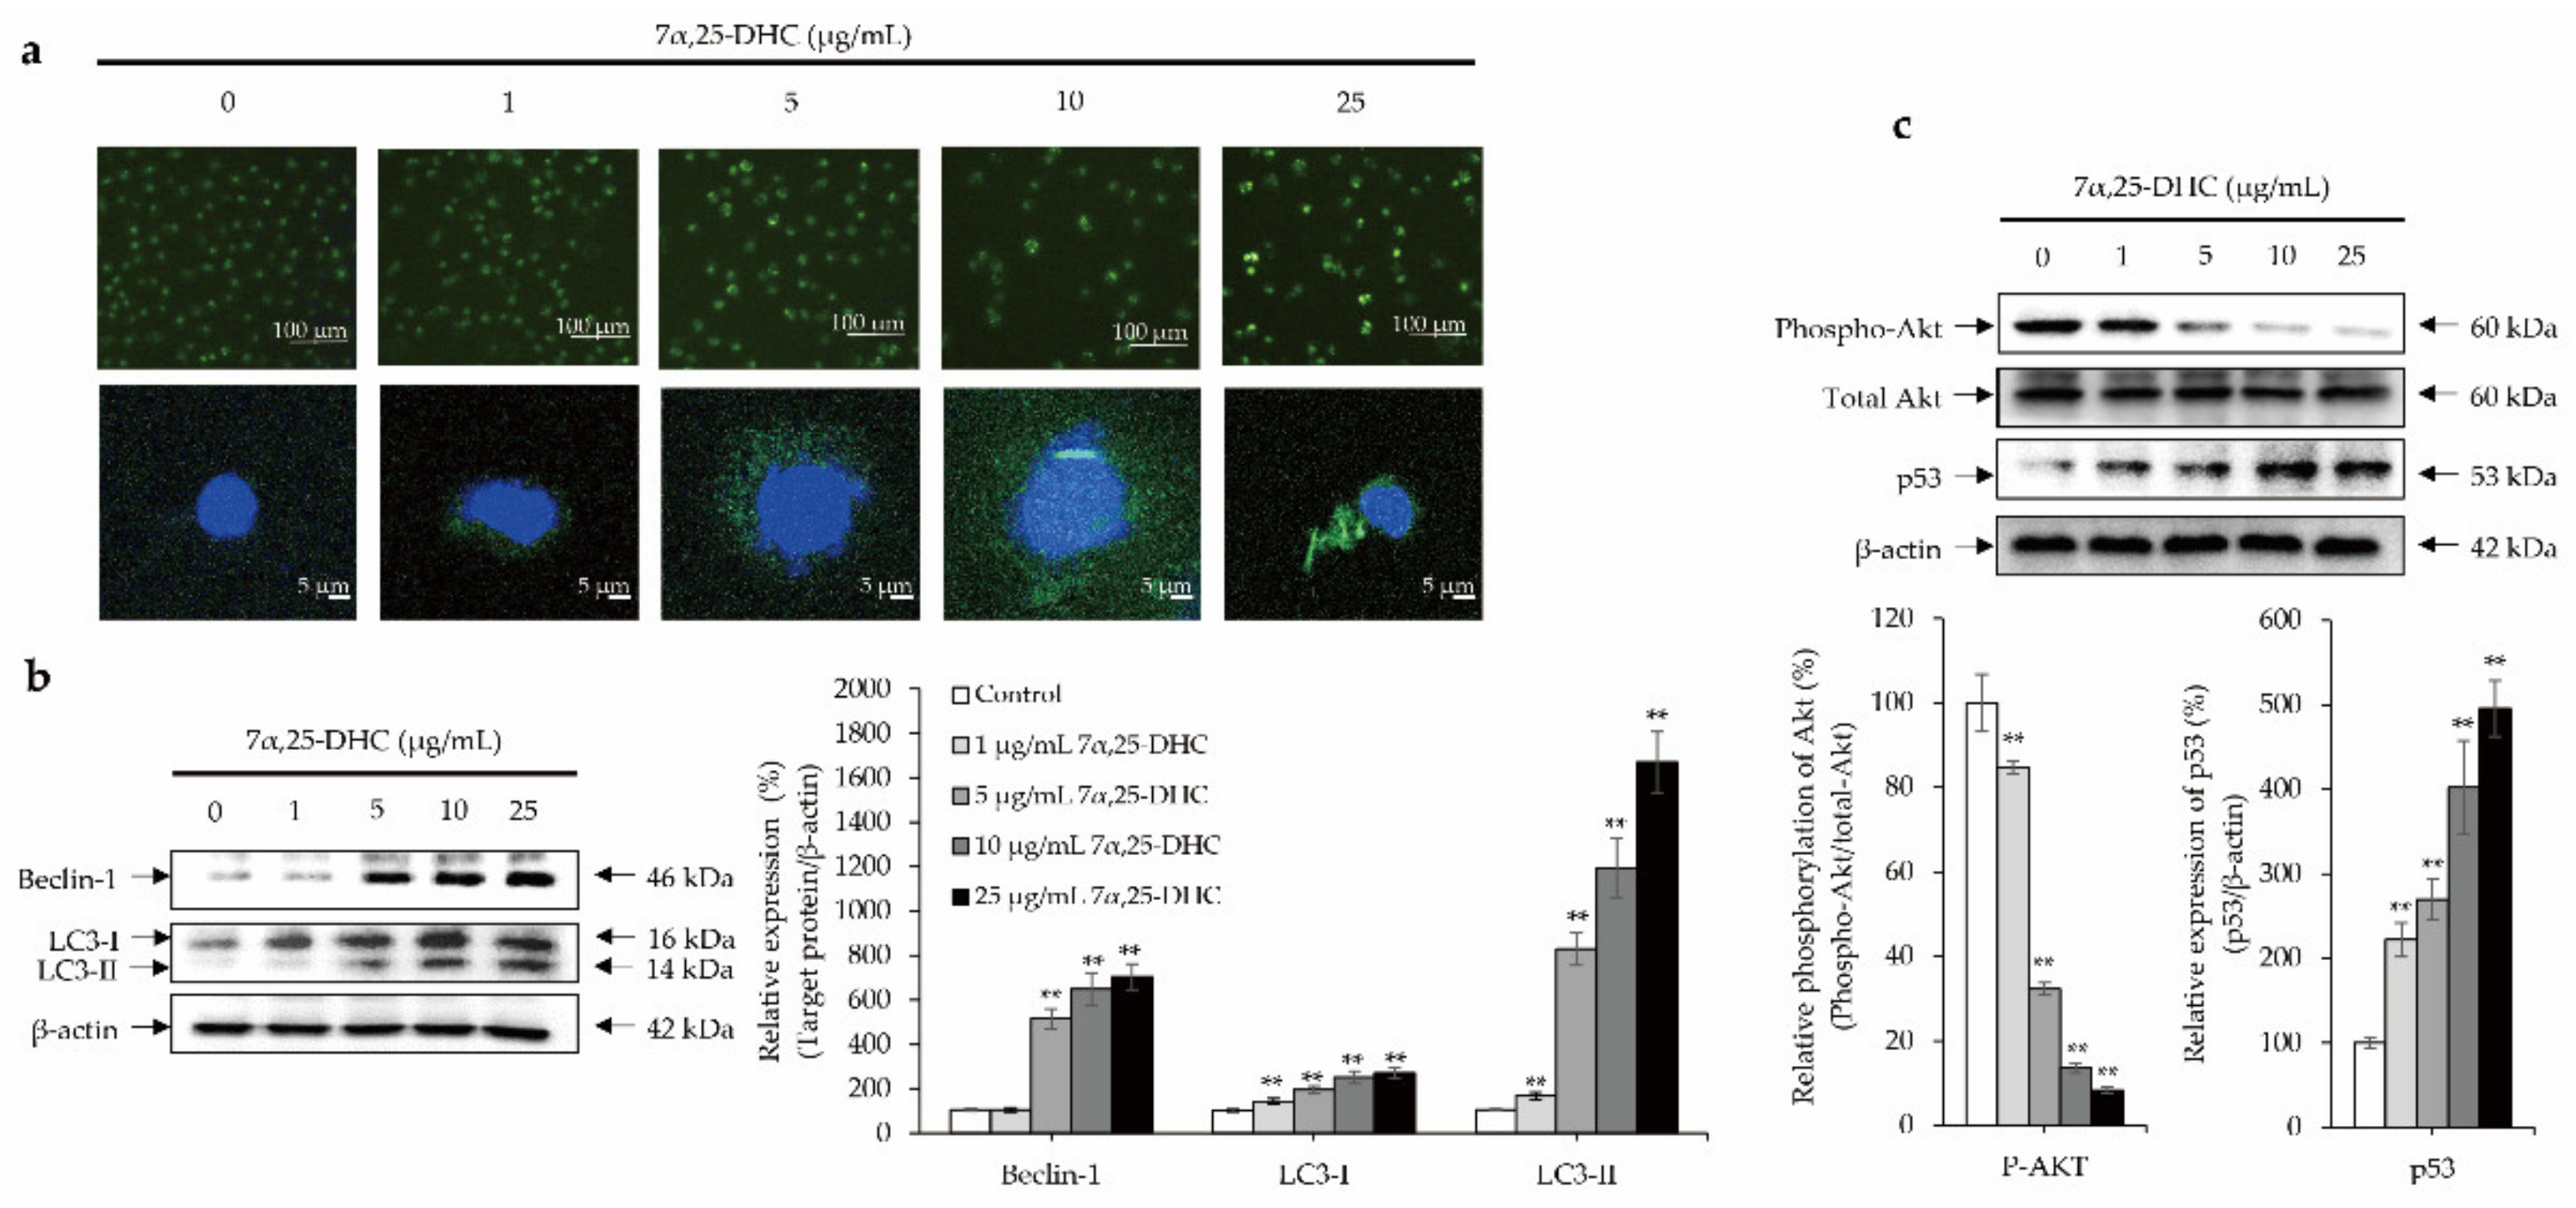
2.5. Crosstalk between p53 and Akt Cellular Signaling Pathway Mediates 7α,25-DHC-Induced Autophagy in L929 Cells
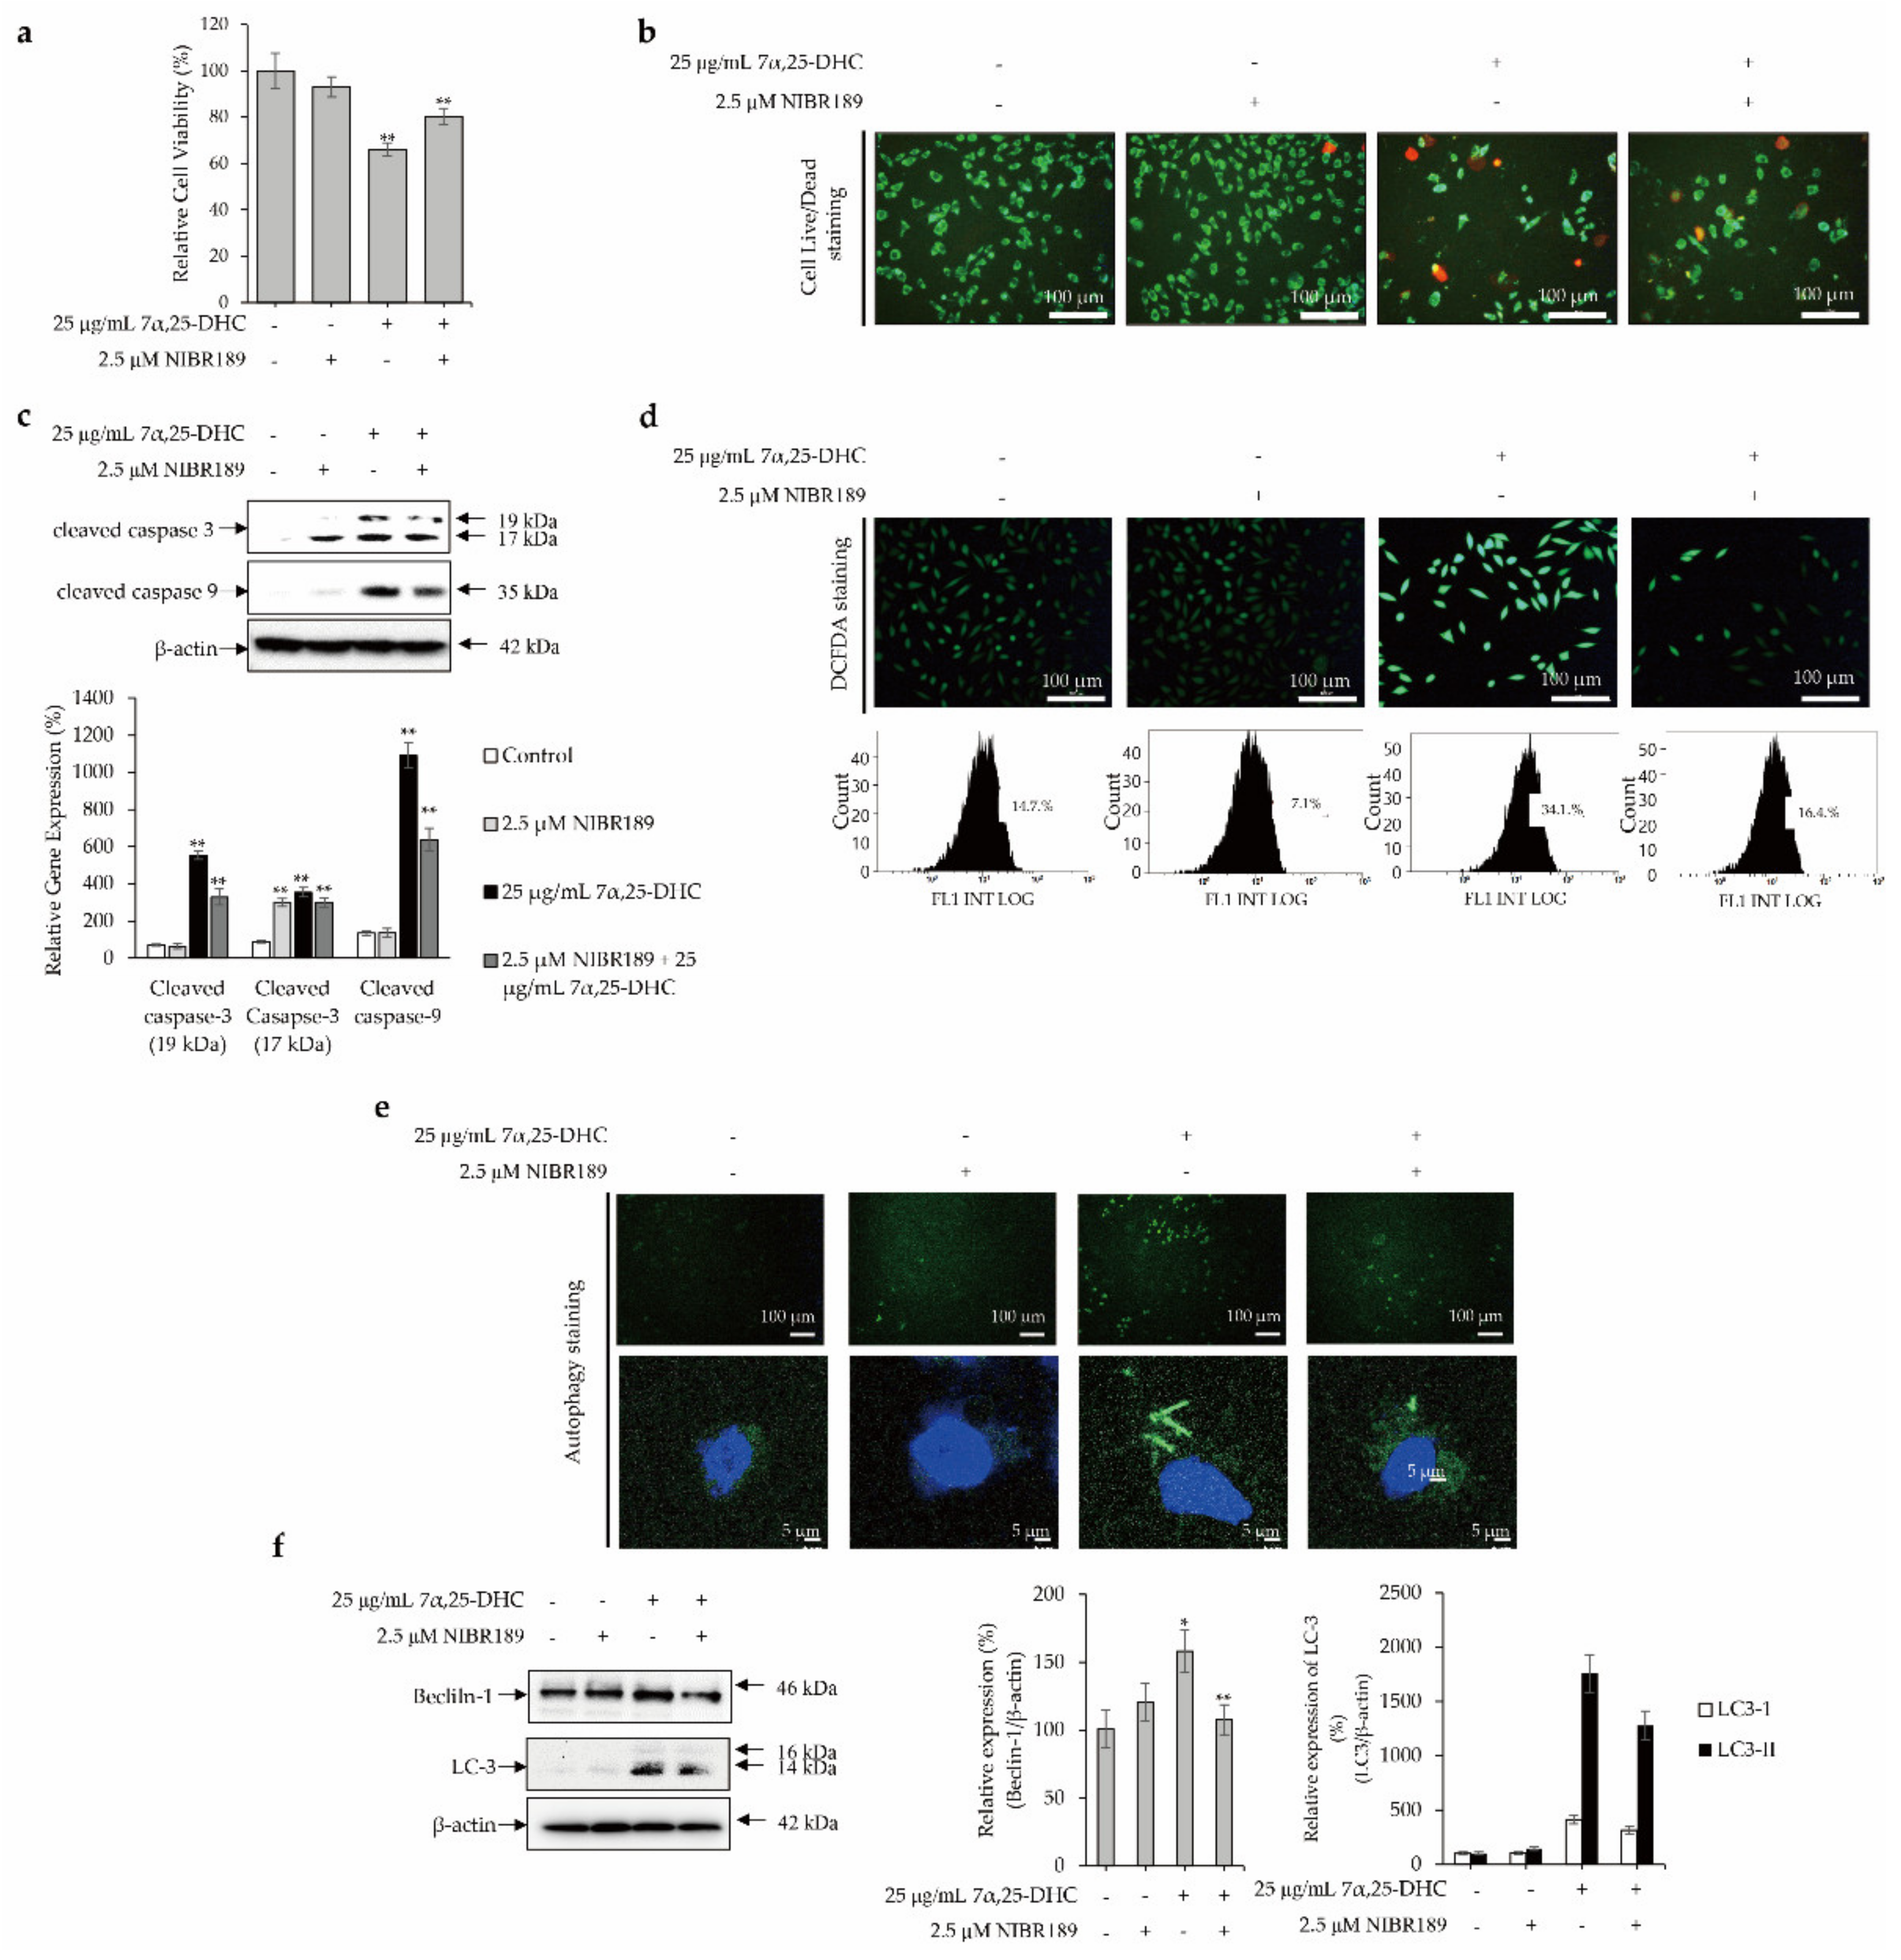
2.6. GPR183 Regulates 7α,25-DHC-Induced Oxiapoptotic Cell Death in L929 Cells
3. Discussion
4. Materials and Methods
4.1. Cell Maintenance
4.2. MTT Assay
4.3. Cell Live/Dead Staining
4.4. DAPI Staining
4.5. H&E Staining
4.6. Flow Cytometry Determination of Apoptosis
4.7. Western Blotting Analysis
4.8. Caspase-3 Activity Assay
4.9. Cellular ROS Staining
4.10. PGE2 Assay
4.11. Detection of Autophagy
4.12. Statistical Analysis
5. Conclusions
Author Contributions
Funding
Institutional Review Board Statement
Informed Consent Statement
Data Availability Statement
Conflicts of Interest
Sample Availability
References
- Huang, J.; Lee, S.J.; Kang, S.; Choi, M.H.; Im, D.S. 7alpha, 25-Dihydroxycholesterol Suppresses Hepatocellular Steatosis through GPR183/EBI2 in Mouse and Human Hepatocytes. J. Pharmacol Exp. Ther. 2020, 374, 142–150. [Google Scholar] [CrossRef]
- Griffiths, W.J.; Wang, Y. Oxysterol research: A brief review. Biochem. Soc. Trans. 2019, 47, 517–526. [Google Scholar] [CrossRef] [Green Version]
- Griffiths, W.J.; Abdel-Khalik, J.; Hearn, T.; Yutuc, E.; Morgan, A.H.; Wang, Y. Current trends in oxysterol research. Biochem. Soc. Trans. 2016, 44, 652–658. [Google Scholar] [CrossRef] [Green Version]
- Miyashita, Y.; Ozaki, H.; Koide, N.; Otsuka, M.; Oyama, T.; Itoh, Y.; Mastuzaka, T.; Shirai, K. Oxysterol-induced apoptosis of vascular smooth muscle cells is reduced by HMG-CoA reductase inhibitor, pravastatin. J. Atheroscler. Thromb. 2002, 9, 65–71. [Google Scholar] [CrossRef] [PubMed] [Green Version]
- Yuan, X.M.; Sultana, N.; Siraj, N.; Ward, L.J.; Ghafouri, B.; Li, W. Autophagy Induction Protects Against 7-Oxysterol-induced Cell Death via Lysosomal Pathway and Oxidative Stress. J. Cell Death 2016, 9, 1–7. [Google Scholar] [CrossRef] [PubMed] [Green Version]
- Griffiths, W.J.; Crick, P.J.; Wang, Y. Methods for oxysterol analysis: Past, present and future. Biochem. Pharmacol. 2013, 86, 3–14. [Google Scholar] [CrossRef] [PubMed]
- Samadi, A.; Sabuncuoglu, S.; Samadi, M.; Isikhan, S.Y.; Chirumbolo, S.; Peana, M.; Lay, I.; Yalcinkaya, A.; Bjorklund, G. A Comprehensive Review on Oxysterols and Related Diseases. Curr. Med. Chem. 2021, 28, 110–136. [Google Scholar] [CrossRef] [PubMed]
- Schroepfer, G.J., Jr. Oxysterols: Modulators of cholesterol metabolism and other processes. Physiol. Rev. 2000, 80, 361–554. [Google Scholar] [CrossRef]
- Bjorkhem, I. Do oxysterols control cholesterol homeostasis? J. Clin. Investig. 2002, 110, 725–730. [Google Scholar] [CrossRef]
- Seo, Y.S.; Cho, I.A.; Kim, T.H.; You, J.S.; Oh, J.S.; Lee, G.J.; Kim, D.K.; Kim, J.S. Oxysterol 25-hydroxycholesterol as a metabolic pathophysiological factors of osteoarthritis induces apoptosis in primary rat chondrocytes. Korean J. Physiol. Pharmacol. 2020, 24, 249–257. [Google Scholar] [CrossRef]
- Liu, Y.; Wei, Z.; Ma, X.; Yang, X.; Chen, Y.; Sun, L.; Ma, C.; Miao, Q.R.; Hajjar, D.P.; Han, J.; et al. 25-Hydroxycholesterol activates the expression of cholesterol 25-hydroxylase in an LXR-dependent mechanism. J. Lipid Res. 2018, 59, 439–451. [Google Scholar] [CrossRef] [PubMed] [Green Version]
- Adamek, M.; Davies, J.; Beck, A.; Jordan, L.; Becker, A.M.; Mojzesz, M.; Rakus, K.; Rumiac, T.; Collet, B.; Brogden, G.; et al. Antiviral Actions of 25-Hydroxycholesterol in Fish Vary with the Virus-Host Combination. Front. Immunol. 2021, 12, 581786. [Google Scholar] [CrossRef] [PubMed]
- Sun, S.; Liu, C. 7alpha, 25-dihydroxycholesterol-mediated activation of EBI2 in immune regulation and diseases. Front. Pharmacol. 2015, 6, 60. [Google Scholar] [CrossRef] [PubMed] [Green Version]
- Cyster, J.G.; Dang, E.V.; Reboldi, A.; Yi, T. 25-Hydroxycholesterols in innate and adaptive immunity. Nat. Rev. Immunol. 2014, 14, 731–743. [Google Scholar] [CrossRef]
- Braden, K.; Giancotti, L.A.; Chen, Z.; DeLeon, C.; Latzo, N.; Boehn, T.; D’Cunha, N.; Thompson, B.M.; Doyle, T.M.; McDonald, J.G.; et al. GPR183-Oxysterol Axis in Spinal Cord Contributes to Neuropathic Pain. J. Pharmacol. Exp. Ther. 2020, 375, 367–375. [Google Scholar] [CrossRef]
- Rutkowska, A.; Shimshek, D.R.; Sailer, A.W.; Dev, K.K. EBI2 regulates pro-inflammatory signalling and cytokine release in astrocytes. Neuropharmacology 2018, 133, 121–128. [Google Scholar] [CrossRef]
- Ares, M.P.; Porn-Ares, M.I.; Thyberg, J.; Juntti-Berggren, L.; Berggren, P.O.; Diczfalusy, U.; Kallin, B.; Bjorkhem, I.; Orrenius, S.; Nilsson, J. Ca2+ channel blockers verapamil and nifedipine inhibit apoptosis induced by 25-hydroxycholesterol in human aortic smooth muscle cells. J. Lipid Res. 1997, 38, 2049–2061. [Google Scholar] [CrossRef]
- Olivier, E.; Dutot, M.; Regazzetti, A.; Laprevote, O.; Rat, P. 25-Hydroxycholesterol induces both P2X7-dependent pyroptosis and caspase-dependent apoptosis in human skin model: New insights into degenerative pathways. Chem. Phys. Lipids 2017, 207, 171–178. [Google Scholar] [CrossRef]
- Kakimoto, M.; Yamamoto, H.; Tanaka, A.R. Spermine synthesis inhibitor blocks 25-hydroxycholesterol-induced- apoptosis via SREBP2 upregulation in DLD-1 cell spheroids. Biochem. Biophys. Rep. 2020, 22, 100754. [Google Scholar] [CrossRef]
- Travert, C.; Carreau, S.; Le Goff, D. Induction of apoptosis by 25-hydroxycholesterol in adult rat Leydig cells: Protective effect of 17beta-estradiol. Reprod. Toxicol. 2006, 22, 564–570. [Google Scholar] [CrossRef]
- Sekiya, M.; Yamamuro, D.; Ohshiro, T.; Honda, A.; Takahashi, M.; Kumagai, M.; Sakai, K.; Nagashima, S.; Tomoda, H.; Igarashi, M.; et al. Absence of Nceh1 augments 25-hydroxycholesterol-induced ER stress and apoptosis in macrophages. J. Lipid Res. 2014, 55, 2082–2092. [Google Scholar] [CrossRef] [Green Version]
- Bartlett, S.; Gemiarto, A.T.; Ngo, M.D.; Sajiir, H.; Hailu, S.; Sinha, R.; Foo, C.X.; Kleynhans, L.; Tshivhula, H.; Webber, T.; et al. GPR183 Regulates Interferons, Autophagy, and Bacterial Growth During Mycobacterium tuberculosis Infection and Is Associated With TB Disease Severity. Front. Immunol. 2020, 11, 601534. [Google Scholar] [CrossRef]
- Nury, T.; Zarrouk, A.; Yammine, A.; Mackrill, J.J.; Vejux, A.; Lizard, G. Oxiapoptophagy: A type of cell death induced by some oxysterols. Br. J. Pharmacol. 2021, 178, 3115–3123. [Google Scholar] [CrossRef]
- Kendall, R.T.; Feghali-Bostwick, C.A. Fibroblasts in fibrosis: Novel roles and mediators. Front. Pharmacol. 2014, 5, 123. [Google Scholar] [CrossRef] [Green Version]
- Schlueter, N.; Lussi, A.; Ganss, C.; Gruber, R. L929 fibroblast bioassay on the in vitro toxicity of SnCl2, H3PO4, Clearfil SE primer and combinations thereof. Swiss Dent. J. 2016, 126, 566–572. [Google Scholar]
- Faletrov, Y.V.; Efimova, V.S.; Horetski, M.S.; Tugaeva, K.V.; Frolova, N.S.; Lin, Q.; Isaeva, L.V.; Rubtsov, M.A.; Sluchanko, N.N.; Novikova, L.A.; et al. New 20-hydroxycholesterol-like compounds with fluorescent NBD or alkyne labels: Synthesis, in silico interactions with proteins and uptake by yeast cells. Chem. Phys. Lipids 2020, 227, 104850. [Google Scholar] [CrossRef]
- Perego, C.; Da Dalt, L.; Pirillo, A.; Galli, A.; Catapano, A.L.; Norata, G.D. Cholesterol metabolism, pancreatic beta-cell function and diabetes. Biochim. Biophys. Acta Mol. Basis Dis. 2019, 1865, 2149–2156. [Google Scholar] [CrossRef] [PubMed]
- Ikonen, E. Cellular cholesterol trafficking and compartmentalization. Nat. Rev. Mol. Cell Biol. 2008, 9, 125–138. [Google Scholar] [CrossRef] [PubMed]
- Levy, D.; Correa de Melo, T.; Ohira, B.Y.; Fidelis, M.L.; Ruiz, J.L.M.; Rodrigues, A.; Bydlowski, S.P. Oxysterols selectively promote short-term apoptosis in tumor cell lines. Biochem. Biophys. Res. Commun. 2018, 505, 1043–1049. [Google Scholar] [CrossRef]
- Lyu, J.; Yang, E.J.; Shim, J.S. Cholesterol Trafficking: An Emerging Therapeutic Target for Angiogenesis and Cancer. Cells 2019, 8, 389. [Google Scholar] [CrossRef] [PubMed] [Green Version]
- Griffiths, W.J.; Wang, Y. Oxysterols as lipid mediators: Their biosynthetic genes, enzymes and metabolites. Prostaglandins Other Lipid Mediat. 2020, 147, 106381. [Google Scholar] [CrossRef] [PubMed]
- Crick, P.J.; Yutuc, E.; Abdel-Khalik, J.; Saeed, A.; Betsholtz, C.; Genove, G.; Bjorkhem, I.; Wang, Y.; Griffiths, W.J. Formation and metabolism of oxysterols and cholestenoic acids found in the mouse circulation: Lessons learnt from deuterium-enrichment experiments and the CYP46A1 transgenic mouse. J. Steroid Biochem. Mol. Biol. 2019, 195, 105475. [Google Scholar] [CrossRef] [PubMed]
- De Freitas, F.A.; Levy, D.; Zarrouk, A.; Lizard, G.; Bydlowski, S.P. Impact of Oxysterols on Cell Death, Proliferation, and Differentiation Induction: Current Status. Cells 2021, 10, 2301. [Google Scholar] [CrossRef] [PubMed]
- Reichert, C.O.; de Freitas, F.A.; Levy, D.; Bydlowski, S.P. Oxysterols and mesenchymal stem cell biology. Vitam. Horm. 2021, 116, 409–436. [Google Scholar]
- Zhou, L.P.; Yao, F.; Luan, H.; Wang, Y.L.; Dong, X.H.; Zhou, W.W.; Wang, Q.H. CYP3A4*1B polymorphism and cancer risk: A HuGE review and meta-analysis. Tumour Biol. 2013, 34, 649–660. [Google Scholar] [CrossRef]
- Ito, H.; Matsuo, K.; Hosono, S.; Watanabe, M.; Kawase, T.; Suzuki, T.; Hirai, T.; Yatabe, Y.; Tanaka, H.; Tajima, K. Association between CYP7A1 and the risk of proximal colon cancer in Japanese. Int. J. Mol. Epidemiol. Genet. 2010, 1, 35–46. [Google Scholar]
- Luu, W.; Sharpe, L.J.; Capell-Hattam, I.; Gelissen, I.C.; Brown, A.J. Oxysterols: Old Tale, New Twists. Annu. Rev. Pharmacol. Toxicol. 2016, 56, 447–467. [Google Scholar] [CrossRef]
- Paz, J.L.; Levy, D.; Oliveira, B.A.; de Melo, T.C.; de Freitas, F.A.; Reichert, C.O.; Rodrigues, A.; Pereira, J.; Bydlowski, S.P. 7-Ketocholesterol Promotes Oxiapoptophagy in Bone Marrow Mesenchymal Stem Cell from Patients with Acute Myeloid Leukemia. Cells 2019, 8, 482. [Google Scholar] [CrossRef] [Green Version]
- You, J.S.; Lim, H.; Seo, J.Y.; Kang, K.R.; Kim, D.K.; Oh, J.S.; Seo, Y.S.; Lee, G.J.; Kim, J.S.; Kim, H.J.; et al. 25-Hydroxycholesterol-Induced Oxiapoptophagy in L929 Mouse Fibroblast Cell Line. Molecules 2021, 27, 199. [Google Scholar] [CrossRef]
- Jaouadi, O.; Limam, I.; Abdelkarim, M.; Berred, E.; Chahbi, A.; Caillot, M.; Sola, B.; Ben Aissa-Fennira, F. 5,6-Epoxycholesterol Isomers Induce Oxiapoptophagy in Myeloma Cells. Cancers 2021, 13, 3747. [Google Scholar] [CrossRef]
- Nury, T.; Yammine, A.; Ghzaiel, I.; Sassi, K.; Zarrouk, A.; Brahmi, F.; Samadi, M.; Rup-Jacques, S.; Vervandier-Fasseur, D.; Pais de Barros, J.P.; et al. Attenuation of 7-ketocholesterol- and 7beta-hydroxycholesterol-induced oxiapoptophagy by nutrients, synthetic molecules and oils: Potential for the prevention of age-related diseases. Ageing Res. Rev. 2021, 68, 101324. [Google Scholar] [CrossRef]
- You, J.S.; Lim, H.; Kim, T.H.; Oh, J.S.; Lee, G.J.; Seo, Y.S.; Kim, D.K.; Yu, S.K.; Kim, H.J.; Kim, C.S.; et al. 25-Hydroxycholesterol Induces Death Receptor-mediated Extrinsic and Mitochondria-dependent Intrinsic Apoptosis in Head and Neck Squamous Cell Carcinoma Cells. Anticancer Res. 2020, 40, 779–788. [Google Scholar] [CrossRef]
- Jeong, S.Y.; Seol, D.W. The role of mitochondria in apoptosis. BMB Rep. 2008, 41, 11–22. [Google Scholar] [CrossRef] [PubMed] [Green Version]
- Wei, M.C.; Lindsten, T.; Mootha, V.K.; Weiler, S.; Gross, A.; Ashiya, M.; Thompson, C.B.; Korsmeyer, S.J. tBID, a membrane-targeted death ligand, oligomerizes BAK to release cytochrome c. Genes Dev. 2000, 14, 2060–2071. [Google Scholar] [CrossRef] [PubMed]
- Mittal, M.; Siddiqui, M.R.; Tran, K.; Reddy, S.P.; Malik, A.B. Reactive oxygen species in inflammation and tissue injury. Antioxid. Redox Signal. 2014, 20, 1126–1167. [Google Scholar] [CrossRef] [Green Version]
- Zhang, X.; Tang, N.; Hadden, T.J.; Rishi, A.K. Akt, FoxO and regulation of apoptosis. Biochim. Biophys. Acta 2011, 1813, 1978–1986. [Google Scholar] [CrossRef] [PubMed] [Green Version]
- Zamzami, N.; Kroemer, G. p53 in apoptosis control: An introduction. Biochem. Biophys. Res. Commun. 2005, 331, 685–687. [Google Scholar] [CrossRef]
- D’Arcy, M.S. Cell death: A review of the major forms of apoptosis, necrosis and autophagy. Cell Biol. Int. 2019, 43, 582–592. [Google Scholar] [CrossRef]
- Sun, K.; Luo, J.; Guo, J.; Yao, X.; Jing, X.; Guo, F. The PI3K/AKT/mTOR signaling pathway in osteoarthritis: A narrative review. Osteoarthr. Cartil. 2020, 28, 400–409. [Google Scholar] [CrossRef]
- Park, J.M.; Jung, C.H.; Seo, M.; Otto, N.M.; Grunwald, D.; Kim, K.H.; Moriarity, B.; Kim, Y.M.; Starker, C.; Nho, R.S.; et al. The ULK1 complex mediates MTORC1 signaling to the autophagy initiation machinery via binding and phosphorylating ATG14. Autophagy 2016, 12, 547–564. [Google Scholar] [CrossRef]
- Nnah, I.C.; Wang, B.; Saqcena, C.; Weber, G.F.; Bonder, E.M.; Bagley, D.; De Cegli, R.; Napolitano, G.; Medina, D.L.; Ballabio, A.; et al. TFEB-driven endocytosis coordinates MTORC1 signaling and autophagy. Autophagy 2019, 15, 151–164. [Google Scholar] [CrossRef] [PubMed] [Green Version]
- Ngo, M.D.; Bartlett, S.; Bielefeldt-Ohmann, H.; Foo, C.X.; Sinha, R.; Arachchige, B.J.; Reed, S.; Mandrup-Poulsen, T.; Rosenkilde, M.M.; Ronacher, K. A Blunted GPR183/Oxysterol Axis During Dysglycemia Results in Delayed Recruitment of Macrophages to the Lung During Mycobacterium tuberculosis Infection. J. Infect. Dis. 2022, 225, 2219–2228. [Google Scholar] [CrossRef] [PubMed]


Publisher’s Note: MDPI stays neutral with regard to jurisdictional claims in published maps and institutional affiliations. |
© 2022 by the authors. Licensee MDPI, Basel, Switzerland. This article is an open access article distributed under the terms and conditions of the Creative Commons Attribution (CC BY) license (https://creativecommons.org/licenses/by/4.0/).
Share and Cite
Kim, J.-S.; Lim, H.; Seo, J.-Y.; Kang, K.-R.; Yu, S.-K.; Kim, C.S.; Kim, D.K.; Kim, H.-J.; Seo, Y.-S.; Lee, G.-J.; et al. GPR183 Regulates 7α,25-Dihydroxycholesterol-Induced Oxiapoptophagy in L929 Mouse Fibroblast Cell. Molecules 2022, 27, 4798. https://doi.org/10.3390/molecules27154798
Kim J-S, Lim H, Seo J-Y, Kang K-R, Yu S-K, Kim CS, Kim DK, Kim H-J, Seo Y-S, Lee G-J, et al. GPR183 Regulates 7α,25-Dihydroxycholesterol-Induced Oxiapoptophagy in L929 Mouse Fibroblast Cell. Molecules. 2022; 27(15):4798. https://doi.org/10.3390/molecules27154798
Chicago/Turabian StyleKim, Jae-Sung, HyangI Lim, Jeong-Yeon Seo, Kyeong-Rok Kang, Sun-Kyoung Yu, Chun Sung Kim, Do Kyung Kim, Heung-Joong Kim, Yo-Seob Seo, Gyeong-Je Lee, and et al. 2022. "GPR183 Regulates 7α,25-Dihydroxycholesterol-Induced Oxiapoptophagy in L929 Mouse Fibroblast Cell" Molecules 27, no. 15: 4798. https://doi.org/10.3390/molecules27154798
APA StyleKim, J.-S., Lim, H., Seo, J.-Y., Kang, K.-R., Yu, S.-K., Kim, C. S., Kim, D. K., Kim, H.-J., Seo, Y.-S., Lee, G.-J., You, J.-S., & Oh, J.-S. (2022). GPR183 Regulates 7α,25-Dihydroxycholesterol-Induced Oxiapoptophagy in L929 Mouse Fibroblast Cell. Molecules, 27(15), 4798. https://doi.org/10.3390/molecules27154798