
Compositions and Biological Activities of Pomegranate Peel Polyphenols Extracted by Different Solvents


Abstract
:1. Introduction
2. Results and Discussion
2.1. HPLC-MS/MS Analysis
2.1.1. Polyphenols
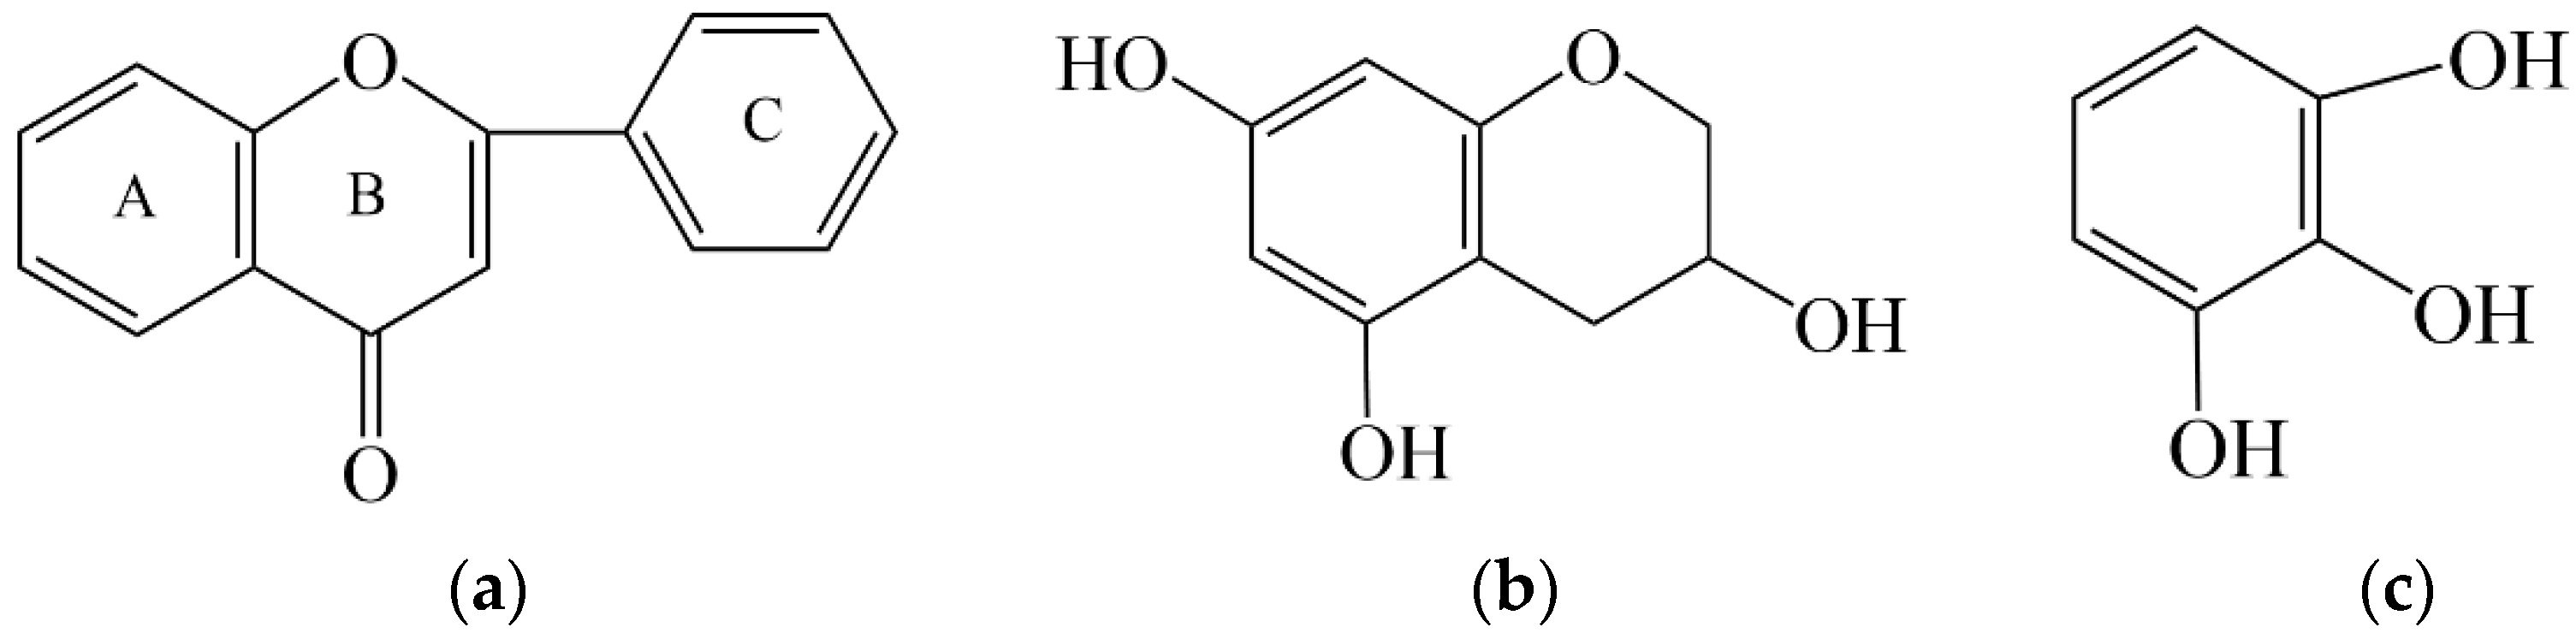
2.1.2. Flavonoids
2.2. Yield and Active Ingredients
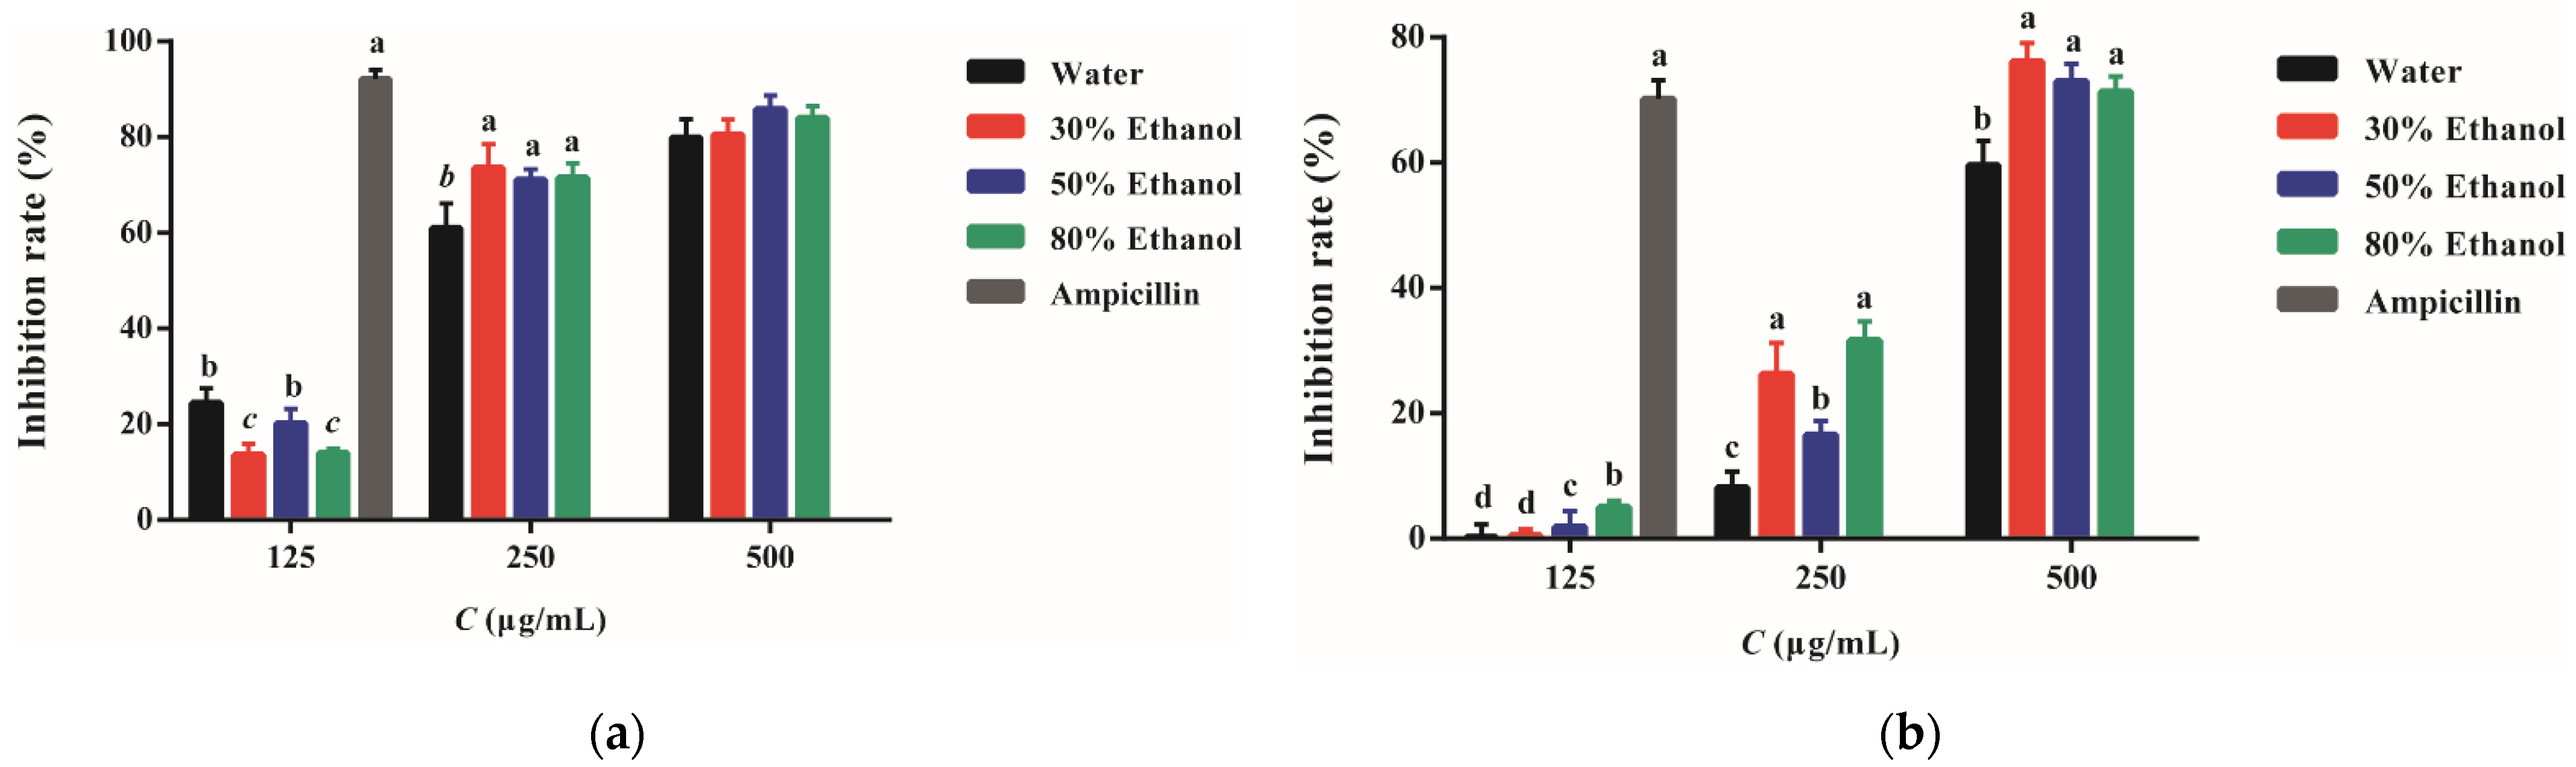
2.3. Antibacterial Activity
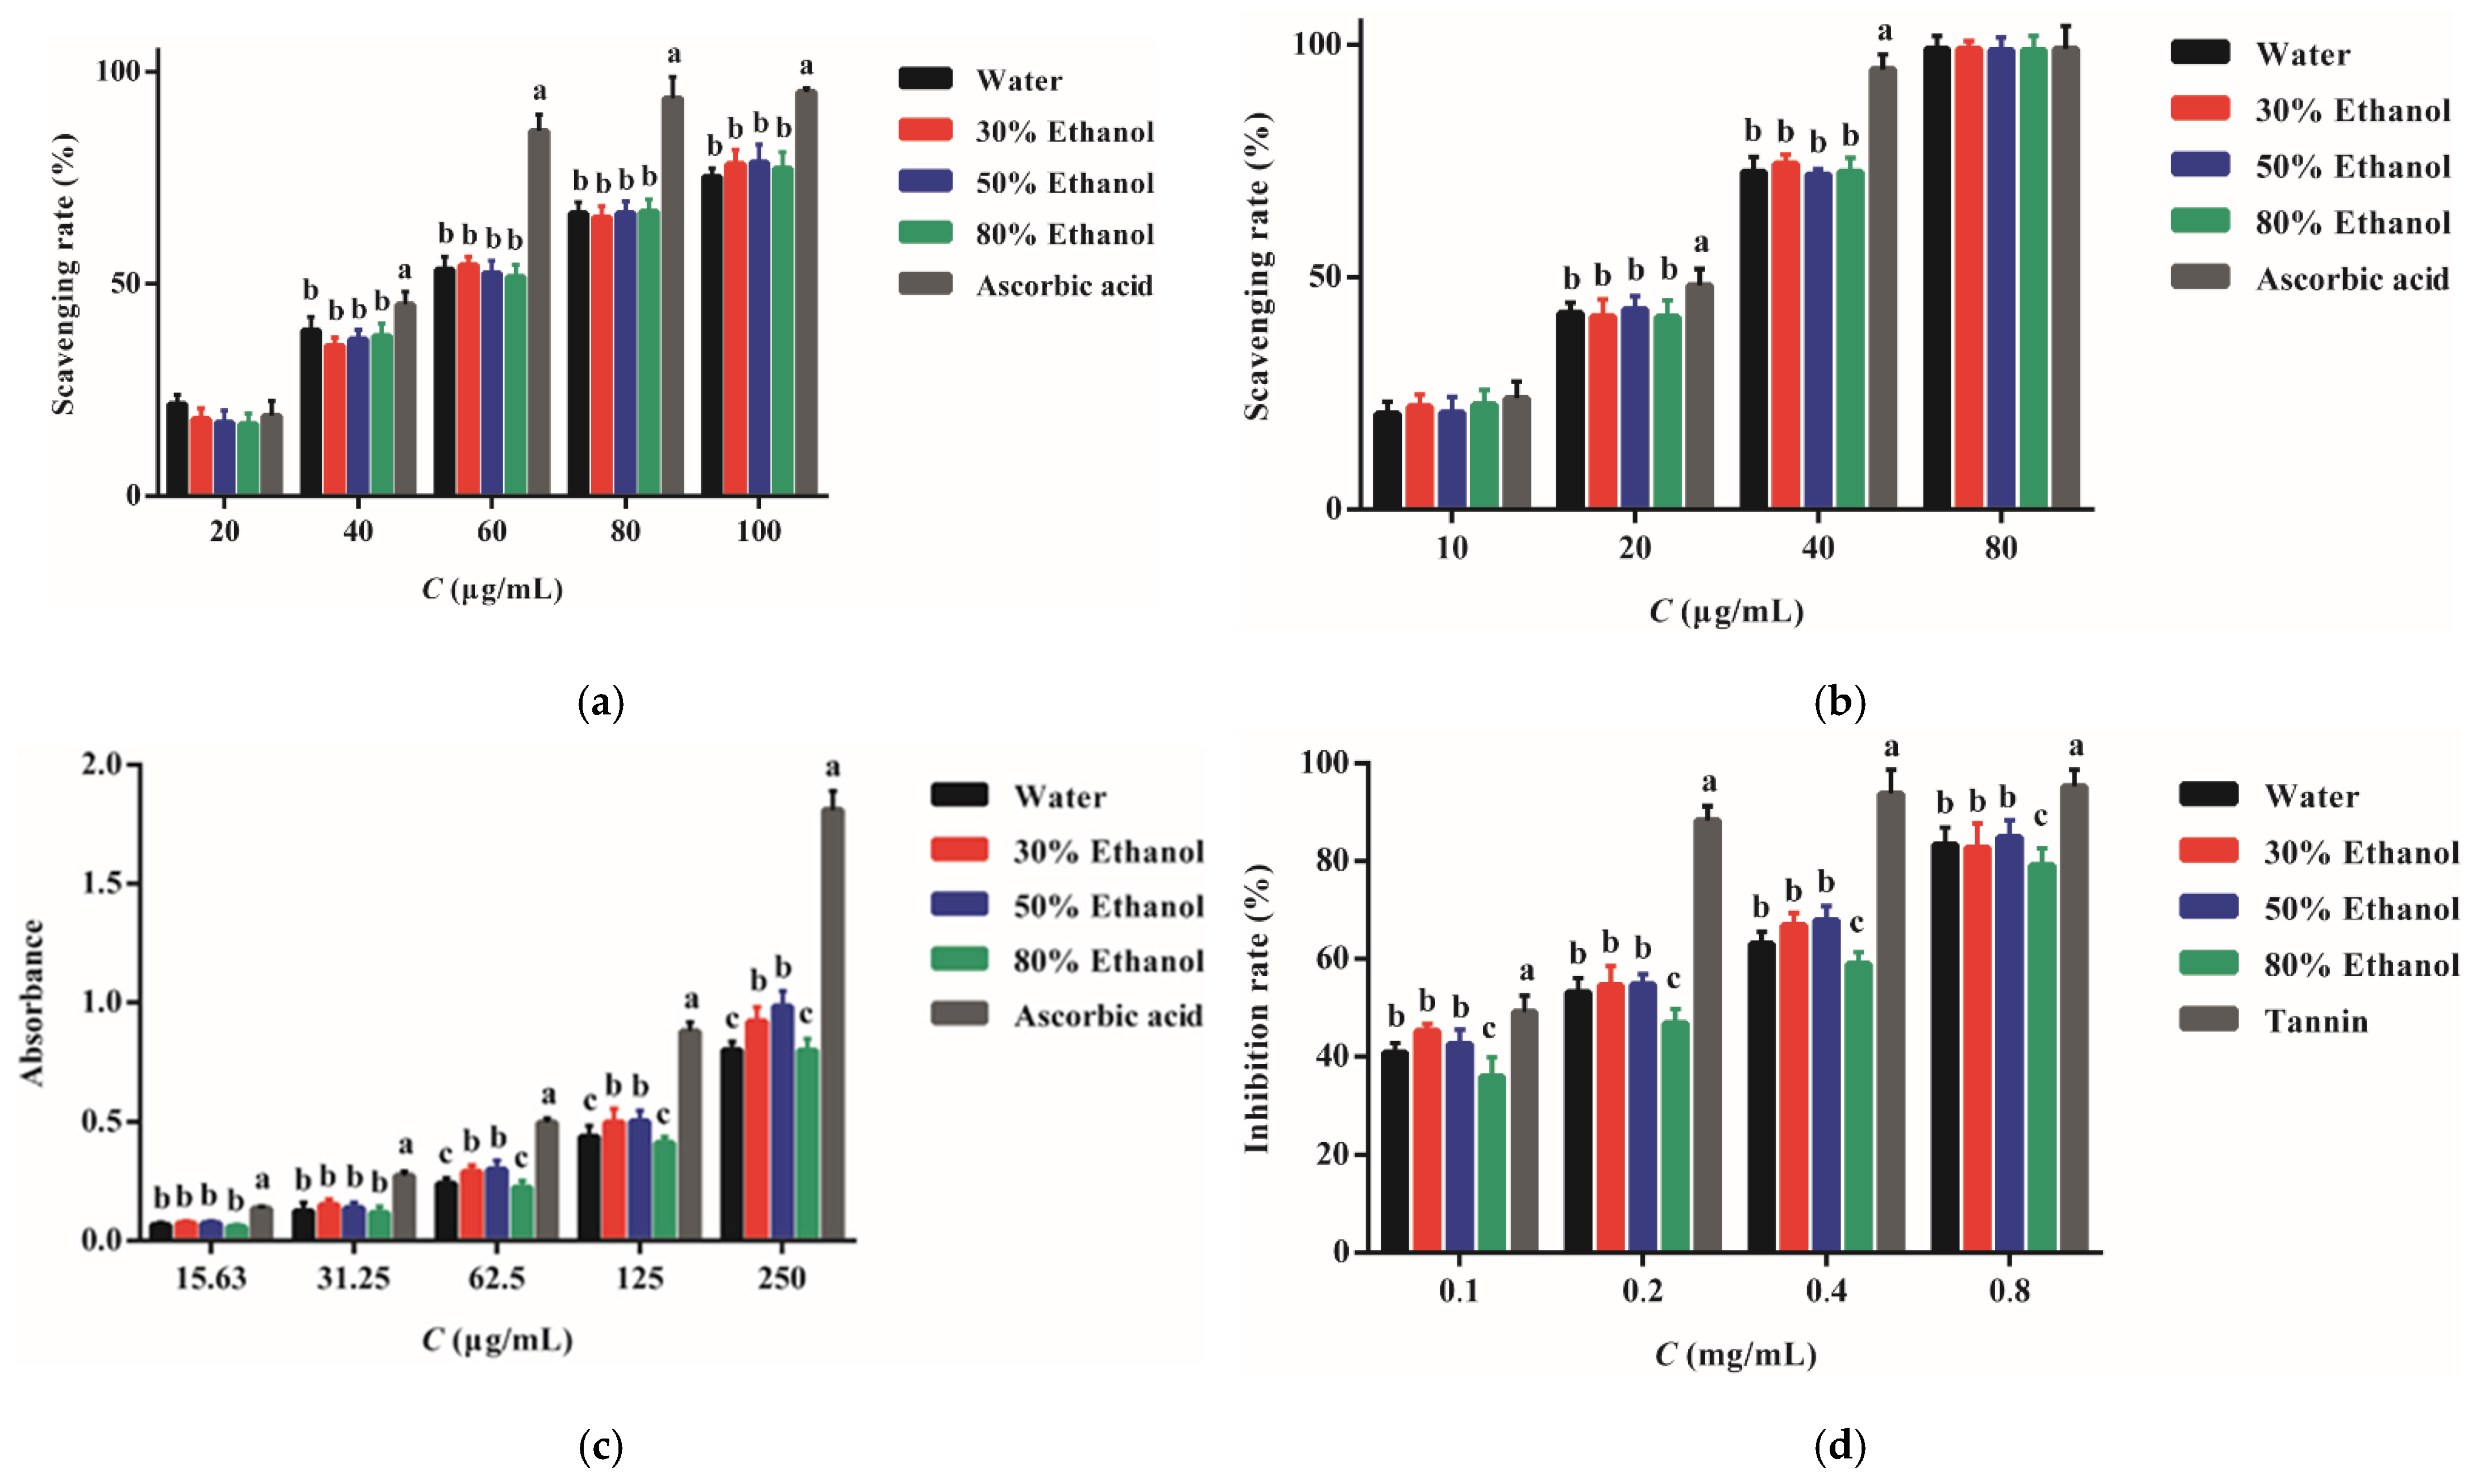
2.4. Antioxidant Activity
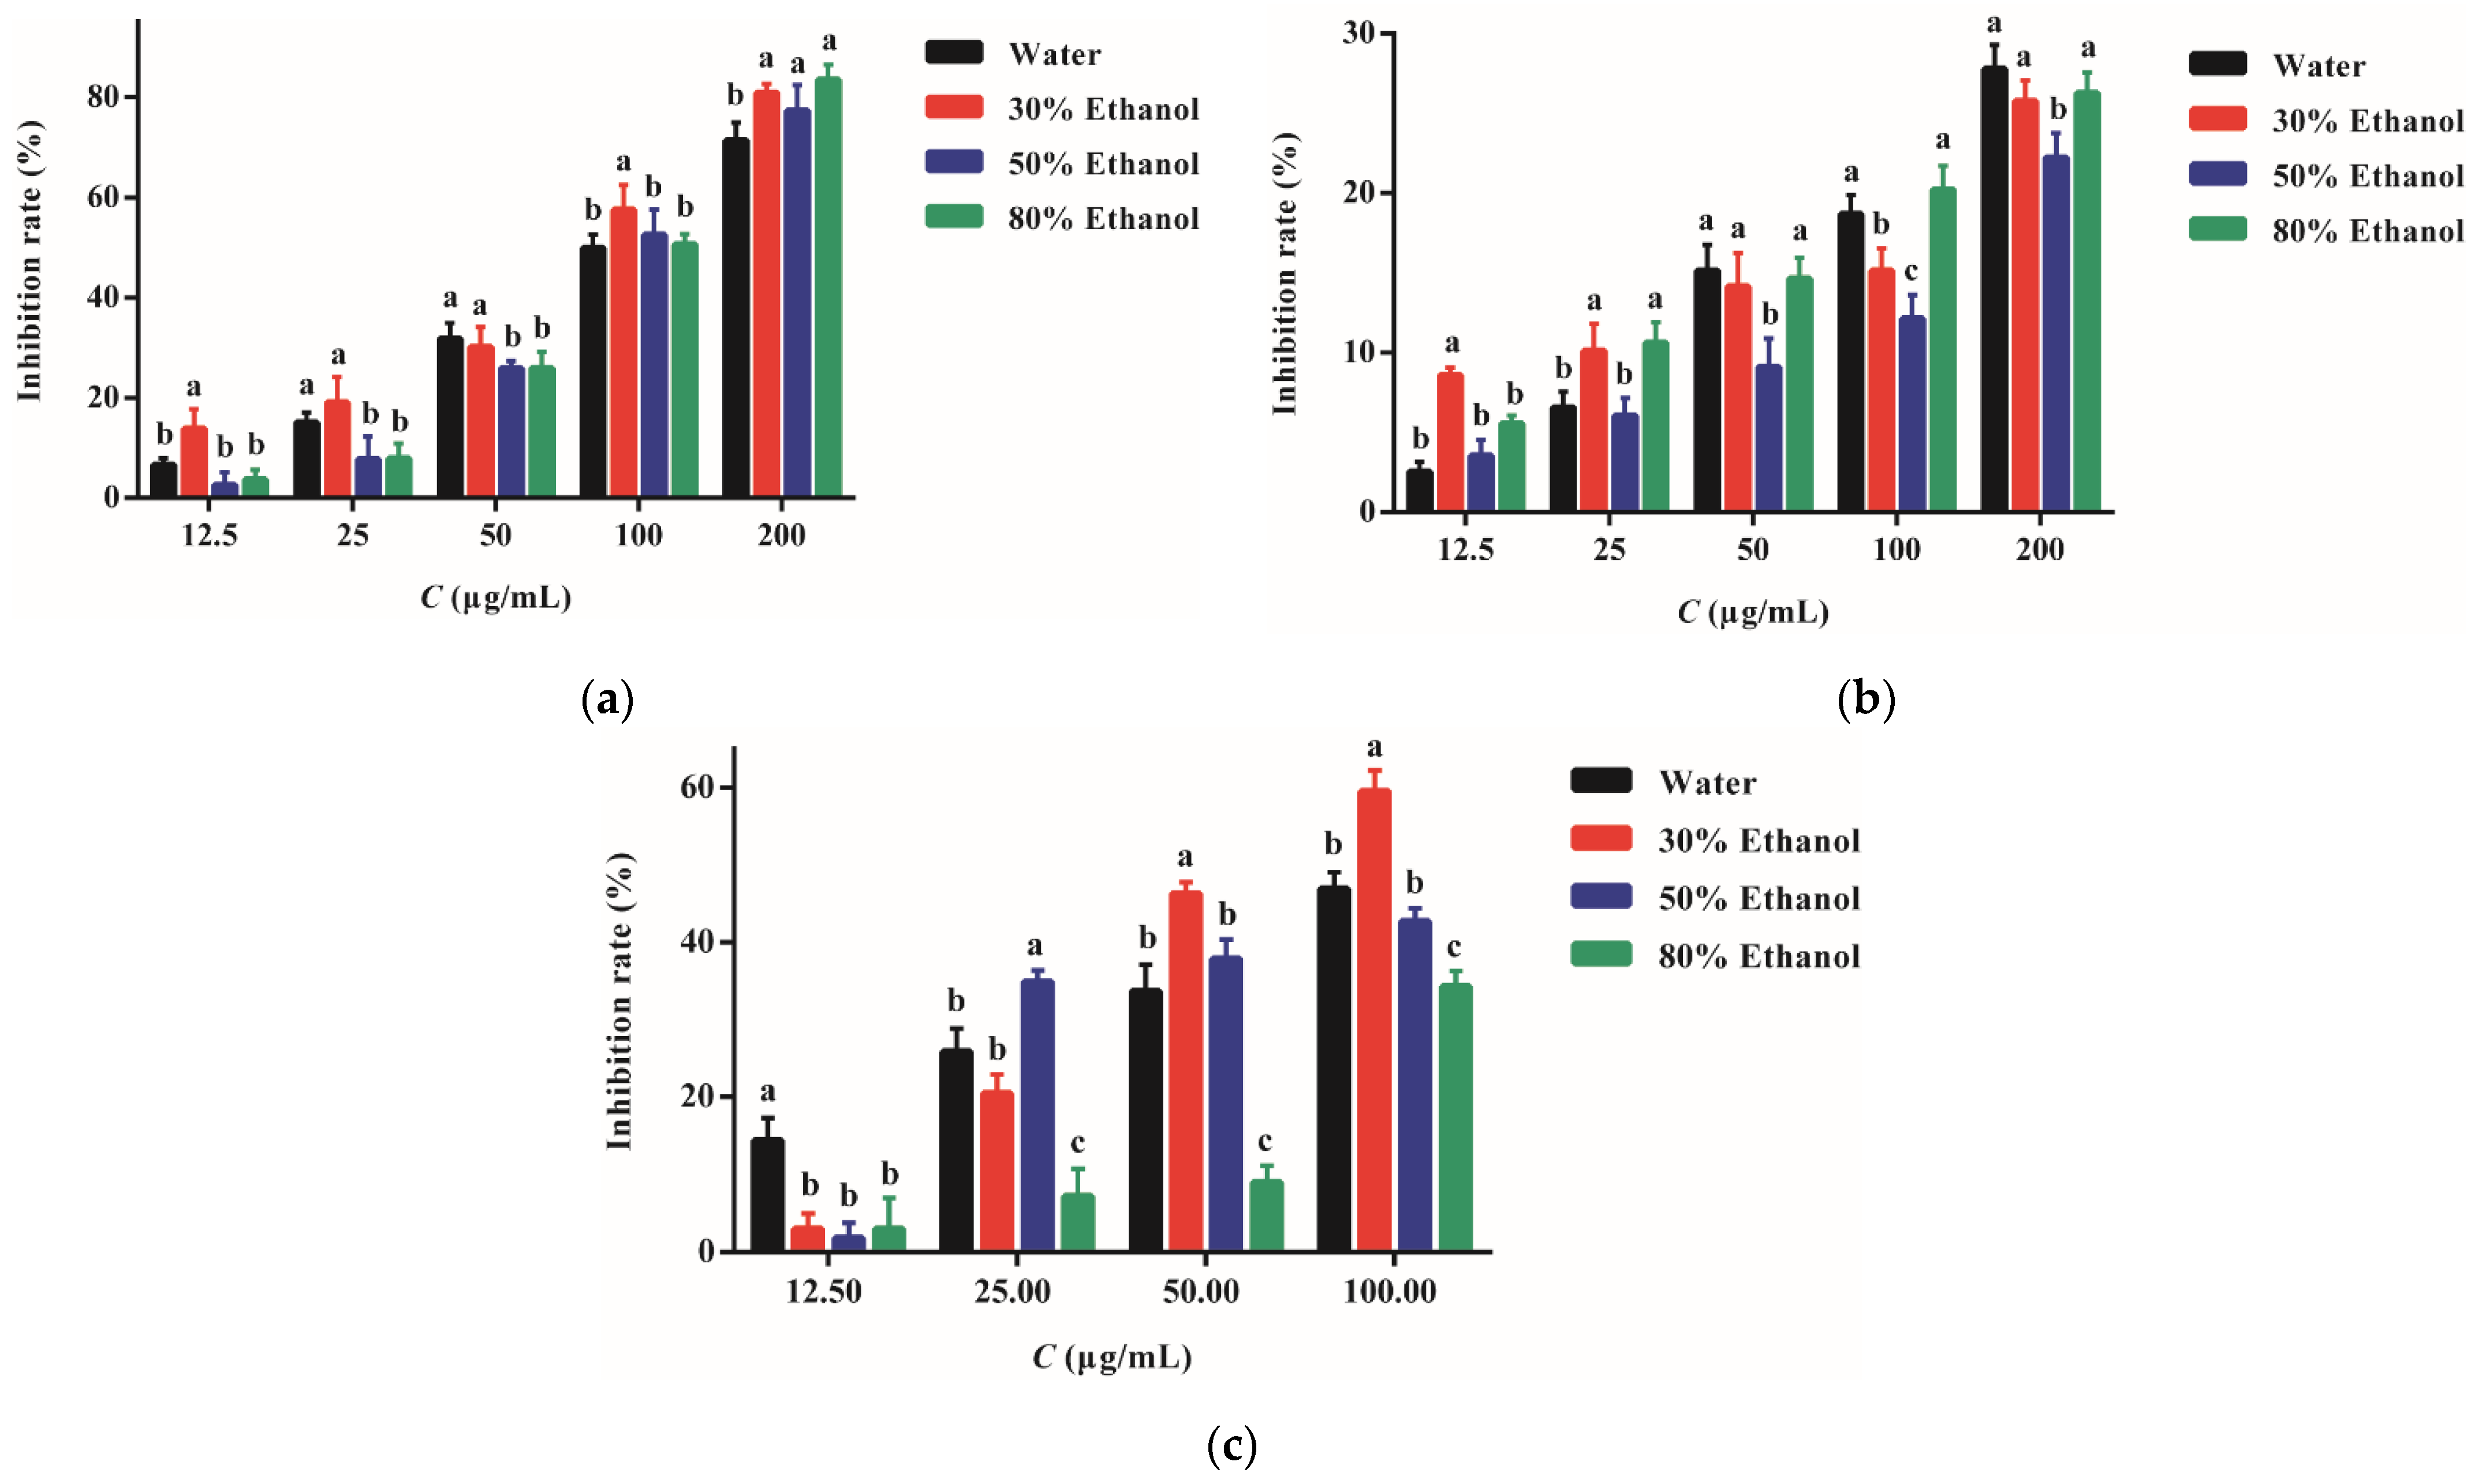
2.5. Anti-Inflammatory Activity
2.6. Principal Composition Analysis
2.6.1. Correlation Analysis
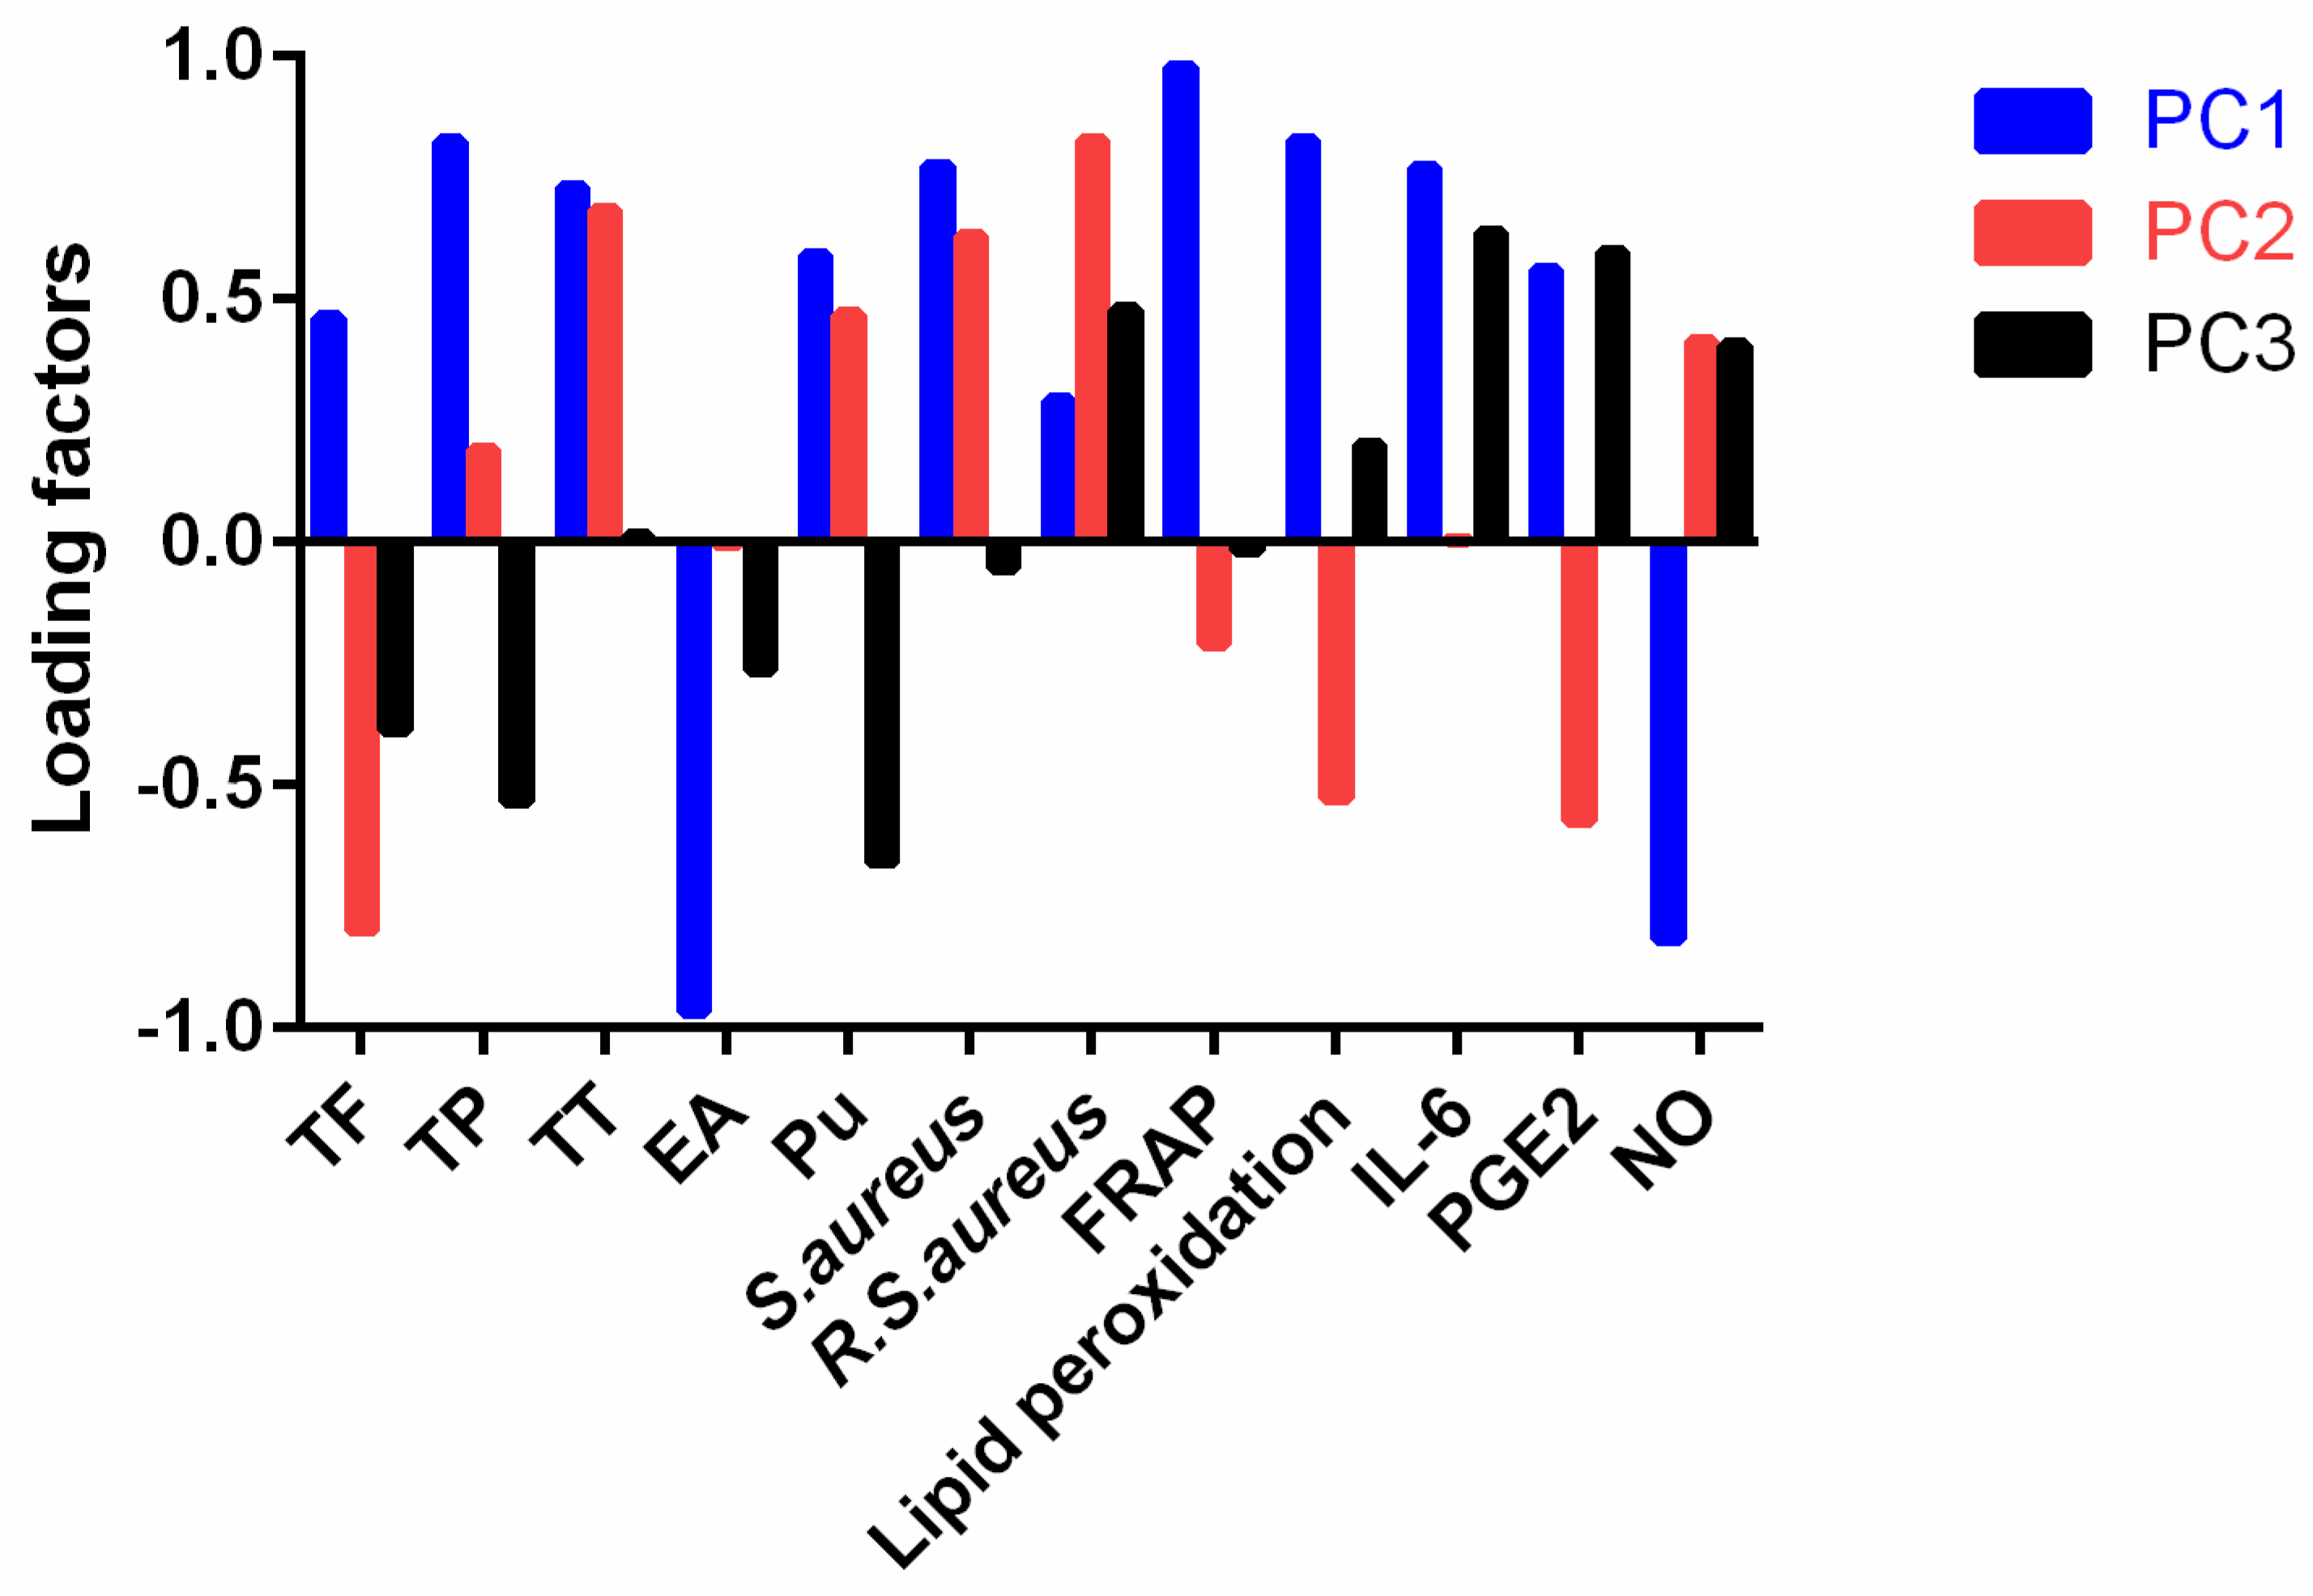
2.6.2. Principal Component Analysis
3. Materials and Methods
3.1. Materials
3.2. Extraction of PP
3.3. Analysis of the Extracts
3.3.1. Composition Identification by HPLC-MS/MS
3.3.2. Total Polyphenols
3.3.3. Total Flavonoids
3.3.4. Total Tannins
3.3.5. Ellagic Acid and Punicalagin
3.4. Antibacterial Activity
3.5. Antioxidant Activity
3.5.1. Scavenging ABTS+ Radicals
3.5.2. Scavenging DPPH Radicals
3.5.3. Ferric-Reducing Antioxidant Power
3.5.4. Inhibition against Lipid Peroxidation
3.6. Anti-Inflammatory Effect
3.6.1. Cell Culture
3.6.2. Cell Viability
3.6.3. Determination of IL-6 and PEG2
3.6.4. Determination of Nitric Oxide
3.7. Statistical Analysis
4. Conclusions
Author Contributions
Funding
Institutional Review Board Statement
Informed Consent Statement
Data Availability Statement
Acknowledgments
Conflicts of Interest
Sample Availability
References
- Morgene, M.F.; Botelho-Nevers, E.; Grattard, F.; Pillet, S.; Berthelot, P.; Pozzetto, B.; Verhoeven, P.O. Staphylococcus aureus colonization and non-influenza respiratory viruses: Interactions and synergism mechanisms. Virulence 2018, 9, 1354–1363. [Google Scholar] [CrossRef] [PubMed] [Green Version]
- Turlewicz-Podbielska, H.; Augustyniak, A.; Pomorska-Mόl, M. Viral co-infections of the porcine respiratory tract: Insight into the local cytokine response. Med. Weter. 2022, 78, 213–221. [Google Scholar] [CrossRef]
- Magangana, T.P.; Makunga, N.P.; Fawole, O.A.; Opara, U.L. Processing factors affecting the phytochemical and nutritional properties of pomegranate (Punica granatum L.) peel waste: A review. Molecules 2020, 25, 4690. [Google Scholar] [CrossRef]
- Chen, J.; Liao, C.; Ouyang, X.; Kahramanoğlu, I.; Gan, Y.; Li, M.; Rengasamy, K.R.R. Antimicrobial activity of pomegranate peel and its applications on food preservation. J. Food Qual. 2020, 2020, 8850339. [Google Scholar] [CrossRef]
- Vučić, V.; Grabeź, M.; Trchounian, A.; Arsić, A. Composition and potential health benefits of pomegranate: A review. Curr. Pharm. Design 2019, 25, 1817–1827. [Google Scholar] [CrossRef] [PubMed]
- Asgary, S.; Keshvari, M.; Sahebkar, A.; Sarrafzadegan, N. Pomegranate consumption and blood pressure: A review. Curr. Pharm. Design 2017, 23, 1042–1050. [Google Scholar] [CrossRef]
- Kumar, N.; Pratibha; Neeraj; Sami, R.; Khojah, E.; Aljahani, A.H.; Al-Mushhin, A.A.M. Effects of drying methods and solvent extraction on quantification of major bioactive compounds in pomegranate peel waste using HPLC. Sci. Rep.-UK 2022, 12, e8000. [Google Scholar] [CrossRef] [PubMed]
- Ranjha, M.M.A.N.; Amjad, S.; Ashraf, S.; Khawar, L.; Safdar, M.N.; Jabbar, S.; Nadeem, M.; Mahmood, S.; Murtaza, M.A. Extraction of polyphenols from apple and pomegranate peels employing different extraction techniques for the development of functional date bars. Int. J. Fruit Sci. 2020, 20, 1201–1221. [Google Scholar] [CrossRef]
- Cam, M.; Icyer, N.C. Phenolics of pomegranate peels: Extraction optimization by central composite design and alpha glucosidase inhibition potentials. J. Food Sci. Technol. 2015, 52, 1489–1497. [Google Scholar] [CrossRef] [PubMed] [Green Version]
- Rajha, H.N.; Koubaa, M.; Boussetta, N.; Maroun, R.G.; Louka, N.; Lebovka, N.; Vorobiev, E. Selective ultrasound-assisted aqueous extraction of polyphenols from pomegranate peels and seeds. J. Food Process. Preserv. 2020, 44, e14545. [Google Scholar] [CrossRef]
- Gil, M.I.; Tomás-Barberán, F.A.; Hess-Pierce, B.; Holcroft, D.M.; Kader, A.A. Antioxidant activity of pomegranate juice and its relationship with phenolic composition and processing. J. Agric. Food Chem. 2000, 48, 4581–4589. [Google Scholar] [CrossRef]
- Abid, M.; Yaich, H.; Cheikhrouhou, S.; Khemakhem, I.; Bouaziz, M.; Attia, H.; Ayadi, M.A. Antioxidant properties and phenolic profile characterization by LC-MS/MS of selected Tunisian pomegranate peels. J. Food Sci. Technol. 2017, 54, 2890–2901. [Google Scholar] [CrossRef] [PubMed]
- Zhao, S.S.; Ma, D.X.; Zhu, Y.; Zhao, J.H.; Zhang, Y.; Chen, J.Q.; Sheng, Z.L. Antidiarrheal effect of bioactivity-guided fractions and bioactive components of pomegranate (Punica granatum L.) peels. Neurogastroenterol. Motil. 2018, 30, e13364. [Google Scholar] [CrossRef] [PubMed]
- Liu, Y.; Kong, K.W.; Wu, D.T.; Liu, H.Y.; Li, H.B.; Zhang, J.R.; Gan, R.Y. Pomegranate peel-derived punicalagin: Ultrasonic-assisted extraction, purification, and its alpha-glucosidase inhibitory mechanism. Food Chem. 2022, 374, e131635. [Google Scholar] [CrossRef] [PubMed]
- Peršurić, Z.; Saftic Martinovic, L.; Malenica, M.; Gobin, I.; Pedisic, S.; Dragovic-Uzelac, V.; Kraljevic Pavelic, S. Assessment of the biological activity and phenolic composition of ethanol extracts of pomegranate (Punica granatum L.) peels. Molecules 2020, 25, 5916. [Google Scholar] [CrossRef] [PubMed]
- Ambigaipalan, P.; de Camargo, A.C.; Shahidi, F. Phenolic compounds of pomegranate byproducts (outer skin, mesocarp, divider membrane) and their antioxidant activities. J. Agric. Food Chem. 2016, 64, 6584–6604. [Google Scholar] [CrossRef] [PubMed]
- Elwej, A.; Grojja, Y.; Ghorbel, I.; Boudawara, O.; Jarraya, R.; Boudawara, T.; Zeghal, N. Barium chloride induces redox status unbalance, upregulates cytokine genes expression and confers hepatotoxicity in rats—Alleviation by pomegranate peel. Environ. Sci. Pullot. Res. 2016, 23, 7559–7571. [Google Scholar] [CrossRef]
- Magangana, T.P.; Makunga, N.P.; la Grange, C.; Stander, M.A.; Fawole, O.A.; Opara, U.L. Blanching pre-treatment promotes high yields, bioactive compounds, antioxidants, enzyme inactivation and antibacterial activity of ‘wonderful’ pomegranate peel extracts at three different harvest maturities. Antioxidants 2021, 10, 1119. [Google Scholar] [CrossRef]
- Derakhshan, Z.; Ferrante, M.; Tadi, M.; Ansari, F.; Heydari, A.; Hosseini, M.S.; Conti, G.O.; Sadrabad, E.K. Antioxidant activity and total phenolic content of ethanolic extract of pomegranate peels, juice and seeds. Food Chem. Toxicol. 2018, 114, 108–111. [Google Scholar] [CrossRef]
- Kazemi, M.; Karim, R.; Mirhosseini, H.; Hamid, A.A. Optimization of pulsed ultrasound-assisted technique for extraction of phenolics from pomegranate peel of Malas variety: Punicalagin and hydroxybenzoic acids. Food Chem. 2016, 206, 156–166. [Google Scholar] [CrossRef]
- Amini, R.K.; Kitamura, Y.; Islam, M.Z.; Kokawa, M.; Eseese, V.F. Impact of micro wet milling process on pomegranate peel phenolics extraction using multi-response optimization. J. Food Meas. Charact. 2021, 15, 2865–2876. [Google Scholar] [CrossRef]
- Jaisinghani, R.N.; Makhwana, S.; Kanojia, A. Study on antibacterial and flavonoid content of ethanolic extract of Punica granatum (pomegranate) peel. Microbiol. Res. 2018, 9, e7480. [Google Scholar] [CrossRef] [Green Version]
- Chen, X.; Zhang, H.; Li, J.; Chen, L. Analysis of chemical compounds of pomegranate peel polyphenols and their antibacterial action against Ralstonia solanacearum. S. Afr. J. Bot. 2021, 140, 4–10. [Google Scholar] [CrossRef]
- Alvarez-Arellano, L.; Gonzalez-Garcia, N.; Salazar-Garcia, M.; Corona, J.C. Antioxidants as a potential target against inflammation and oxidative stress in attention-deficit/hyperactivity disorder. Antioxidants 2020, 9, 176. [Google Scholar] [CrossRef] [Green Version]
- Kam, A.; Li, K.M.; Razmovski-Naumovski, V.; Nammi, S.; Chan, K.; Li, G.Q. Variability of the polyphenolic content and antioxidant capacity of methanolic extracts of pomegranate peel. Nat. Prod. Commun. 2013, 8, 707–710. [Google Scholar] [CrossRef] [Green Version]
- Malviya, S.; Jha, A.A.; Hettiarachchy, N. Antioxidant and antibacterial potential of pomegranate peel extracts. J. Food Sci. Technol. 2014, 51, 4132–4137. [Google Scholar] [CrossRef] [PubMed] [Green Version]
- Zhong, S.; Li, L.; Shen, X.; Li, Q.; Xu, W.; Wang, X.; Tao, Y.; Yin, H. An update on lipid oxidation and inflammation in cardiovascular diseases. Free Radic. Biol. Med. 2019, 144, 266–278. [Google Scholar] [CrossRef]
- Sottero, B.; Rossin, D.; Poli, G.; Biasi, F. Lipid oxidation products in the pathogenesis of inflammation-related gut diseases. Curr. Med. Chem. 2018, 25, 1311–1326. [Google Scholar] [CrossRef]
- Kumar, D.; Singh, S.; Singh, A.K.; Rizvi, S.I. Pomegranate (Punica granatum) peel extract provides protection against mercuric chloride-induced oxidative stress in Wistar strain rats. Pharm. Biol. 2013, 51, 441–446. [Google Scholar] [CrossRef]
- Du, L.; Li, J.; Zhang, X.; Wang, L.; Zhang, W. Pomegranate peel polyphenols inhibits inflammation in LPS-induced RAW264.7 macrophages via the suppression of MAPKs activation. J. Funct. Foods 2018, 43, 62–69. [Google Scholar] [CrossRef]
- Mastrogiovanni, F.; Bernini, R.; Basirico, L.; Bernabucci, U.; Campo, M.; Romani, A.; Santi, L.; Lacetera, N. Antioxidant and anti-inflammatory effects of pomegranate peel extracts on bovine mammary epithelial cells BME-UV1. Nat. Prod. Res. 2020, 34, 1465–1469. [Google Scholar] [CrossRef]
- Gatto, L.J.; Veiga, A.; Gribner, C.; Moura, P.F.; Rech, K.S.; Murakami, F.S.; Dias, J.F.G.; Miguel, O.G.; Miguel, M.D. Myrcia hatschbachii: Antifungal activity and structural elucidation of ellagic and 3-O-methyl ellagic acids. Nat. Prod. Res. 2021, 35, 5540–5543. [Google Scholar] [CrossRef] [PubMed]
- Silva, A.R.A.; Morais, S.M.; Marques, M.M.M.; Oliveira, D.F.; Barros, C.C.; Almeida, R.R.; Vieira, I.G.P.; Guedes, M.I.F. Chemical composition, antioxidant and antibacterial activities of two Spondias species from Northeastern Brazil. Pharm. Biol. 2012, 50, 740–746. [Google Scholar] [CrossRef] [PubMed]
- Liy, P.M.; Puzi, N.N.A.; Jose, S.; Vidyadaran, S. Nitric oxide modulation in neuroinflammation and the role of mesenchymal stem cells. Exp. Biol. Med. 2021, 246, 2399–2406. [Google Scholar] [CrossRef]
- Balabanli, B.; Bircan, F.; Palai, E.; Alem, N.; Coskun, S. Ascorbic acid prevents lipid peroxidation by sparing nitric oxide in fibroblast cells. Asian J. Chem. 2009, 21, 1372–1376. [Google Scholar]
- Boveris, A.D.; Galatro, A.; Puntarulo, S. Effect of nitric oxide and plant antioxidants on microsomal content of lipid radicals. Biol. Res. 2000, 33, 159–165. [Google Scholar] [CrossRef] [PubMed]
- Yadav, U.C.S.; Kalariya, N.M.; Ramana, K.V. Emerging role of antioxidants in the protection of uveitis complications. Curr. Med. Chem. 2011, 18, 931–942. [Google Scholar] [CrossRef]
- Lu, L.; Yang, P.; Chen, T.; Shen, Y.; Yao, Q.; Yan, J. Changes in biological activities after olive oil, pomegranate seed oil, and grape seed oil were formulated into self-nanoemulsifying systems. J. Oleo Sci. 2020, 69, 161–166. [Google Scholar] [CrossRef] [Green Version]
- Papaioannou, E.H.; Mitrouli, S.T.; Patsios, S.I.; Kazakli, M.; Karabelas, A.J. Valorization of pomegranate husk—Integration of extraction with nanofiltration for concentrated polyphenols recovery. J. Environ. Chem. Eng. 2020, 8, e103951. [Google Scholar] [CrossRef]
- Lima, M.B.; Andrade, S.I.E.; Harding, D.P.; Pistonesi, M.F.; Band, B.S.F.; Araujo, M.C.U. Turbidimetric and photometric determination of total tannins in tea using a micro-flow-batch analyzer. Talanta 2012, 88, 717–723. [Google Scholar] [CrossRef] [Green Version]
- Re, R.; Pellegrini, N.; Proteggente, A.; Pannala, A.; Yang, M.; Rice-Evans, C. Antioxidant activity applying an improved ABTS radical cation decolorization assay. Free Radic. Biol. Med. 1999, 26, 1231–1237. [Google Scholar] [CrossRef]
- Yao, Q.; Shen, Y.; Bu, L.; Yang, P.; Xu, Z.; Guo, X. Ultrasound-assisted aqueous extraction of total flavonoids and hydroxytyrosol from olive leaves optimized by response surface methodology. Prep. Biochem. Biotechnol. 2019, 49, 837–845. [Google Scholar] [CrossRef] [PubMed]
- Xue, L.L.; Wu, W.S.; Ma, X.; Pei, H.Y.; Tang, M.H.; Kuang, S.; Cai, X.Y.; Wang, L.; Li, Y.; Zhang, R.J.; et al. Modulation of LPS-induced inflammation in RAW264.7 murine cells by novel isoflavonoids from Millettia pulchra. Bioorg. Chem. 2020, 97, e103693. [Google Scholar] [CrossRef] [PubMed]


| (a) | ||||||
| NO. | RT (min) | Name | Molecular Formula | [M − H]−/ [M − 2H]2− | MS Fragment (m/z) | Relative Abundance (%) |
| 1 | 1.56 | Punicalagin isomer | C48H28O30 | 1083.0603 | 856.4002 | 0.02 |
| 227.0704 | 14.40 | |||||
| 181.0705 | 100.00 | |||||
| 2 | 1.78 | Punicalagin α | C48H28O30 | 1083.0603 | 913.1799 | 0.18 |
| 781.0536 | 5.87 | |||||
| 481.0626 | 0.07 | |||||
| 253.0577 | 0.65 | |||||
| 179.0551 | 100.00 | |||||
| 3 | 1.90 | Punicalagin isomer | C48H28O30 | 1083.0603 | 854.1169 | 0.02 |
| 781.0535 | 0.38 | |||||
| 481.0626 | 3.85 | |||||
| 225.0608 | 33.33 | |||||
| 179.0551 | 100.00 | |||||
| 4 | 2.01 | Punicalin | C34H22O22 | 781.0539 | 481.0624 | 2.09 |
| 225.0607 | 34.38 | |||||
| 179.0551 | 100.00 | |||||
| 5 | 2.11 | Punicalagin isomer | C48H28O30 | 1083.0603 | 854.9579 | 0.02 |
| 781.0524 | 0.04 | |||||
| 651.0829 | 0.05 | |||||
| 481.0623 | 2.12 | |||||
| 225.0607 | 34.62 | |||||
| 179.0551 | 100.00 | |||||
| 6 | 2.24 | Castalagin isomer | C41H26O26 | 932.4875 | 876.4804 | 0.03 |
| 781.0540 | 0.21 | |||||
| 481.0624 | 2.46 | |||||
| 225.0608 | 33.46 | |||||
| 179.0551 | 100.00 | |||||
| 7 | 4.44 | Punicalagin β | C48H28O30 | 1083.0603 | 913.1799 | 1.15 |
| 781.0536 | 11.15 | |||||
| 481.0624 | 100.00 | |||||
| 253.0921 | 1.50 | |||||
| 179.0551 | 2.46 | |||||
| 8 | 4.48 | Castalagin isomer | C41H26O26 | 933.0618 | 331.0667 | 100.00 |
| 225.0608 | 10.00 | |||||
| 179.0551 | 30.74 | |||||
| 9 | 4.63 | Granatin B isomer | C41H28O27 | 951.0779 | 783.0662 | 0.38 |
| 541.0249 | 100.00 | |||||
| 475.0331 | 0.30 | |||||
| 331.0667 | 38.75 | |||||
| 225.0608 | 13.13 | |||||
| 179.0552 | 41.25 | |||||
| 10 | 4.73 | Granatin B | C41H28O27 | 951.0706 | 633.0741 | 6.07 |
| 541.0249 | 33.57 | |||||
| 475.0331 | 67.14 | |||||
| 331.0667 | 100.00 | |||||
| 225.0608 | 14.29 | |||||
| 181.0706 | 45.00 | |||||
| 11 | 5.05 | Castalagin | C41H26O26 | 933.0612 | 541.0248 | 100.00 |
| 483.0777 | 16.67 | |||||
| 225.0608 | 9.58 | |||||
| 181.0705 | 30.83 | |||||
| 12 | 5.12 | Punicalagin isomer | C48H28O30 | 1083.0603 | 913.1811 | 0.59 |
| 541.0250 | 100.00 | |||||
| 483.0778 | 2.82 | |||||
| 301.0562 | 2.09 | |||||
| 226.0648 | 11.36 | |||||
| 179.0552 | 33.64 | |||||
| 13 | 5.38 | Punigluconin | C34H26O23 | 801.0774 | 611.1405 | 14.36 |
| 463.0523 | 5.27 | |||||
| 305.0664 | 100.00 | |||||
| 225.0608 | 4.91 | |||||
| 181.0705 | 12.91 | |||||
| 14 | 5.65 | Granatin A isomer | C41H28O27 | 783.0663 | 632.0633 | 13.53 |
| 483.0779 | 4.47 | |||||
| 291.0141 | 100.00 | |||||
| 181.0706 | 47.65 | |||||
| 15 | 5.87 | Granatin A | C41H28O27 | 783.0663 | 447.0571 | 29.38 |
| 305.0664 | 100.00 | |||||
| 225.0608 | 13.13 | |||||
| 181.0705 | 50.00 | |||||
| 16 | 6.12 | Ellagic acid | C14H6O8 | 300.9991 | 300.9991 | 100.00 |
| 225.0608 | 8.21 | |||||
| 181.0705 | 39.29 | |||||
| 17 | 6.30 | Galloyl-HHDP-hexoside | C27H22O18 | 633.0739 | 392.5591 | 6.79 |
| 352.0667 | 12.14 | |||||
| 325.0929 | 15.36 | |||||
| 300.9991 | 71.43 | |||||
| 289.0710 | 100.00 | |||||
| 181.0705 | 35.71 | |||||
| 18 | 6.63 | Granatin B isomer | C41H28O27 | 951.0705 | 784.0748 | 0.91 |
| 603.0052 | 7.39 | |||||
| 476.0417 | 2.30 | |||||
| 300.9991 | 100.00 | |||||
| 225.0608 | 10.43 | |||||
| 181.0705 | 52.17 | |||||
| (b) | ||||||
| NO. | RT (min) | Name | Molecular Formula | [M + H]+ | MS Fragment (m/z) | Relative Abundance (%) |
| 1 | 1.62 | Syringetin hexoside | C23H22O13 | 507.1923 | 398.1655 | 4.40 |
| 325.1123 | 100.00 | |||||
| 183.0863 | 42.86 | |||||
| 165.0762 | 21.43 | |||||
| 145.0496 | 29.76 | |||||
| 127.0391 | 35.71 | |||||
| 2 | 4.61 | Hesperidin | C28H34O15 | 611.1398 | 464.1777 | 0.78 |
| 315.0718 | 21.62 | |||||
| 274.0985 | 0.30 | |||||
| 183.0863 | 6.49 | |||||
| 144.1384 | 100.00 | |||||
| 3 | 4.71 | Hesperidin isomer | C28H34O15 | 611.1388 | 436.1611 | 0.27 |
| 315.0715 | 9.03 | |||||
| 248.1131 | 1.42 | |||||
| 183.0863 | 8.71 | |||||
| 124.1123 | 100.00 | |||||
| 4 | 5.03 | Rutin | C27H30O16 | 611.1385 | 611.1385 | 100.00 |
| 448.0601 | 0.11 | |||||
| 305.0652 | 15.12 | |||||
| 172.1333 | 37.21 | |||||
| 127.0392 | 19.77 | |||||
| 5 | 5.39 | Gallocatechol | C15H14O7 | 307.0807 | 307.0807 | 100.00 |
| 183.0863 | 4.51 | |||||
| 139.0389 | 6.62 | |||||
| 6 | 5.56 | Kaempferol-3-O-rutinoside | C27H30O15 | 595.1460 | 471.0188 | 5.62 |
| 367.1505 | 1.75 | |||||
| 186.1492 | 100.00 | |||||
| 126.1279 | 4.69 | |||||
| 7 | 5.82 | Kaempferol-3-O-rutinosde | C27H30O15 | 595.1459 | 467.0822 | 1.85 |
| 315.0715 | 1.58 | |||||
| 265.1440 | 1.42 | |||||
| 200.0470 | 100.00 | |||||
| 8 | 5.86 | Gallocatechol | C15H14O7 | 307.0807 | 307.0807 | 100.00 |
| 183.0863 | 8.95 | |||||
| 127.0392 | 12.63 | |||||
| 9 | 7.41 | Quercetin | C15H10O7 | 303.0135 | 303.0135 | 100.00 |
| 183.0864 | 43.42 | |||||
| 127.0391 | 19.74 | |||||
| 10 | 7.87 | Kaempferol-7-O-glucosie | C21H20O11 | 449.1079 | 449.1079 | 100.00 |
| 371.2064 | 8.05 | |||||
| 287.0555 | 21.95 | |||||
| 183.0864 | 52.44 | |||||
| 11 | 12.88 | Kaempferol-3-O-rutinoside | C27H30O15 | 595.1459 | 468.4403 | 5.46 |
| 391.2841 | 0.37 | |||||
| 296.2247 | 100.00 | |||||
| 183.0864 | 27.69 | |||||
| Active Ingredients | Extracts | |||
|---|---|---|---|---|
| Water | 30% Ethanol | 50% Ethanol | 80% Ethanol | |
| Yield (mg/g) | 425.40 ± 26.01 a | 299.50 ± 22.11 b | 346.50 ± 19.17 b | 466.60 ± 26.04 a |
| TP (mg GAE/g) | 333.90 ± 29.59 | 340.60 ± 19.18 | 353.29 ± 26.91 | 335.63 ± 24.10 |
| TF (mg RUE/g) | 155.95 ± 14.18 a | 146.45 ± 17.69 a | 156.29 ± 15.70 a | 125.33 ± 16.61 b |
| TT (mg tannin/g) | 245.04 ± 16.50 b | 345.99 ± 17.18 a | 362.22 ± 19.71 a | 329.04 ± 20.18 a |
| Ellagic acid (mg/g) | 6.77 ± 0.69 a | 4.35 ± 1.50 b | 5.51 ± 0.61 b | 7.55 ± 0.48 a |
| Punicalagin (mg/g) | 112.74 ± 9.15 c | 123.92 ± 10.80 b | 165.85 ± 9.95 a | 132.00 ± 12.90 b |
| Inhibitory Activity or FRAP | Correlation Coefficient | ||||
|---|---|---|---|---|---|
| TF | TP | TT | Ellagic Acid | Punicalagin | |
| S. aureus | 0.786 | 0.995 | −0.735 | 0.787 | |
| Resistant S. aureus | −0.711 | 0.786 | |||
| FRAP | 0.626 | 0.776 | 0.569 | −0.938 | |
| Lipid peroxidation | 0.724 | −0.849 | |||
| IL-6 | 0.573 | −0.910 | |||
| PGE2 | −0.696 | ||||
| NO | −0.981 | −0.804 | 0.680 | −0.554 | |
| Antioxidant Activity | Anti-Inflammation | ||
|---|---|---|---|
| IL-6 | PGE2 | NO | |
| FRAP | 0.740 | 0.659 | −0.891 |
| Anti-lipid peroxidation | 0.762 | 0.886 | −0.809 |
Publisher’s Note: MDPI stays neutral with regard to jurisdictional claims in published maps and institutional affiliations. |
© 2022 by the authors. Licensee MDPI, Basel, Switzerland. This article is an open access article distributed under the terms and conditions of the Creative Commons Attribution (CC BY) license (https://creativecommons.org/licenses/by/4.0/).
Share and Cite
Feng, Y.; Lin, J.; He, G.; Liang, L.; Liu, Q.; Yan, J.; Yao, Q. Compositions and Biological Activities of Pomegranate Peel Polyphenols Extracted by Different Solvents. Molecules 2022, 27, 4796. https://doi.org/10.3390/molecules27154796
Feng Y, Lin J, He G, Liang L, Liu Q, Yan J, Yao Q. Compositions and Biological Activities of Pomegranate Peel Polyphenols Extracted by Different Solvents. Molecules. 2022; 27(15):4796. https://doi.org/10.3390/molecules27154796
Chicago/Turabian StyleFeng, Yanlin, Jiali Lin, Gang He, Li Liang, Qijun Liu, Jun Yan, and Qian Yao. 2022. "Compositions and Biological Activities of Pomegranate Peel Polyphenols Extracted by Different Solvents" Molecules 27, no. 15: 4796. https://doi.org/10.3390/molecules27154796
APA StyleFeng, Y., Lin, J., He, G., Liang, L., Liu, Q., Yan, J., & Yao, Q. (2022). Compositions and Biological Activities of Pomegranate Peel Polyphenols Extracted by Different Solvents. Molecules, 27(15), 4796. https://doi.org/10.3390/molecules27154796