
Development of Certified Reference Materials for the Determination of Apparent Amylose Content in Rice

Abstract
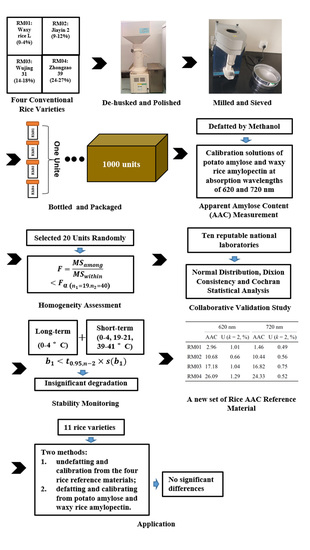
:
1. Introduction
2. Materials and Methods
2.1. Rice Samples
2.2. Chemicals
2.3. Determination of Moisture Content
2.4. Determination of Rice AAC
2.5. Homogeneity Examination
2.6. Stability Monitoring
2.7. Collaborative Validation Study
2.8. Calculation of Expanded Uncertainty
2.9. Statistical Analysis
3. Results and Discussion
3.1. Homogeneity Examination
3.2. Stability Monitoring
3.3. Collaborative Validation and the Expand Uncertainty Assessment
3.4. Application
4. Conclusions
Supplementary Materials
Author Contributions
Funding
Institutional Review Board Statement
Informed Consent Statement
Data Availability Statement
Acknowledgments
Conflicts of Interest
Sample Availability
References
- Hanashiro, I.; Takeda, Y. Examination of number-average degree of polymerization and molar-based distribution of amylose by fluorescent labeling with 2-aminopyridine. Carbohydr. Res. 1998, 306, 421–426. [Google Scholar] [CrossRef]
- Tian, Y.; Li, Y.; Xu, X.; Jin, Z.; Jiao, A.; Wang, J.; Yu, B. A novel size-exclusion high performance liquid chromatography (SE-HPLC) method for measuring degree of amylose retrogradation in rice starch. Food Chem. 2010, 118, 445–448. [Google Scholar] [CrossRef]
- Gayin, J.; Abdel-Aal, E.-S.M.; Manful, J.; Bertoft, E.; Marcone, M.; Ragaee, S. Physical, cooking and thermal properties of African rice (Oryza glaberrima) and its starch digestibility in vitro. LWT 2017, 75, 481–487. [Google Scholar] [CrossRef]
- Liu, Q.; Tao, Y.; Cheng, S.; Zhou, L.; Tian, J.; Xing, Z.; Liu, G.; Wei, H.; Zhang, H. Relating amylose and protein contents to eating quality in 105 varieties of Japonica rice. Cereal Chem. 2020, 97, 1303–1312. [Google Scholar] [CrossRef]
- Li, H.Y.; Wen, Y.Y.; Wang, J.; Sun, B.G. The molecular structures of leached starch during rice cooking are controlled by ther-modynamic effects, rather than kinetic effects. Food Hydrocoll. 2017, 73, 295–299. [Google Scholar] [CrossRef]
- Popov, D.; Buléon, A.; Burghammer, M.; Chanzy, H.; Montesanti, N.; Putaux, J.-L.; Potocki-Véronèse, G.; Riekel, C. Crystal Structure of A-amylose: A Revisit from Synchrotron Microdiffraction Analysis of Single Crystals. Macromolecules 2009, 42, 1167–1174. [Google Scholar] [CrossRef] [Green Version]
- Rodriguez-Garcia, M.E.; Hernandez-Landaverde, M.A.; Delgado, J.M.; Ramirez-Gutierrez, C.F.; Ramirez-Cardona, M.; Millan-Malo, B.M.; Londoño-Restrepo, S.M. Crystalline structures of the main components of starch. Curr. Opin. Food Sci. 2020, 37, 107–111. [Google Scholar] [CrossRef]
- Jane, J.; Chen, Y.Y.; Lee, L.F.; McPherson, A.E.; Wong, K.S.; Radosavljevic, M.; Kasemsuwan, T. Effects of Amylopectin Branch Chain Length and Amylose Content on the Gelatinization and Pasting Properties of Starch. Cereal Chem. 1999, 76, 629–637. [Google Scholar] [CrossRef]
- Bao, J.; Shen, S.; Sun, M.; Corke, H. Analysis of Genotypic Diversity in the Starch Physicochemical Properties of Nonwaxy Rice: Apparent Amylose Content, Pasting Viscosity and Gel Texture. Starch 2006, 58, 259–267. [Google Scholar] [CrossRef]
- Chen, M.H.; Bergman, C.J.; McClung, A.M.; Everette, J.D.; Tabien, R.E. Resistant starch: Variation among high amylose rice varieties and its relationship with apparent amylose content, pasting properties and cooking methods. Food Chem. 2017, 234, 180–189. [Google Scholar] [CrossRef]
- Trinidad, T.P.; Mallillin, A.C.; Encabo, R.R.; Sagum, R.S.; Felix, A.D.R.; Juliano, B.O. The effect of apparent amylose content and dietary fiber on the glycemic response of different varieties of cooked milled and brown rice. Int. J. Food Sci. Nutr. 2013, 64, 89–93. [Google Scholar] [CrossRef] [PubMed]
- Chinnaswamy, R.; Bhattacharya, K. Relationship between amylose content and expansion characteristics of parboiled rice. J. Cereal Sci. 1984, 2, 273–279. [Google Scholar] [CrossRef]
- Okamoto, K. Preparation and certification of rice flour-unpolished reference material. Sci. Total Environ. 1991, 107, 29–44. [Google Scholar] [CrossRef]
- Otake, T.; Itoh, N.; Aoyagi, Y.; Matsuo, M.; Hanari, N.; Otsuka, S.; Yarita, T. Development of Certified Reference Material for Quantification of Two Pesticides in Brown Rice. J. Agric. Food Chem. 2009, 57, 8208–8212. [Google Scholar] [CrossRef]
- Li, J.; Zhang, L.; Li, L.; Li, X.; Zhang, X.; Zhai, S.; Gao, H.; Li, Y.; Wu, G.; Wu, Y. Development of Genomic DNA Certified Reference Materials for Genetically Modified Rice Kefeng 6. ACS Omega 2020, 5, 21602–21609. [Google Scholar] [CrossRef]
- Bao, J.; Wang, Y.; Shen, Y. Determination of apparent amylose content, pasting properties and gel texture of rice starch by near-infrared spectroscopy. J. Sci. Food Agric. 2007, 87, 2040–2048. [Google Scholar] [CrossRef]
- Sampaio, P.S.; Soares, A.; Castanho, A.; Almeida, A.S.; Oliveira, J.; Brites, C. Optimization of rice amylose determination by NIR-spectroscopy using PLS chemometrics algorithms. Food Chem. 2018, 242, 196–204. [Google Scholar] [CrossRef]
- Sampaio, P.S.; Castanho, A.; Almeida, A.S.; Oliveira, J.; Brites, C. Identification of rice flour types with near-infrared spectroscopy associated with PLS-DA and SVM methods. Eur. Food Res. Technol. 2020, 246, 527–537. [Google Scholar] [CrossRef]
- Duan, D.X.; Donner, E.; Liu, Q.; Smith, D.C.; Ravenelle, F. Potentiometric titration for determination of amylose content of starch—A comparison with colorimetric method. Food Chem. 2012, 130, 1142–1145. [Google Scholar] [CrossRef]
- Chen, M.-H.; Bergman, C.J. Method for determining the amylose content, molecular weights, and weight- and molar-based distributions of degree of polymerization of amylose and fine-structure of amylopectin. Carbohydr. Polym. 2007, 69, 562–578. [Google Scholar] [CrossRef]
- Sakač, N.; Sak-Bosnar, M.; Horvat, M. Direct potentiometric determination of starch using a platinum redox sensor. Food Chem. 2013, 138, 9–12. [Google Scholar] [CrossRef] [PubMed]
- Stawski, D. New determination method of amylose content in potato starch. Food Chem. 2008, 110, 777–781. [Google Scholar] [CrossRef]
- Moorthy, S.N.; Andersson, L.; Eliasson, A.-C.; Santacruz, S.; Ruales, J. Determination of Amylose Content in Different Starches Using Modulated Differential Scanning Calorimetry. Starch/Stärke 2006, 58, 209–214. [Google Scholar] [CrossRef]
- I.S.O. 6647-1; Rice—Determination of Amylose Content—Part 1: Spectrophotometric Method with a Defatting Procedure by Methanol and with Calibration Solutions of Potato Amylose and Waxy Rice Amylopectin. International Organization for Standardization: Geneva, Switzerland, 2020.
- I.S.O. 6647-2; Rice—Determination of Amylose Content—Part 2: Spectrophotometric Routine Method without Defatting Procedure and with Calibration from Rice Standards. International Organization for Standardization: Geneva, Switzerland, 2020.
- Valcárcel, M.; Cárdenas, S.; Gallego, M. Continuous flow systems for rapid sample screening. TrAC Trends Anal. Chem. 2002, 21, 251–258. [Google Scholar] [CrossRef]
- I.S.O. Guide 35; Reference Materials—Guidance for Characterization and Assessment of Homogeneity and Stability. International Organization for Standardization: Geneva, Switzerland, 2017.
- van der Veen, A.M.H.; Pauwels, J. Uncertainty Calculations in the Certification of Reference Materials. 1. Principles of Analysis of Variance. In Measurement Uncertainty in Chemical Analysis; Springer: Berlin/Heidelberg, Germany, 2000; pp. 88–93. [Google Scholar]
- Gelman, A.; Carlin, J.B.; Stern, H.S.; Dunson, D.B.; Vehtari, A.; Rubin, B.D. Bayesian Data Analysis, 3rd ed.; Chapman and Hall/CRC: Boca Raton, FL, USA, 2013. [Google Scholar]
- Van Der Veen, A.; Linsinger, T.P.; Pauwels, J. Uncertainty calculations in the certification of reference materials. 2. Homogeneity study. Accredit. Qual. Assur. 2001, 6, 26–30. [Google Scholar] [CrossRef]
- Josephs, R.D.; Ulberth, F.; Van Egmond, H.P.; Emons, H. Aflatoxin M1in milk powders: Processing, homogeneity and stability testing of certified reference materials. Food Addit. Contam. 2005, 22, 864–874. [Google Scholar] [CrossRef]
- Linsinger, T.P.J.; Pauwels, J.; Van Der Veen, A.M.H.; Schimmel, H.; Lamberty, A. Homogeneity and stability of reference materials. Accredit. Qual. Assur. 2001, 6, 20–25. [Google Scholar] [CrossRef]
- Zhao, S.; Zhao, Y.; Rogers, K.M.; Chen, A.; Zhang, T.; Yang, S. Two new defatted beef reference materials, CAAS-1801 and CAAS-1802, for carbon and nitrogen stable isotope ratio measurements. Rapid Commun. Mass Spectrom. 2019, 33, 803–810. [Google Scholar] [CrossRef]
- Toman, B. Bayesian Approaches to Calculating a Reference Value in Key Comparison Experiments. Technometrics 2007, 49, 81–87. [Google Scholar] [CrossRef]
- Linsinger, T.P.J.; Pauwels, J.; Lamberty, A.; Schimmel, H.; Van Der Veen, A.M.H.; Siekmann, L. Estimating the uncertainty of stability for matrix CRMs. Anal. Bioanal. Chem. 2001, 370, 183–188. [Google Scholar] [CrossRef]
- Tan, Y.; Corke, H. Factor analysis of physicochemical properties of 63 rice varieties. J. Sci. Food Agric. 2002, 82, 745–752. [Google Scholar] [CrossRef]
- Feng, F.; Li, Y.; Qin, X.; Liao, Y.; Siddique, K. Changes in Rice Grain Quality of Indica and Japonica Type Varieties Released in China from 2000 to 2014. Front. Plant Sci. 2017, 8, 1863. [Google Scholar] [CrossRef] [PubMed] [Green Version]
- Hu, Y.; Xue, J.; Li, L.; Cong, S.; Yu, E.; Xu, K.; Zhang, H. Influence of dynamic high temperature during grain filling on starch fine structure and functional properties of semi-waxy japonica rice. J. Cereal Sci. 2021, 101, 103319. [Google Scholar] [CrossRef]
- Ahmed, N.; Tetlow, I.J.; Nawaz, S.; Iqbal, A.; Mubin, M.; Nawaz ul Rehman, M.S.; Butt, A.; Lightfoot, D.A.; Maekawa, M. Effect of high temperature on grain filling period, yield, amylose content and activity of starch biosynthesis enzymes in endosperm of basmati rice. J. Sci. Food Agric. 2015, 95, 2237–2243. [Google Scholar] [CrossRef]
- Shimoyanagi, R.; Abo, M.; Shiotsu, F. Higher Temperatures during Grain Filling Affect Grain Chalkiness and Rice Nutrient Contents. Agronomy 2021, 11, 1360. [Google Scholar] [CrossRef]
- Zhang, H.; Chen, J.; Shan, S.; Cao, F.; Chen, G.; Zou, Y.; Huang, M.; Abou-Elwafa, S.F. Proteomic profiling reveals differentially expressed proteins associated with amylose accumulation during rice grain filling. BMC Genom. 2020, 21, 1–11. [Google Scholar] [CrossRef]

| 620 nm | 720 nm | |||||||
|---|---|---|---|---|---|---|---|---|
| RM01 | RM02 | RM03 | RM04 | RM01 | RM02 | RM03 | RM04 | |
| AVG | 2.98 | 10.54 | 16.9 | 26 | 1.47 | 10.42 | 16.6 | 24.05 |
| dfamong | 19 | 19 | 19 | 19 | 19 | 19 | 19 | 19 |
| dfwithin | 40 | 40 | 40 | 40 | 40 | 40 | 40 | 40 |
| MSamong | 0.008 | 0.045 | 0.049 | 0.045 | 0.008 | 0.046 | 0.036 | 0.039 |
| MSwithin | 0.005 | 0.026 | 0.028 | 0.027 | 0.006 | 0.033 | 0.024 | 0.027 |
| ubb | 0.032 | 0.079 | 0.085 | 0.078 | 0.026 | 0.065 | 0.064 | 0.061 |
| SD | 0.05 | 0.12 | 0.13 | 0.12 | 0.05 | 0.13 | 0.11 | 0.11 |
| F | 1.62 | 1.73 | 1.78 | 1.66 | 1.38 | 1.38 | 1.51 | 1.42 |
| Fα | 1.85 | 1.85 | 1.85 | 1.85 | 1.85 | 1.85 | 1.85 | 1.85 |
| Time (Months) | 620 nm | 720 nm | ||||||
|---|---|---|---|---|---|---|---|---|
| RM01 | RM02 | RM03 | RM04 | RM01 | RM02 | RM03 | RM04 | |
| 0 | 3.33 ± 0.09 | 10.74 ± 0.08 | 16.75 ± 0.13 | 26.12 ± 0.18 | 1.42 ± 0.06 | 10.51 ± 0.08 | 16.54 ± 0.15 | 24.12 ± 0.19 |
| 3 | 2.90 ± 0.07 | 10.74 ± 0.13 | 17.02 ± 0.12 | 26.05 ± 0.12 | 1.52 ± 0.05 | 10.68 ± 0.15 | 16.81 ± 0.11 | 24.06 ± 0.15 |
| 6 | 2.68 ± 0.02 | 10.39 ± 0.13 | 17.26 ± 0.09 | 25.58 ± 0.09 | 1.49 ± 0.02 | 10.30 ± 0.04 | 16.87 ± 0.09 | 24.10 ± 0.04 |
| 9 | 3.02 ± 0.06 | 10.56 ± 0.09 | 16.75 ± 0.12 | 26.38 ± 0.21 | 1.44 ± 0.05 | 10.29 ± 0.04 | 16.69 ± 0.05 | 24.04 ± 0.20 |
| 12 | 3.17 ± 0.04 | 10.59 ± 0.10 | 16.84 ± 0.18 | 26.14 ± 0.05 | 1.47 ± 0.04 | 10.41 ± 0.11 | 16.87 ± 0.14 | 24.11 ± 0.06 |
| 18 | 2.92 ± 0.03 | 10.73 ± 0.14 | 16.82 ± 0.07 | 26.18 ± 0.16 | 1.44 ± 0.03 | 10.29 ± 0.07 | 16.51 ± 0.09 | 24.09 ± 0.17 |
| 3 | 10.62 | 16.91 | 26.07 | 1.46 | 10.41 | 16.71 | 24.09 | |
| 8 | 8 | 8 | 8 | 8 | 8 | 8 | 8 | |
| b1 | −0.008 | −0.001 | −0.006 | 0.011 | −0.001 | −0.015 | −0.004 | −0.001 |
| b0 | 3.062 | 10.631 | 16.958 | 25.984 | 1.472 | 10.537 | 16.747 | 24.09 |
| S | 0.249 | 0.158 | 0.216 | 0.287 | 0.043 | 0.134 | 0.177 | 0.032 |
| s(b1) | 0.017 | 0.011 | 0.015 | 0.02 | 0.003 | 0.009 | 0.012 | 0.002 |
| ults | 0.309 | 0.196 | 0.268 | 0.356 | 0.053 | 0.166 | 0.22 | 0.04 |
| Time (Days) | 620 nm | 720 nm | ||||||
|---|---|---|---|---|---|---|---|---|
| RM01 | RM02 | RM03 | RM04 | RM01 | RM02 | RM03 | RM04 | |
| 0–4 °C | ||||||||
| 0 | 2.95 ± 0.06 | 10.96 ± 0.19 | 17.26 ± 0.19 | 26.50 ± 0.15 | 1.42 ± 0.04 | 10.26 ± 0.15 | 16.53 ± 0.05 | 23.97 ± 0.14 |
| 3 | 3.30 ± 0.08 | 10.74 ± 0.21 | 17.37 ± 0.23 | 25.73 ± 0.2 | 1.59 ± 0.03 | 10.24 ± 0.15 | 16.59 ± 0.22 | 24.10 ± 0.22 |
| 7 | 3.35 ± 0.11 | 10.77 ± 0.13 | 17.44 ± 0.15 | 26.12 ± 0.05 | 1.57 ± 0.05 | 10.24 ± 0.07 | 16.62 ± 0.12 | 24.10 ± 0.06 |
| 14 | 2.86 ± 0.09 | 10.69 ± 0.08 | 16.98 ± 0.08 | 26.05 ± 0.16 | 1.55 ± 0.07 | 10.14 ± 0.06 | 16.79 ± 0.15 | 24.01 ± 0.11 |
| 3.11 | 10.79 | 17.26 | 26.1 | 1.53 | 10.22 | 16.63 | 24.05 | |
| 6 | 6 | 6 | 6 | 6 | 6 | 6 | 6 | |
| b1 | −0.013 | −0.016 | −0.022 | −0.015 | 0.006 | −0.008 | 0.006 | 0.001 |
| b0 | 3.189 | 10.887 | 17.392 | 26.195 | 1.496 | 10.271 | 16.556 | 24.041 |
| S | 0.29 | 0.087 | 0.186 | 0.37 | 0.084 | 0.022 | 0.03 | 0.079 |
| s(b1) | 0.028 | 0.008 | 0.018 | 0.035 | 0.008 | 0.002 | 0.003 | 0.008 |
| usts | 0.387 | 0.117 | 0.248 | 0.493 | 0.112 | 0.029 | 0.041 | 0.105 |
| 19–21 °C | ||||||||
| 0 | 2.88 ± 0.01 | 10.79 ± 0.21 | 17.61 ± 0.18 | 26.21 ± 0.20 | 1.38 ± 0.02 | 10.25 ± 0.08 | 16.49 ± 0.03 | 24.06 ± 0.01 |
| 3 | 3.09 ± 0.06 | 10.77 ± 0.16 | 17.00 ± 0.25 | 25.80 ± 0.15 | 1.34 ± 0.00 | 10.22 ± 0.15 | 16.43 ± 0.15 | 23.89 ± 0.15 |
| 7 | 3.38 ± 0.05 | 10.75 ± 0.05 | 17.44 ± 0.12 | 26.12 ± 0.21 | 1.52 ± 0.03 | 10.18 ± 0.06 | 16.50 ± 0.02 | 23.86 ± 0.09 |
| 14 | 2.93 ± 0.05 | 10.94 ± 0.11 | 17.05 ± 0.10 | 25.91 ± 0.12 | 1.51 ± 0.03 | 10.63 ± 0.11 | 16.51 ± 0.09 | 24.05 ± 0.14 |
| 3.07 | 10.81 | 17.27 | 26.01 | 1.44 | 10.32 | 16.48 | 23.96 | |
| 6 | 6 | 6 | 6 | 6 | 6 | 6 | 6 | |
| b1 | 0.002 | 0.011 | −0.025 | −0.011 | 0.012 | 0.028 | 0.003 | 0.002 |
| b0 | 3.053 | 10.745 | 17.425 | 26.08 | 1.367 | 10.153 | 16.464 | 23.951 |
| S | 0.277 | 0.069 | 0.311 | 0.214 | 0.069 | 0.152 | 0.035 | 0.126 |
| s(b1) | 0.026 | 0.007 | 0.03 | 0.02 | 0.007 | 0.014 | 0.003 | 0.012 |
| usts | 0.37 | 0.093 | 0.415 | 0.285 | 0.092 | 0.203 | 0.046 | 0.168 |
| 39–41 °C | ||||||||
| 0 | 2.85 ± 0.02 | 10.82 ± 0.17 | 17.63 ± 0.19 | 26.33 ± 0.25 | 1.71 ± 0.01 | 10.47 ± 0.15 | 16.54 ± 0.15 | 24.34 ± 0.19 |
| 3 | 3.00 ± 0.05 | 10.74 ± 0.12 | 17.18 ± 0.14 | 26.01 ± 0.16 | 1.55 ± 0.03 | 10.65 ± 0.09 | 16.87 ± 0.11 | 24.42 ± 0.14 |
| 7 | 3.38 ± 0.04 | 10.68 ± 0.06 | 17.60 ± 0.09 | 26.52 ± 0.10 | 1.39 ± 0.05 | 10.27 ± 0.05 | 16.50 ± 0.09 | 24.01 ± 0.06 |
| 14 | 3.00 ± 0.01 | 11.11 ± 0.15 | 17.66 ± 0.21 | 26.47 ± 0.11 | 1.66 ± 0.00 | 10.19 ± 0.12 | 16.51 ± 0.20 | 24.00 ± 0.09 |
| 3.06 | 10.84 | 17.52 | 26.33 | 1.58 | 10.39 | 16.61 | 24.19 | |
| 6 | 6 | 6 | 6 | 6 | 6 | 6 | 6 | |
| b1 | 0.011 | 0.022 | 0.014 | 0.021 | −0.002 | −0.026 | −0.011 | −0.03 |
| b0 | 2.987 | 10.705 | 17.434 | 26.21 | 1.587 | 10.552 | 16.674 | 24.372 |
| S | 0.264 | 0.165 | 0.256 | 0.238 | 1.26 | 3.248 | 4.083 | 4.937 |
| s(b1) | 0.025 | 0.016 | 0.024 | 0.023 | 0.017 | 0.015 | 0.019 | 0.014 |
| usts | 0.352 | 0.22 | 0.341 | 0.317 | 0.232 | 0.206 | 0.27 | 0.202 |
| 620 nm | 720 nm | |||||||
|---|---|---|---|---|---|---|---|---|
| RM01 | RM02 | RM03 | RM04 | RM01 | RM02 | RM03 | RM04 | |
| L01 | 3.02 ± 0.22 | 10.56 ± 0.07 | 16.91 ± 0.28 | 26.38 ± 0.07 | 1.37 ± 0.12 | 10.18 ± 0.12 | 16.69 ± 0.08 | 23.83 ± 0.09 |
| L02 | 3.25 ± 0.04 | 10.77 ± 0.06 | 17.27 ± 0.06 | 26.17 ± 0.06 | 1.68 ± 0.05 | 10.53 ± 0.06 | 16.73 ± 0.06 | 23.93 ± 0.06 |
| L03 | 3.36 ± 0.04 | 10.88 ± 0.10 | 17.48 ± 0.11 | 26.55 ± 0.14 | 1.49 ± 0.05 | 10.69 ± 0.09 | 17.20 ± 0.12 | 24.63 ± 0.12 |
| L04 | 2.89 ± 0.03 | 10.63 ± 0.17 | 16.59 ± 0.17 | 25.07 ± 0.10 | 1.62 ± 0.03 | 10.18 ± 0.14 | 16.37 ± 0.29 | 23.90 ± 0.14 |
| L05 | 2.56 ± 0.06 | 10.32 ± 0.02 | 16.51 ± 0.11 | 25.21 ± 0.15 | 1.38 ± 0.12 | 10.35 ± 0.15 | 16.66 ± 0.08 | 23.94 ± 0.06 |
| L06 | 3.37 ± 0.07 | 10.15 ± 0.08 | 16.88 ± 0.05 | 25.99 ± 0.08 | 1.57 ±0.02 | 10.23 ± 0.12 | 16.89 ± 0.10 | 23.96 ± 0.06 |
| L07 | 2.65 ± 0.04 | 11.53 ± 0.04 | 17.61 ± 0.04 | 25.73 ± 0.04 | 1.53 ± 0.05 | 10.64 ± 0.05 | 16.28 ± 0.05 | 24.78 ± 0.00 |
| L08 | 2.46 ± 0.41 | 10.26 ± 0.27 | 17.31 ± 0.11 | 26.03 ± 0.33 | 1.10 ± 0.05 | 10.26 ± 0.09 | 17.01 ± 0.08 | 24.51 ± 0.08 |
| L09 | 3.19 ± 0.04 | 10.82 ± 0.04 | 17.32 ± 0.05 | 26.99 ± 0.08 | 1.72 ± 0.05 | 10.63 ± 0.09 | 16.70 ± 0.05 | 24.86 ± 0.08 |
| L10 | 2.87 ± 0.21 | 10.84 ± 0.08 | 17.94 ± 0.05 | 26.77 ± 0.21 | 1.20 ± 0.06 | 10.68 ± 0.05 | 17.67 ± 0.09 | 24.96 ± 0.05 |
| AVG | 2.96 | 10.68 | 17.18 | 26.09 | 1.46 | 10.44 | 16.82 | 24.33 |
| SD | 0.33 | 0.399 | 0.454 | 0.627 | 0.203 | 0.216 | 0.406 | 0.457 |
| CV | 0.111 | 0.037 | 0.026 | 0.024 | 0.138 | 0.021 | 0.024 | 0.019 |
| uchar | 0.104 | 0.126 | 0.144 | 0.198 | 0.064 | 0.068 | 0.128 | 0.145 |
| 620 nm | 720 nm | |||
|---|---|---|---|---|
| AAC | U (k = 2, %) | AAC | U (k = 2, %) | |
| RM01 | 2.96 | 1.01 | 1.46 | 0.49 |
| RM02 | 10.68 | 0.66 | 10.44 | 0.56 |
| RM03 | 17.18 | 1.04 | 16.82 | 0.75 |
| RM04 | 26.09 | 1.29 | 24.33 | 0.52 |
| 620 nm | 720 nm | |||||||
|---|---|---|---|---|---|---|---|---|
| AS | RM | AD | r | AS | RM | AD | r | |
| SC | y = 0.0145x + 0.0824 | y = 0.0106x + 0.0695 | - | - | y = 0.0132x + 0.0244 | y = 0.0072x + 0.0173 | - | - |
| R | 1 | 0.999 | - | - | 1 | 0.998 | - | - |
| S01 | 1.84 ± 0.00 A | 1.63 ± 0.10 A | 0.21 | 0.77 | 1.21 ± 0.00 B | 0.99 ± 0.16 B | 0.22 | 0.74 |
| S02 | 2.74 ± 0.20 A | 2.63 ± 0.15 A | 0.11 | 0.82 | 1.90 ± 0.39 B | 1.56 ± 0.11 B | 0.34 | 0.77 |
| S03 | 7.97 ± 0.13 AB | 8.39 ± 0.29 A | 0.41 | 1.11 | 6.83 ± 0.10 C | 7.55 ± 0.21 B | 0.71 | 1.06 |
| S04 | 9.34 ± 0.33 A | 9.25 ± 0.15 A | 0.09 | 1.17 | 8.08 ± 0.29 B | 8.04 ± 0.05 B | 0.05 | 1.1 |
| S05 | 10.47 ± 0.20 A | 10.87 ± 0.00 A | 0.4 | 1.24 | 9.13 ± 0.20 C | 10.05 ± 0.11 B | 0.92 | 1.18 |
| S06 | 14.01 ± 0.27 A | 14.18 ± 0.00 A | 0.17 | 1.42 | 13.71 ± 0.39 A | 14.06 ± 0.00 A | 0.35 | 1.41 |
| S07 | 15.47 ± 0.07 B | 15.90 ± 0.10 A | 0.43 | 1.5 | 14.68 ± 0.00 C | 15.54 ± 0.16 B | 0.86 | 1.47 |
| S08 | 16.51 ± 0.20 A | 16.21 ± 0.24 A | 0.3 | 1.54 | 15.72 ± 0.69 A | 15.46 ± 0.27 A | 0.26 | 1.5 |
| S09 | 17.64 ± 0.33 A | 17.25 ± 0.05 AB | 0.39 | 1.59 | 16.49 ± 0.59 B | 16.33 ± 0.11 B | 0.15 | 1.54 |
| S10 | 19.25 ± 0.07 A | 19.66 ± 0.15 A | 0.42 | 1.7 | 17.74 ± 0.20 C | 18.57 ± 0.16 B | 0.83 | 1.63 |
| S11 | 25.00 ± 0.07 A | 24.11 ± 0.20 C | 0.89 | 1.96 | 24.47 ± 0.10 B | 22.77 ± 0.11 D | 1.7 | 1.91 |
Publisher’s Note: MDPI stays neutral with regard to jurisdictional claims in published maps and institutional affiliations. |
© 2022 by the authors. Licensee MDPI, Basel, Switzerland. This article is an open access article distributed under the terms and conditions of the Creative Commons Attribution (CC BY) license (https://creativecommons.org/licenses/by/4.0/).
Share and Cite
Shao, Y.; Zhu, D.; Yu, J.; Fang, C.; Mou, R.; Hu, X.; Zhu, Z.; Chen, M. Development of Certified Reference Materials for the Determination of Apparent Amylose Content in Rice. Molecules 2022, 27, 4647. https://doi.org/10.3390/molecules27144647
Shao Y, Zhu D, Yu J, Fang C, Mou R, Hu X, Zhu Z, Chen M. Development of Certified Reference Materials for the Determination of Apparent Amylose Content in Rice. Molecules. 2022; 27(14):4647. https://doi.org/10.3390/molecules27144647
Chicago/Turabian StyleShao, Yafang, Dawei Zhu, Jing Yu, Changyun Fang, Renxiang Mou, Xianqiao Hu, Zhiwei Zhu, and Mingxue Chen. 2022. "Development of Certified Reference Materials for the Determination of Apparent Amylose Content in Rice" Molecules 27, no. 14: 4647. https://doi.org/10.3390/molecules27144647
APA StyleShao, Y., Zhu, D., Yu, J., Fang, C., Mou, R., Hu, X., Zhu, Z., & Chen, M. (2022). Development of Certified Reference Materials for the Determination of Apparent Amylose Content in Rice. Molecules, 27(14), 4647. https://doi.org/10.3390/molecules27144647