
Effect of Wax Composition and Shear Force on Wax Aggregation Behavior in Crude Oil: A Molecular Dynamics Simulation Study


Abstract
:1. Introduction
2. Models and Simulation
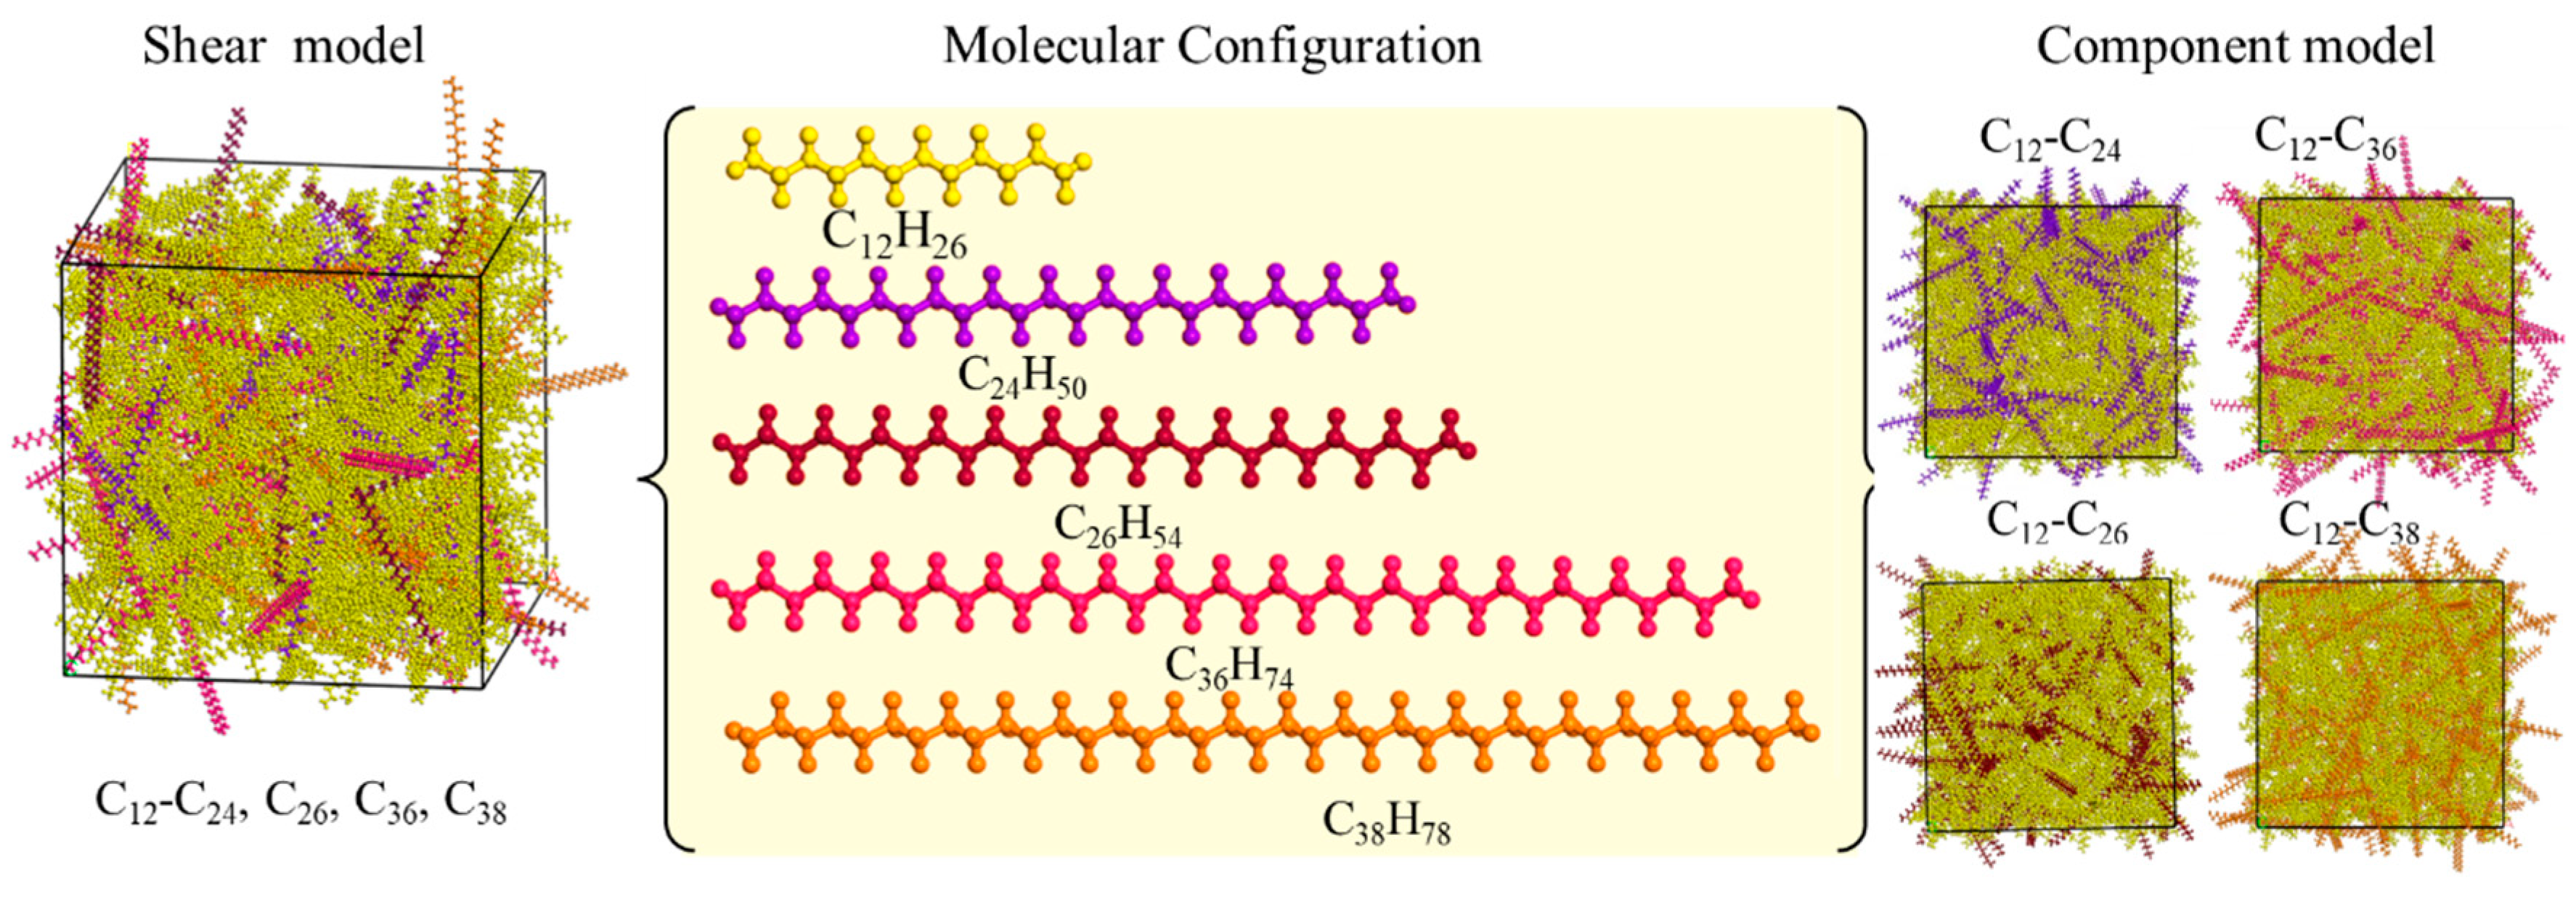
2.1. Models
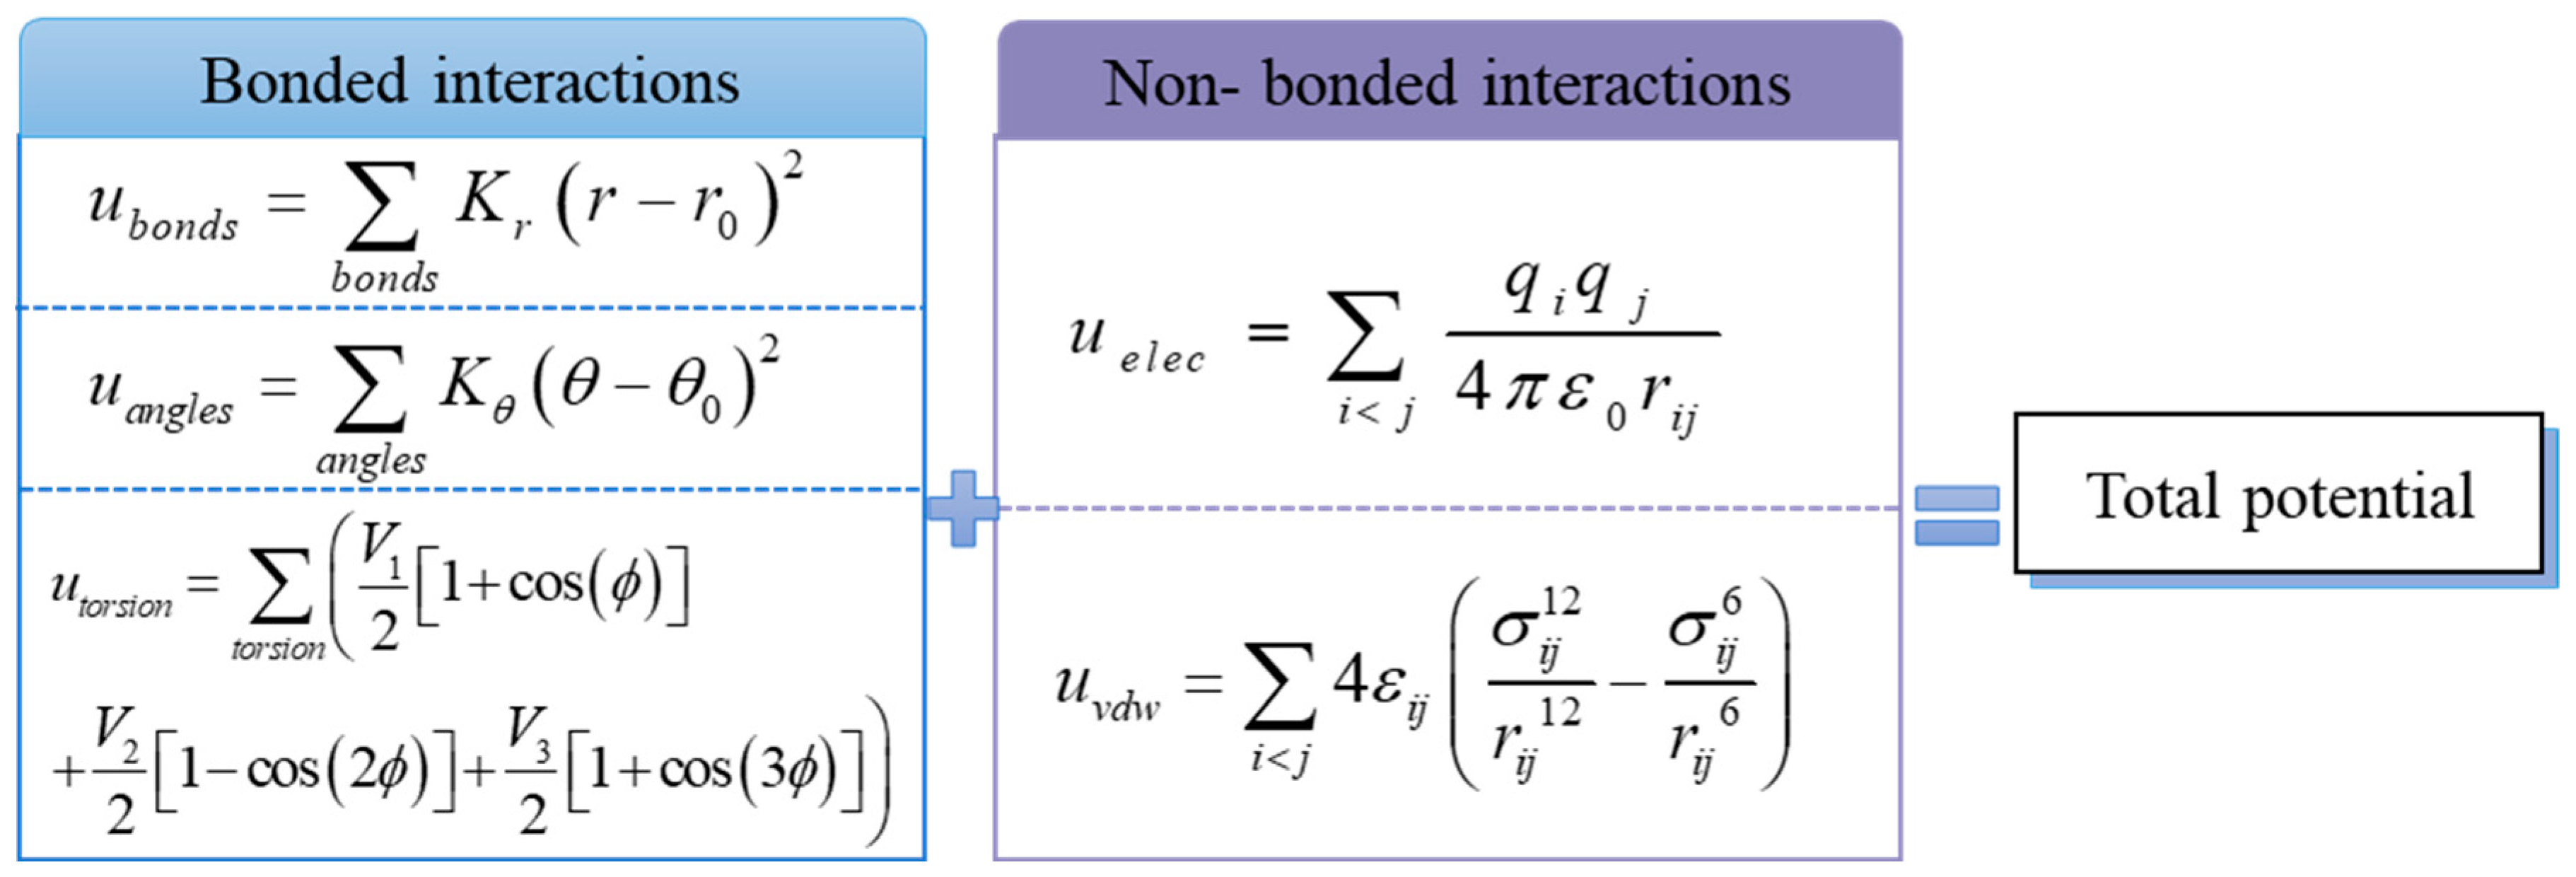
2.2. Force Field
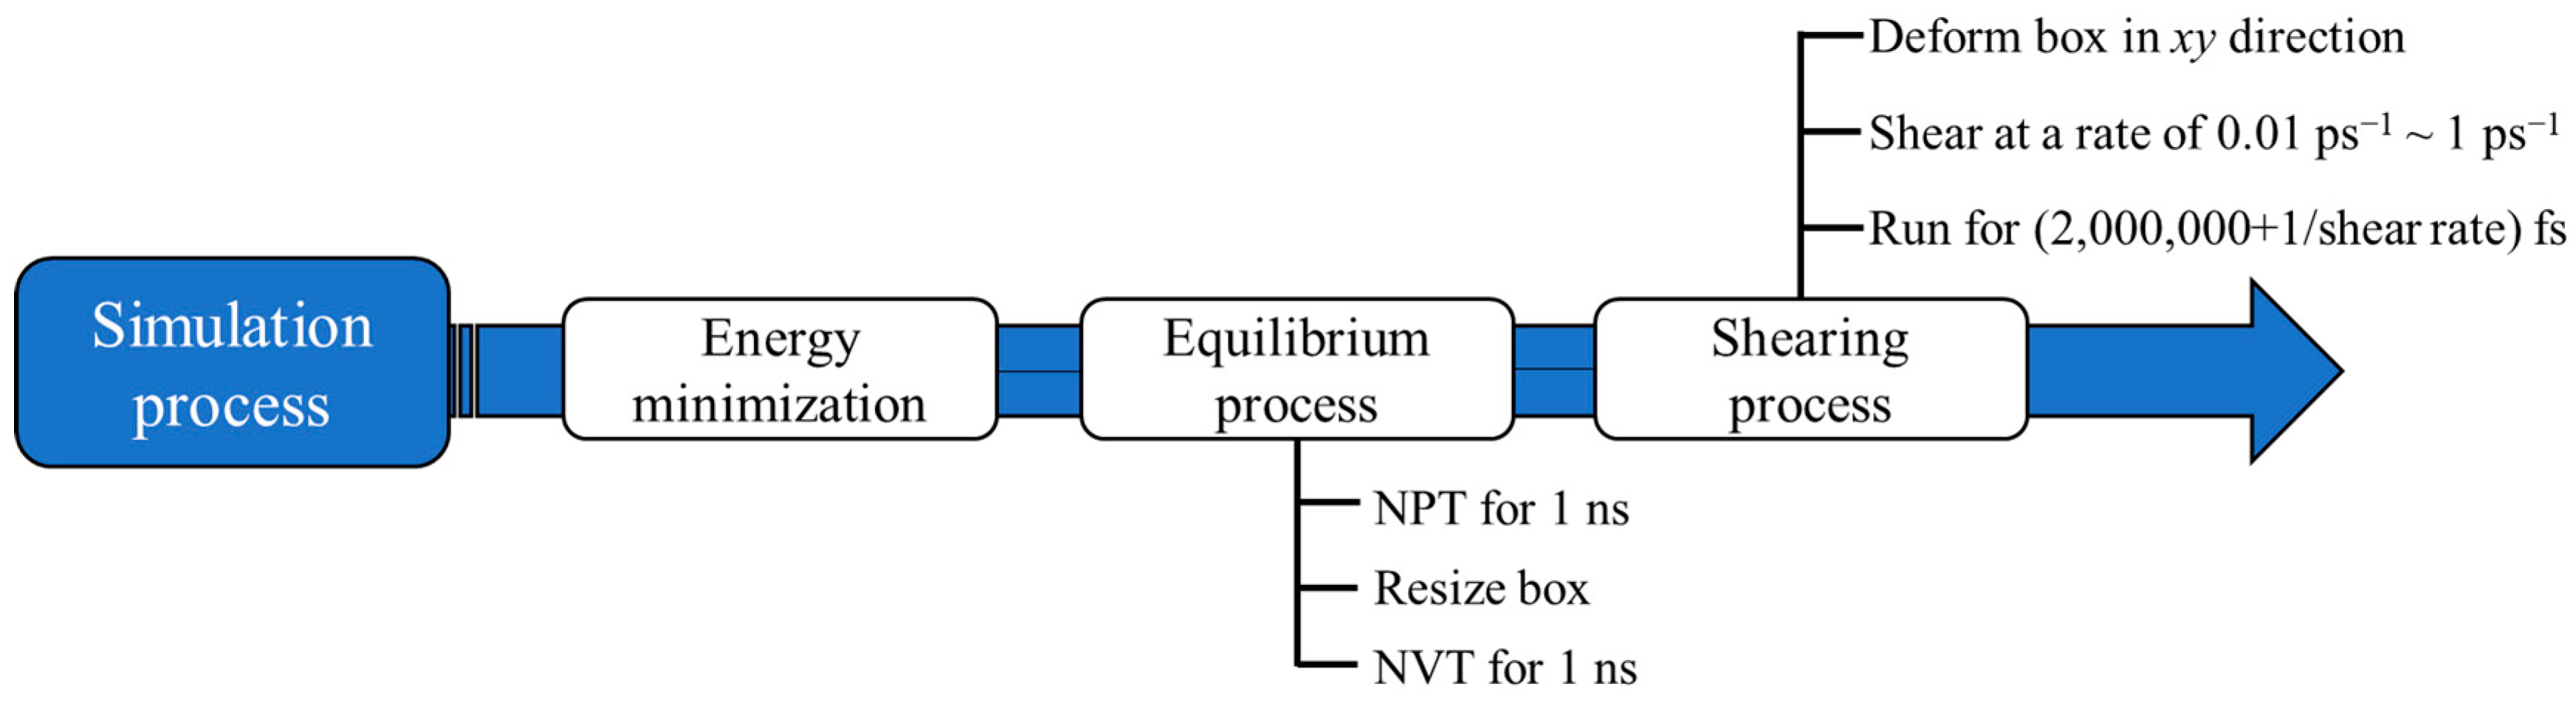
2.3. Simulation Process
2.4. Viscosity Calculation Method
3. Results and Discussion
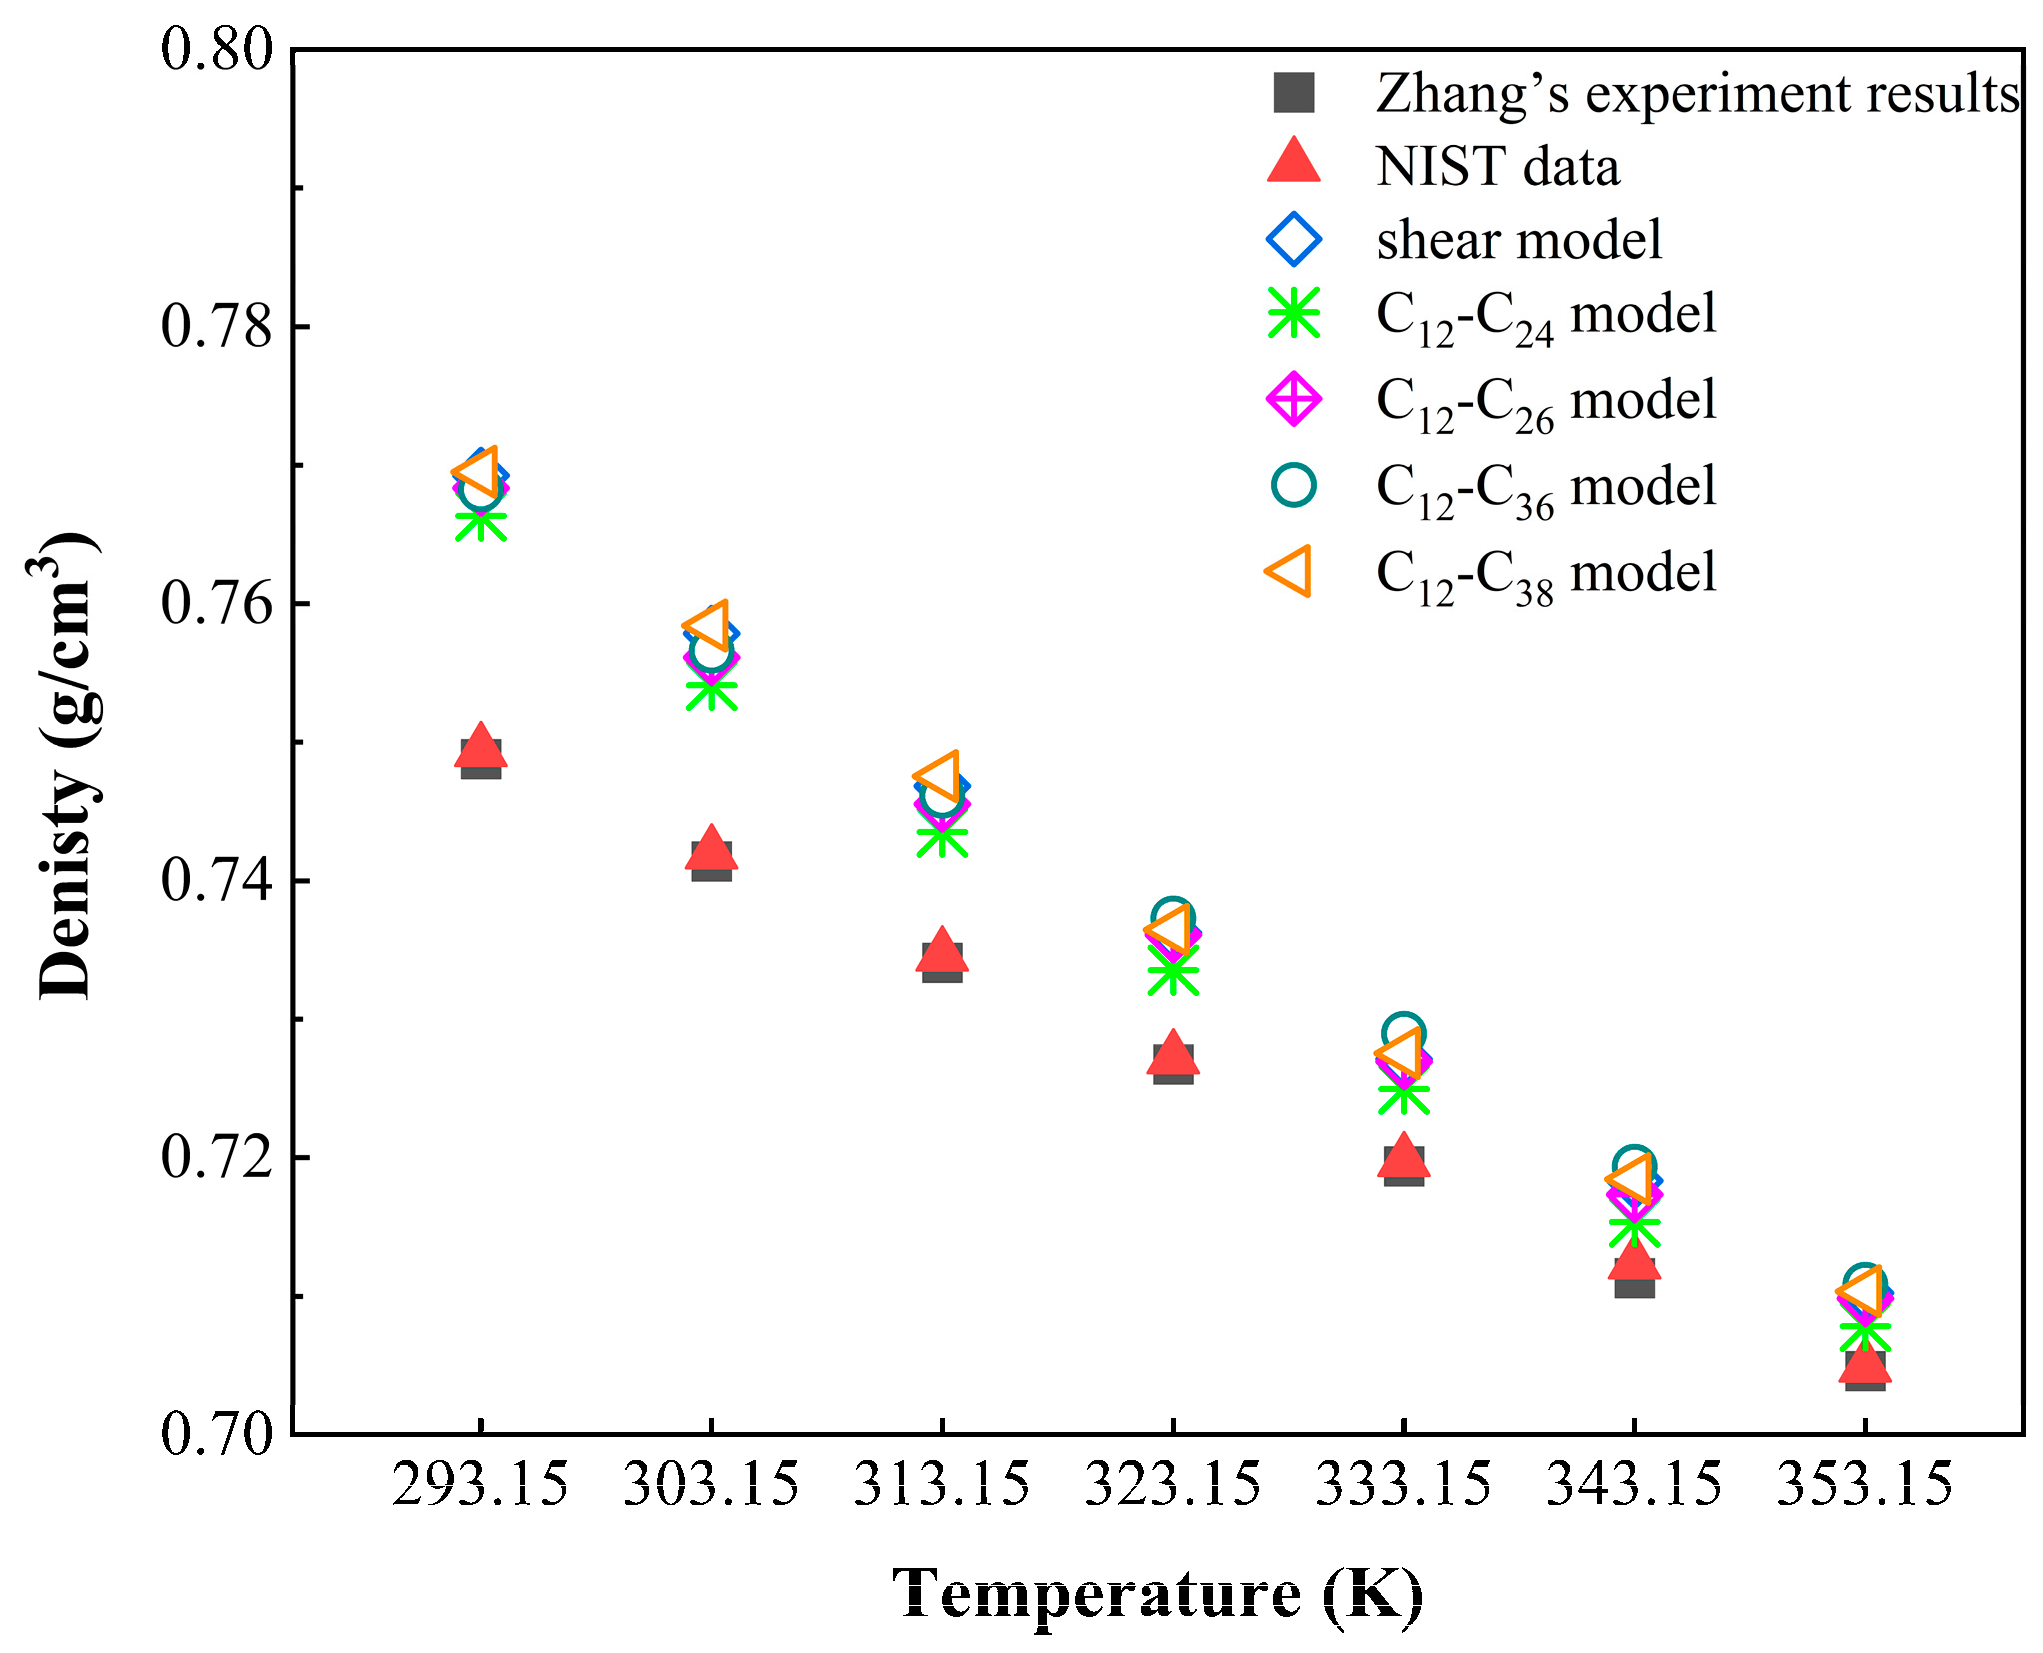
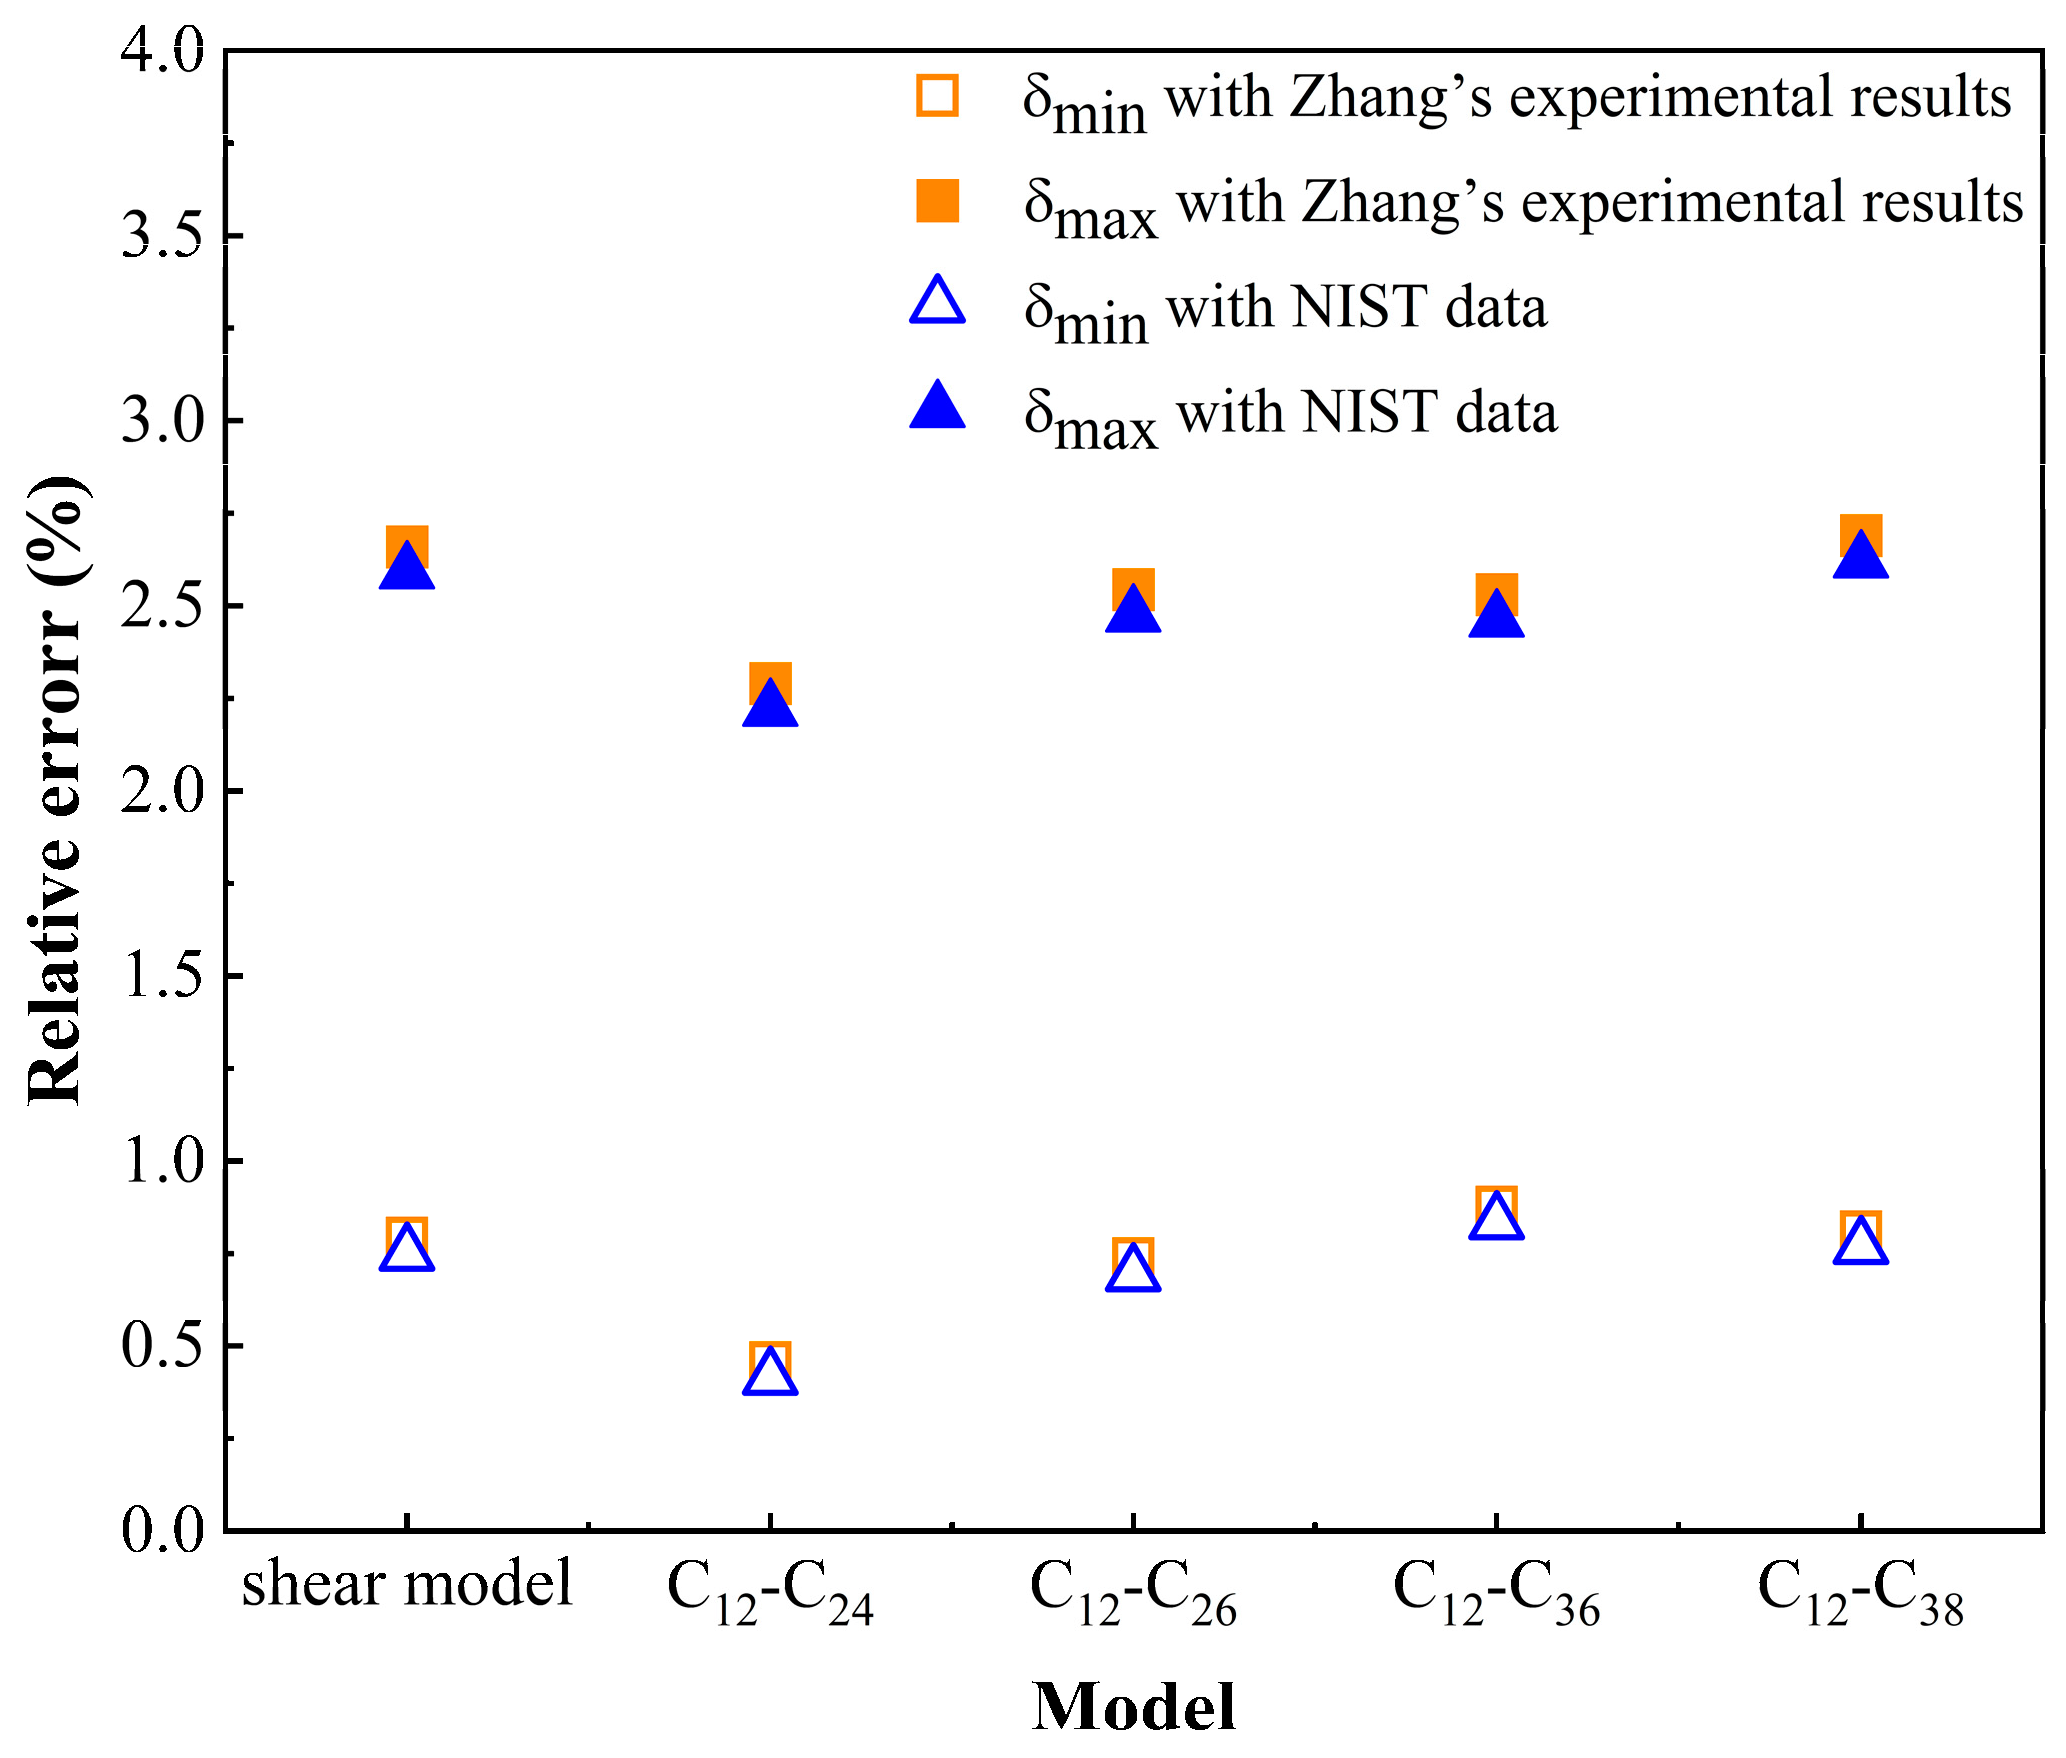
3.1. Model Validation
3.2. Effect of Wax Composition on the Aggregation of Wax Molecules in Crude Oil
3.3. Effect of Shear on the Aggregation of Wax Molecules in Crude Oil
3.3.1. Microscopic Behavior of Wax Molecules during Shearing
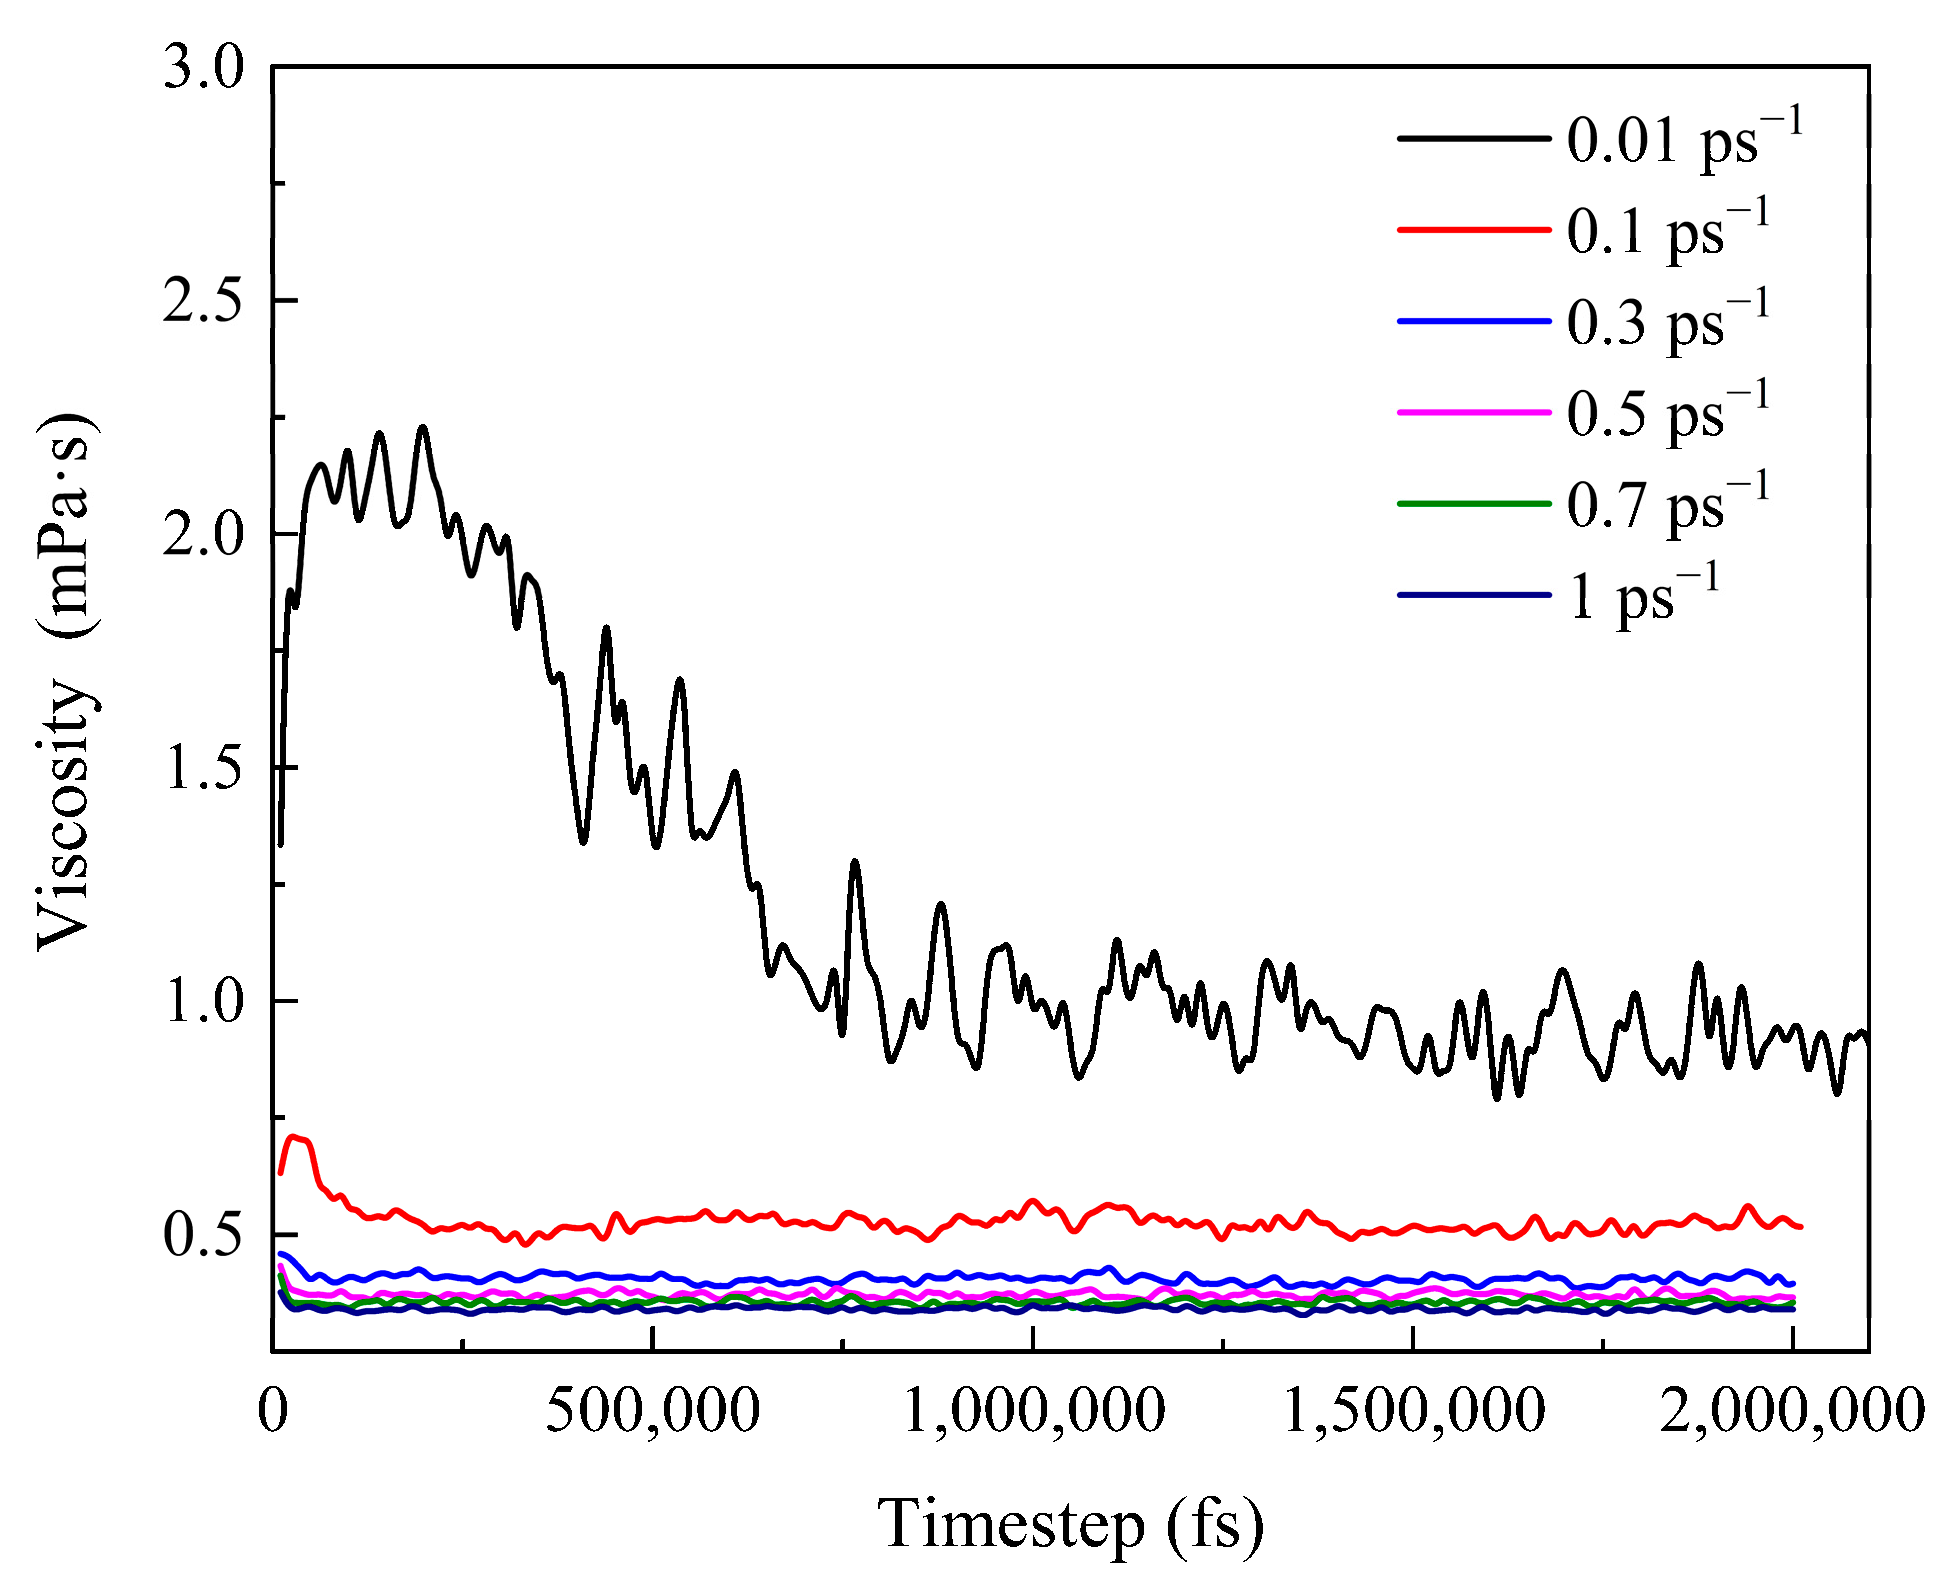
3.3.2. Viscosity Change of the System during Shearing
3.3.3. Sensitivity of Wax Molecules to Shear at Different Temperatures
3.3.4. Sensitivity of Different Wax Components to the Shear Effect
4. Conclusions
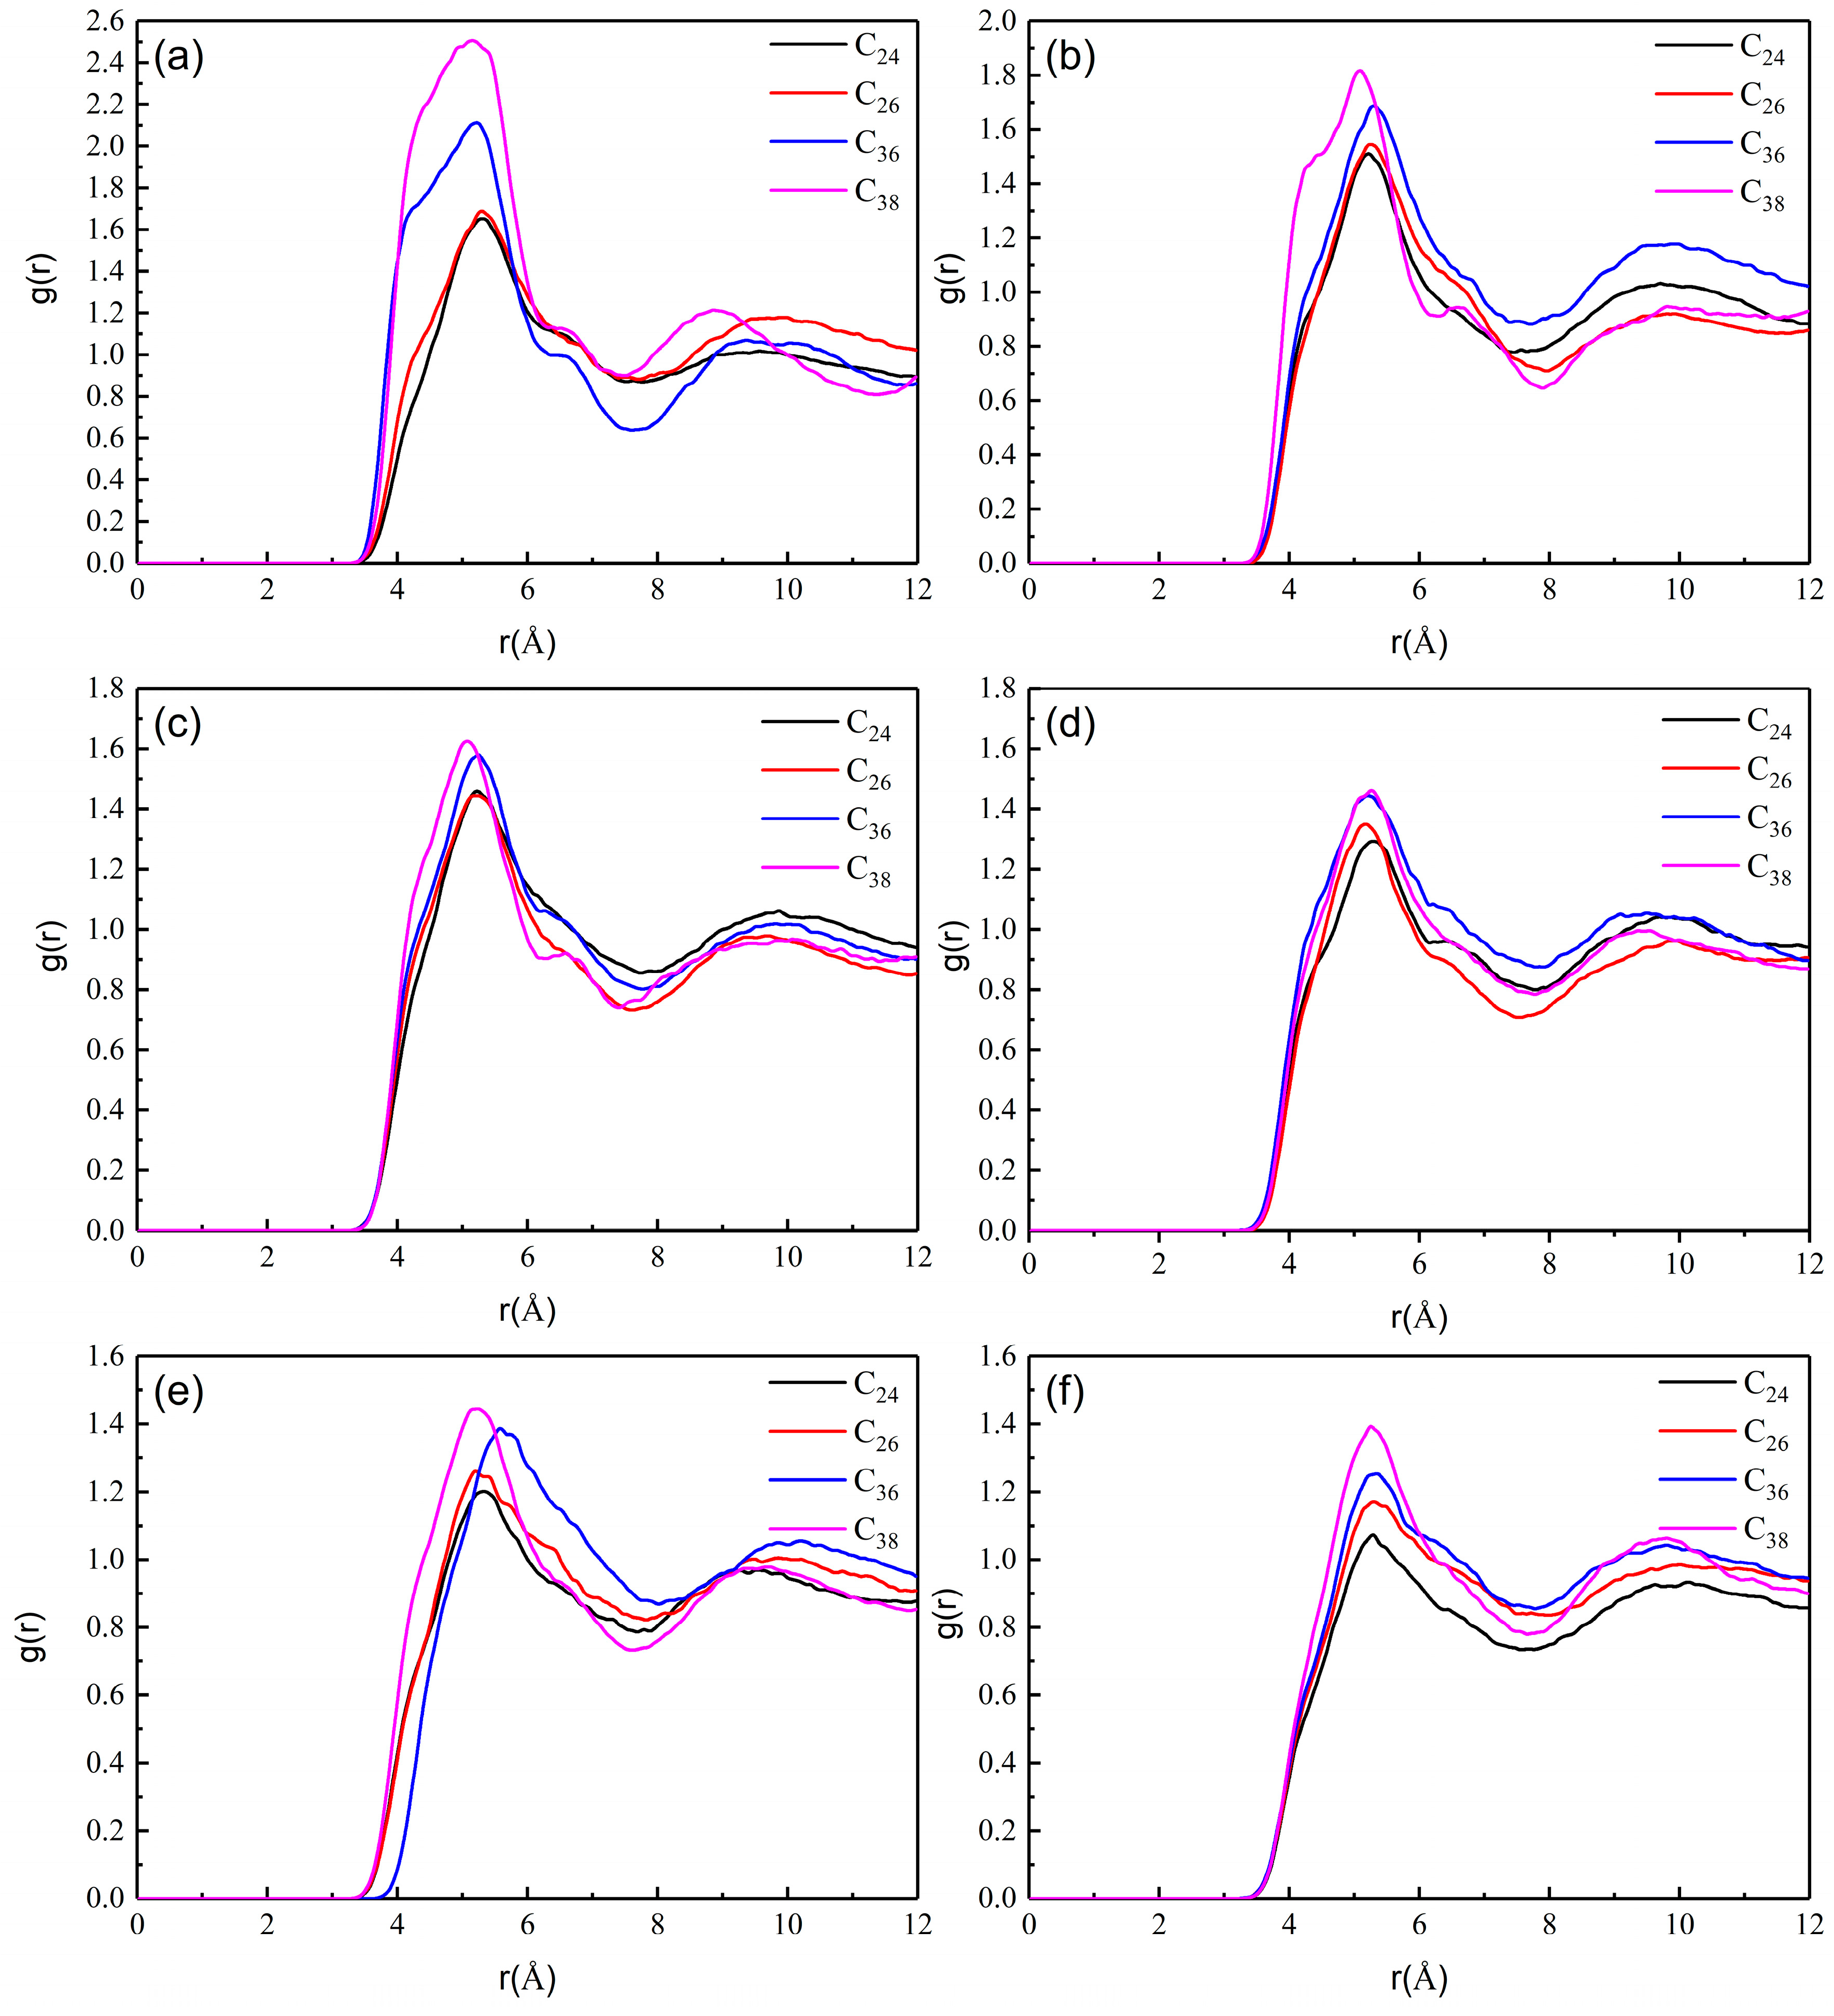
- By comparing the aggregation of wax molecules with different chain lengths, it is found that the length of the molecular chain has little effect on the aggregation position of wax molecules but has a great effect on the aggregation degree. In addition, when the temperature is low, the difference in molecular chain length will lead to a large difference in the aggregation degree of wax molecules. However, with increasing temperature, the aggregation degree of all wax molecules decreases significantly, and the difference in aggregation degree caused by the molecular chain length also decreases.
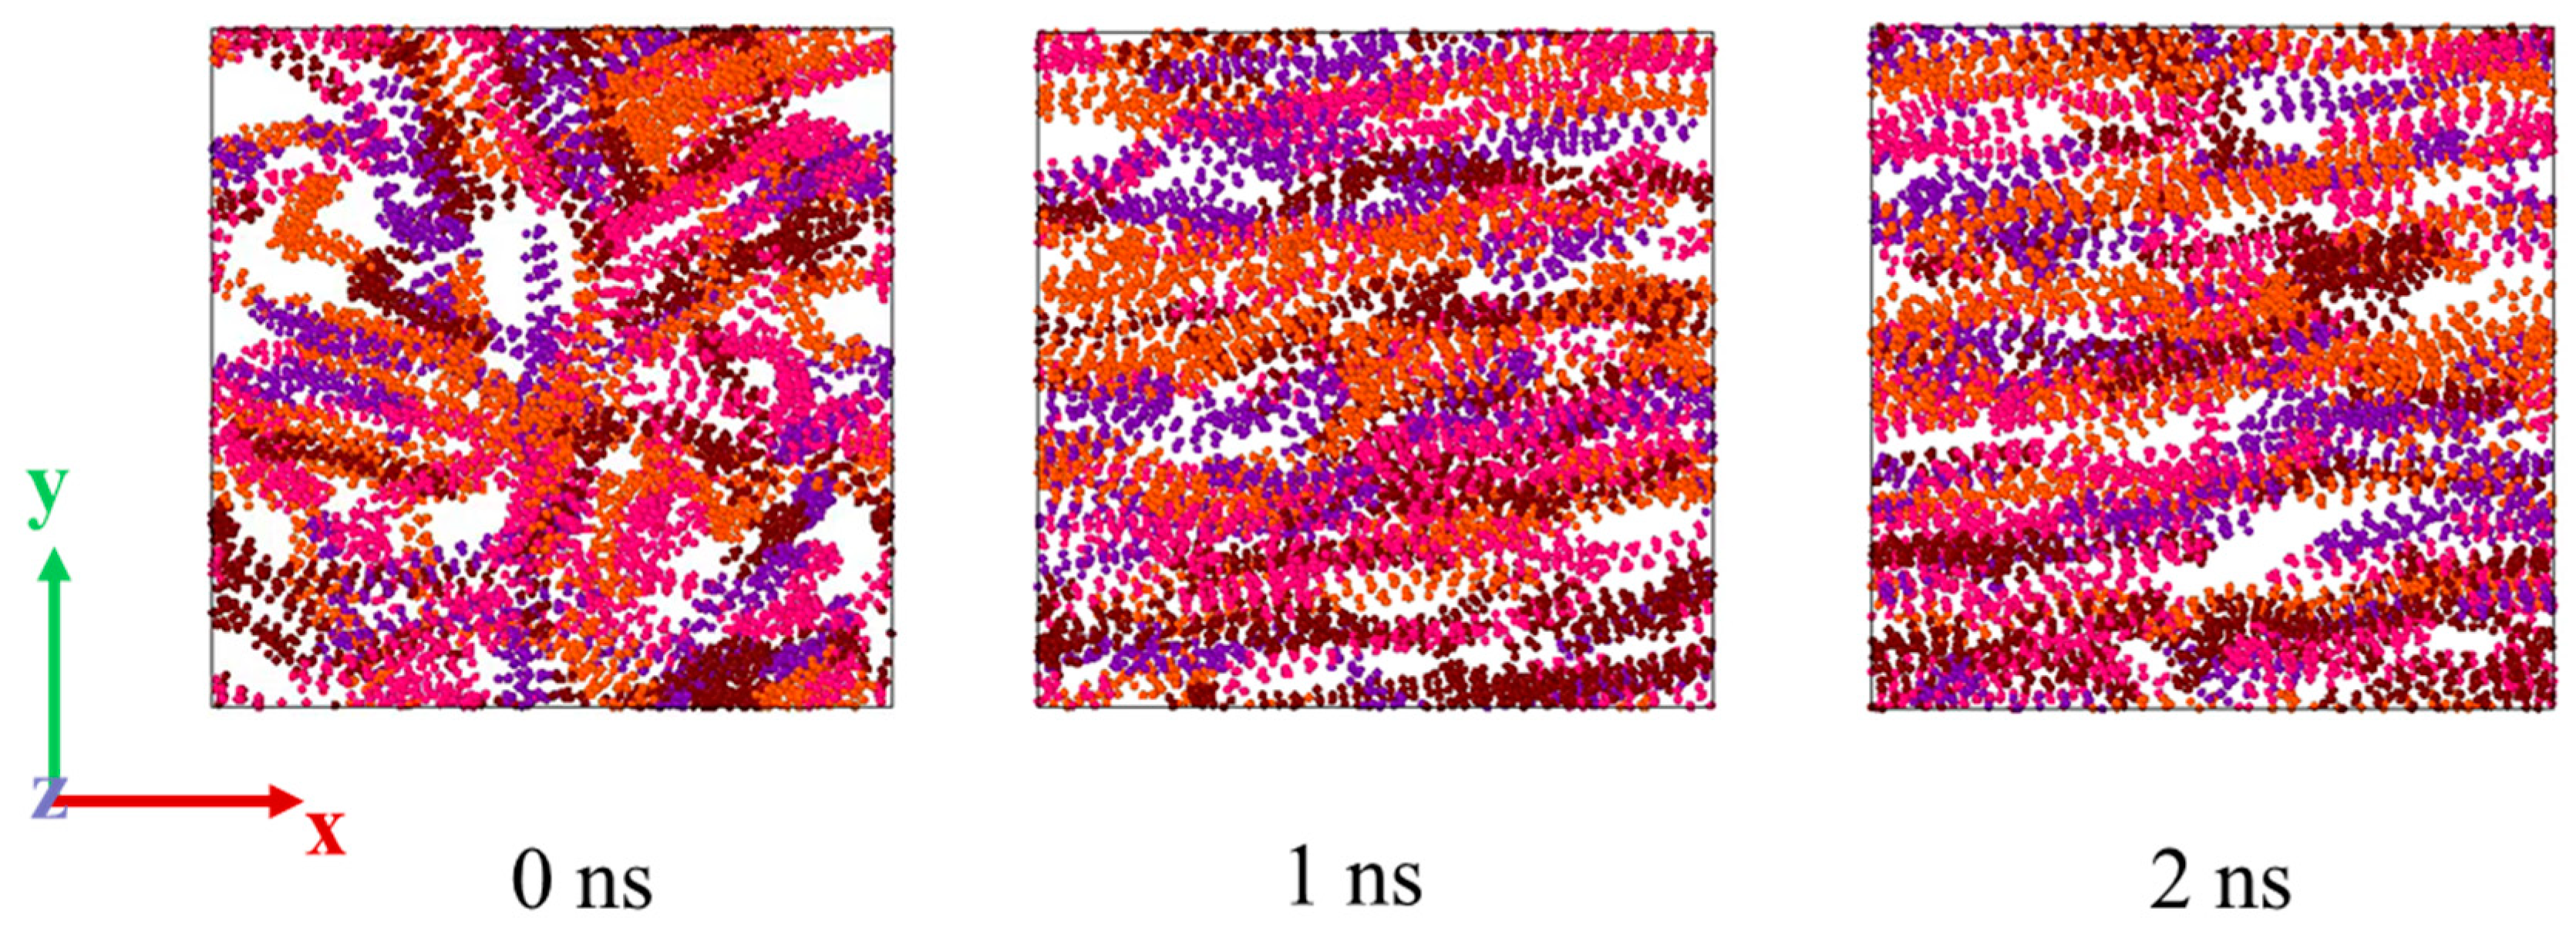
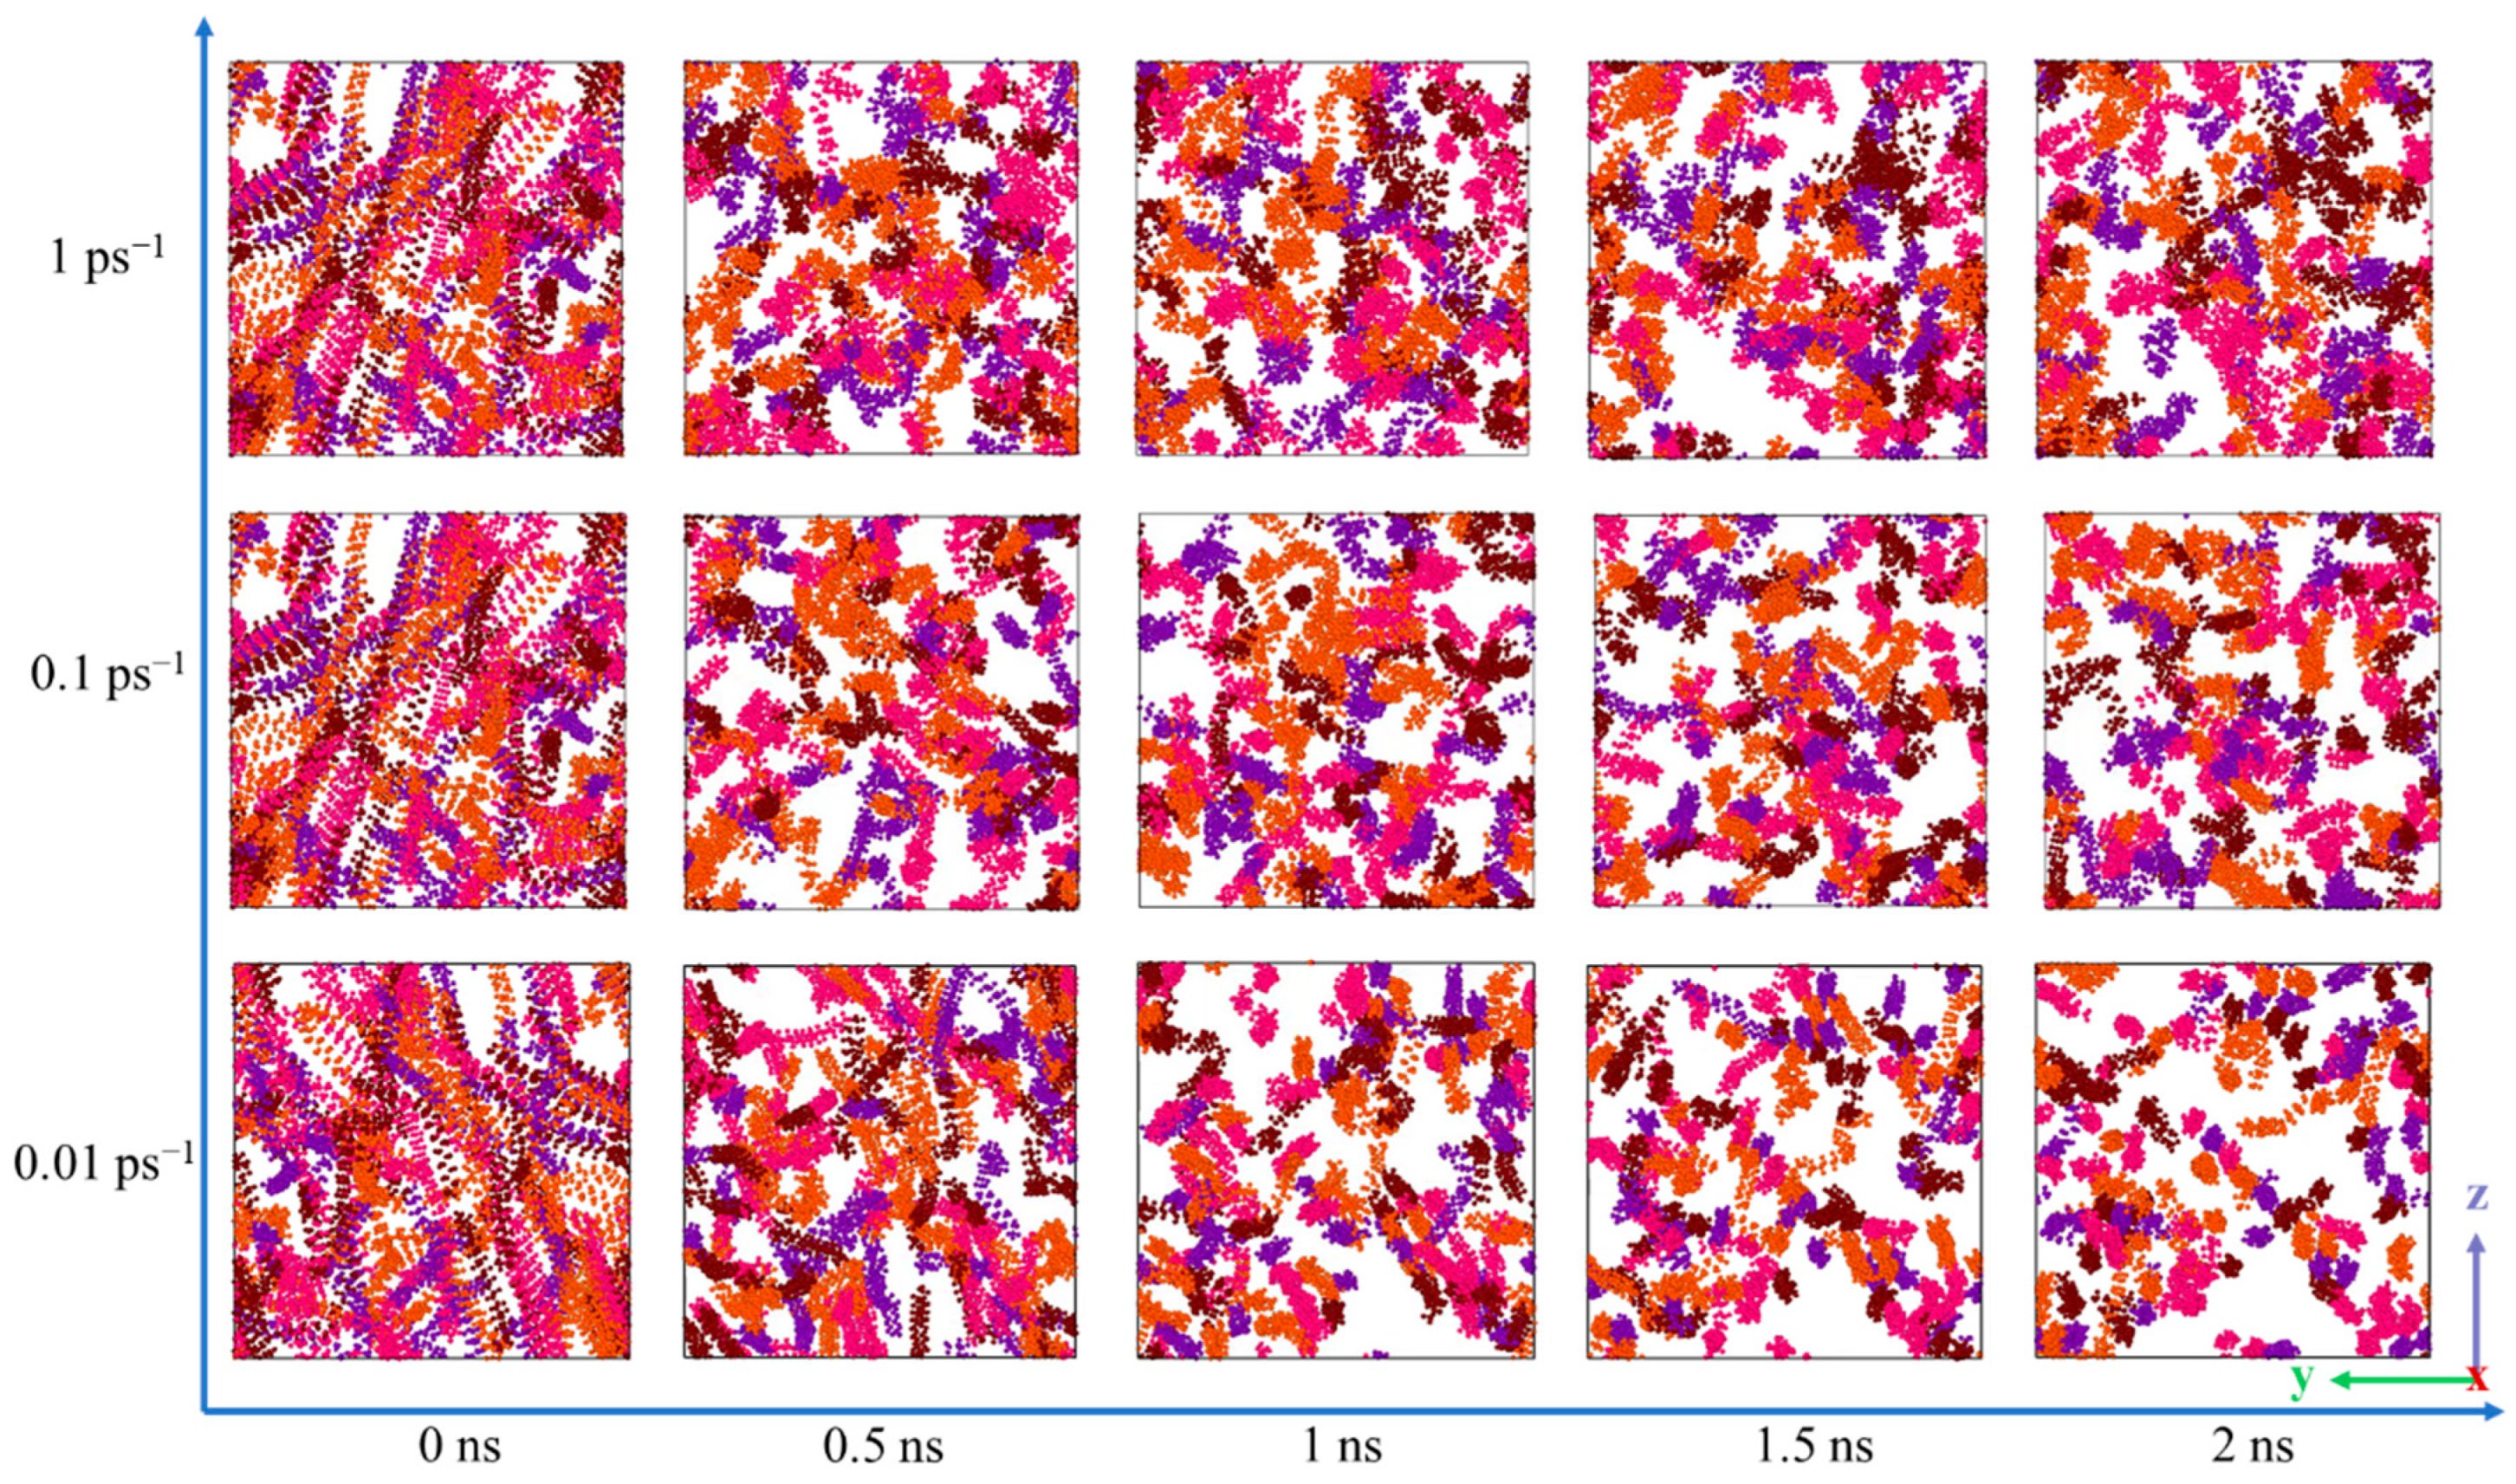
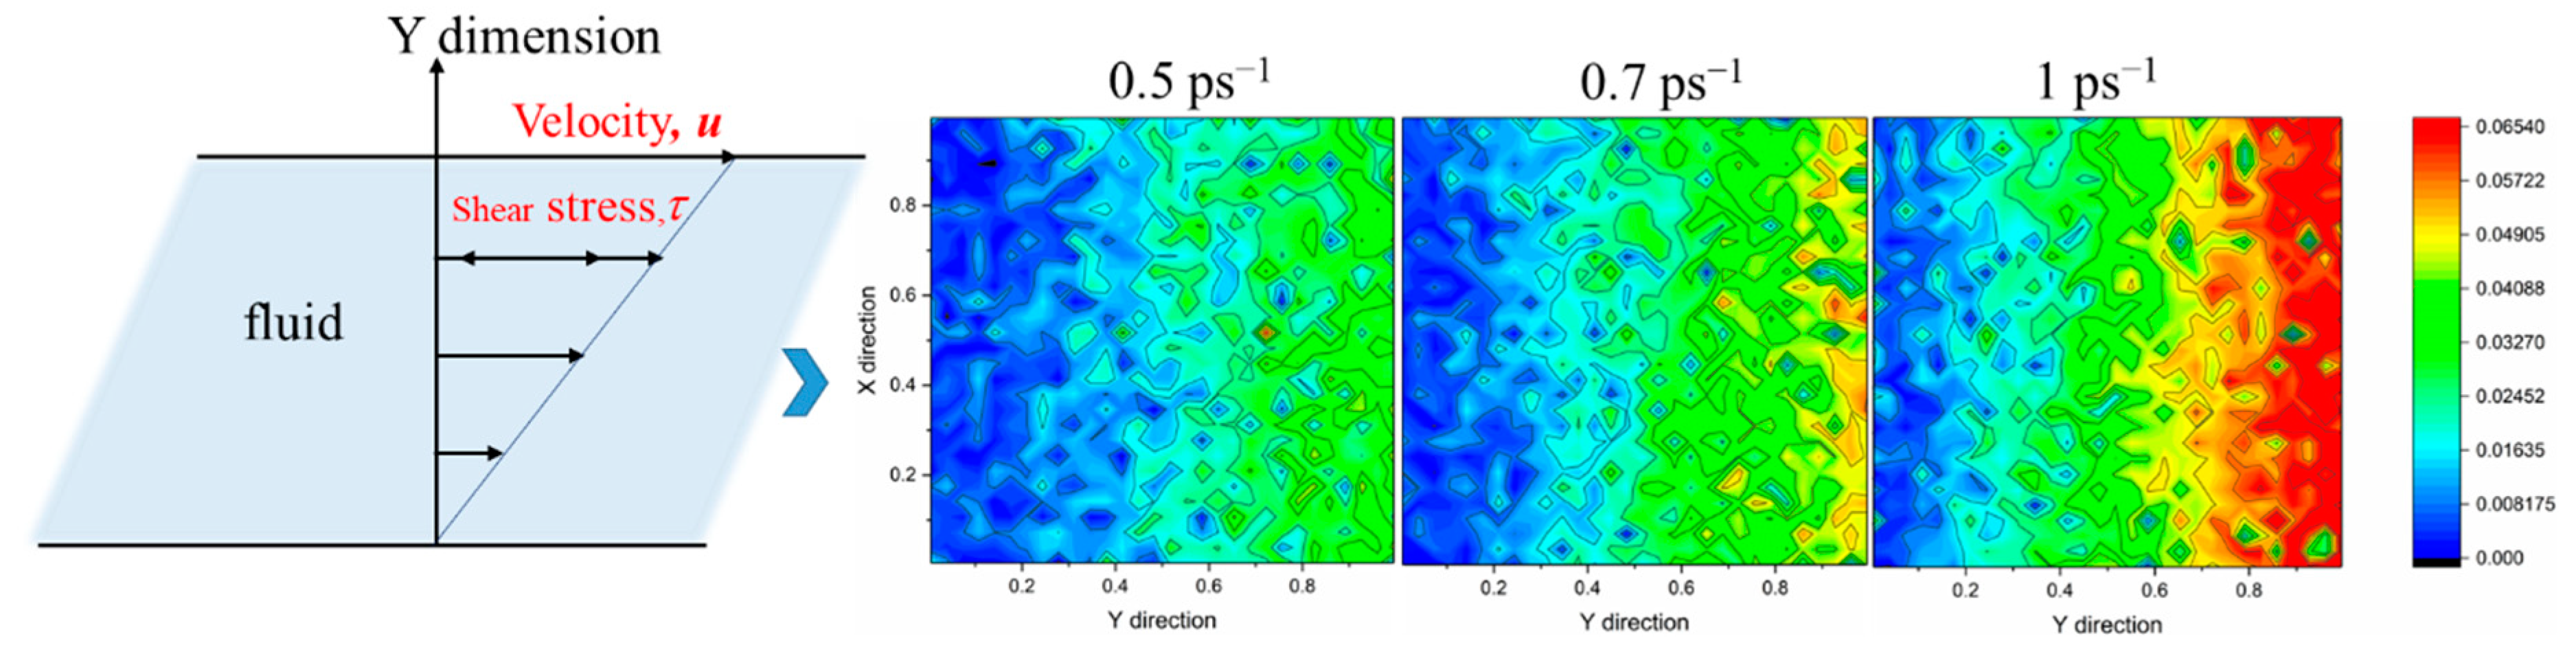
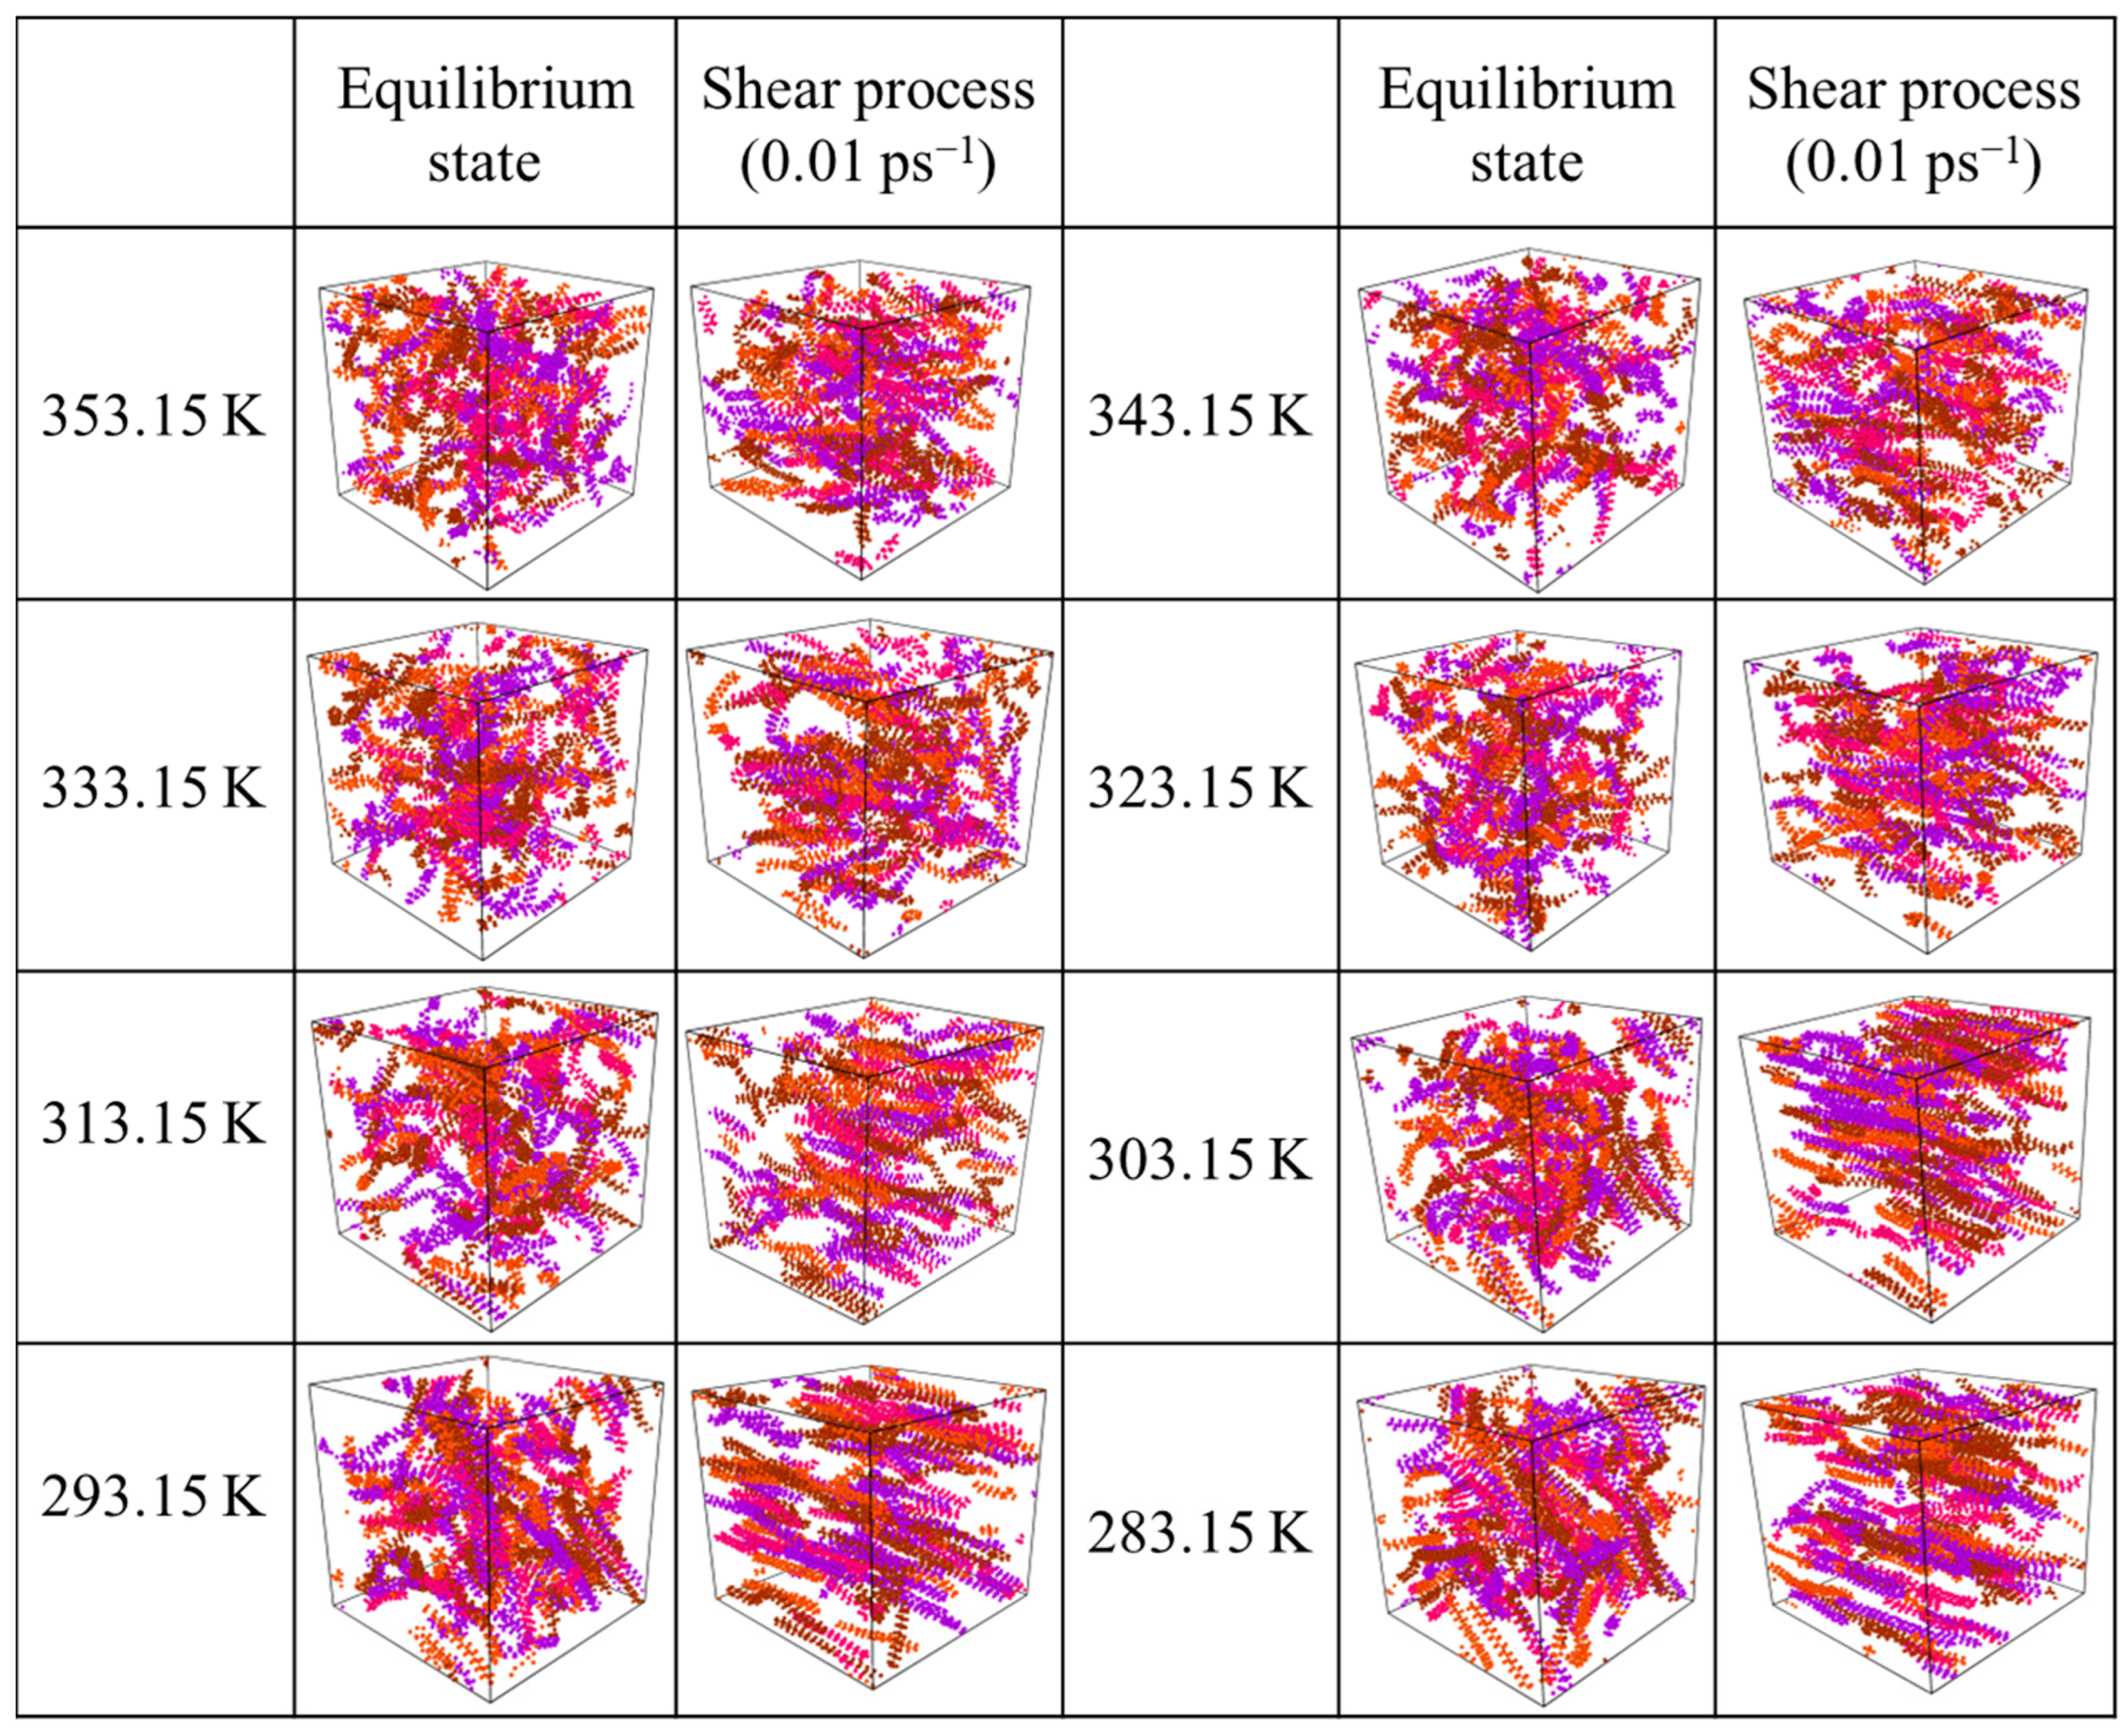
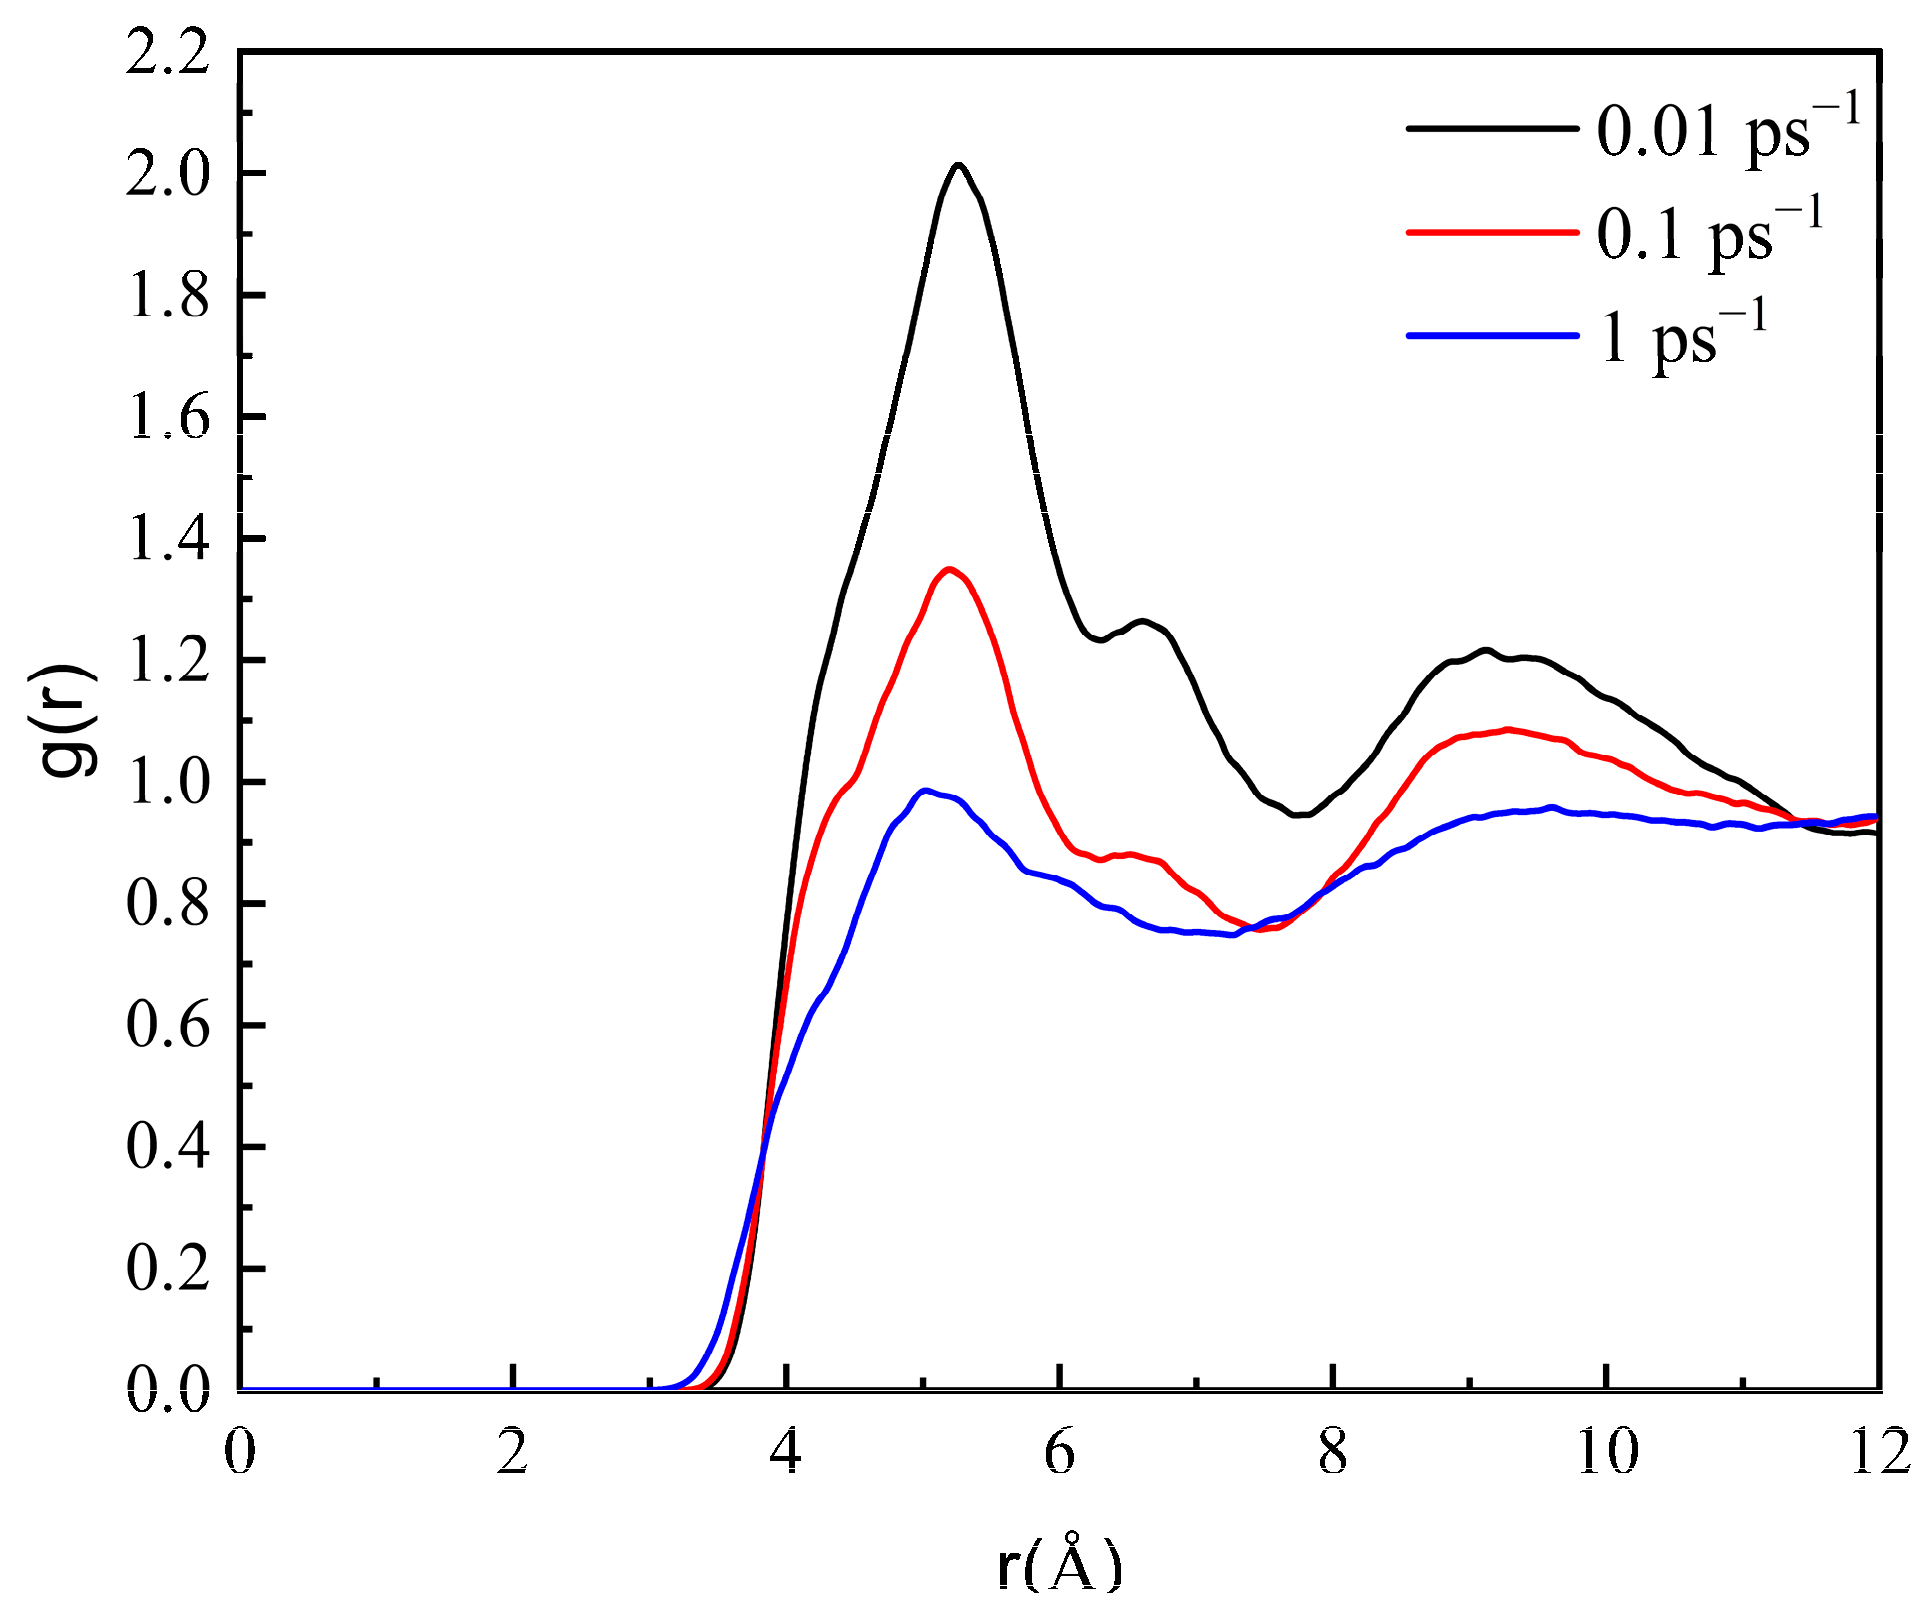
- Shearing can destroy the stable structure of crude oil, resulting in the orientation and conformational transformation of wax molecules; that is, wax molecules tend to align with the direction of the shear force, and the wax molecules are stretched from random coiling to a linear state. In a certain range, the larger the shear rate, the more parallel the direction of the wax molecules to the shear direction, and the more dispersed the distribution of the wax molecules.
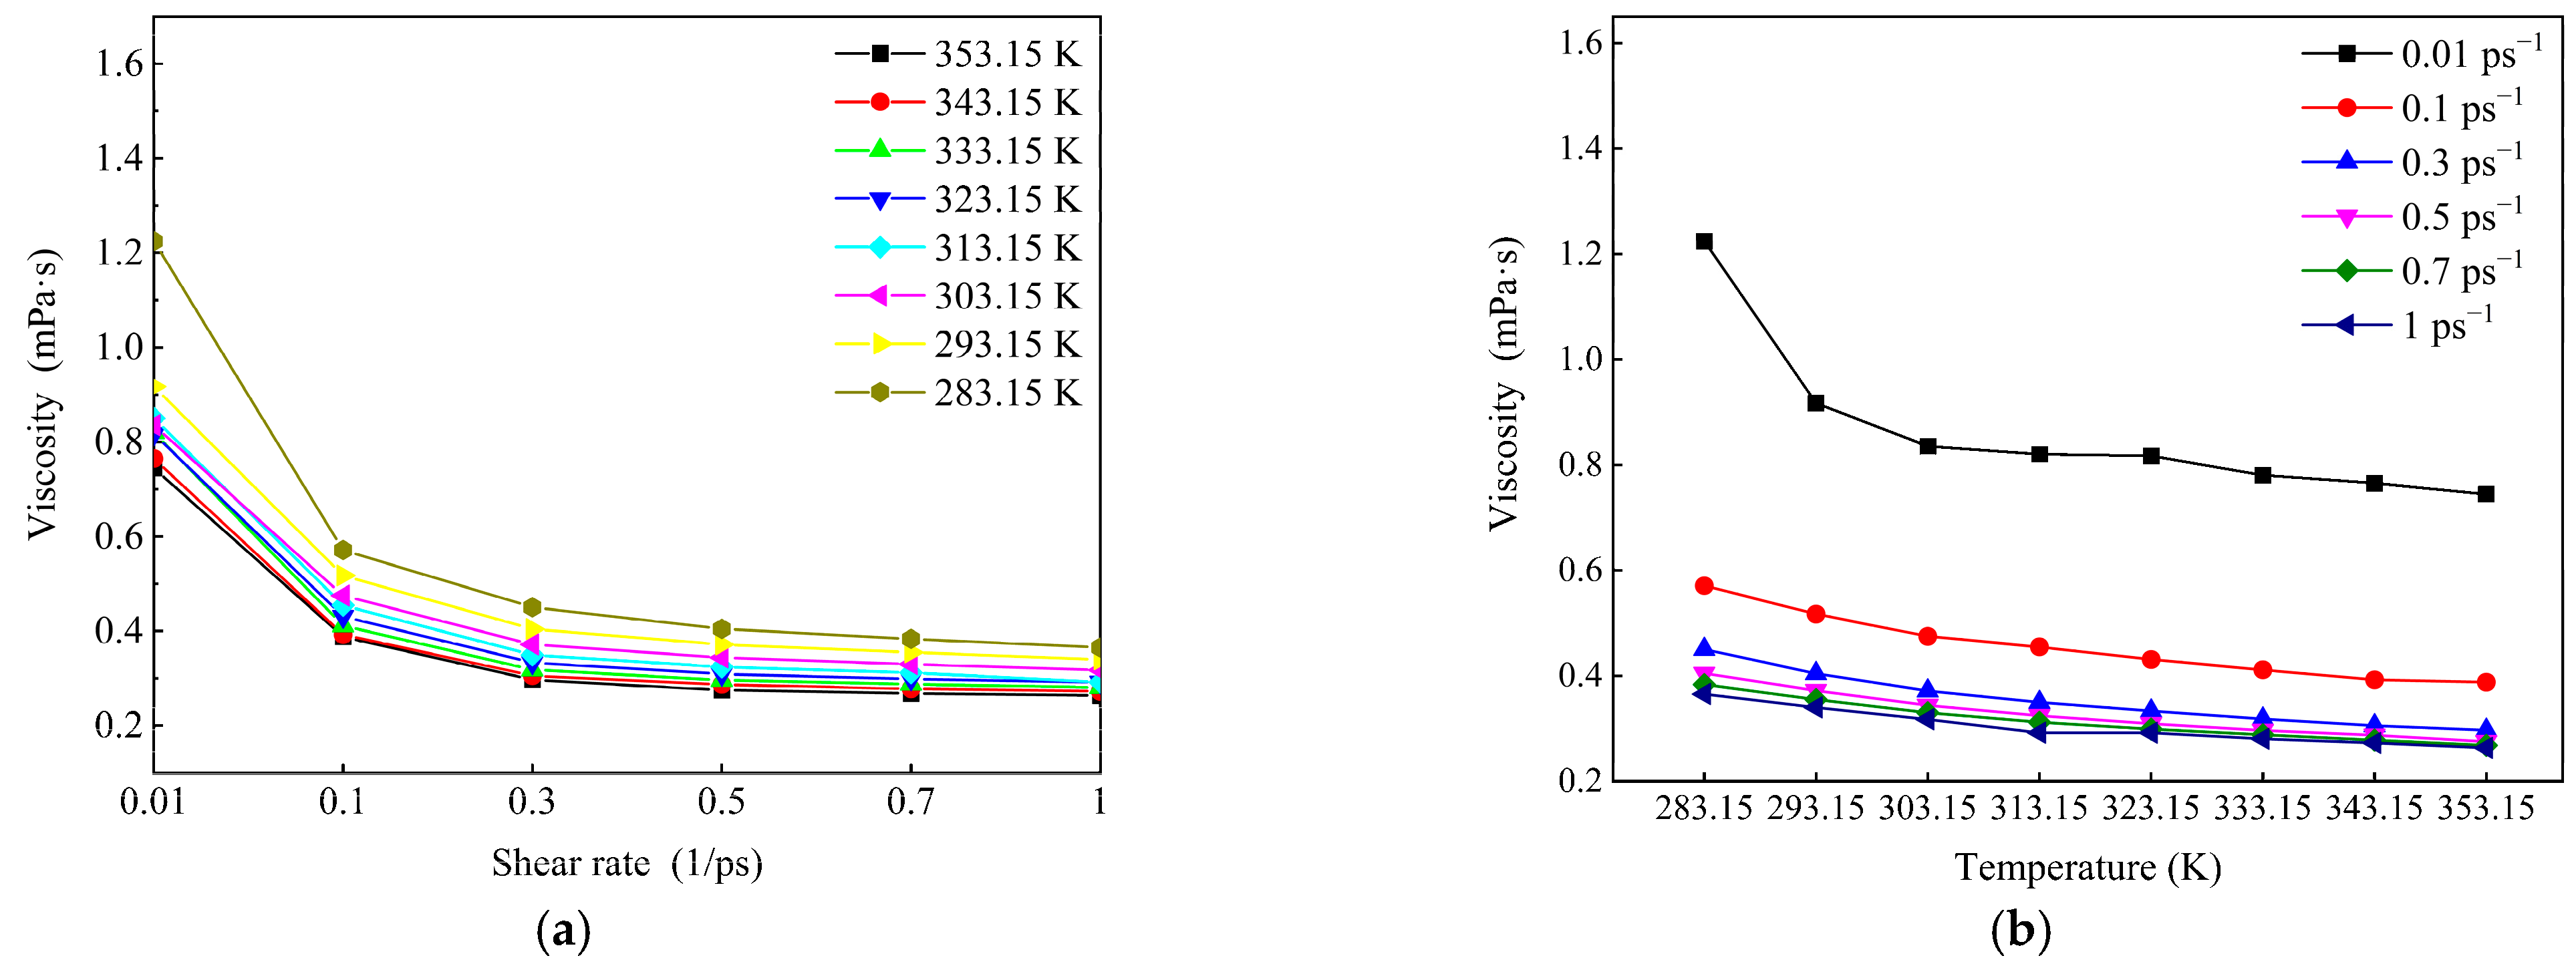
- According to the analysis of the sensitivity of wax molecules to shear action at different temperatures, it is found that the variation range of viscosity with shear rate at high temperature was smaller than that at low temperatures. This is mainly because the wax crystal particles are large and the aggregation degree is large when the temperature is low, and the aggregation degree changes greatly after breaking under the influence of shear. Furthermore, by mapping the microscopic simulation results to the macroscopic point of view, when the temperature is lower than the wax precipitation point and the shear rate is lower than the maximum shear rate to prevent the molecular structure from being destroyed, shear has a great influence on the viscosity of the system.
- Based on the analysis of the sensitivity of different wax components to shear, it is found that wax molecules with longer chains are more sensitive to shear. The change in the aggregation degree of long-chain wax molecules before and after shearing is larger, which is due to the more complex conformation and orientation of long-chain molecules. In response to the change caused by shearing, the change in the aggregation state is larger.
Author Contributions
Funding
Data Availability Statement
Conflicts of Interest
Sample Availability
Nomenclature
| Bond length | |
| Bond angle | |
| Proper dihedral angle | |
| Reference bond length | |
| Reference bond angle | |
| Reference proper dihedral angle | |
| Force field parameters related to bond length | |
| Force field parameters related to bond angle | |
| Force field parameters related to proper dihedral angle | |
| q | The charge of the atom |
| The intermolecular distance of atoms i and j | |
| The length parameters | |
| The energy parameters | |
| The mass of atom of molecule i | |
| The position of atom of molecule i | |
| The momentum of atom of molecule i | |
| The mass of the center of mass of molecule i | |
| The position of the center of mass of molecule i | |
| The momentum of the center of mass of molecule i | |
| The y components of molecule i | |
| The momentum of y components of molecule i | |
| The sum of all forces on atom of molecule i due to interaction potentials | |
| All forces on atom α of molecule i due to any constraint forces that may be present | |
| i | The x-unit vector |
| ζ | The thermostat multiplier |
| The xy component of the pressure tensor P | |
| The strain rate |
References
- Lei, Q.; Zhang, F.; Guan, B.; Liu, G.; Li, X.; Zhu, Z. Influence of shear on rheology of the crude oil treated by flow improver. Energy Rep. 2019, 5, 1156–1162. [Google Scholar] [CrossRef]
- Yang, J.; Lu, Y.; Daraboina, N.; Sarica, C. Wax deposition mechanisms: Is the current description sufficient? Fuel 2020, 275, 117937. [Google Scholar] [CrossRef]
- Liu, Z.; Li, Y.; Wang, W.; Song, G.; Lu, Z.; Ning, Y. Wax and Wax–Hydrate Deposition Characteristics in Single-, Two-, and Three-Phase Pipelines: A Review. Energy Fuels 2020, 34, 13350–13368. [Google Scholar] [CrossRef]
- Janamatti, A.; Lu, Y.; Ravichandran, S.; Sarica, C.; Daraboina, N. Influence of operating temperatures on long-duration wax deposition in flow lines. J. Pet. Sci. Eng. 2019, 183, 106373. [Google Scholar] [CrossRef]
- Ehsani, S.; Haj-Shafiei, S.; Mehrotra, A.K. Experiments and modeling for investigating the effect of suspended wax crystals on deposition from ’waxy’ mixtures under cold flow conditions. Fuel 2019, 243, 610–621. [Google Scholar] [CrossRef]
- da Silva, J.A.L.; Coutinho, J.A.P. Dynamic rheological analysis of the gelation behaviour of waxy crude oils. Rheol. Acta 2004, 43, 433–441. [Google Scholar] [CrossRef]
- He, C.; Ding, Y.; Chen, J.; Wang, F.; Gao, C.; Zhang, S.; Yang, M. Influence of the nano-hybrid pour point depressant on flow properties of waxy crude oil. Fuel 2016, 167, 40–48. [Google Scholar] [CrossRef]
- Shahruddin, S.; Jiménez-Serratos, G.; Britovsek, G.J.P.; Matar, O.K.; Müller, E.A. Fluid-solid phase transition of n-alkane mixtures: Coarse-grained molecular dynamics simulations and diffusion-ordered spectroscopy nuclear magnetic resonance. Sci. Rep. 2019, 9, 1002. [Google Scholar] [CrossRef] [Green Version]
- Xu, H.; Wang, Y.; Wang, K. Review on the gelation of wax and pour point depressant in crude oil multiphase system. Int. J. Mod. Phys. B 2021, 35, 2130005. [Google Scholar] [CrossRef]
- Ragunathan, T.; Husin, H.; Wood, C.D. Inhibiting wax deposition using palm oil additives. In Proceedings of the Offshore Technology Conference Asia, OnePetro, Kuala Lumpur, Malaysia, 2–6 November 2020. [Google Scholar]
- Subramanie, P.; Vijayakumar, S.D.; Ridzuan, N. Effect of wax inhibitor and sodium cloisite, Na+ nanoparticle on wax deposition of Malaysian crude oil through cold finger analysis. Pet. Sci. Technol. 2021, 39, 860–877. [Google Scholar] [CrossRef]
- Cheng, Y.; Yuan, S. Emulsification of surfactant on oil droplets by molecular dynamics simulation. Molecules 2020, 25, 3008. [Google Scholar] [CrossRef] [PubMed]
- Xu, Y.; Wang, Y.; Wang, T.; Zhang, L.; Xu, M.; Jia, H. Demulsification of Heavy Oil-in-Water Emulsion by a Novel Janus Graphene Oxide Nanosheet: Experiments and Molecular Dynamic Simulations. Molecules 2022, 27, 2191. [Google Scholar] [CrossRef] [PubMed]
- Gan, Y.; Cheng, Q.; Wang, Z.; Yang, J.; Sun, W.; Liu, Y. Molecular dynamics simulation of the microscopic mechanisms of the dissolution, diffusion and aggregation processes for waxy crystals in crude oil mixtures. J. Pet. Sci. Eng. 2019, 179, 56–69. [Google Scholar] [CrossRef]
- Li, Q.; Deng, X.; Liu, Y.; Cheng, Q.; Liu, C. Gelation of waxy crude oil system with ethylene-vinyl acetate on solid surface: A molecular dynamics study. J. Mol. Liq. 2021, 331, 115816. [Google Scholar] [CrossRef]
- Yang, F.; Zhu, H.; Li, C.; Yao, B.; Wang, F.; Chen, J.; Sun, G. Investigation on the mechanism of wax deposition inhibition induced by asphaltenes and wax inhibitors. J. Pet. Sci. Eng. 2021, 204, 108723. [Google Scholar] [CrossRef]
- Jang, Y.H.; Blanco, M.; Creek, J.; Tang, Y.; Goddard, W.A. Wax inhibition by comb-like polymers: Support of the incorporation–perturbation mechanism from molecular dynamics simulations. J. Phys. Chem. B 2007, 111, 13173–13179. [Google Scholar] [CrossRef] [Green Version]
- Wu, C.; Zhang, J.; Li, W.; Wu, N. Molecular dynamics simulation guiding the improvement of EVA-type pour point depressant. Fuel 2005, 84, 2039–2047. [Google Scholar] [CrossRef]
- Cheng, Q.; Gan, Y.; Wang, Z.; Sun, W.; Wang, S.; Liu, C.; Li, Q.; Liu, Y. Molecular dynamics study on the radial deposition and adhesion process for the waxy crude oil tube transport system and effect-principle of features in construction. Energy Fuels 2021, 36, 310–319. [Google Scholar] [CrossRef]
- Cao, J.; Liu, L.; Liu, C.; He, C. Phase transition mechanisms of paraffin in waxy crude oil in the absence and presence of pour point depressant. J. Mol. Liq. 2022, 345, 116989. [Google Scholar] [CrossRef]
- Li, Q.; Cao, J.; Liu, Y.; Cheng, Q.; Liu, C. Effect of dispersed water on the paraffin crystallization and deposition of emulsified waxy crude oil via dissipative particle dynamics. J. Mol. Liq. 2021, 343, 117679. [Google Scholar] [CrossRef]
- Chen, X.; Hou, L.; Li, W.; Li, S. Influence of electric field on the viscosity of waxy crude oil and micro property of paraffin: A molecular dynamics simulation study. J. Mol. Liq. 2018, 272, 973–981. [Google Scholar] [CrossRef]
- Chen, X.; Hou, L.; Li, W.; Li, S.; Chen, Y. Molecular dynamics simulation of magnetic field influence on waxy crude oil. J. Mol. Liq. 2018, 249, 1052–1059. [Google Scholar] [CrossRef]
- Liao, Q.; Shi, B.; Li, S.; Song, S.; Chen, Y.; Zhang, J.; Yao, H.; Li, Q.; Gong, J. Molecular dynamics simulation of the effect of wax molecules on methane hydrate formation. Fuel 2021, 297, 120778. [Google Scholar] [CrossRef]
- Gan, Y.; Cheng, Q.; Wang, Z.; Yang, J.; Sun, W.; Liu, Y. Molecular Dynamics Simulation of the Nucleation and Gelation Process for a Waxy Crude Oil Multiphase System under Different Physical-Chemical Influencing Factors. Energy Fuels 2019, 33, 7305–7320. [Google Scholar] [CrossRef]
- Lin, L.; Kedzierski, M.A. Density and viscosity of a polyol ester lubricant: Measurement and molecular dynamics simulation. Int. J. Refrig. 2020, 118, 188–201. [Google Scholar] [CrossRef] [PubMed]
- Liu, P.; Yu, H.; Ren, N.; Lockwood, F.E.; Wang, Q.J. Pressure–viscosity coefficient of hydrocarbon base oil through molecular dynamics simulations. Tribol. Lett. 2015, 60, 34. [Google Scholar] [CrossRef]
- Berker, A.; Chynoweth, S.; Klomp, U.C.; Michopoulos, Y. Non-equilibrium molecular dynamics (NEMD) simulations and the rheological properties of liquid n-hexadecane. J. Chem. Soc. Faraday Trans. 1992, 88, 1719–1725. [Google Scholar] [CrossRef]
- Zhu, H.; Zhang, S.; Li, X.; Ma, D.; Sun, X.; Wang, H.-Z.; Yan, Y.; Xu, J.; Yang, C. Molecular Dynamics Simulation Reveals Unique Rheological and Viscosity–Temperature Properties of Karamay Heavy Crude Oil. Energy Fuels 2021, 35, 7956–7966. [Google Scholar] [CrossRef]
- Kioupis, L.I.; Maginn, E.J. Rheology, dynamics, and structure of hydrocarbon blends: A molecular dynamics study of n-hexane/n-hexadecane mixtures. Chem. Eng. J. 1999, 74, 129–146. [Google Scholar] [CrossRef]
- Bair, S.; Mccabe, C.; Cummings, P.T. Comparison of Nonequilibrium Molecular Dynamics with Experimental Measurements in the Nonlinear Shear-Thinning Regime. Phys. Rev. Lett. 2002, 88, 058302. [Google Scholar] [CrossRef] [Green Version]
- Cui, S.T.; Gupta, S.A.; Cummings, P.T.; Cochran, H.D. Molecular dynamics simulations of the rheology of normal decane, hexadecane, and tetracosane. J. Chem. Phys. 1996, 105, 1214–1220. [Google Scholar] [CrossRef] [Green Version]
- Ding, Y.; Huang, B.; Shu, X. Modeling shear viscosity of asphalt through nonequilibrium molecular dynamics simulation. Transp. Res. Rec. 2018, 2672, 235–243. [Google Scholar] [CrossRef]
- Mimeau, C.; Mortazavi, I. A review of vortex methods and their applications: From creation to recent advances. Fluids 2021, 6, 68. [Google Scholar] [CrossRef]
- Bimbato, A.M.; Alcântara Pereira, L.A.; Hirata, M.H. Study of surface roughness effect on a bluff body—The formation of asymmetric separation bubbles. Energies 2020, 13, 6094. [Google Scholar] [CrossRef]
- Galamba, N.; Nieto de Castro, C.A.; Ely, J.F. Shear viscosity of molten alkali halides from equilibrium and nonequilibrium molecular-dynamics simulations. J. Chem. Phys. 2005, 122, 224501. [Google Scholar] [CrossRef]
- Blanco-Díaz, E.G.; Castrejón-González, E.O.; Rico-Ramírez, V.; Aztatzi-Pluma, D.; Díaz-Ovalle, C.O. Polydispersity influence in rheological behavior of linear chains by molecular dynamics. J. Mol. Liq. 2018, 268, 832–839. [Google Scholar] [CrossRef]
- Todd, B.D.; Daivis, P.J. Nonequilibrium Molecular Dynamics: Theory, Algorithms and Application; Cambridge University Press: Cambrigde, UK, 2017. [Google Scholar]
- Zang, D.; Zhao, G.; Liu, X.; Yin, J.; Ma, S. Experimental and molecular simulation of volumetric properties of methyl nonanoate, n-dodecane, and their binary mixtures. Chem. Res. Chin. Univ. 2019, 35, 299–303. [Google Scholar] [CrossRef]


Publisher’s Note: MDPI stays neutral with regard to jurisdictional claims in published maps and institutional affiliations. |
© 2022 by the authors. Licensee MDPI, Basel, Switzerland. This article is an open access article distributed under the terms and conditions of the Creative Commons Attribution (CC BY) license (https://creativecommons.org/licenses/by/4.0/).
Share and Cite
Wang, S.; Cheng, Q.; Gan, Y.; Li, Q.; Liu, C.; Sun, W. Effect of Wax Composition and Shear Force on Wax Aggregation Behavior in Crude Oil: A Molecular Dynamics Simulation Study. Molecules 2022, 27, 4432. https://doi.org/10.3390/molecules27144432
Wang S, Cheng Q, Gan Y, Li Q, Liu C, Sun W. Effect of Wax Composition and Shear Force on Wax Aggregation Behavior in Crude Oil: A Molecular Dynamics Simulation Study. Molecules. 2022; 27(14):4432. https://doi.org/10.3390/molecules27144432
Chicago/Turabian StyleWang, Shuang, Qinglin Cheng, Yifan Gan, Qibin Li, Chao Liu, and Wei Sun. 2022. "Effect of Wax Composition and Shear Force on Wax Aggregation Behavior in Crude Oil: A Molecular Dynamics Simulation Study" Molecules 27, no. 14: 4432. https://doi.org/10.3390/molecules27144432
APA StyleWang, S., Cheng, Q., Gan, Y., Li, Q., Liu, C., & Sun, W. (2022). Effect of Wax Composition and Shear Force on Wax Aggregation Behavior in Crude Oil: A Molecular Dynamics Simulation Study. Molecules, 27(14), 4432. https://doi.org/10.3390/molecules27144432