1. Introduction
Spectral NMR diagnostics is an important tool for studies of complexes with hydrogen bonds, as oftentimes it is the main way to obtain reliable information about hydrogen bond geometry and strength [
1,
2,
3,
4,
5,
6,
7]. At the moment, there are a number of correlational equations linking the numerical value of spectral NMR parameters and the geometry/energy of a single hydrogen bond [
8]. Some of them are well established and widely used, and their applicability was tested for multiple set of complexes, while others are applicable only to particular complexes and conditions. Among the parameters whose change upon the formation of a hydrogen-bonded complex is correlated with the strength of a X–H···Y hydrogen bond, one can distinguish two major groups. The parameters of the first group are characterized by a monotonous change along the proton transfer coordinate. As representatives of this group, one can name the chemical shifts of heavy nuclei
δX and
δY and the spin–spin coupling constants
1JXH and
1JHY [
9,
10,
11,
12,
13]. Parameters from the second group exhibit extremal values for the shortest (strongest) hydrogen bond. As an example, one could mention the chemical shift of the bridging proton
δH or the spin–spin coupling constant
2hJXY, whose change along the proton transfer coordinate can be characterized by a bell-shaped curve [
3,
4,
5,
14,
15,
16,
17]. Parameters from the first group are preferable when solving the inverse spectral problem as their value unequivocally corresponds to a single geometry of a hydrogen bond. For parameters from the second group, there is an uncertainty that is caused by the fact that a single value of the parameter can be observed for two configurations of a hydrogen bond.
Despite the successful development of numerous methods of spectral diagnostics for estimating the geometry and strength of hydrogen bonds, there are some relevant issues that remain to be solved. For example, it is not known how the inverse spectral problem can be solved for systems with multiple mutually interacting hydrogen bonds, since the magnitude of each spectral parameter can be influenced by the presence of all hydrogen bonds simultaneously.
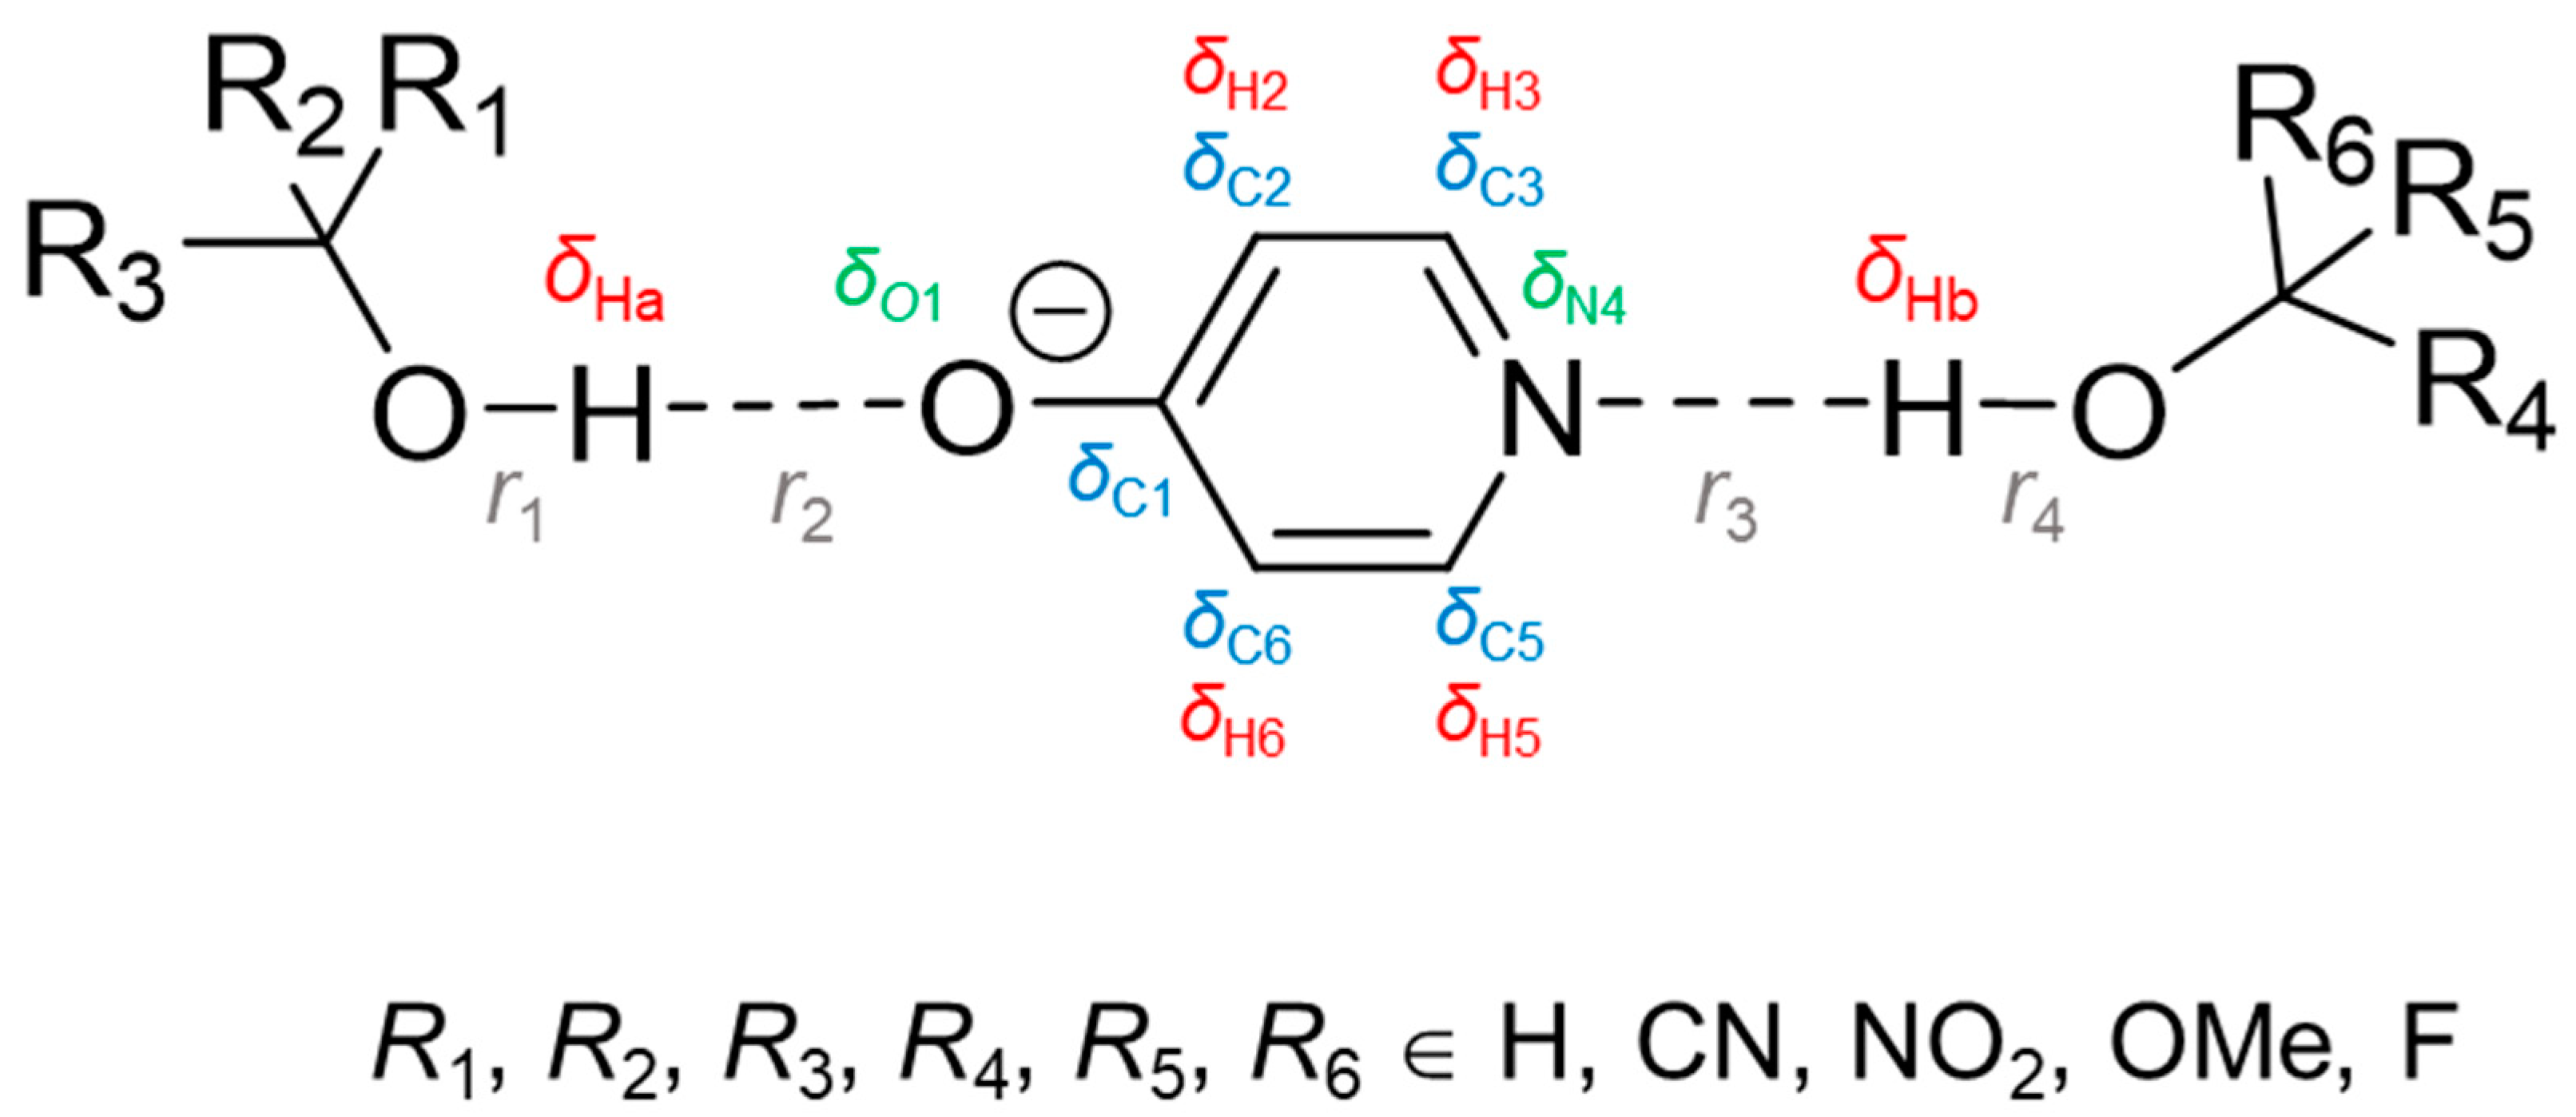
The aim of this computational work is to demonstrate the possibility of solving the inverse spectral problem for a system with two coupled hydrogen bonds, in particular, to find such pairs of spectral NMR variables that could be used for an unequivocal evaluation of geometries of a pair of mutually influencing hydrogen bonds. As a model system, we consider a 4-hydroxypyridine anion, which can form two hydrogen bonds as a hydrogen bond acceptor (from the oxygen and nitrogen side) with two substituted methanol molecules (
Figure 1).
Substitution was made by a subsequent replacement of hydrogen atoms by CN, NO
2, OMe or F groups. The resulting set of substituted methanols served as a source of proton donors of various strengths, regardless of their practical chemical stability.
Table 1 shows the pattern of substitution used within each of the four sub-series of complexes (full list of substituents can be found in
Table S1 in the Supporting Information). Together with the unsubstituted complex
R1 =
R2 =
R3 = H,
R4 =
R5 =
R6 = H, 61 complexes with two hydrogen bonds were considered in this work. In such systems, OHO and OHN hydrogen bonds can be of various strengths (from weak to moderate-strong, it is controlled by the choice of substituents). All hydrogen bonds are fairly linear (the range of OHO and OHN angles is 156°–179°, see
Table S1) and are formed along the direction of the lone pair localization on proton-accepting O and N atoms. The central 4-hydroxypyridine anion can be negatively charged (OH···O
−PyrN···HO), neutral (O
−···HOPyrN···HO or OH···OPyrNH···O
−) or even positively charged (O
−···HOPyrNH
+···O
−), depending on proton positions in hydrogen bonds. Therefore, such a choice of model systems is suitable for the investigation of complexes with two mutually influencing hydrogen bonds (OHO and OHN) in a wide range of hydrogen bond geometries formed by neutral or charged species. Throughout the work, parameters associated with the OHO hydrogen bond will be denoted with an index “a” and those of OHN—with an index “b”.
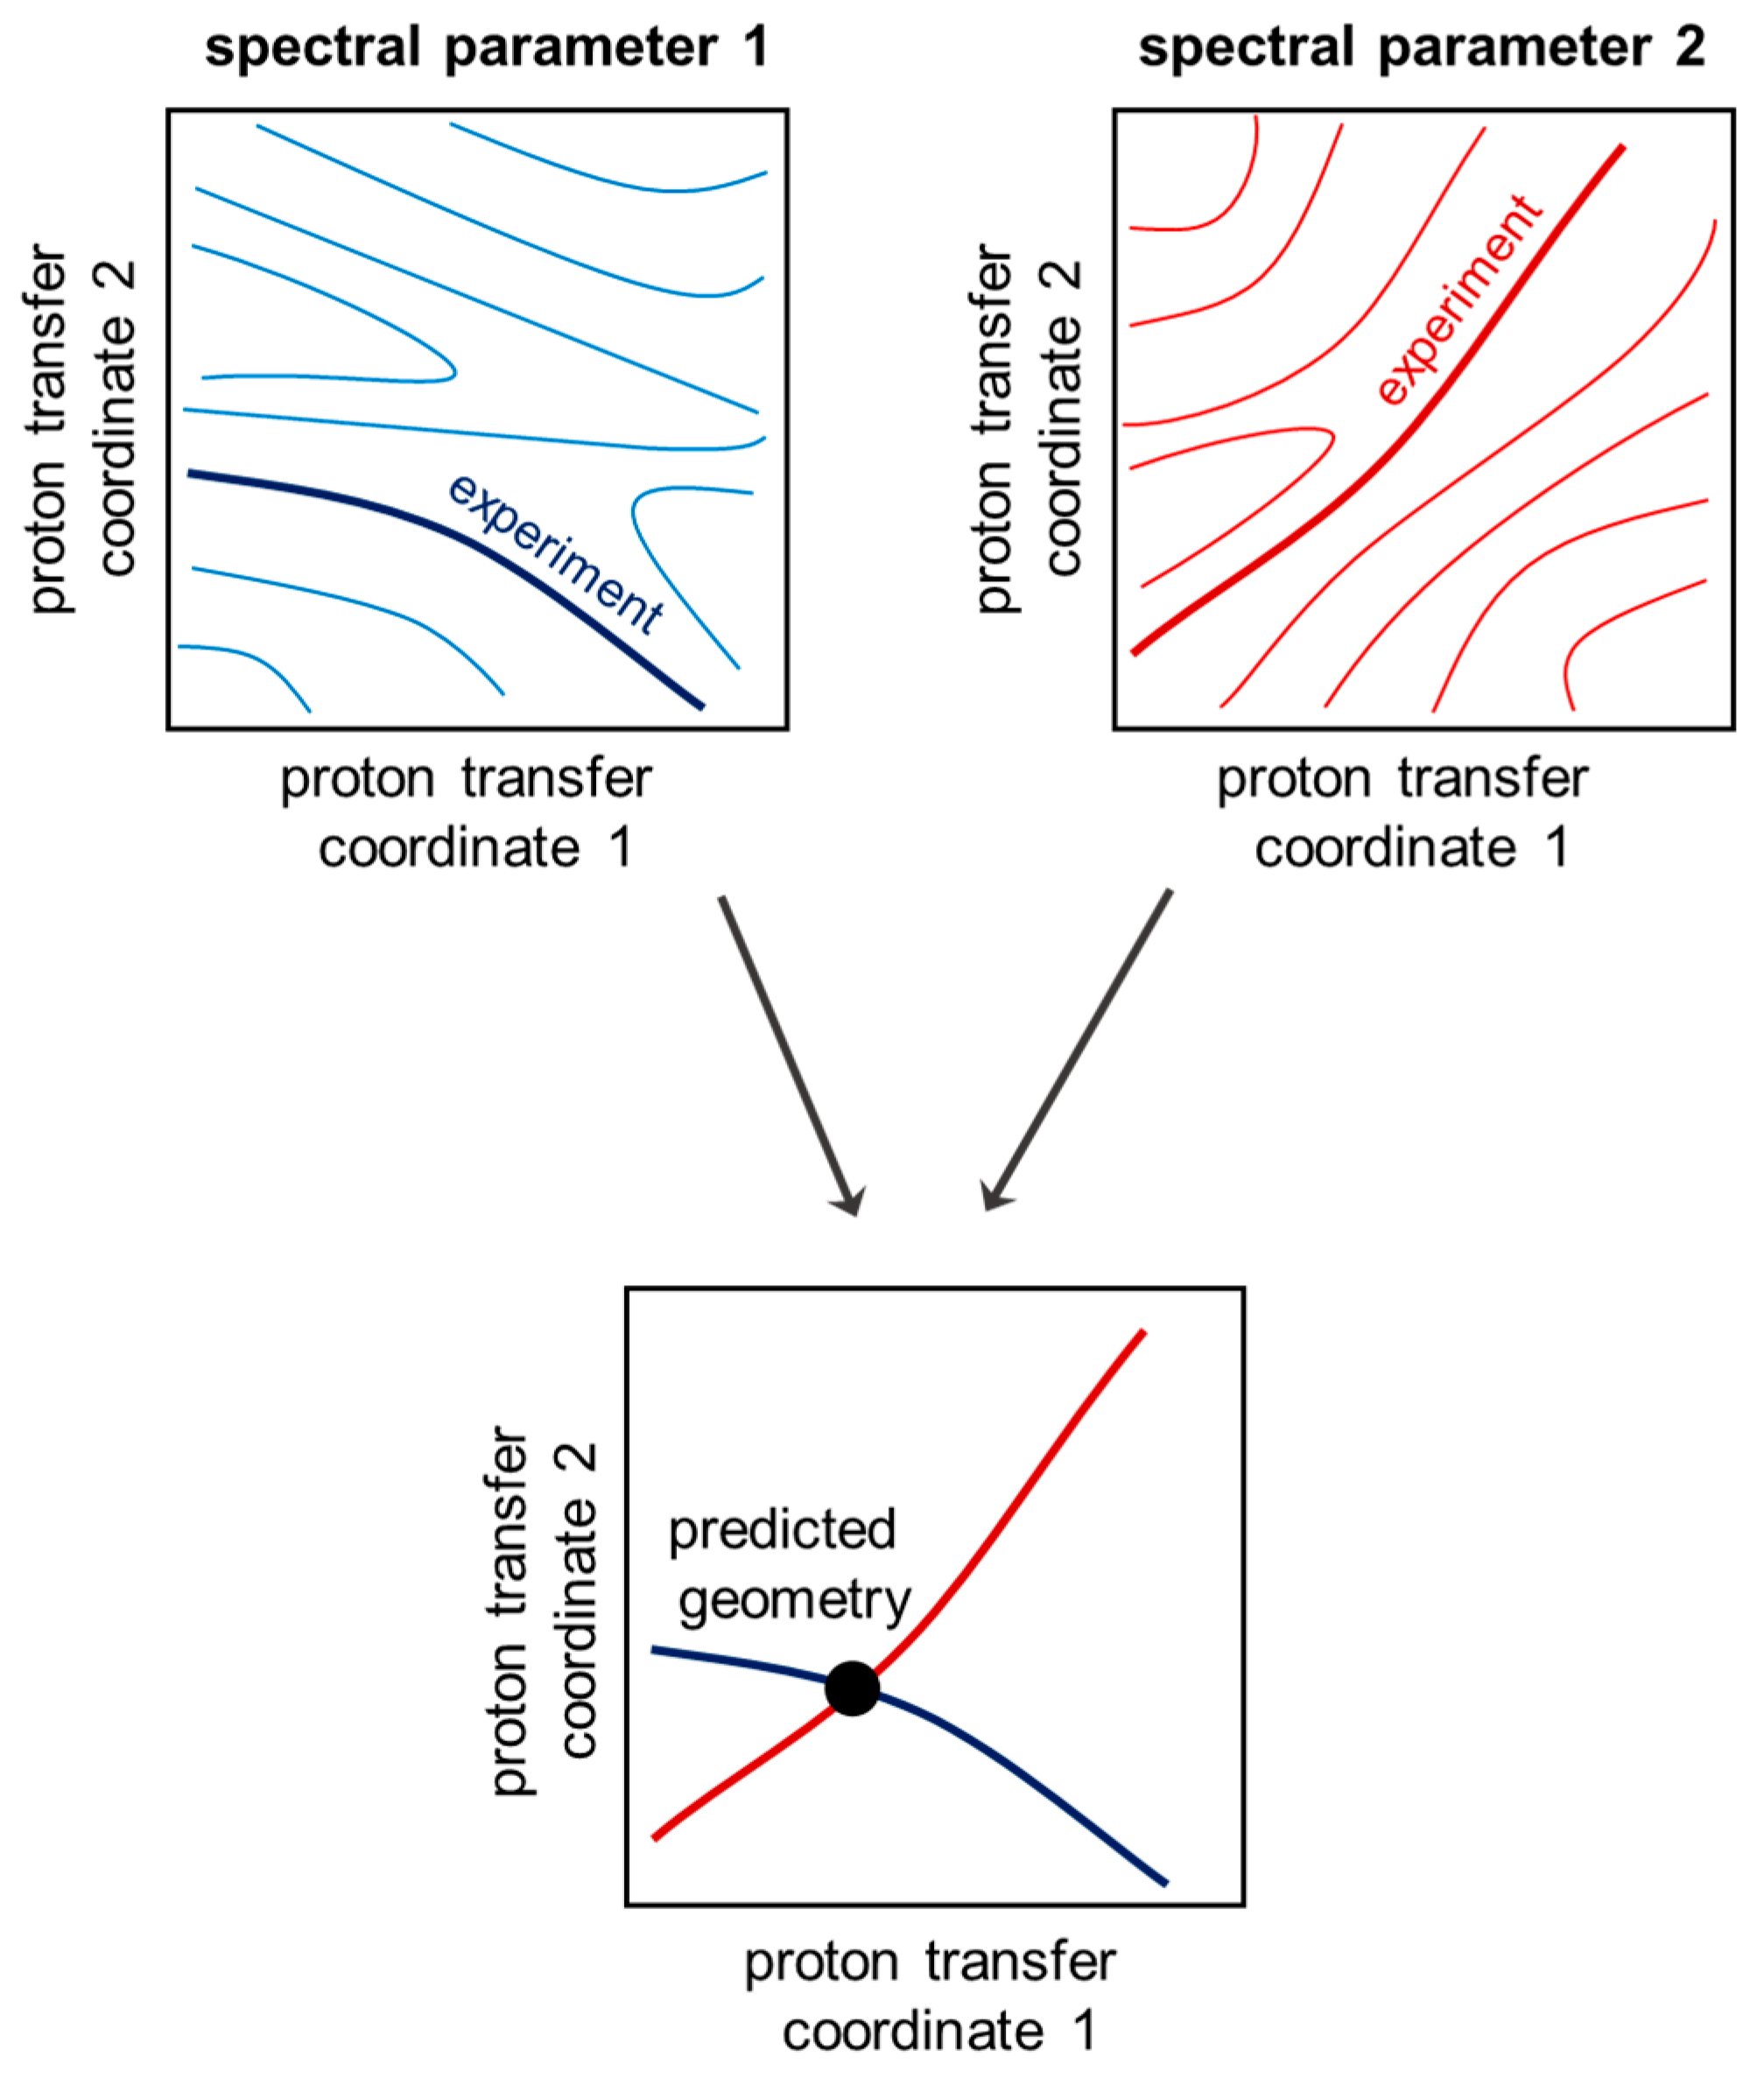
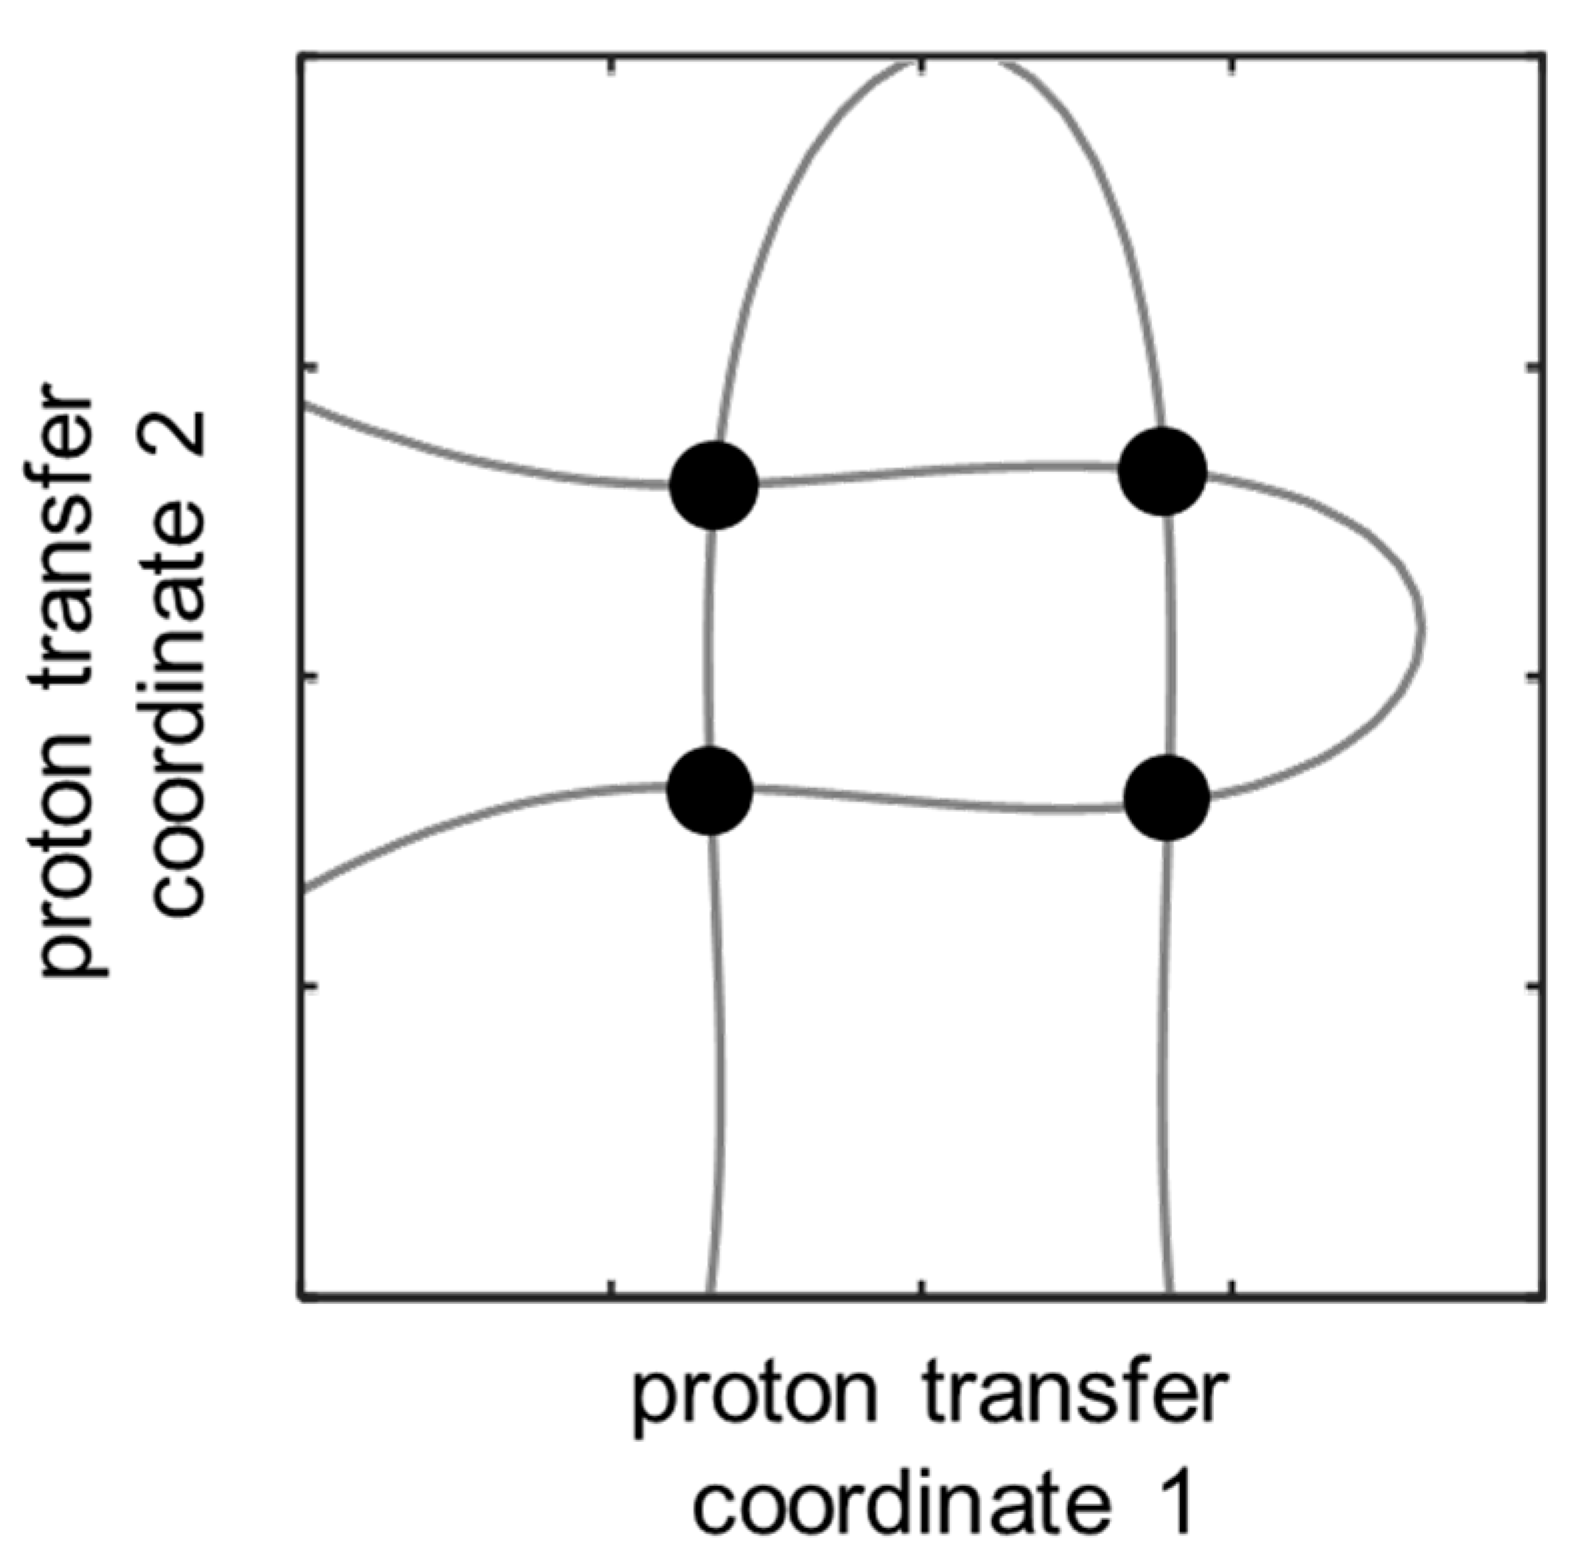
The proposed concept for simultaneous solution of the inverse spectral problem for both coupled hydrogen bonds is as follows. In order to determine the geometries of two hydrogen bonds, two spectral parameters are needed. A particular value of a chosen spectral parameter corresponds to multiple combinations of the two hydrogen bond geometries, forming an isoline on a distribution map of a spectral parameter as a function of two proton transfer coordinates (
Figure 2, top). However, if one measures two spectral parameters, the intersection of two isolines (
Figure 2, bottom) gives the geometry of the two hydrogen bonds in a coupled system. The case with a single intersection of two isolines is preferable and will be used in the following discussion as the criterion for a choice of spectral parameters for solving the inverse spectral problem.
2. Results and Discussion
The geometric parameters (interatomic distances
r1,
r2,
r3 and
r4) of hydrogen bonds in investigated complexes are collected in
Table S1. The set of complexes covers a wide range of hydrogen bonds geometries—there are complexes without proton transfer in both hydrogen bonds (OH···O
−PyrN···HO), complexes with proton transfer in one of the hydrogen bonds (O
−···HOPyrN···HO or OH···OPyrNH···O
−) and complexes with two hydrogen bonds with proton transfer (O
−···HOPyrNH
+···O
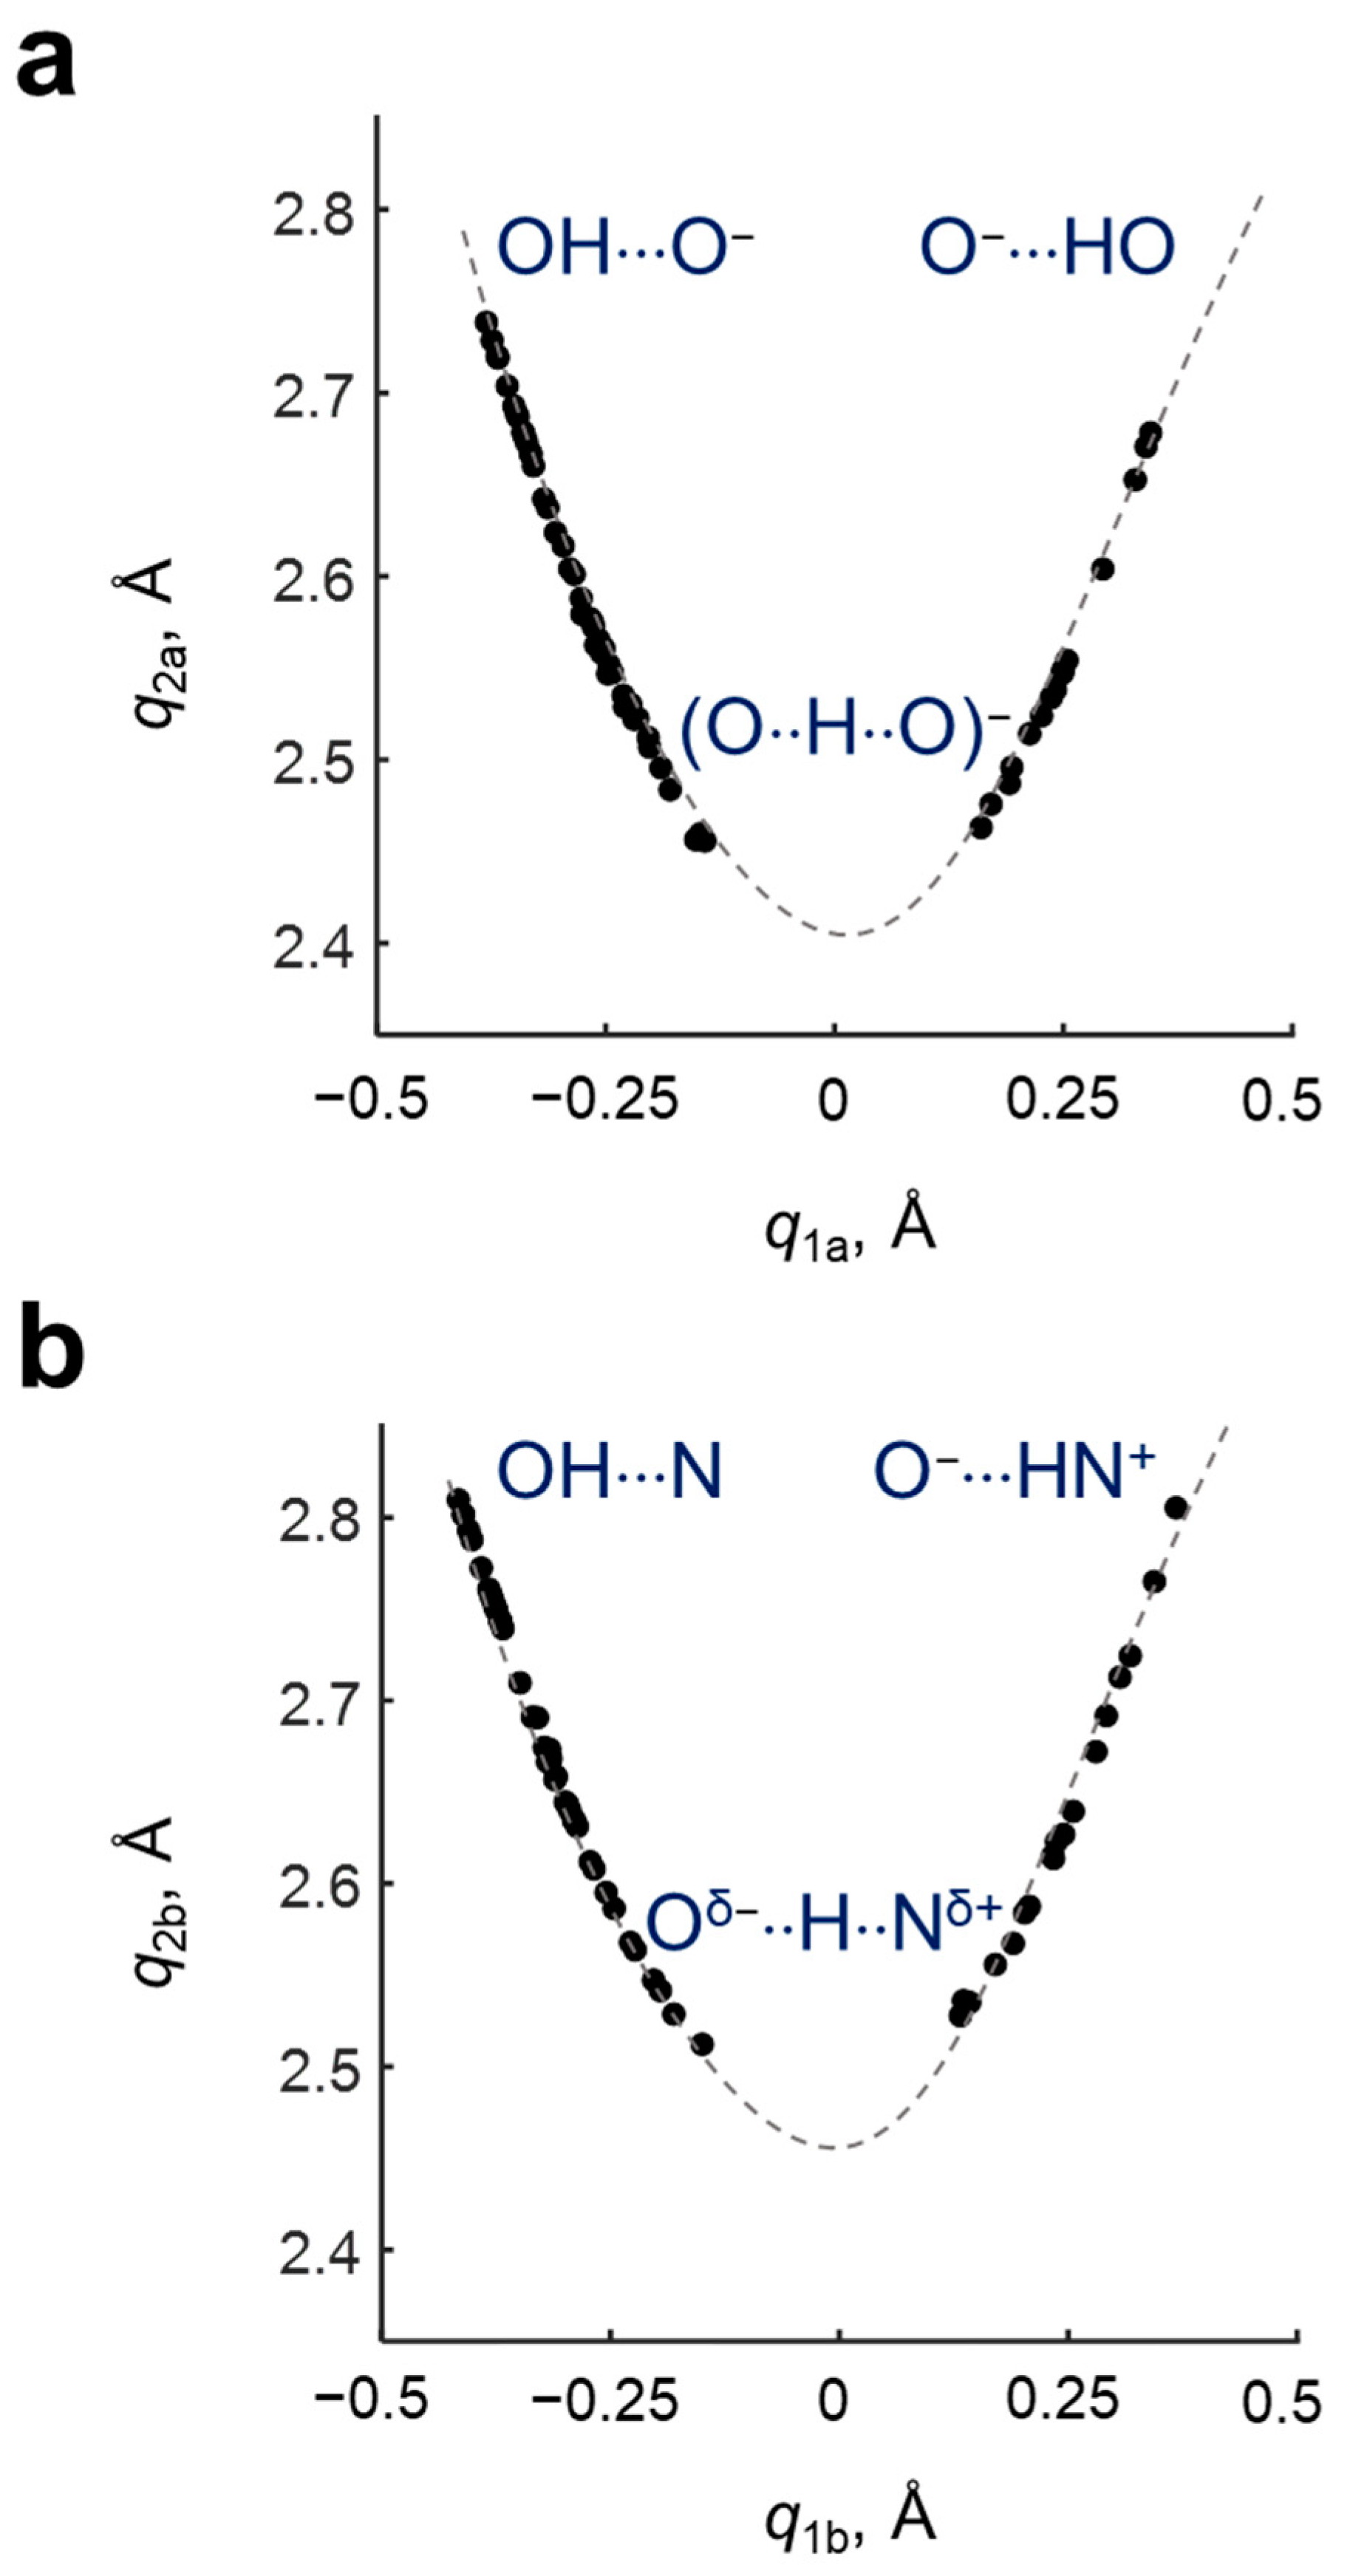
−). The dependencies of the
coordinate on
for the OHO hydrogen bond and the
coordinate on
for the OHN hydrogen bond are shown in
Figure 3. It is seen that the complexes cover a range of
q1 from ca. −0.4 to ca. 0.35 Å forming a parabolic curve.
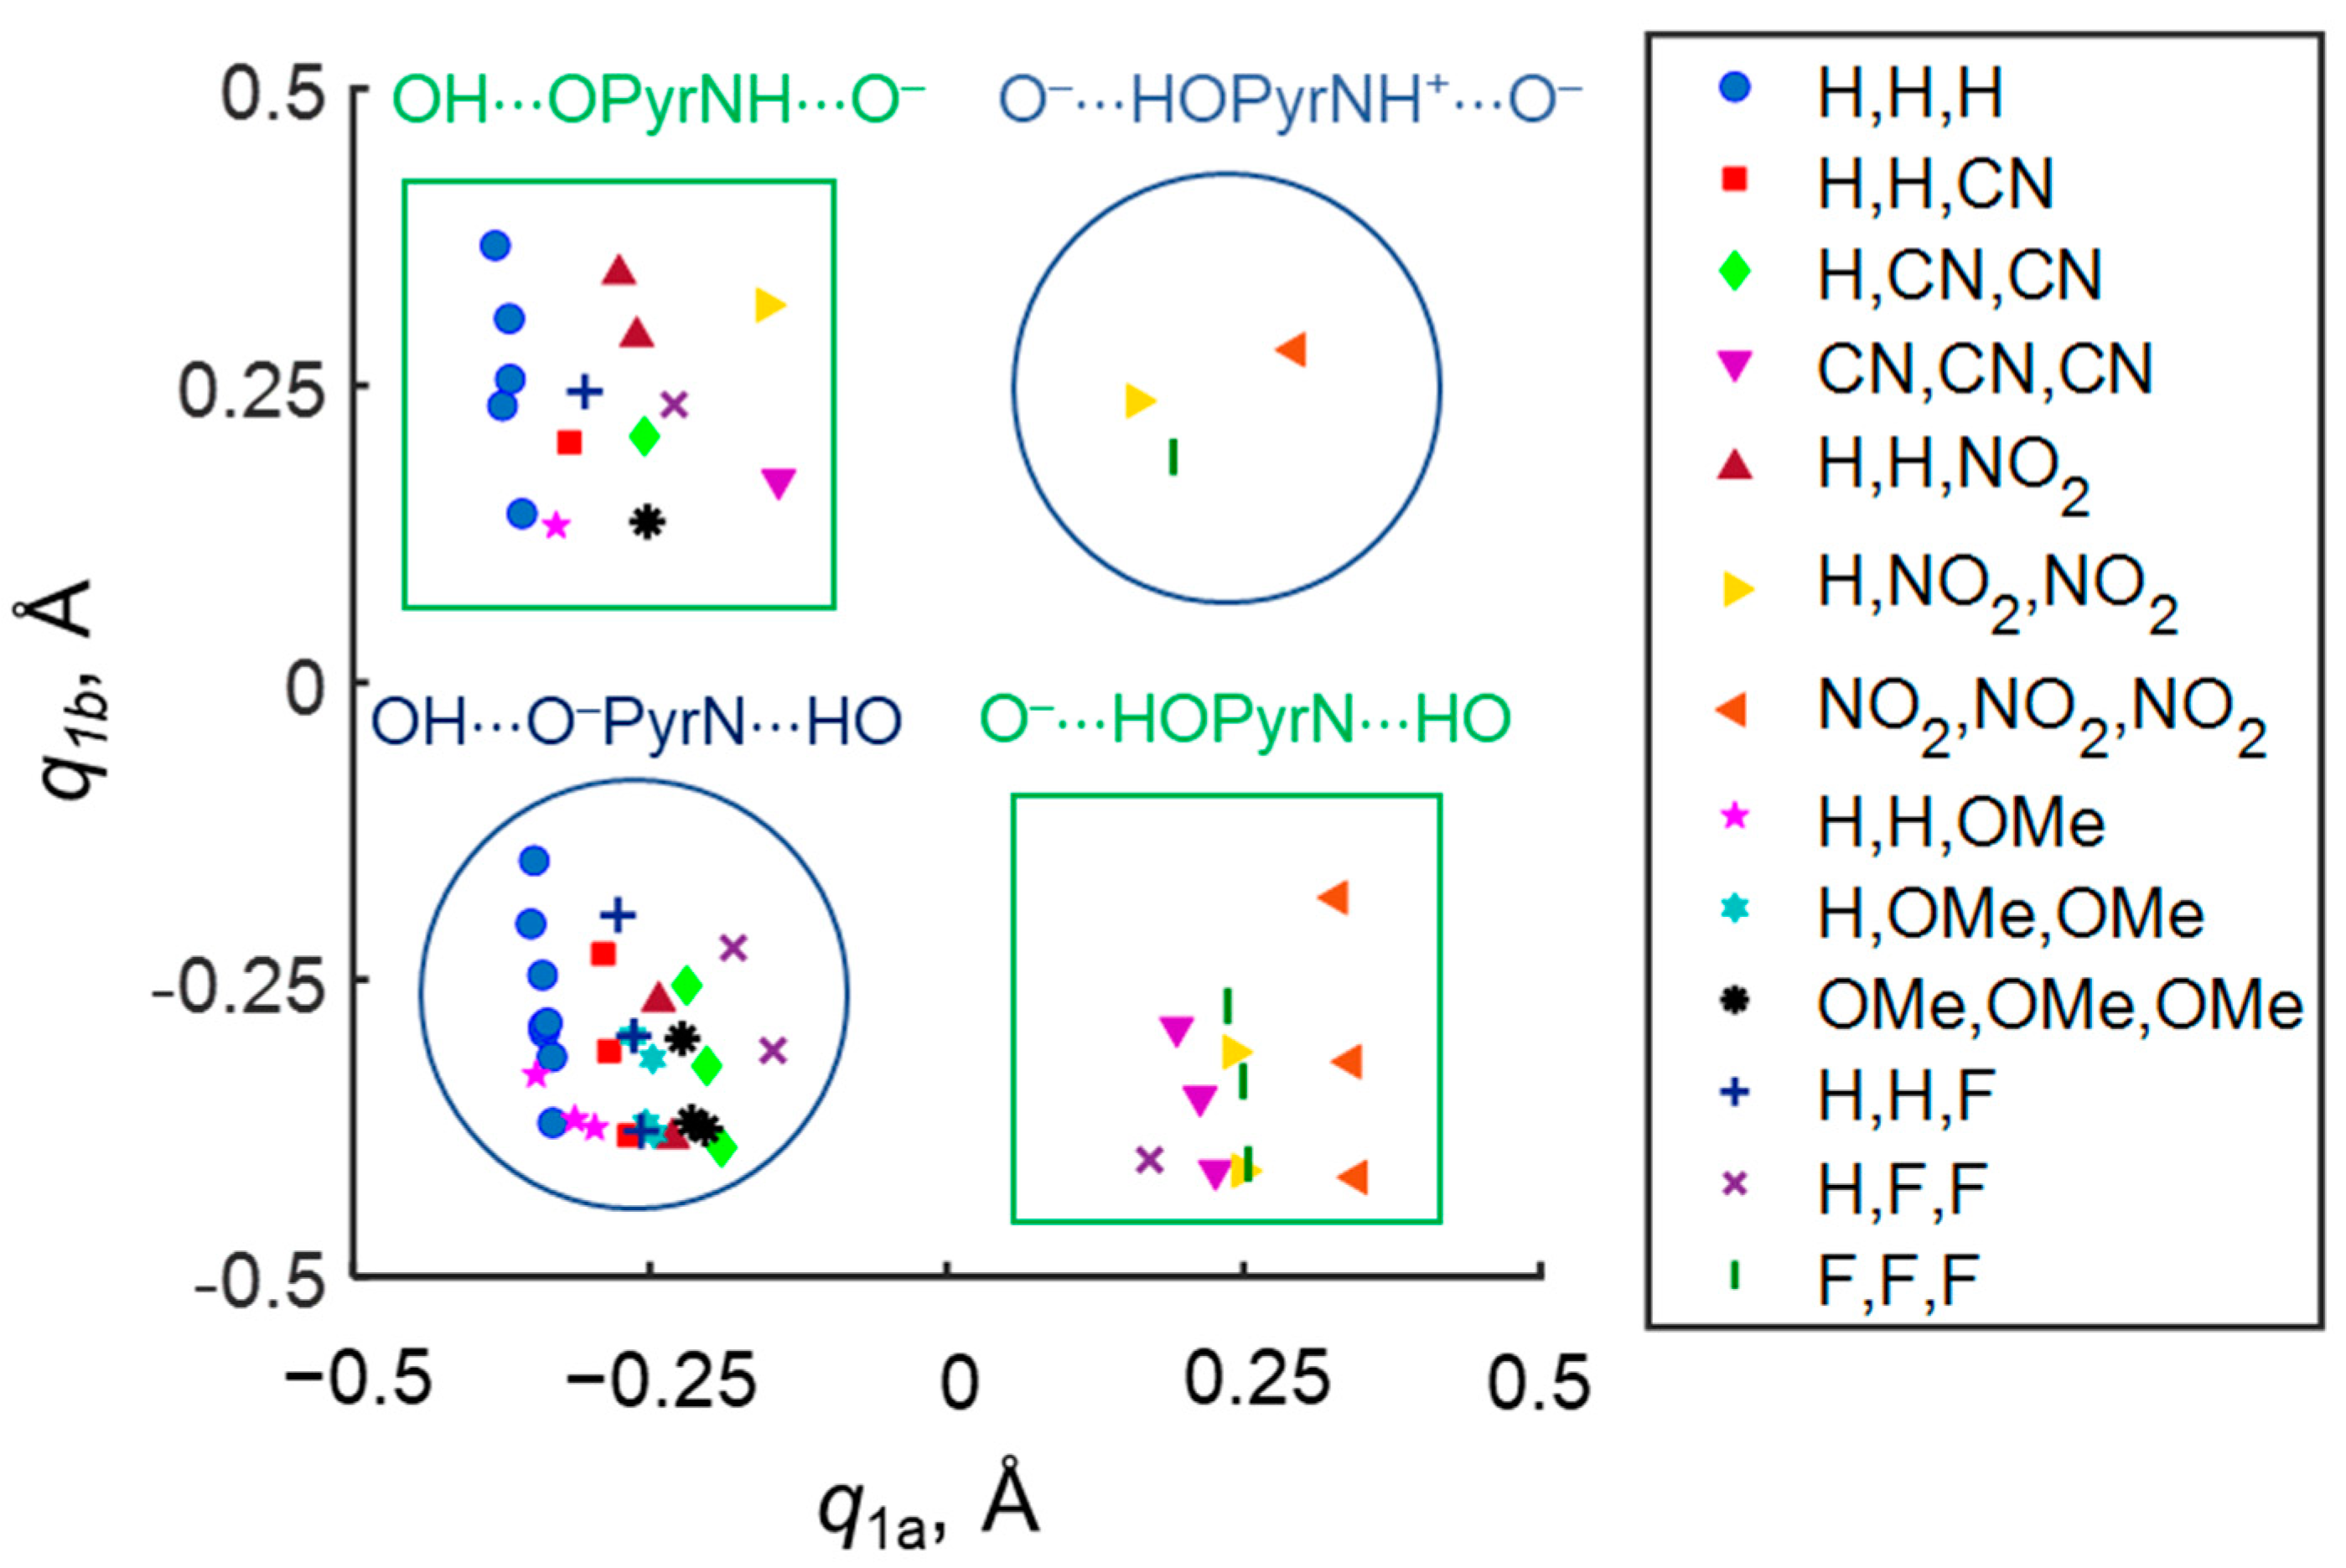
Despite the fact that OHO and OHN hydrogen bonds are divided in space by 4-hydroxypyridine anion, they “feel” the presence of each other through the electronic system of the complex as a whole, the phenomenon is called cooperativity. It manifests as the changes of the proton position in one hydrogen bond depending on the proton position in another hydrogen bond. For example, if one fixes the substituents R
1, R
2 and R
3 in the proximity of the OHO hydrogen bond (see a set of points of the same shape and color in
Figure 4), the variation of substituents in OHN hydrogen bond causes a change in
q1a. Complexes with a “tail-to-tail” (OH···O
−PyrN···HO) and a “head-to-head” (O
−···HOPyrNH
+···O
−) configuration are anti-cooperative (blue areas in
Figure 4): i.e., the strengthening of one hydrogen bond causes the weakening of another hydrogen bond. For complexes with “head-to-tail geometry” (O
−···HOPyrN···HO and OH···OPyrNH···O
−) (green areas in
Figure 4) cooperative effects are observed: i.e., the strengthening of one hydrogen bond causes the strengthening of another. Thus, the character of mutual influence of geometries of OHO and OHN hydrogen bonds in such a system can be either cooperative or anti-cooperative.
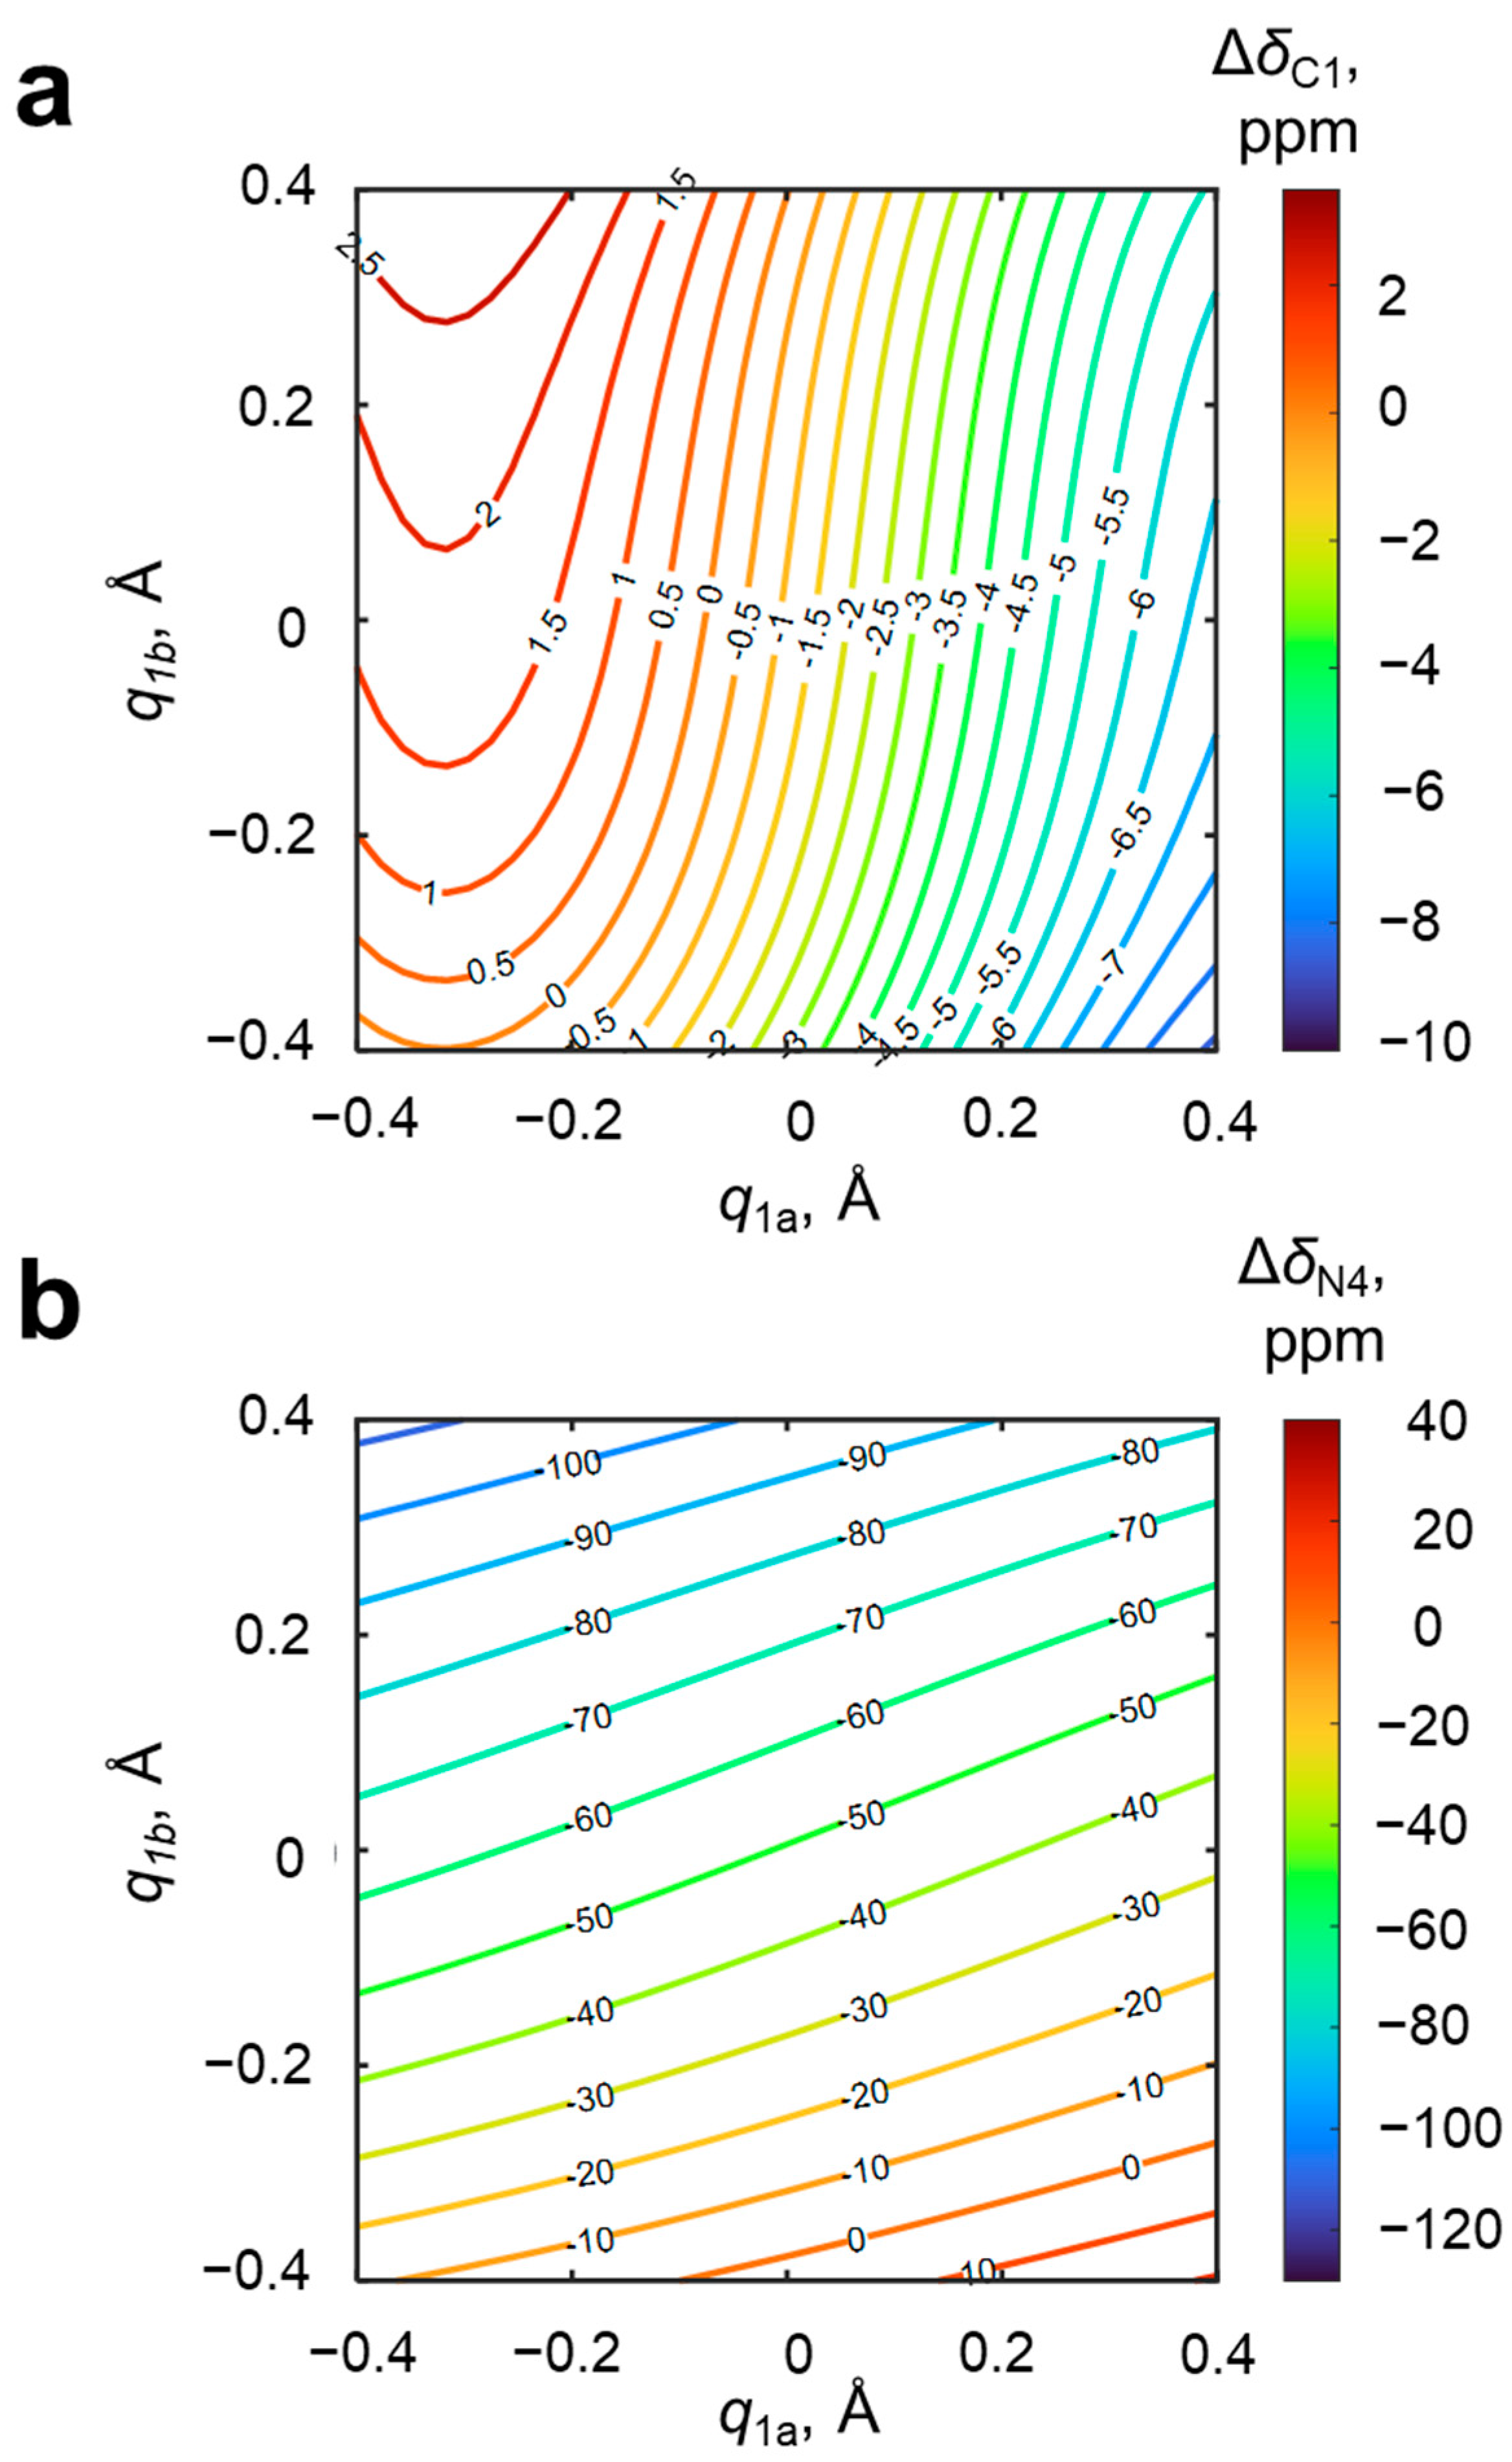
Among the NMR parameters of the 4-hydroxypyridine anion, which potentially are sensitive to the geometries of OH···O and OH···N hydrogen bonds, chemical shifts of the nuclei located in the proximity of hydrogen bonds, i.e., carbon (C1) and nitrogen (N4), are the first candidates. The changes of carbon and nitrogen chemical shifts upon complexation, Δ
δC1 and Δ
δN4, are shown in
Figure 5.
In
Figure 5, it is clearly seen that the C1 carbon chemical shift changes with the change of geometries of both hydrogen bonds—upon moving the bridging proton along OHO hydrogen bond (with fixed geometry of OHN hydrogen bond), Δ
δC1 changes by up to 8 ppm, and moving it along the OHN hydrogen bond causes a change of Δ
δC1 by up to 2.5 ppm. In other words, the steepness of the slope of the Δ
δC1(
q1a, q1b) surface is larger in the direction of
q1a than in the direction of
q1b. Contrarily, the nitrogen chemical shift is more sensitive to the geometry of the closest (OHN) hydrogen bond. The shape of the isolines of the distributions of Δ
δC1 and Δ
δN4 makes the unequivocal solving of the inverse spectral problem possible for most cases (except for
q1a ≈ −0.3 Å due to the shape of the Δ
δC1 isolines in this region caused by a presence of a hill with its maximal value). Together with the high sensitivity discussed above, this makes the pair Δ
δC1 and Δ
δN4 quite promising parameters. However, the experimental issues of measuring nitrogen chemical shift (low natural abundance of
15N and line broadening due to quadrupolar interactions in
14N NMR spectra) encourage us to discuss additional NMR parameters.
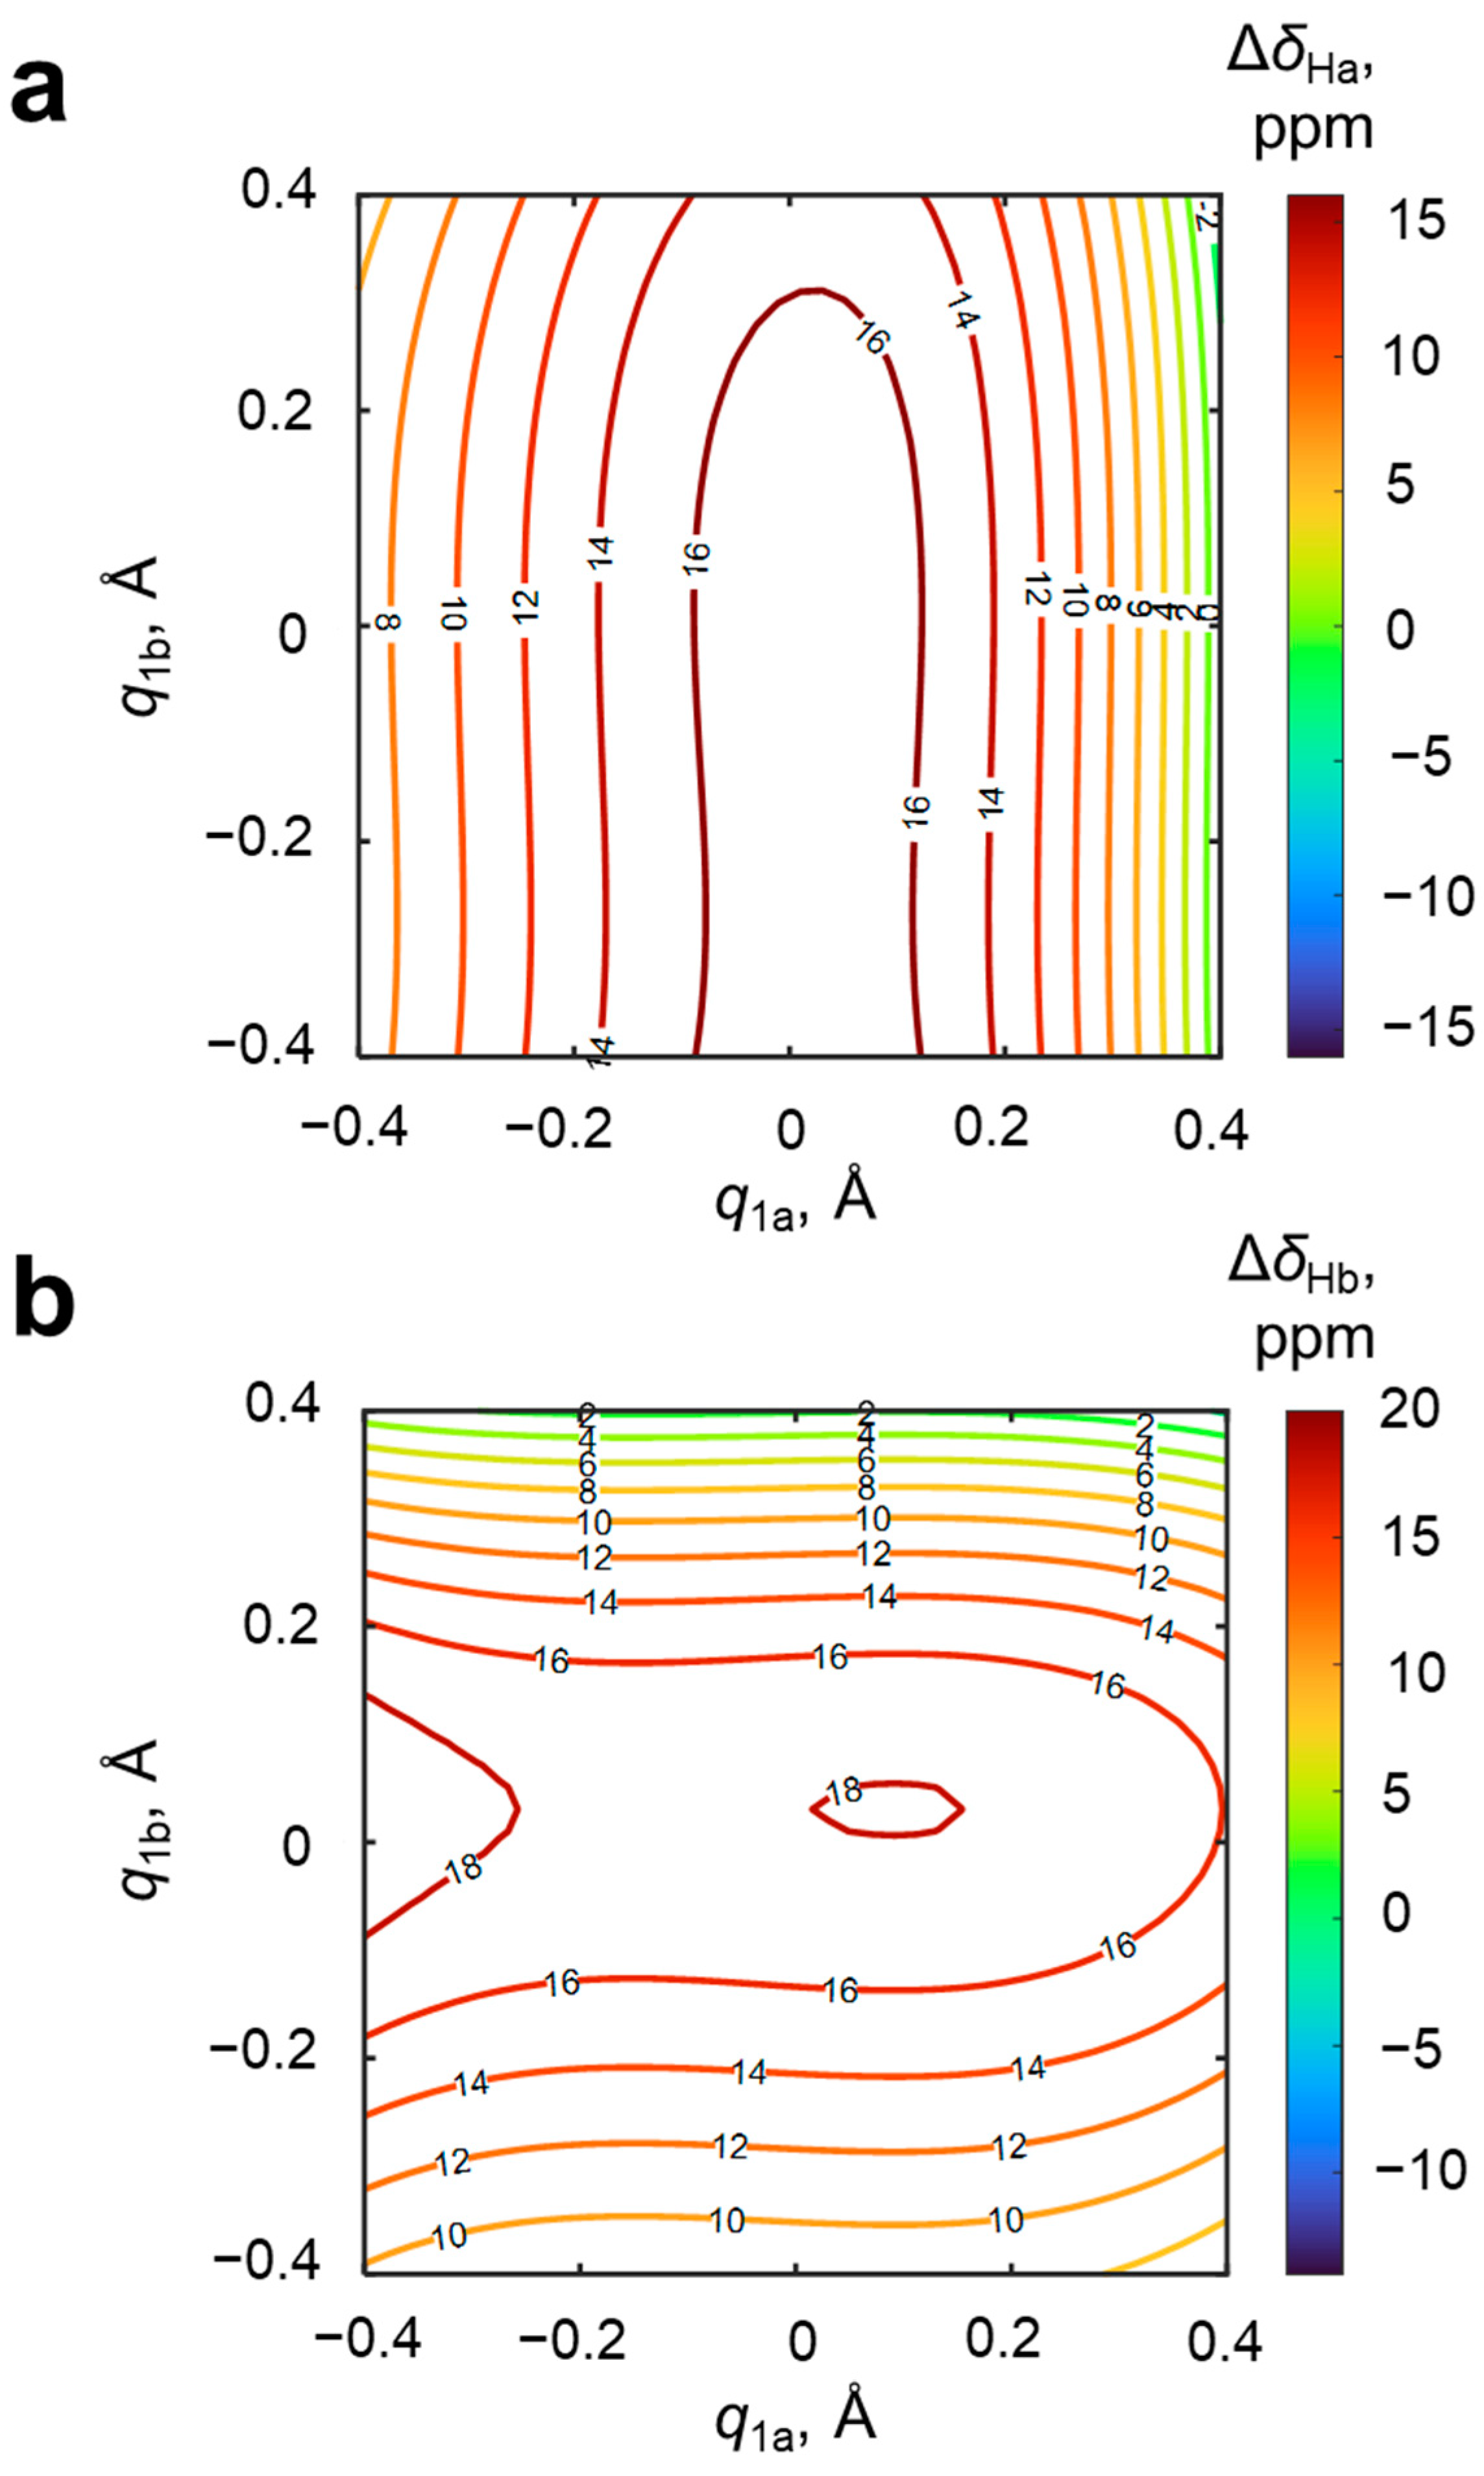
The next pair of “promising” NMR parameters are the changes of chemical shifts of bridging protons in the OHO and OHN hydrogen bonds upon complexation, Δ
δHa and Δ
δHb; their dependences on
q1a and
q1b are shown in
Figure 6. Along the OHO hydrogen bond, Δ
δHa increases from 8 to 17 ppm for
q1a < 0, reaches maximal value at
q1a ≈ 0 and then decreases to 0 ppm. The change of the geometry of the OHN hydrogen bond (
q1b) does not significantly influence Δ
δHa. A similar situation is observed for Δ
δ2b: moving along the OHN hydrogen bond (
q1b) changes Δ
δHb from 9 to 18 ppm for
q1b ≈ 0 and then down to 0 ppm. It is clearly seen that both surfaces have a hill of maximal values of Δ
δH and slopes in the direction of one of
q1 axes (
q1a for Δ
δHa and
q1b for Δ
δHb). It means that the magnitude of the bridging proton chemical shift in a given hydrogen bond is determined almost exclusively by the geometry and electronic features of the three atoms forming this bond. In other words, the chemical shifts of the two bridging protons are not coupled. For the purposes of solving the reverse spectral problem, this is an advantage, because the magnitude of each chemical shift can be used for the independent evaluation of hydrogen bond geometries.
However, there are two principal problems with such an approach. The first problem was mentioned in introduction and is caused by the fact that a particular value of one of the proton chemical shifts (Δ
δHa or Δ
δHb) corresponds to an isoline in distributions shown in
Figure 6a,b that form a hairpin curve. Two hairpin isolines have four intersecting points (see
Figure 7), i.e., each set of Δ
δHa and Δ
δHb values could correspond to four alternative hydrogen bond geometries. The second problem with using Δ
δHa and Δ
δHb for the evaluation of hydrogen bond geometries is due to the fact that, in the experimental spectrum, it is difficult to distinguish which signal will relate to the OHO and which to the OHN hydrogen bond. This issue demands the usage of additional NMR parameters, for example, chemical shifts of the nuclei of 4-hydroxypyridine.
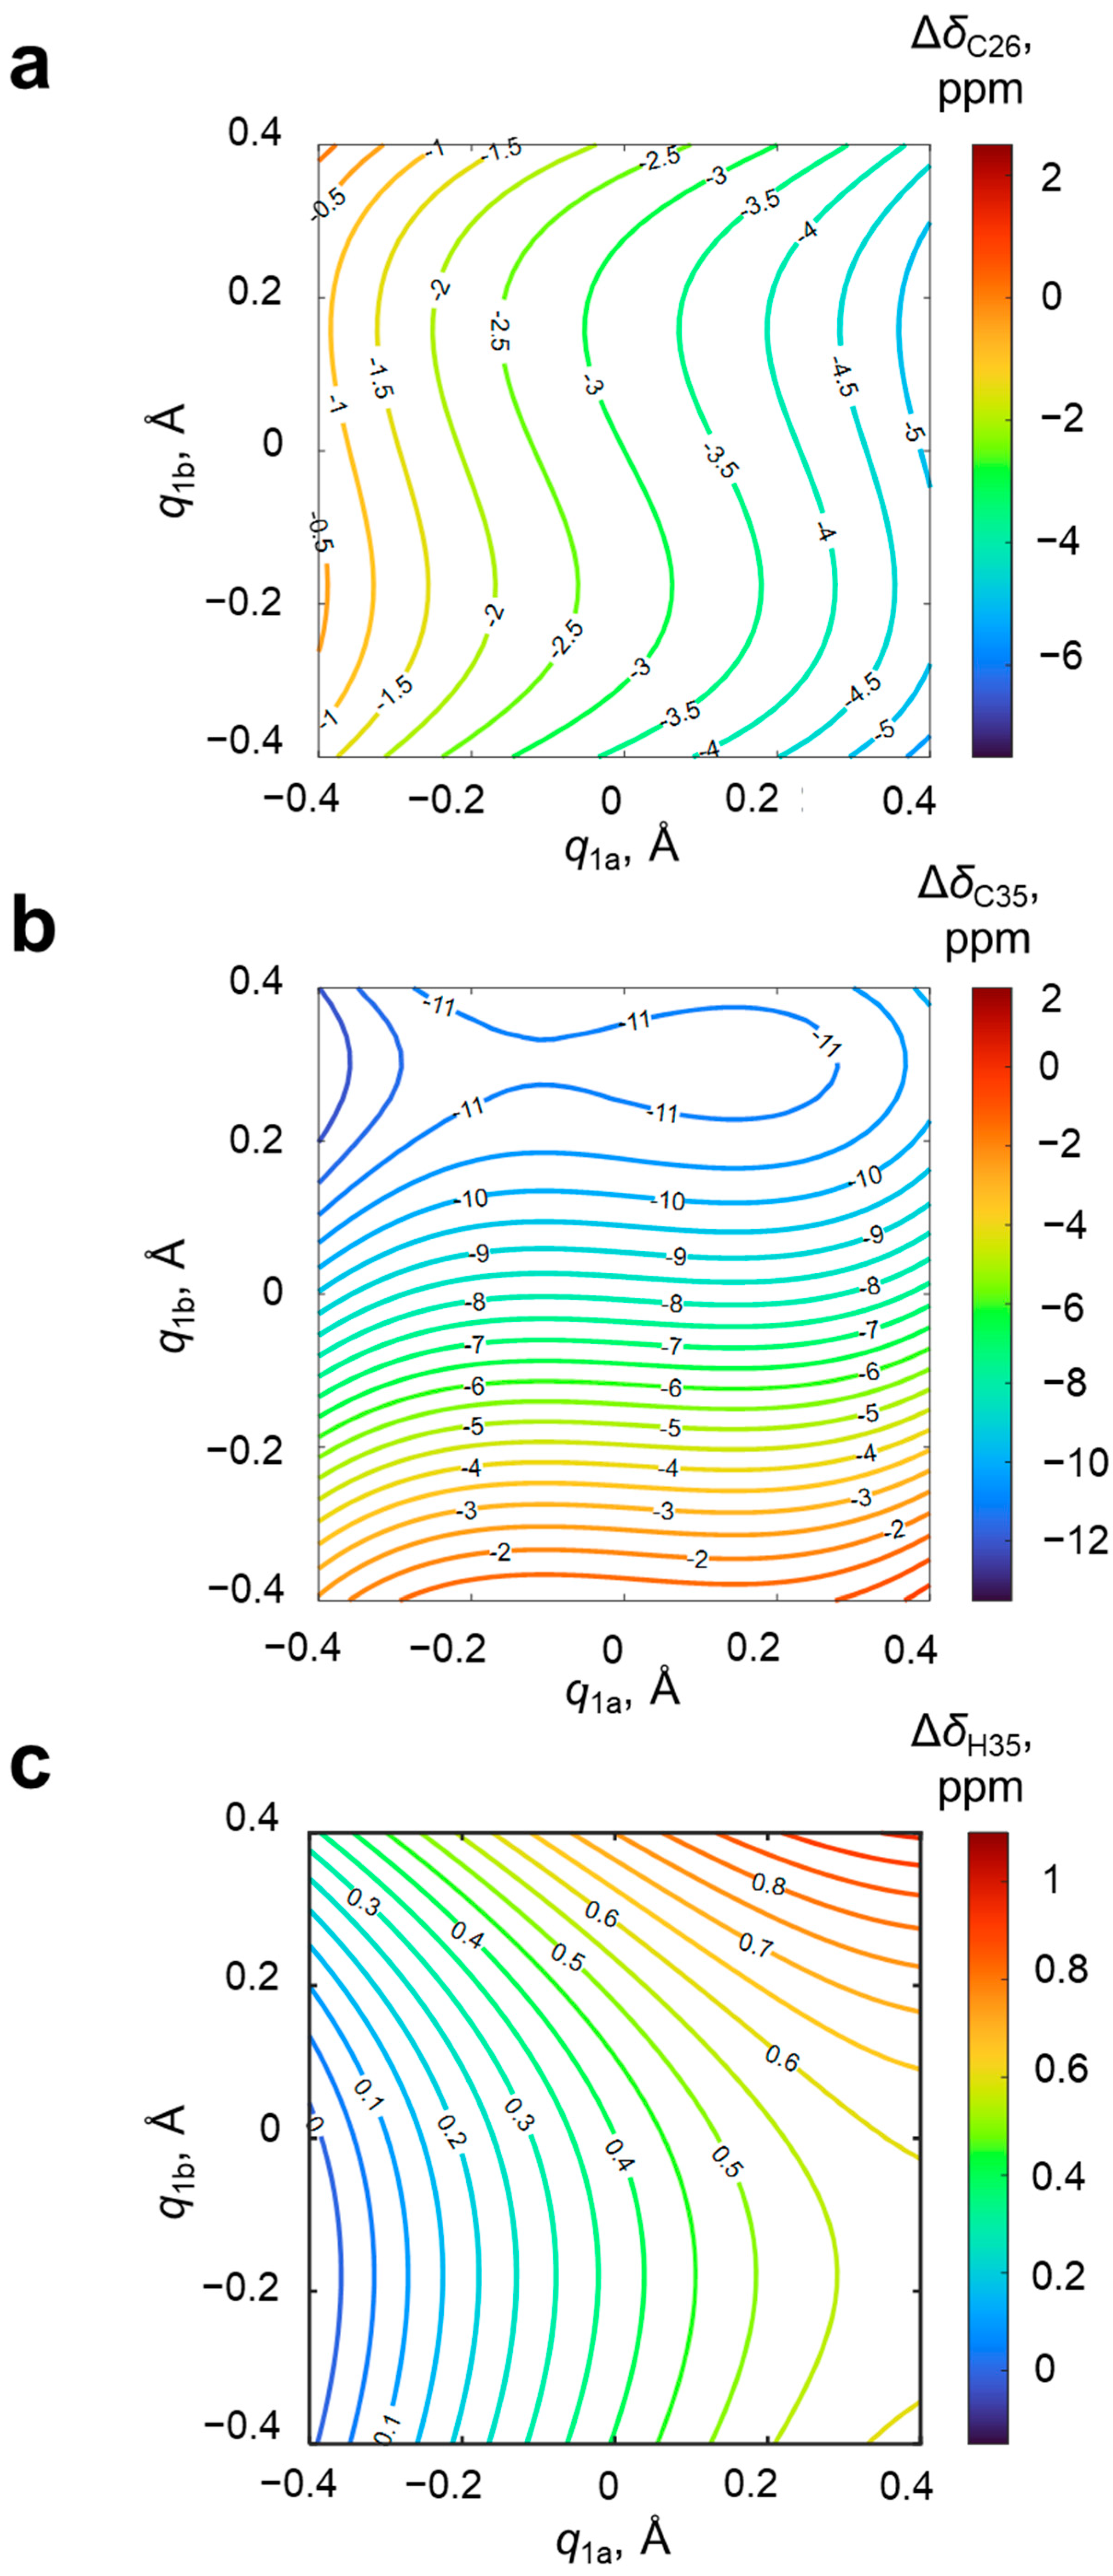
For an additional estimation of the mutual influence of OHO and OHN hydrogen bonds, calculations for two extra sets of systems with a single hydrogen bond were performed (4-hydroxypyridine anion with one substituted methanol from either the oxygen or nitrogen side, 10 complexes in each extra set). The results the of NMR calculations (
δC26 and
δC35) are presented in
Figures S1 and S2 of the Supporting Information. The difference plot between data shown in
Figure 8 (system with two coupled hydrogen bonds) and
Figures S1 and S2 (hypothetical system with no coupling between hydrogen bond modeled as a sum of systems with a single hydrogen bond) is shown in
Figure S3. It is clearly seen that the cooperativity effects on the NMR parameters are substantial (±2–4 ppm, making them non-negligible) and non-monotonous. The strongest effects are observed for the configuration O
−···HOPyrNH
+···O
−.
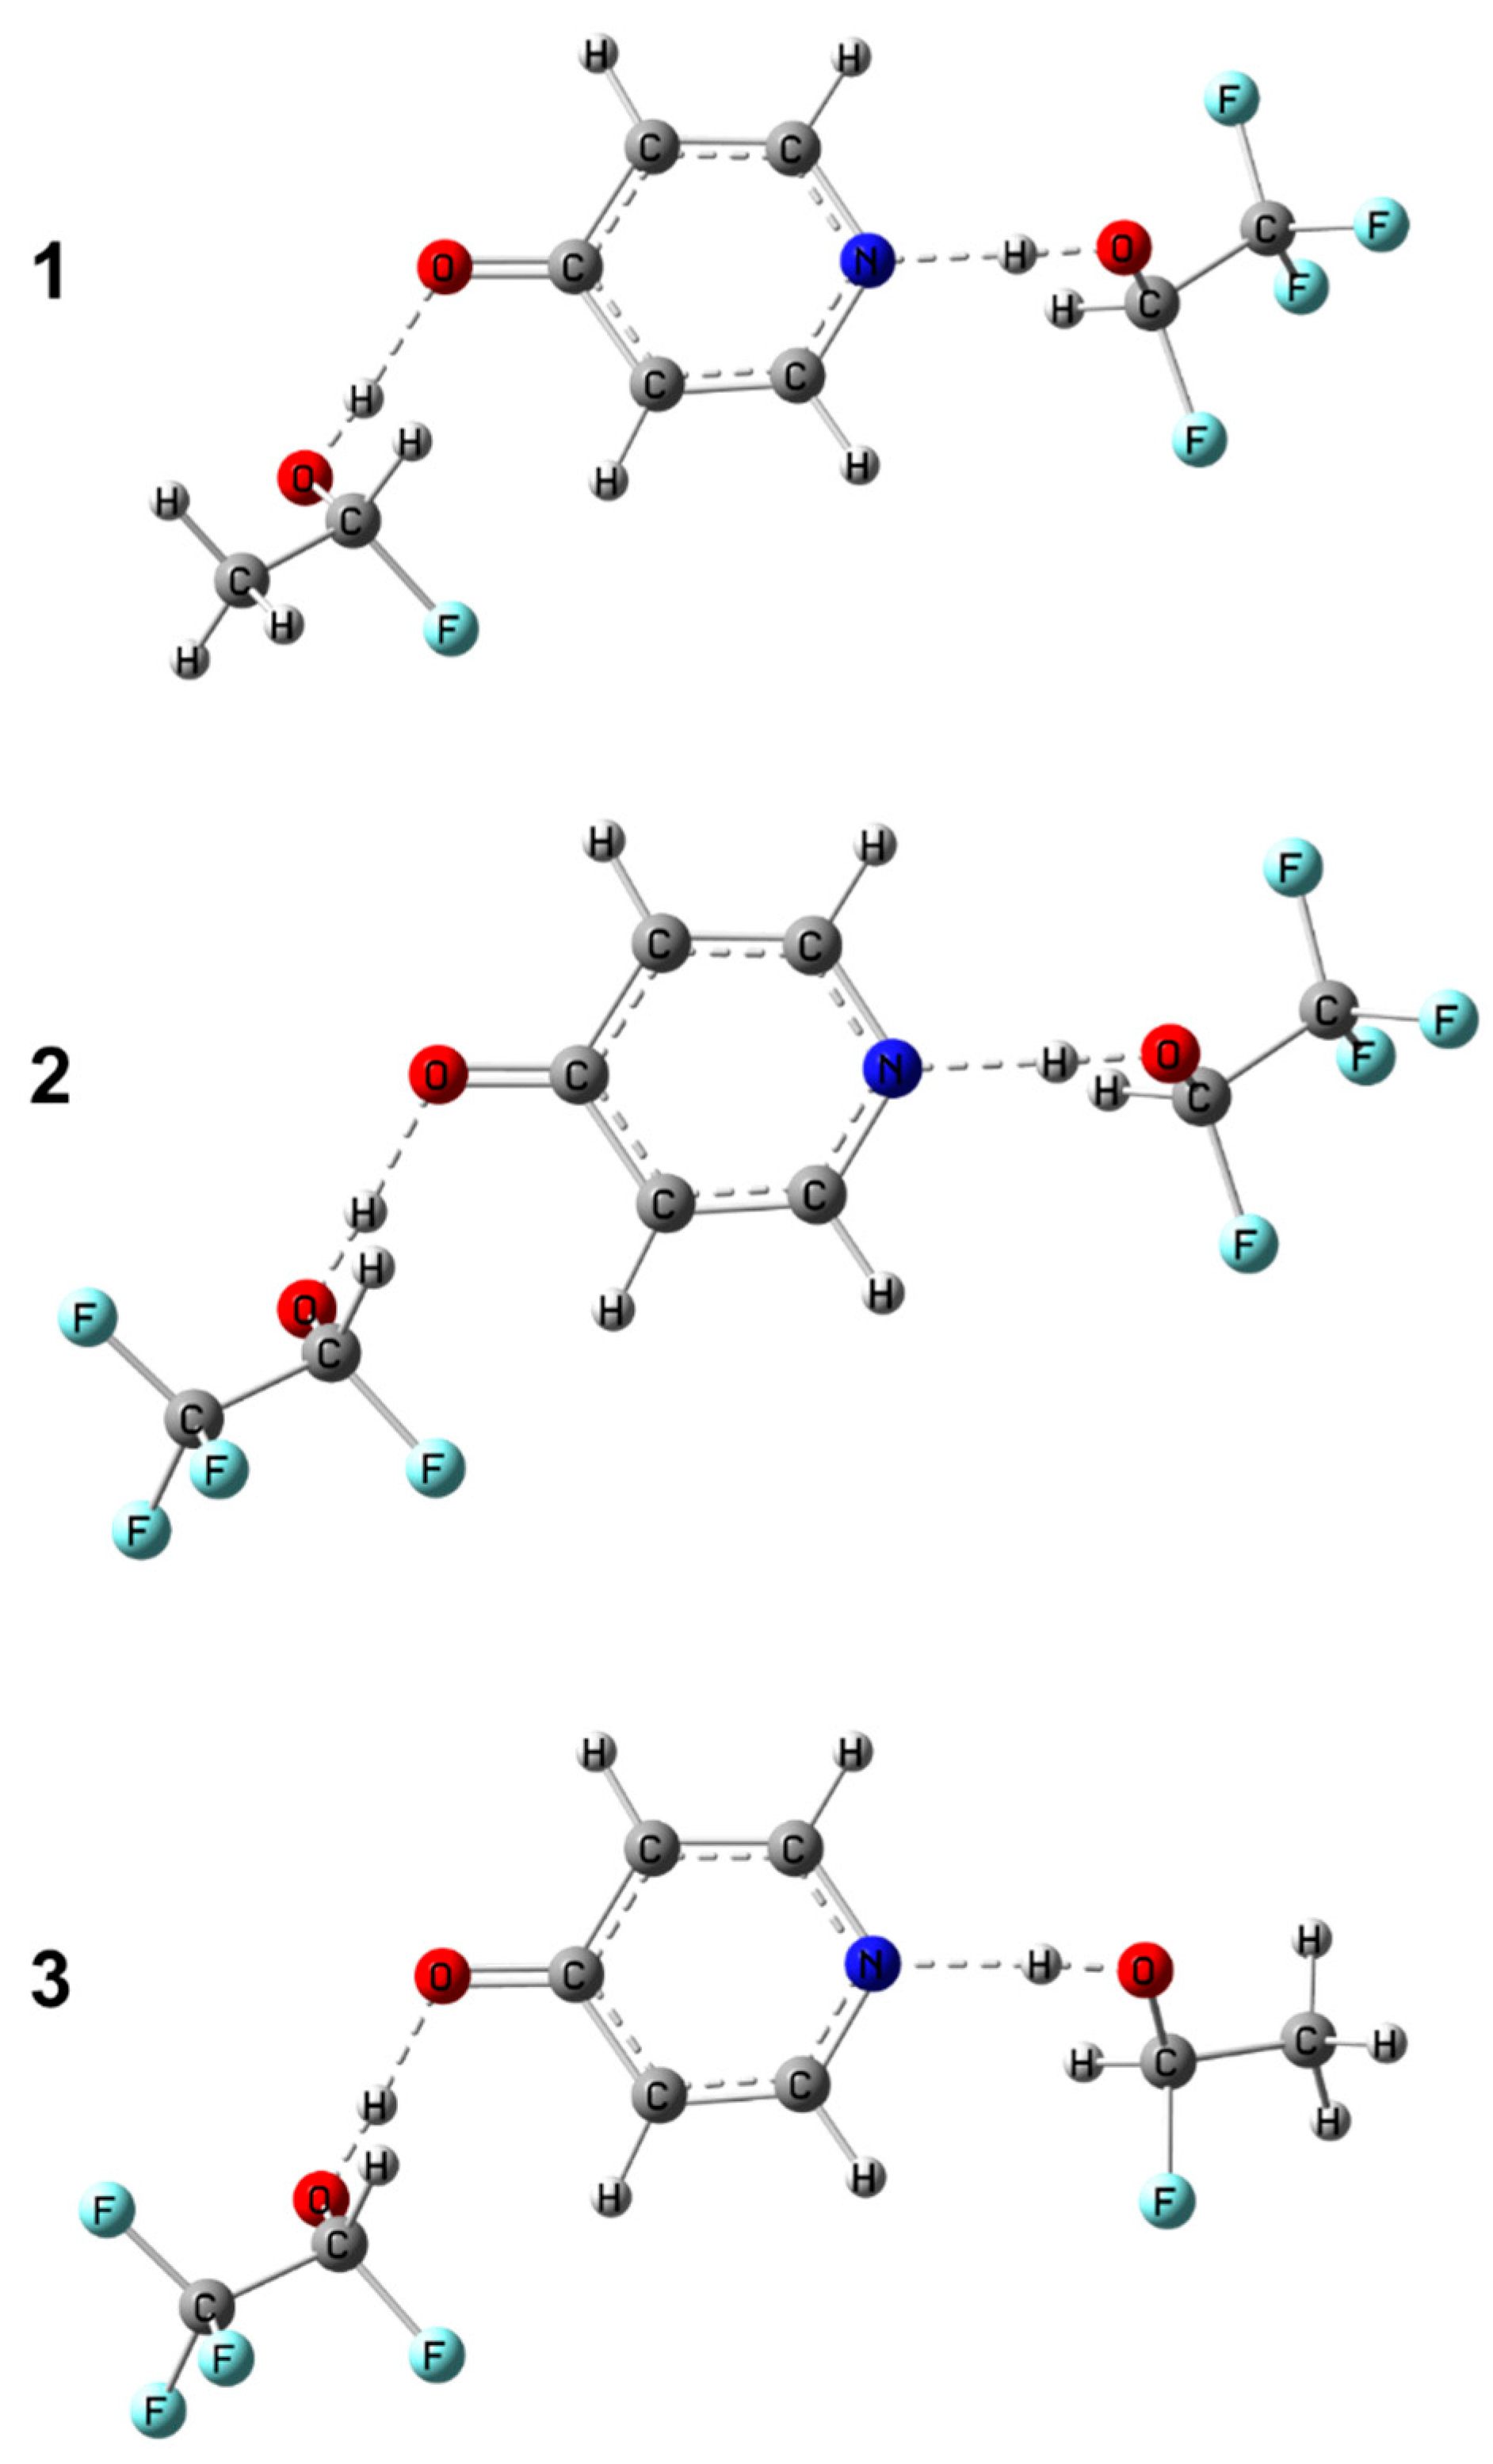
In order to test the approach proposed in this work, we performed additional calculations of structure and NMR parameters for three arbitrarily chosen complexes of 4-hydroxypyridine anion with CH
3CFHOH and CF
3CFHOH molecules:
1 (CH
3CFHOH···
−OPyrN···HOCFHCF
3),
2 (CF
3CFHOH···
−OPyrN···HOCFHCF
3) and
3 (CF
3CFHOH···
−OPyrN···HOCFHCH
3); the optimized structures of
1–
3 are shown in
Figure 9. The results of the comparison of the “predicted” geometry based on pairs of NMR chemical shifts and the “real” (calculated) geometries of the two hydrogen bonds are summarized in
Table 2 and shown in
Figures S4–S6 in the Supporting Information. It can be concluded that hydrogen bond geometries estimated using two-dimensional correlations differ from those directly calculated by quantum-chemical methods by not more than 0.04 Å. The only exception is complex
3 (CF
3CFHOH and CF
3CFHOH), for which the chemical shifts of carbons C2 and C6 differ significantly due to the presence of an additional hydrogen bond between the CH-group of the 4-hydroxypyridine anion and the fluorine atom of the substituted methanol (see
Figure S7). In this case, using the chemical shift of carbon atom not involved in additional hydrogen bonding instead of the arithmetically averaged chemical shift Δ
δC26 is more appropriate.
3. Computational Details
Geometry optimization was performed using second-order Moller–Plesset perturbation theory (MP2) [
12,
13] with Dunning’ correlation-consistent polarized double-ζ basis set with diffuse functions aug-cc-pVDZ [
14]. All calculated geometries were checked for the absence of imaginary frequencies. Chemical shieldings were calculated using DFT (B3LYP) with the augmented polarization consistent triple-ζ basis set aug-pcS-2, which is specially designed for the calculation of shieldings at the DFT level with a high accuracy [
18].
Calculations were carried out using the Gaussian16 software. Computational resources were provided by the Computer Center of Saint Petersburg University Research Park (
http://www.cc.spbu.ru/, accessed on 1 April 2020).
Visualization was performed in GaussView 6.0 and MATLAB 2021b software packages.
For the description of the geometries of OHO and OHN hydrogen bonds, the parameters
q1 and
q2 were used [
2,
16,
17]:
,
, where Y = O, N. The meaning of
q1 and
q2 coordinates is pretty clear for linear hydrogen bonds—the
q1 coordinate is the shift of the hydrogen atom from the hydrogen bond center, the
q2 coordinate is the total length of the hydrogen bond (for strictly linear hydrogen bonds,
q2 is the distance between the heavy atoms O...O or O...N; it should be noted that, as hydrogen bonds deviate from linearity,
q2 loses this geometrical meaning, because in this case
q2 is slightly longer than the distance O...O or O...N). For the OHO hydrogen bond, the following pair of coordinates was used
and
and for OHN, they were
and
respectively.
The algorithm of construction for the distributions of spectral parameters (Δ
δC1, Δ
δN4 and others discussed in this work) along the
and
was as follows. For a set of complexes shown in
Figure 1, NMR parameters were calculated. Let us denote the spectral parameter as
f. The value of a change of a spectral parameter upon complexation is defined as
(where
is the value of a given spectral parameter for an isolated 4-hydroxypyridine anion or methanol, and
is the value of the same parameter within a hydrogen-bonded complex). Calculated Δ
f values were approximated as a function of
and
using the Curve Fitting Tool implemented in the MATLAB 2021b software package by a polynomial function of a third-degree along
and
without cross-terms:
The coefficients
a,
b1,
c1,
d1,
b2,
c2 and
d2 for all discussed parameters and the coefficient of determination
R2 for each approximation are given in
Table S2 in the Supporting Information. The resulting functions were plotted as contour plots, in which each isoline corresponds to the particular value of Δ
f and is marked by a color and an isovalue for clarity in the following figures. The polynomials were taken as one of the simplest forms that could describe the strongly non-monotonous behavior of spectral parameters. There is no deeper reason for this choice, and for the fitting purposes, other functions could be selected if the data points would allow doing so.
4. Conclusions
In this work, the possibility of solving the inverse spectral problem for a system with two coupled hydrogen bonds was demonstrated on the example of 61 complexes formed by 4-hydroxypyridine anion with two substituted methanols with OHO and OHN hydrogen bonds. The algorithm for using two-dimensional correlations is as follows: for measured or calculated change of two given spectral parameters, one should find isolines on their corresponding plots and overlap them (see
Figure 2). The coordinates of the intersection point of the two isolines will give the proton positions in both hydrogen bonds. It was demonstrated that any pair of parameters Δ
δN4, Δ
δC1, Δ
δC26, Δ
δC35 and Δ
δH35 is suitable for the evaluation of hydrogen bond geometries. However, Δ
δC1, Δ
δC26, Δ
δC35 and Δ
δH35 are more easily available from an experiment.
Thus far, we have only tested our approach computationally on three examples of complexes. The applicability of the method “in practice” awaits experimental verification by future researchers. Indeed, the proposed approach has obvious limitations. Firstly, such 2D maps are constructed for each compound individually (in our case for 4-hydroxypyridine anion). Secondly, the experimental application of the approach requires the measurements of signals that are not averaged out by fast (in the NMR time scale) molecular exchange—a condition that is not necessarily satisfied for intermolecular complexes. The coexistence of several types of molecular complexes in a solution at the same time can also complicate the solving of the reverse spectral problem. Thirdly, the accuracy of the 2D chemical shift maps worsens in the presence of additional non-covalent interactions between the proton donors and the central proton-accepting molecule. Fourthly, for other systems, multiple extrema in the 2D maps of spectral parameters can make determination of hydrogen bonds geometries non-unequivocal, as shown in
Figure 7. An unfortunate combination of all four factors could, of course, render the proposed approach totally unreliable. Nevertheless, we have shown in principle that, for systems where these limitations are absent or can be neglected, the NMR spectral data can be sufficient to solve the two-dimensional reverse spectral problem even with a significant entanglement of spectral parameters.
The accuracy of geometry estimations with this approach for systems with two OHO and OHN hydrogen bonds (and without additional interactions) is in the range ±0.04 Å.


