
Classification of Honey Powder Composition by FTIR Spectroscopy Coupled with Chemometric Analysis

 ,
,  ,
,  ,
,  ,
,  ,
, 
Abstract
:1. Introduction
2. Materials and Methods
2.1. Materials
2.2. Feed Solutions Preparation and Spray Drying
2.3. ATR-FTIR Measurement
2.4. Chemometrics Analysis
2.4.1. Principal Component Analysis (PCA)
2.4.2. Hierarchical Clustering Analysis (HCA)
2.4.3. Linear Discriminant Analysis (LDA)
2.4.4. Partial Least Squares-Discriminant Analysis (PLS-DA)
3. Results and Discussion
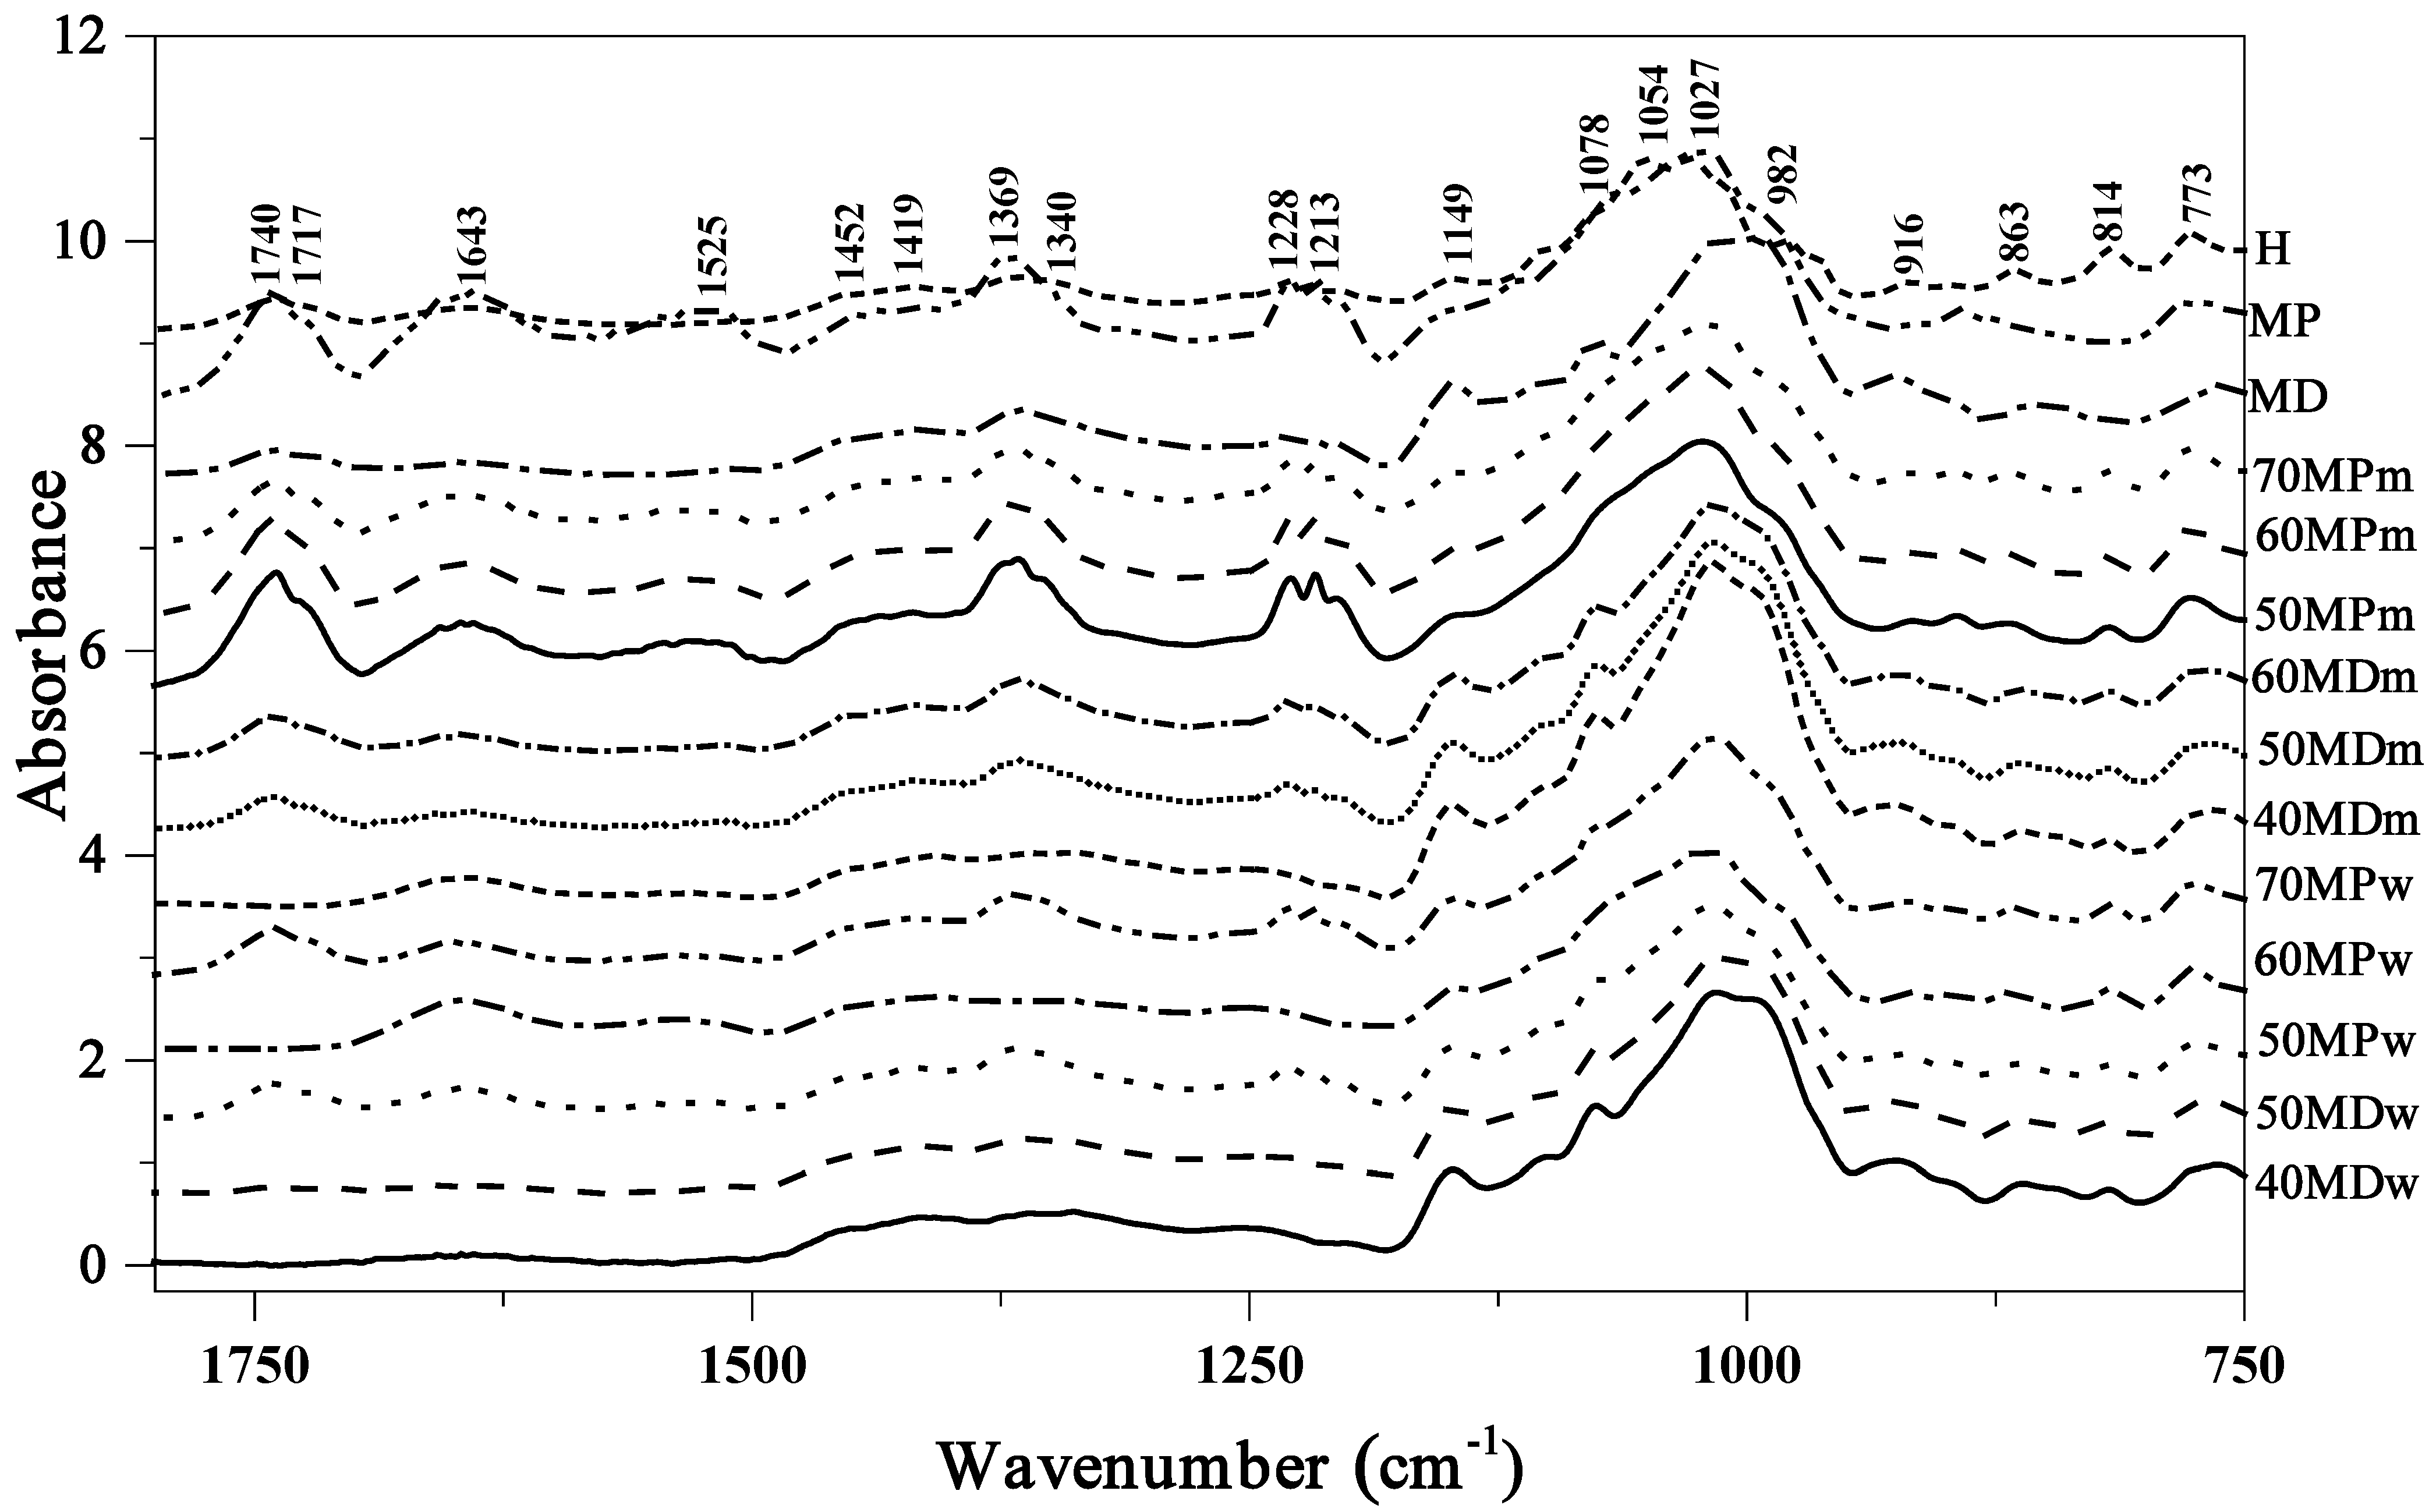
3.1. FTIR
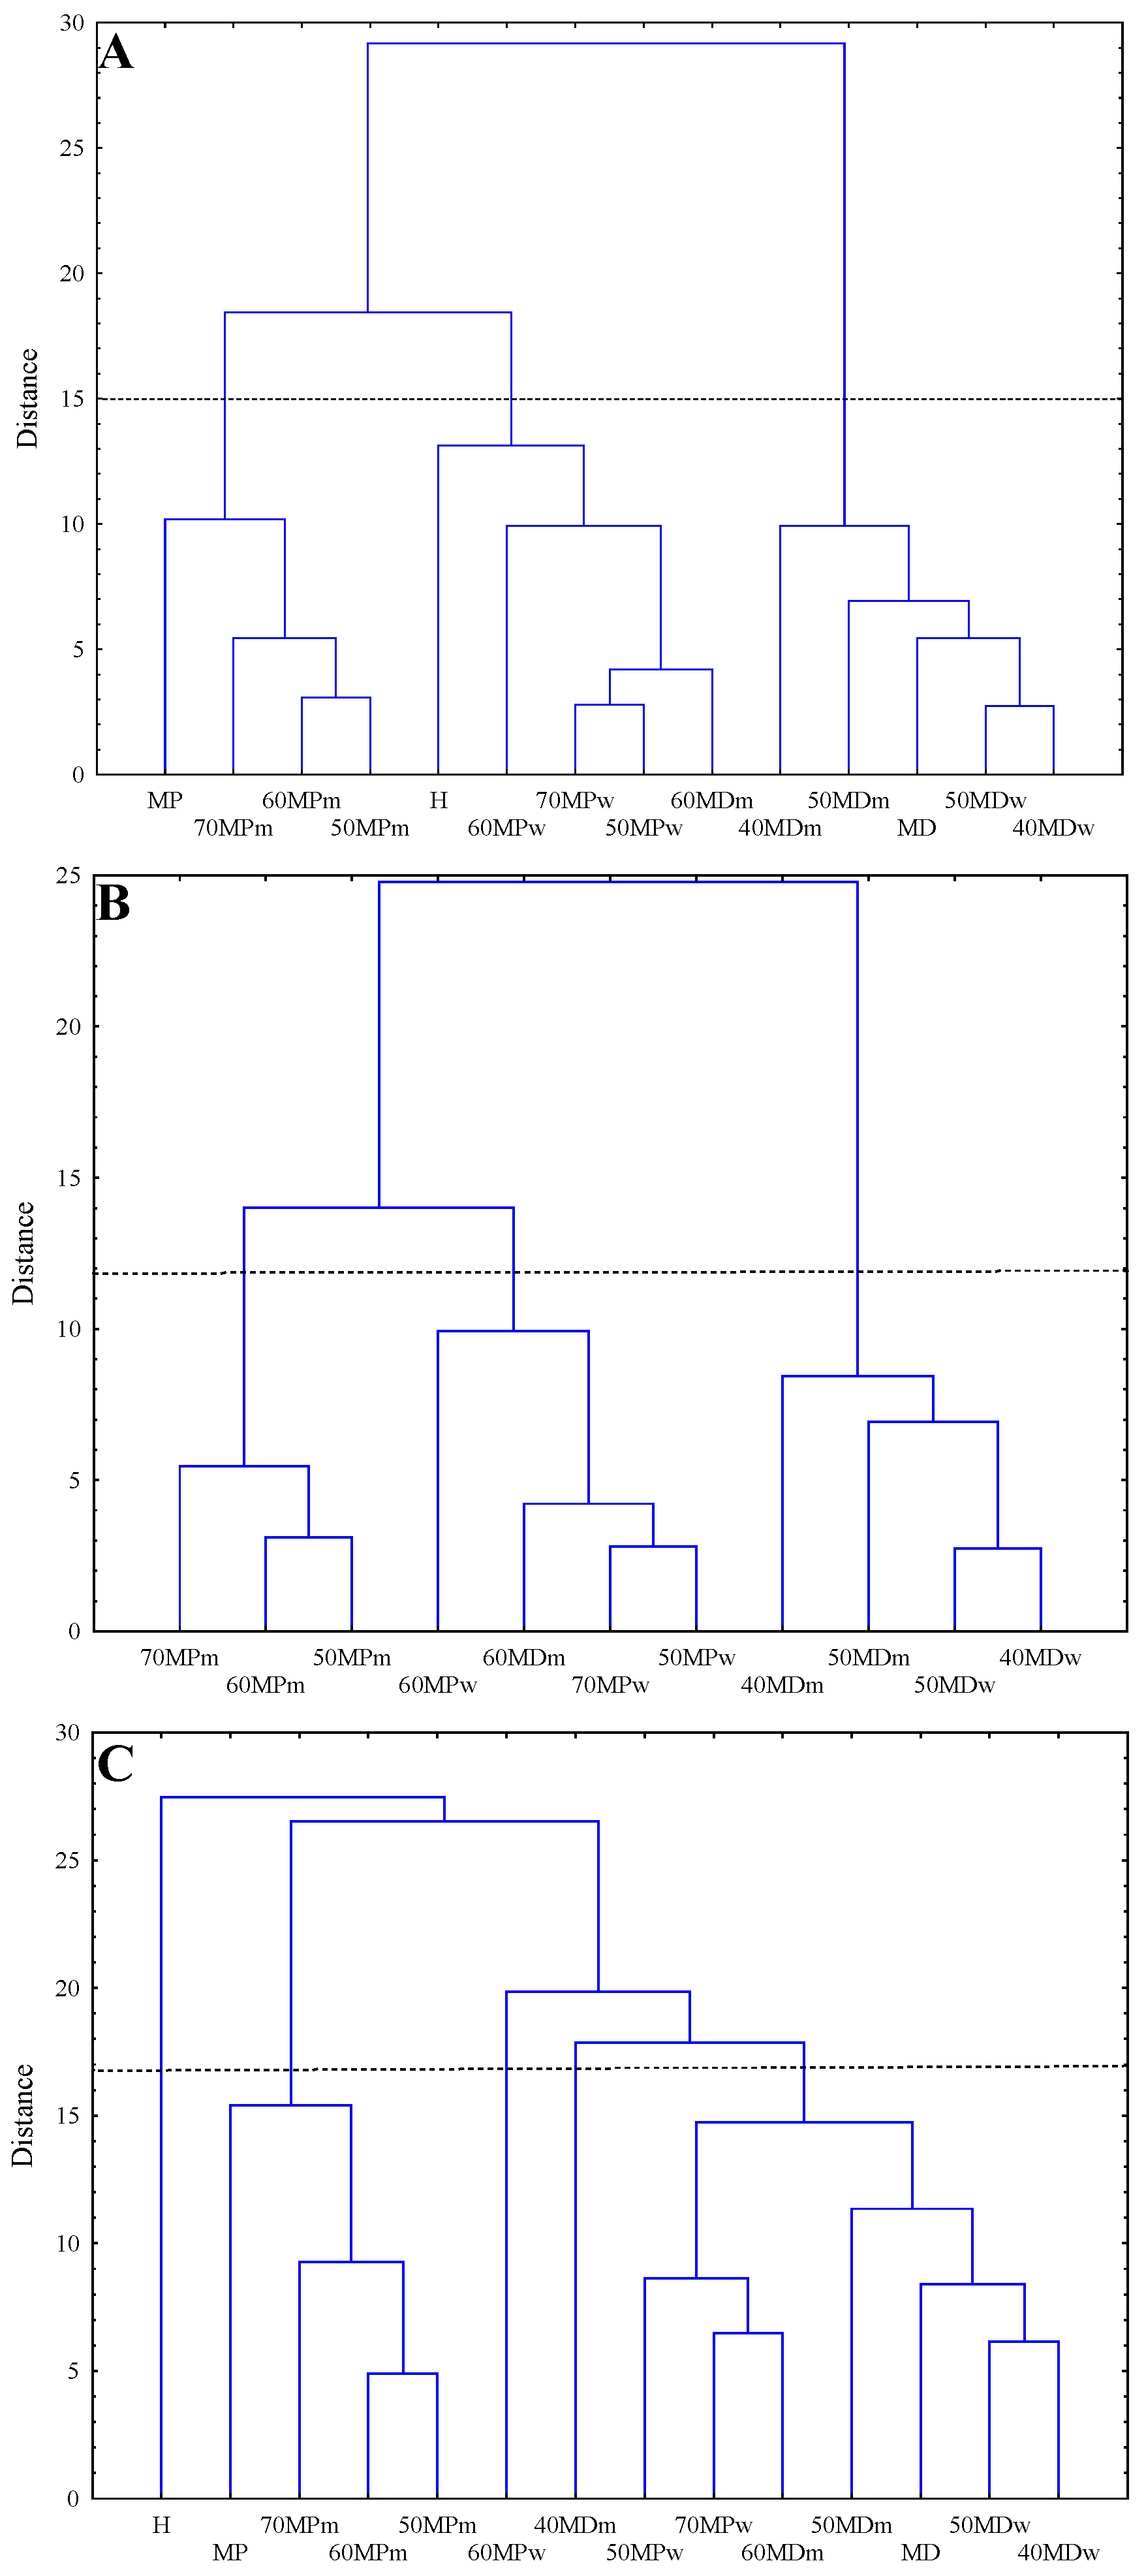
3.2. Hierarchical Clustering Analysis (HCA)
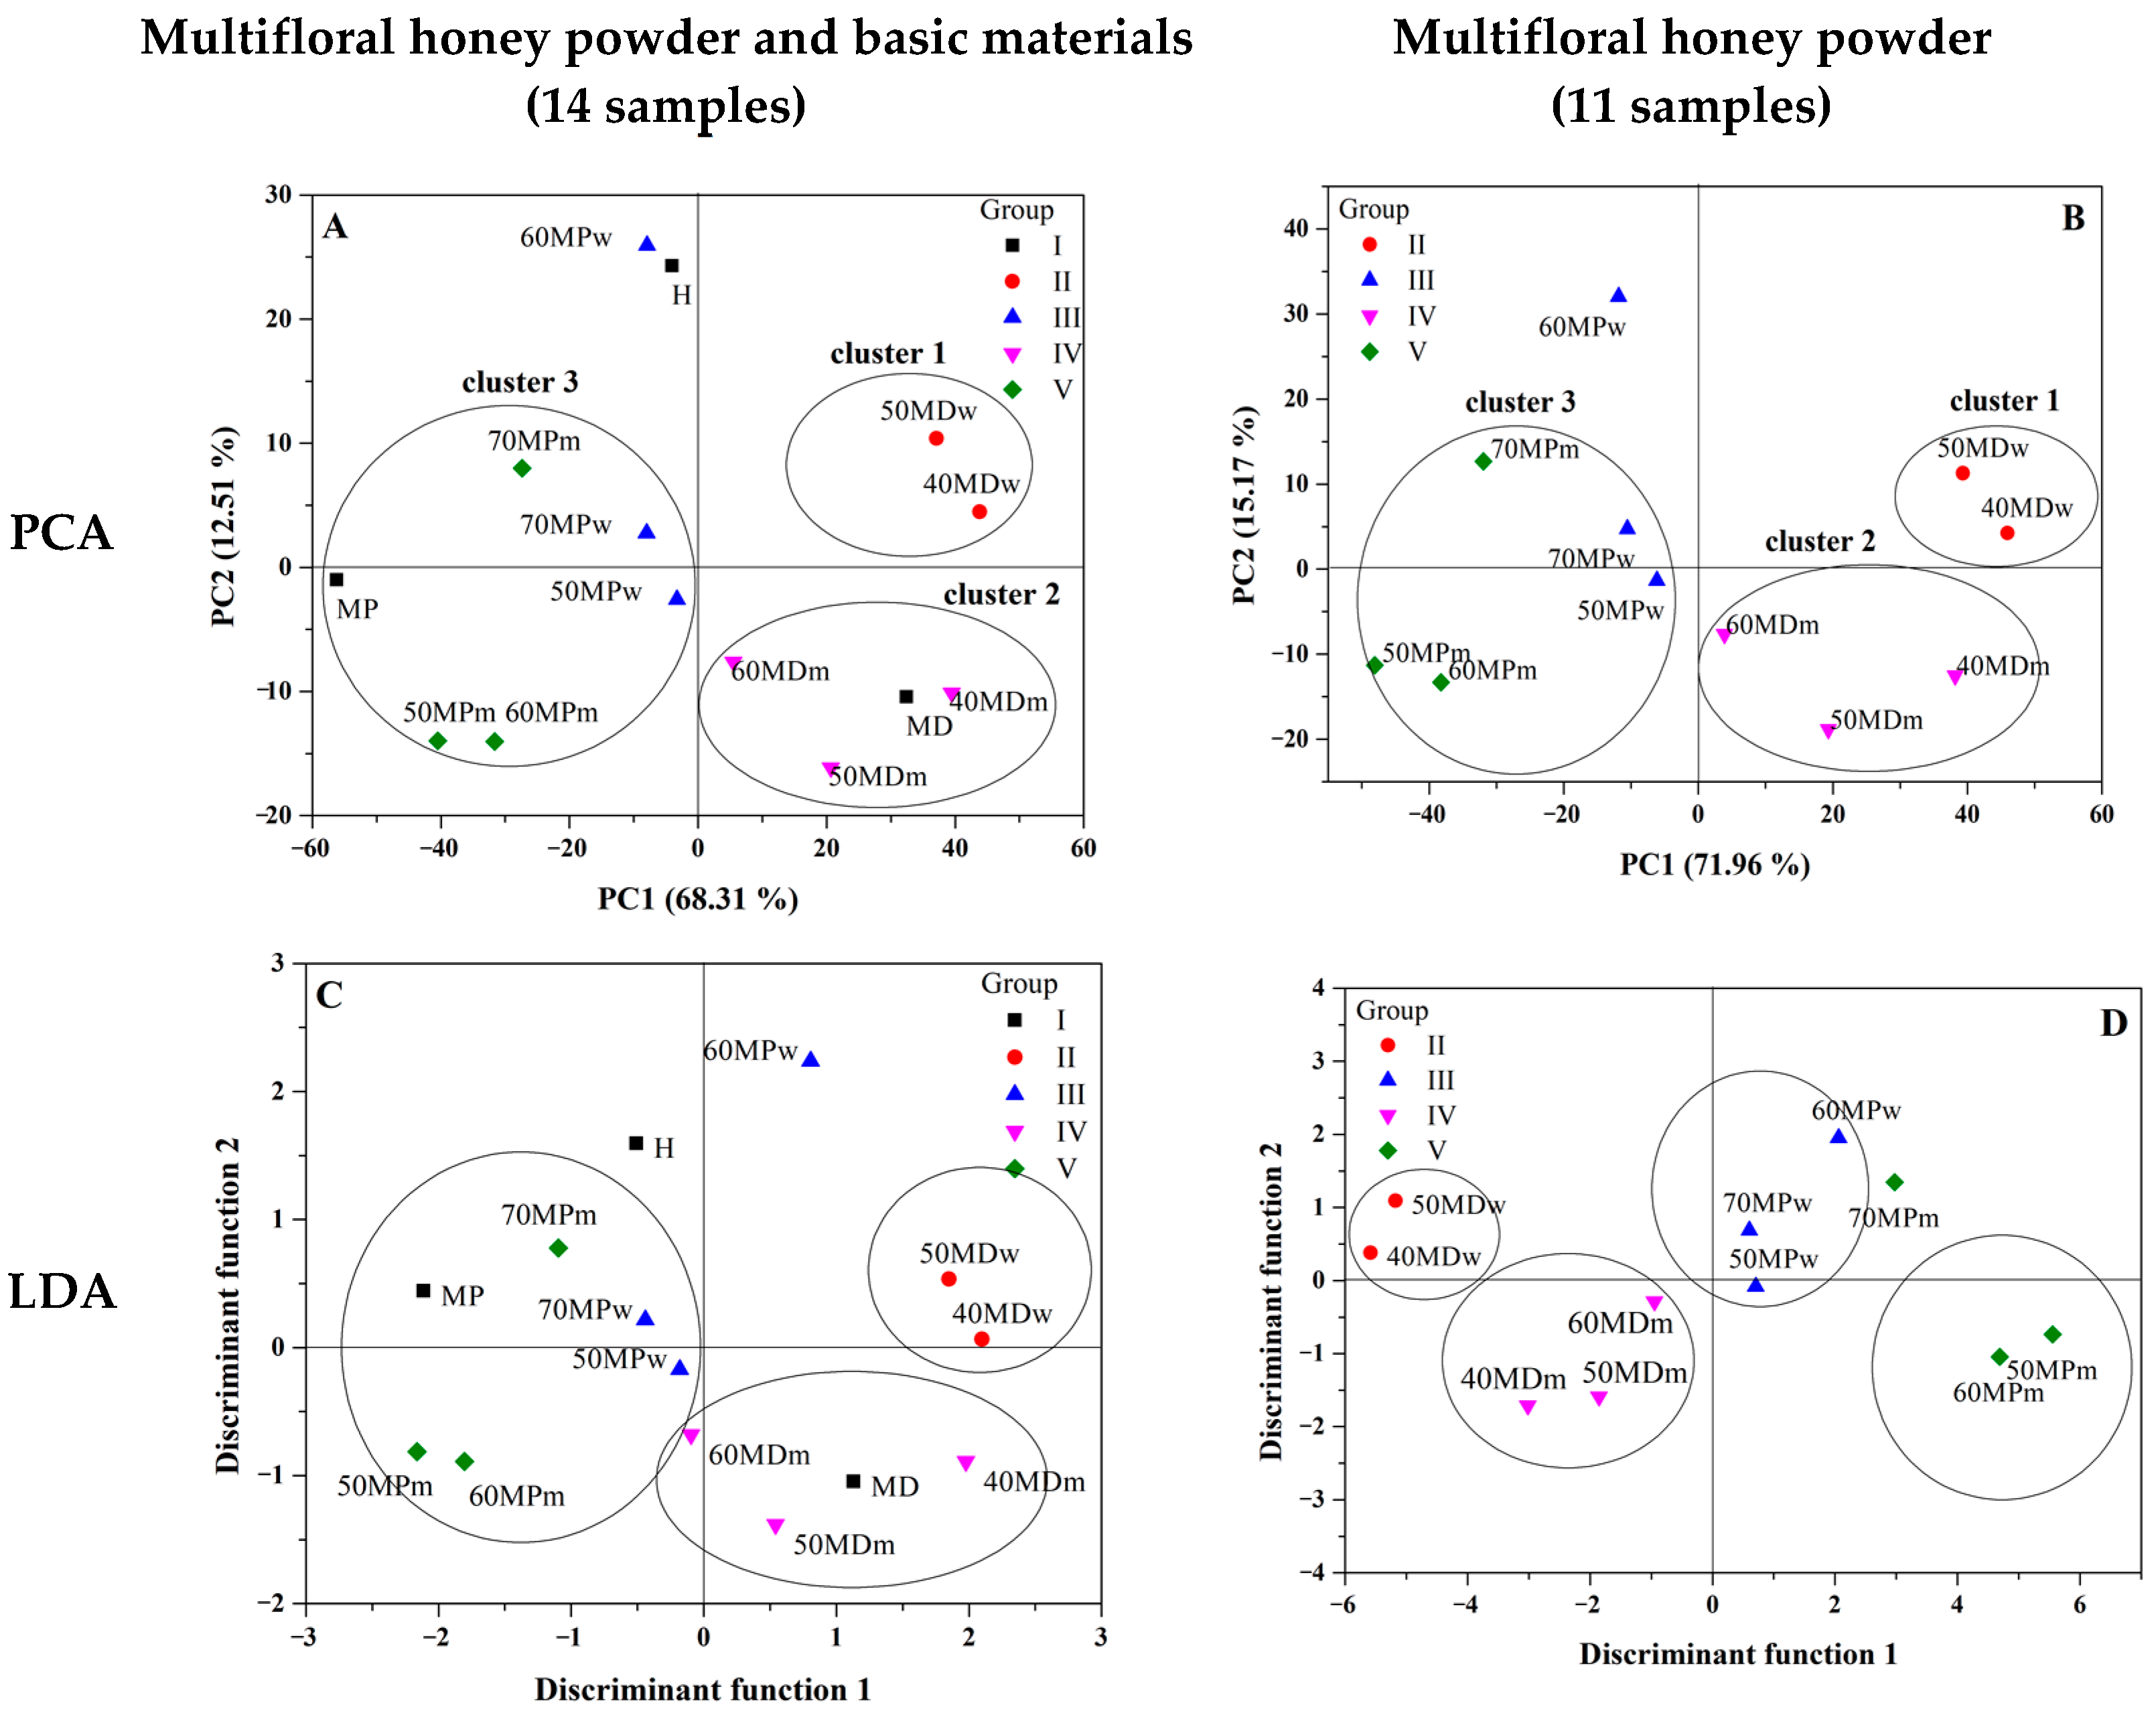
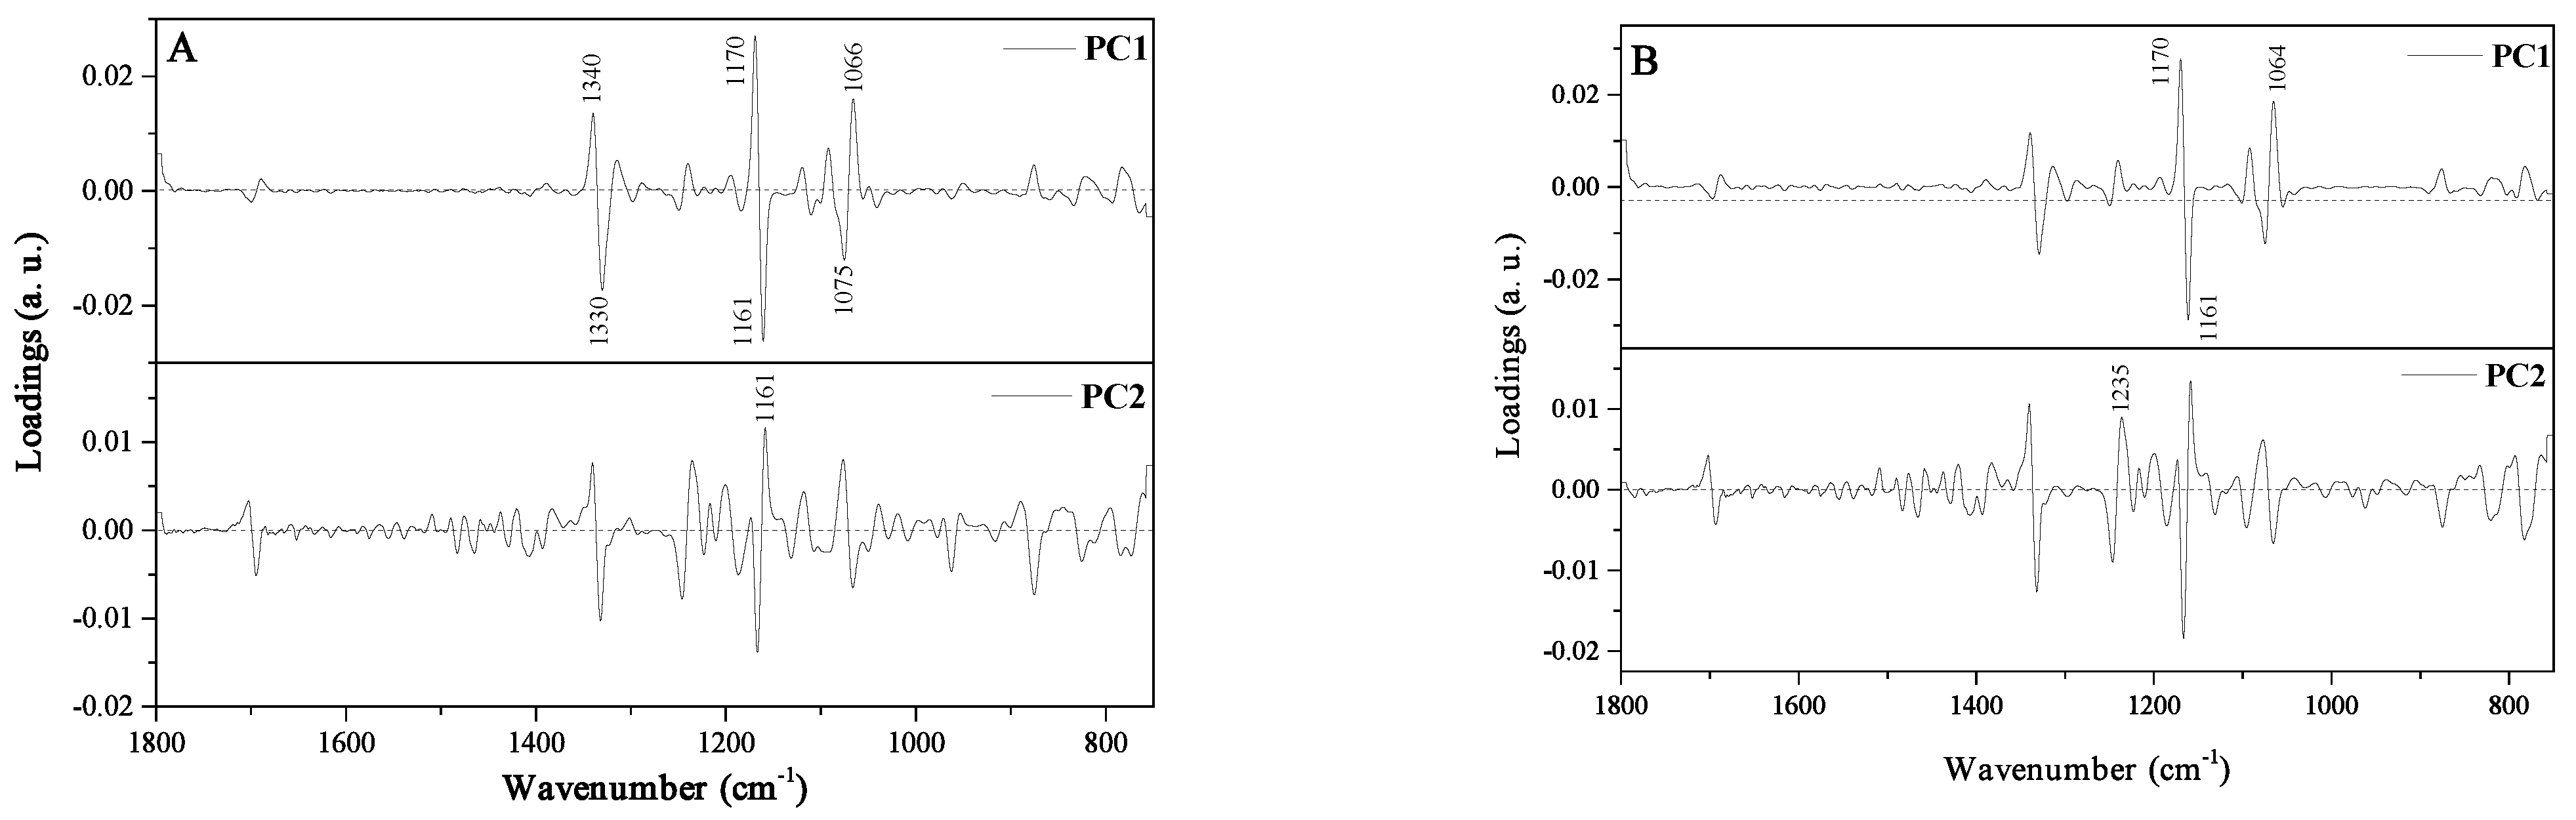
3.3. Principal Components Analysis (PCA) and Linear Discriminant Analysis (LDA)
3.4. The Partial Least Squares-Discriminant Analysis (PLS-DA)
4. Conclusions
Supplementary Materials
Author Contributions
Funding
Institutional Review Board Statement
Informed Consent Statement
Data Availability Statement
Acknowledgments
Conflicts of Interest
Sample Availability
References
- Samborska, K. Powdered honey—drying methods and parameters, types of carriers and drying aids, physicochemical properties and storage stability. Trends Food Sci. Technol. 2019, 88, 133–142. [Google Scholar] [CrossRef]
- Samborska, K.; Wiktor, A.; Jedlińska, A.; Matwijczuk, A.; Jamróz, W.; Skwarczyńska-Maj, K.; Kiełczewski, D.; Tułodziecki, M.; Błażowski, Ł.; Witrowa-Rajchert, D. Development and characterization of physical properties of honey-rich powder. Food Bioprod. Process. 2019, 115, 78–86. [Google Scholar] [CrossRef]
- Jedlinska, A.; Samborska, K.; Wieczorek, A.; Wiktor, A.; Ostrowska-Ligeza, E.; Jamroz, W.; Skwarczynska-Maj, K.; Kielczewski, D.; Blaowski, L.; Tulodziecki, M.; et al. The application of dehumidified air in rapeseed and honeydew honey spray drying—Process performance and powders properties considerations. J. Food Eng. 2019, 245, 80–87. [Google Scholar] [CrossRef]
- Samborska, K.; Baranska, A.; Szulc, K.; Jankowska, E.; Truszkowska, M.; Ostrowska-Ligeza, E.; Wolosiak, R.; Szymanska, E.; Jedlinska, A. Reformulation of spray-dried apple concentrate and honey for the enhancement of drying process performance and the physicochemical properties of powders. J. Sci. Food Agric. 2020, 100, 2224–2235. [Google Scholar] [CrossRef] [PubMed]
- Gok, S.; Severcan, M.; Goormaghtigh, E.; Kandemir, I.; Severcan, F. Differentiation of Anatolian honey samples from different botanical origins by ATR-FTIR spectroscopy using multivariate analysis. Food Chem. 2015, 170, 234–240. [Google Scholar] [CrossRef] [PubMed]
- Irudayaraj, J.; Xu, F.; Tewari, J. Rapid determination of invert cane sugar adulteration in honey using FTIR spectroscopy and multivariate analysis. J. Food Sci. 2003, 68, 2040–2045. [Google Scholar] [CrossRef]
- Anjos, O.; Campos, M.G.; Ruiz, P.C.; Antunes, P. Application of FTIR-ATR spectroscopy to the quantification of sugar in honey. Food Chem. 2015, 169, 218–223. [Google Scholar] [CrossRef]
- Svecnjak, L.; Bubalo, D.; Baranovic, G.; Novosel, H. Optimization of FTIR-ATR spectroscopy for botanical authentication of unifloral honey types and melissopalynological data prediction. Eur. Food Res. Technol. 2015, 240, 1101–1115. [Google Scholar] [CrossRef]
- Kasprzyk, I.; Depciuch, J.; Grabek-Lejko, D.; Parlinska-Wojtan, M. FTIR-ATR spectroscopy of pollen and honey as a tool for unifloral honey authentication. The case study of rape honey. Food Control 2018, 84, 33–40. [Google Scholar] [CrossRef]
- Etzold, E.; Lichtenberg-Kraag, B. Determination of the botanical origin of honey by Fourier-transformed infrared spectroscopy: An approach for routine analysis. Eur. Food Res. Technol. 2008, 227, 579–586. [Google Scholar] [CrossRef]
- Budziak, I.; Arczewska, M.; Kamiński, D.M. Formation of Prenylated Chalcone Xanthohumol Cocrystals: Single Crystal X-Ray Diffraction, Vibrational Spectroscopic Study Coupled with Multivariate Analysis. Molecules 2019, 24, 4245. [Google Scholar] [CrossRef] [PubMed] [Green Version]
- Yu, P.Q. Applications of hierarchical cluster analysis (CLA) and principal component analysis (PCA) in feed structure and feed molecular chemistry research, using synchrotron-based Fourier transform infrared (FTIR) microspectroscopy. J. Agric. Food Chem. 2005, 53, 7115–7127. [Google Scholar] [CrossRef] [PubMed]
- Raduan, M.F.; Mansor, W.; Lee, K.Y.; Radzol, A.R.M. Principal Component Analysis of Honey Spectrum Obtained from Surface Enhanced Raman Spectroscopy. In Proceedings of the International Conference for Innovation in Biomedical Engineering and Life Sciences, Icibel2015, Putrajaya, Malaysia, 6–8 December 2015; Volume 56, pp. 283–286. [Google Scholar]
- Godoy, J.L.; Vega, J.R.; Marchetti, J.L. Relationships between PCA and PLS-regression. Chemom. Intell. Lab. Syst. 2014, 130, 182–191. [Google Scholar] [CrossRef]
- Lipovetsky, S. Introduction to Multivariate Statistical Analysis in Chemometrics by Kurt Varmuza; Peter Filzmoser. Technometrics 2010, 52, 468–469. [Google Scholar]
- Jaillais, B.; Pinto, R.; Barros, A.S.; Rutledge, D.N. Outer-product analysis (OPA) using PCA to study the influence of temperature on NIR spectra of water. Vib. Spectrosc. 2005, 39, 50–58. [Google Scholar] [CrossRef]
- Granato, D.; Santos, J.S.; Escher, G.B.; Ferreira, B.L.; Maggio, R.M. Use of principal component analysis (PCA) and hierarchical cluster analysis (HCA) for multivariate association between bioactive compounds and functional properties in foods: A critical perspective. Trends Food Sci. Technol. 2018, 72, 83–90. [Google Scholar] [CrossRef]
- Miyamoto, S. Hierarchical Cluster Analysis and Fuzzy Sets. In Fuzzy Sets in Information Retrieval and Cluster Analysis; Springer: Dordrecht, Germany, 1990. [Google Scholar]
- Walsh, M.J.; Fellous, T.G.; Hammiche, A.; Lin, W.R.; Fullwood, N.J.; Grude, O.; Bahrami, F.; Nicholson, J.M.; Cotte, M.; Susini, J.; et al. Fourier transform infrared microspectroscopy identifies symmetric PO(2)(-) modifications as a marker of the putative stem cell region of human intestinal crypts. Stem Cells 2018, 26, 108–118. [Google Scholar] [CrossRef]
- Xia, J.J.; Zhang, J.X.; Zhao, Y.T.; Huang, Y.M.; Xiong, Y.M.; Min, S.G. Fourier transform infrared spectroscopy and chemometrics for the discrimination of paper relic types. Spectrochim. Acta Part A Mol. Biomol. Spectrosc. 2019, 219, 8–14. [Google Scholar] [CrossRef]
- Brereton, R.G.; Lloyd, G.R. Re-evaluating the role of the Mahalanobis distance measure. J. Chemom. 2016, 30, 134–143. [Google Scholar] [CrossRef]
- Lenhardt, L.; Bro, R.; Zekovic, I.; Dramicanin, T.; Dramicanin, M.D. Fluorescence spectroscopy coupled with PARAFAC and PLS DA for characterization and classification of honey. Food Chem. 2015, 175, 284–291. [Google Scholar] [CrossRef]
- Du, L.; Lu, W.; Gao, B.; Wang, J.; Yu, L.L. Authenticating Raw from Reconstituted Milk Using Fourier Transform Infrared Spectroscopy and Chemometrics. J. Food Qual. 2019, 2019, 5487890. [Google Scholar] [CrossRef] [PubMed] [Green Version]
- Anguebes, F.; Pat, L.; Ali, B.; Guerrero, A.; Córdova, A.V.; Abatal, M.; Garduza, J.P. Application of Multivariable Analysis and FTIR-ATR Spectroscopy to the Prediction of Properties in Campeche Honey. J. Anal. Methods Chem. 2016, 2016, 5427526. [Google Scholar] [CrossRef] [PubMed] [Green Version]
- Lei, Y.; Zhou, Q.; Zhang, Y.L.; Chen, J.B.; Sun, S.Q.; Noda, I. Analysis of crystallized lactose in milk powder by Fourier-transform infrared spectroscopy combined with two-dimensional correlation infrared spectroscopy. J. Mol. Struct. 2010, 974, 88–93. [Google Scholar] [CrossRef]
- Gallardo-Velazquez, T.; Osorio-Revilla, G.; Loa, M.Z.; Rivera-Espinoza, Y. Application of FTIR-HATR spectroscopy and multivariate analysis to the quantification of adulterants in Mexican honeys. Food Res. Int. 2009, 42, 313–318. [Google Scholar] [CrossRef]
- Svecnjak, L.; Prdun, S.; Rogina, J.; Bubalo, D.; Jerkovic, I. Characterization of Satsuma mandarin (Citrus unshiu Marc.) nectar-to-honey transformation pathway using FTIR-ATR spectroscopy. Food Chem. 2017, 232, 286–294. [Google Scholar] [CrossRef]
- Elzey, B.; Pollard, D.; Fakayode, S.O. Determination of adulterated neem and flaxseed oil compositions by FTIR spectroscopy and multivariate regression analysis. Food Control 2016, 68, 303–309. [Google Scholar] [CrossRef]
- Wang, J.M.; Xue, X.F.; Du, X.J.; Cheng, N.; Chen, L.Z.; Zhao, J.; Zheng, J.B.; Cao, W. Identification of Acacia Honey Adulteration with Rape Honey Using Liquid Chromatography-Electrochemical Detection and Chemometrics. Food Anal. Methods 2014, 7, 2003–2012. [Google Scholar] [CrossRef]


| Variant | Group | Honey Solids to Carrier Solids Ratio (w/w) |
|---|---|---|
| 40MDw | II | 40:60 |
| 50MDw | 50:50 | |
| 60MDw | 60:40 * | |
| 50MPw | III | 50:50 |
| 60MPw | 60:40 | |
| 70MPw | 70:30 | |
| 40MDm | IV | 40:60 |
| 50MDm | 50:50 | |
| 60MDm | 60:40 | |
| 50MPm | V | 50:50 |
| 60MPm | 60:40 | |
| 70MPm | 70:30 |
| Type and Origin of Vibrations | FTIR Position of Bands (cm−1) | ||
|---|---|---|---|
| MD | MP | H | |
| ν(O–H) in H2O | 3291 | 3285 | 3281 |
| ν(C–H) or/and ν(NH3) of free amino acids δ (O–H) from H2O | 2927 2892 | 2927 2872 | 2937 2886 |
| ν(C–O) from carbohydrate | 1742 | 1739 | 1740 |
| δ (O–H) from H2O | 1645 | 1643 | 1642 |
| δ (N–H) from amid II | 1546 | ||
| δ (O–CH) and δ (C–C–H) | 1453 | 1449 | 1450 |
| δ (O–H) in C–OH group + δ (C–H) in the alkenes | 1417 | 1419 | 1420 |
| δ (–OH) in C–OH group | 1363 | 1366 | 1366 |
| ν(C–H) in carbohydrates or/and ν(C–O) in carbohydrates | 1257 1230 | 1254 1229 | 1257 1229 |
| ν(C–H) in carbohydrates or/and ν(C–O) in carbohydrates | 1148 | 1148 | 1148 |
| ν(C–O) in C–O–C group | 1104 1076 | 1114 1066 | 1101 1076 |
| ν(C–O) in C–OH group or ν (C–C) in the carbohydrate structure | 1013 992 | 1020 992 | 1027 980 |
| δ (C–H) | 925 | 915 | 916 |
| Anomeric region of carbohydrates or δ (C–H) | 896 862 846 819 | 883 875 852 821 | 895 864 817 |
| Principal Component Number | Eigenvalue | Percentage of Variance (%) | Cumulative (%) |
|---|---|---|---|
| 750–1800 cm−1 (14 samples) | |||
| 1 | 1004.849 | 68.310 | 68.310 |
| 2 | 184.067 | 12.513 | 80.823 |
| 3 | 133.050 | 9.044 | 89.868 |
| 4 | 92.275 | 6.272 | 96.141 |
| 5 | 32.647 | 2.219 | 98.360 |
| 750–1800 cm−1 (11 samples) | |||
| 1 | 1058.583 | 71.963 | 71.963 |
| 2 | 223.148 | 15.169 | 87.133 |
| 3 | 147.245 | 10.009 | 97.143 |
| 4 | 18.230 | 1.239 | 98.382 |
| 5 | 1058.583 | 71.963 | 71.963 |
| 750–3600 cm−1 (14 samples) | |||
| 1 | 1643.594 | 41.182 | 41.182 |
| 2 | 1311.975 | 32.873 | 74.055 |
| 3 | 396.217 | 9.927 | 83.983 |
| 4 | 205.171 | 5.140 | 89.124 |
| 5 | 141.846 | 3.554 | 92.678 |
| LDA prediction matrix for 14 samples | ||||||
| True class | Assigned to class | % Correct classification | ||||
| I | II | III | IV | V | ||
| I | 1 | 0 | 0 | 1 | 1 | 33.3 |
| II | 0 | 2 | 0 | 0 | 0 | 100.0 |
| III | 2 | 0 | 1 | 0 | 0 | 33.3 |
| IV | 1 | 0 | 0 | 2 | 0 | 66.7 |
| V | 1 | 0 | 0 | 0 | 2 | 66.7 |
| Total | 5 | 2 | 1 | 3 | 3 | 57.1 |
| LDA prediction matrix for 11 samples | ||||||
| True class | Assigned to class | % Correct classification | ||||
| II | III | IV | V | |||
| II | 2 | 0 | 0 | 0 | 100.0 | |
| III | 0 | 3 | 0 | 0 | 100.0 | |
| IV | 0 | 0 | 3 | 0 | 100.0 | |
| V | 0 | 0 | 0 | 3 | 100.0 | |
| Total | 2 | 3 | 3 | 3 | 100.0 | |
| Confusion matrix for the training sample (variable group): | ||||||
| from\to | 2 | 3 | 4 | 5 | Total | % correct |
| 2 | 2 | 0 | 0 | 0 | 2 | 100.00% |
| 3 | 0 | 3 | 0 | 0 | 3 | 100.00% |
| 4 | 0 | 0 | 2 | 0 | 2 | 100.00% |
| 5 | 0 | 0 | 0 | 2 | 2 | 100.00% |
| Total | 2 | 3 | 2 | 2 | 9 | 100.00% |
| Confusion matrix for the validation sample (variable group): | ||||||
| from\to | 2 | 3 | 4 | 5 | Total | % correct |
| 2 | 0 | 0 | 0 | 0 | 0 | 0.00% |
| 3 | 0 | 0 | 0 | 0 | 0 | 0.00% |
| 4 | 0 | 1 | 0 | 0 | 1 | 0.00% |
| 5 | 0 | 0 | 0 | 1 | 1 | 100.00% |
| Total | 0 | 1 | 0 | 1 | 2 | 50.00% |
Publisher’s Note: MDPI stays neutral with regard to jurisdictional claims in published maps and institutional affiliations. |
© 2022 by the authors. Licensee MDPI, Basel, Switzerland. This article is an open access article distributed under the terms and conditions of the Creative Commons Attribution (CC BY) license (https://creativecommons.org/licenses/by/4.0/).
Share and Cite
Matwijczuk, A.; Budziak-Wieczorek, I.; Czernel, G.; Karcz, D.; Barańska, A.; Jedlińska, A.; Samborska, K. Classification of Honey Powder Composition by FTIR Spectroscopy Coupled with Chemometric Analysis. Molecules 2022, 27, 3800. https://doi.org/10.3390/molecules27123800
Matwijczuk A, Budziak-Wieczorek I, Czernel G, Karcz D, Barańska A, Jedlińska A, Samborska K. Classification of Honey Powder Composition by FTIR Spectroscopy Coupled with Chemometric Analysis. Molecules. 2022; 27(12):3800. https://doi.org/10.3390/molecules27123800
Chicago/Turabian StyleMatwijczuk, Arkadiusz, Iwona Budziak-Wieczorek, Grzegorz Czernel, Dariusz Karcz, Alicja Barańska, Aleksandra Jedlińska, and Katarzyna Samborska. 2022. "Classification of Honey Powder Composition by FTIR Spectroscopy Coupled with Chemometric Analysis" Molecules 27, no. 12: 3800. https://doi.org/10.3390/molecules27123800
APA StyleMatwijczuk, A., Budziak-Wieczorek, I., Czernel, G., Karcz, D., Barańska, A., Jedlińska, A., & Samborska, K. (2022). Classification of Honey Powder Composition by FTIR Spectroscopy Coupled with Chemometric Analysis. Molecules, 27(12), 3800. https://doi.org/10.3390/molecules27123800