
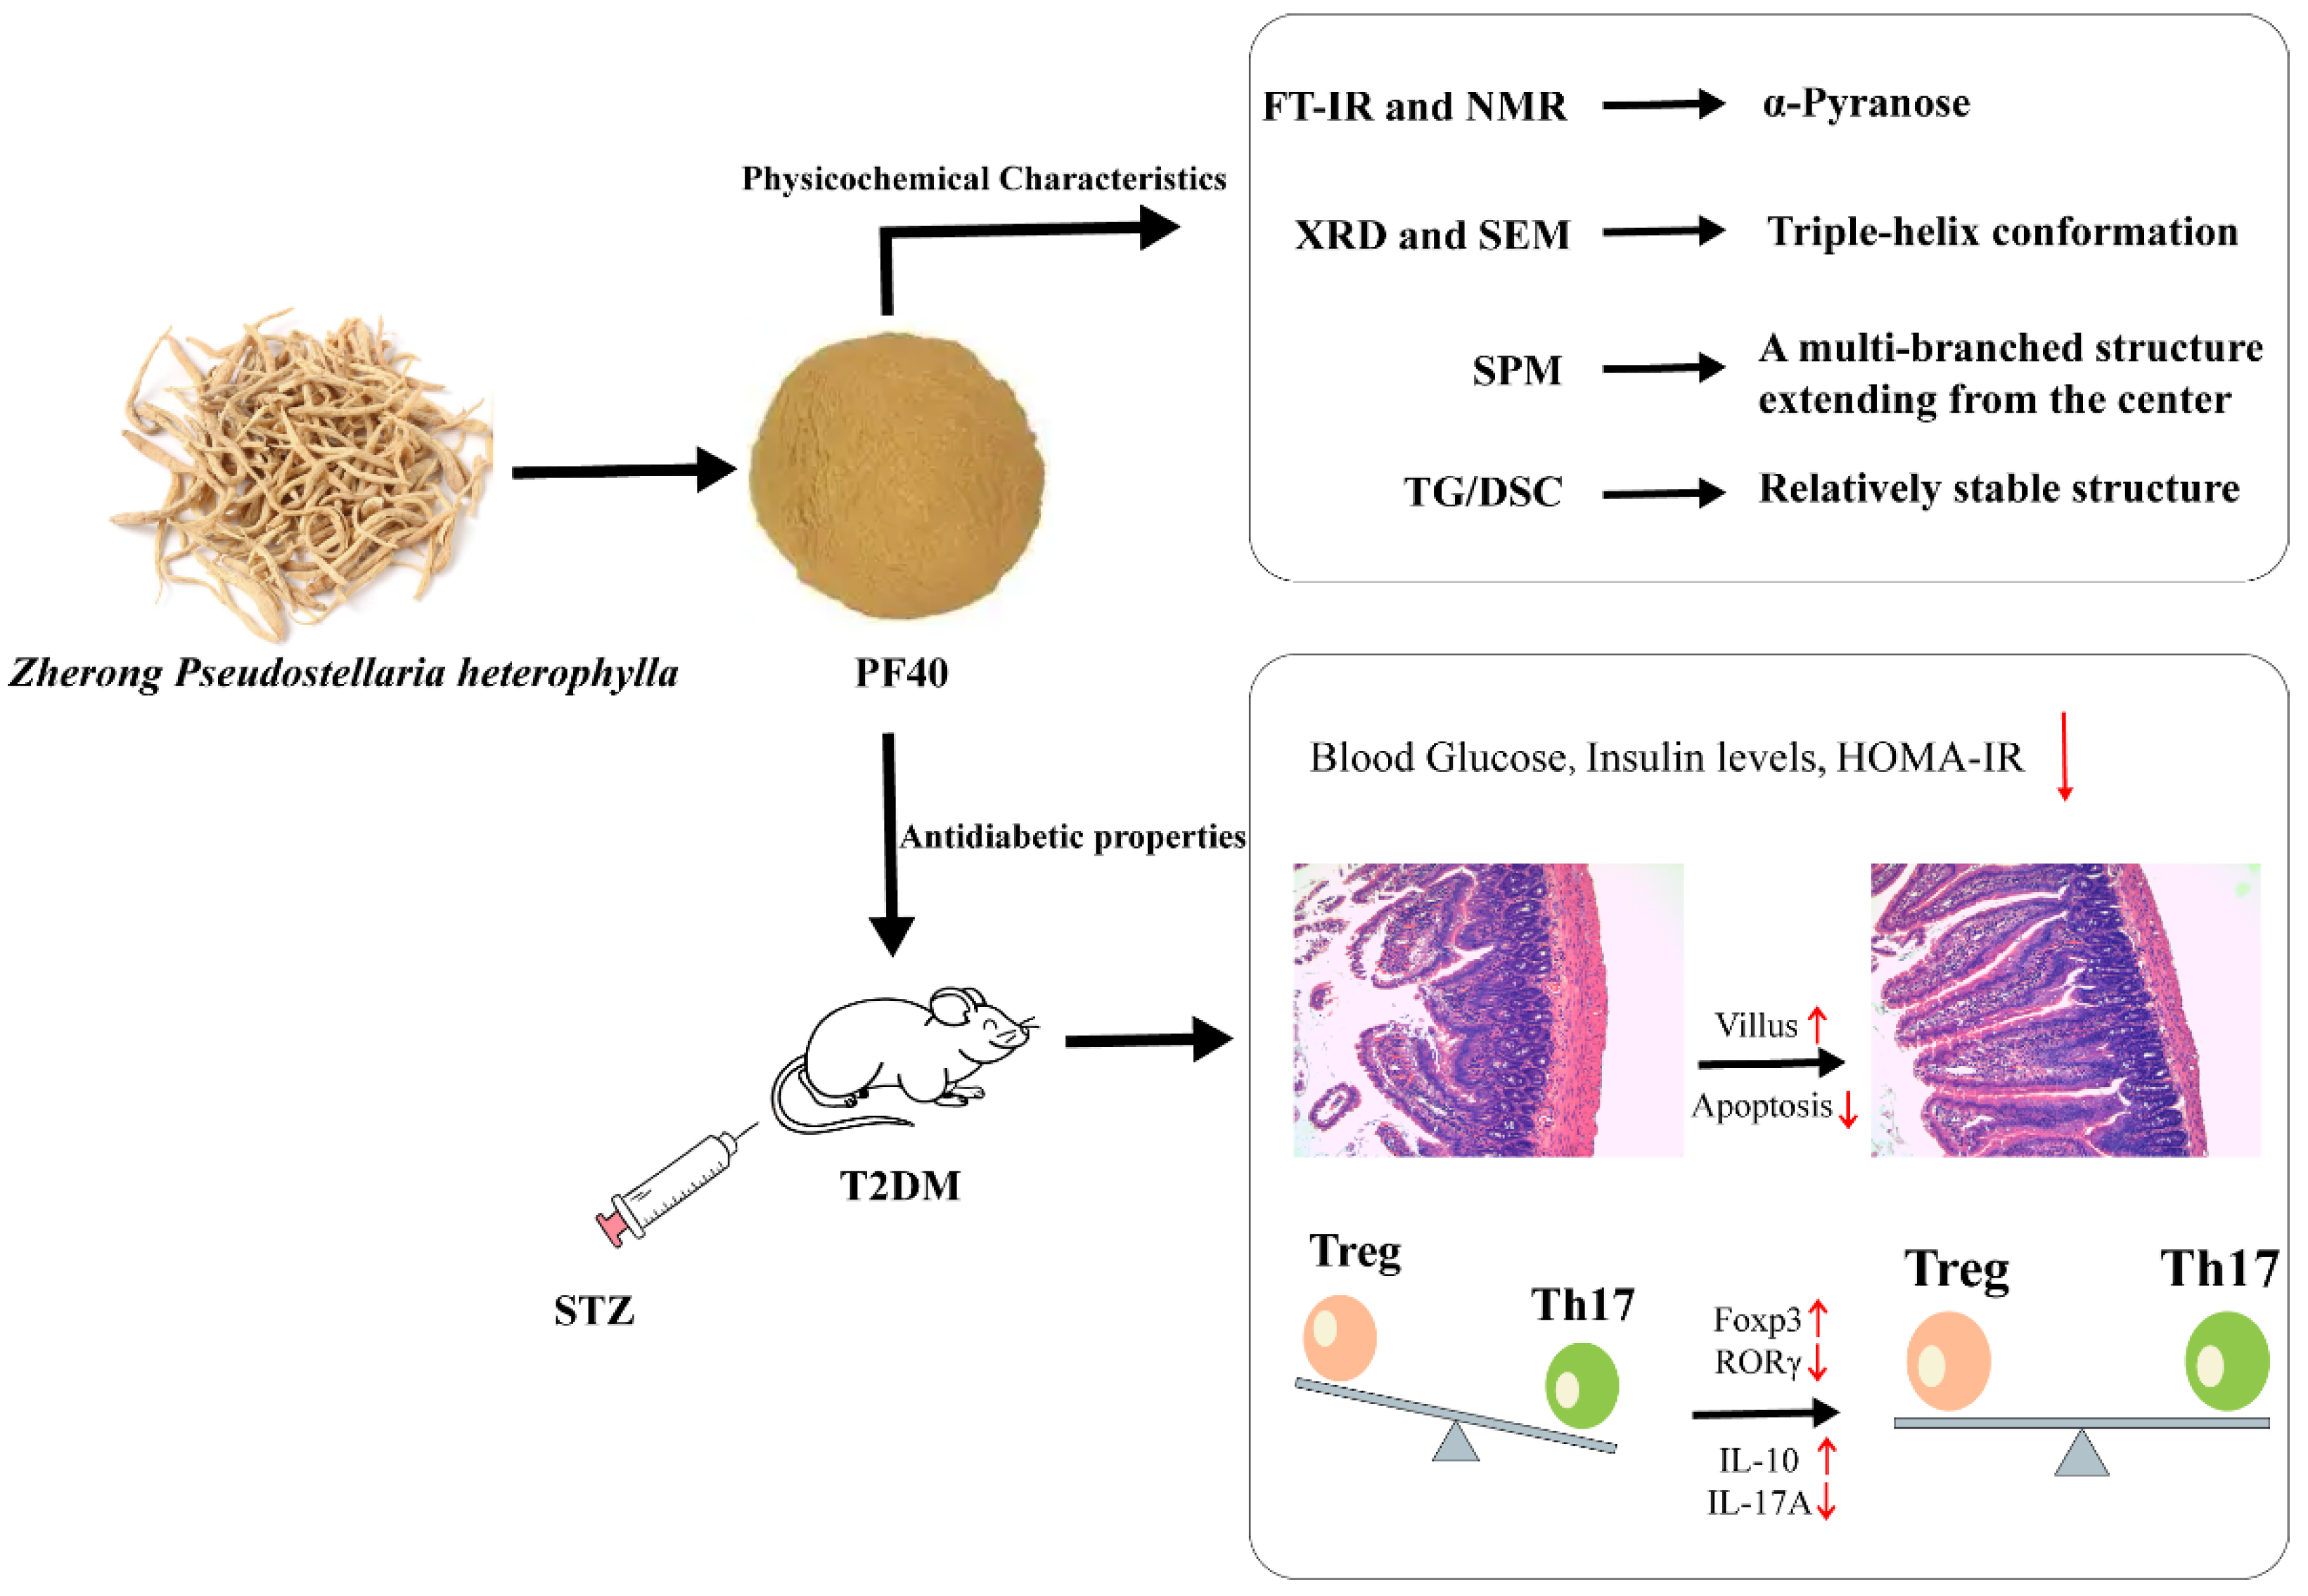
Physicochemical Characteristics and Antidiabetic Properties of the Polysaccharides from Pseudostellaria heterophylla

 , , , and
Abstract
:1. Introduction
2. Results and Discussion
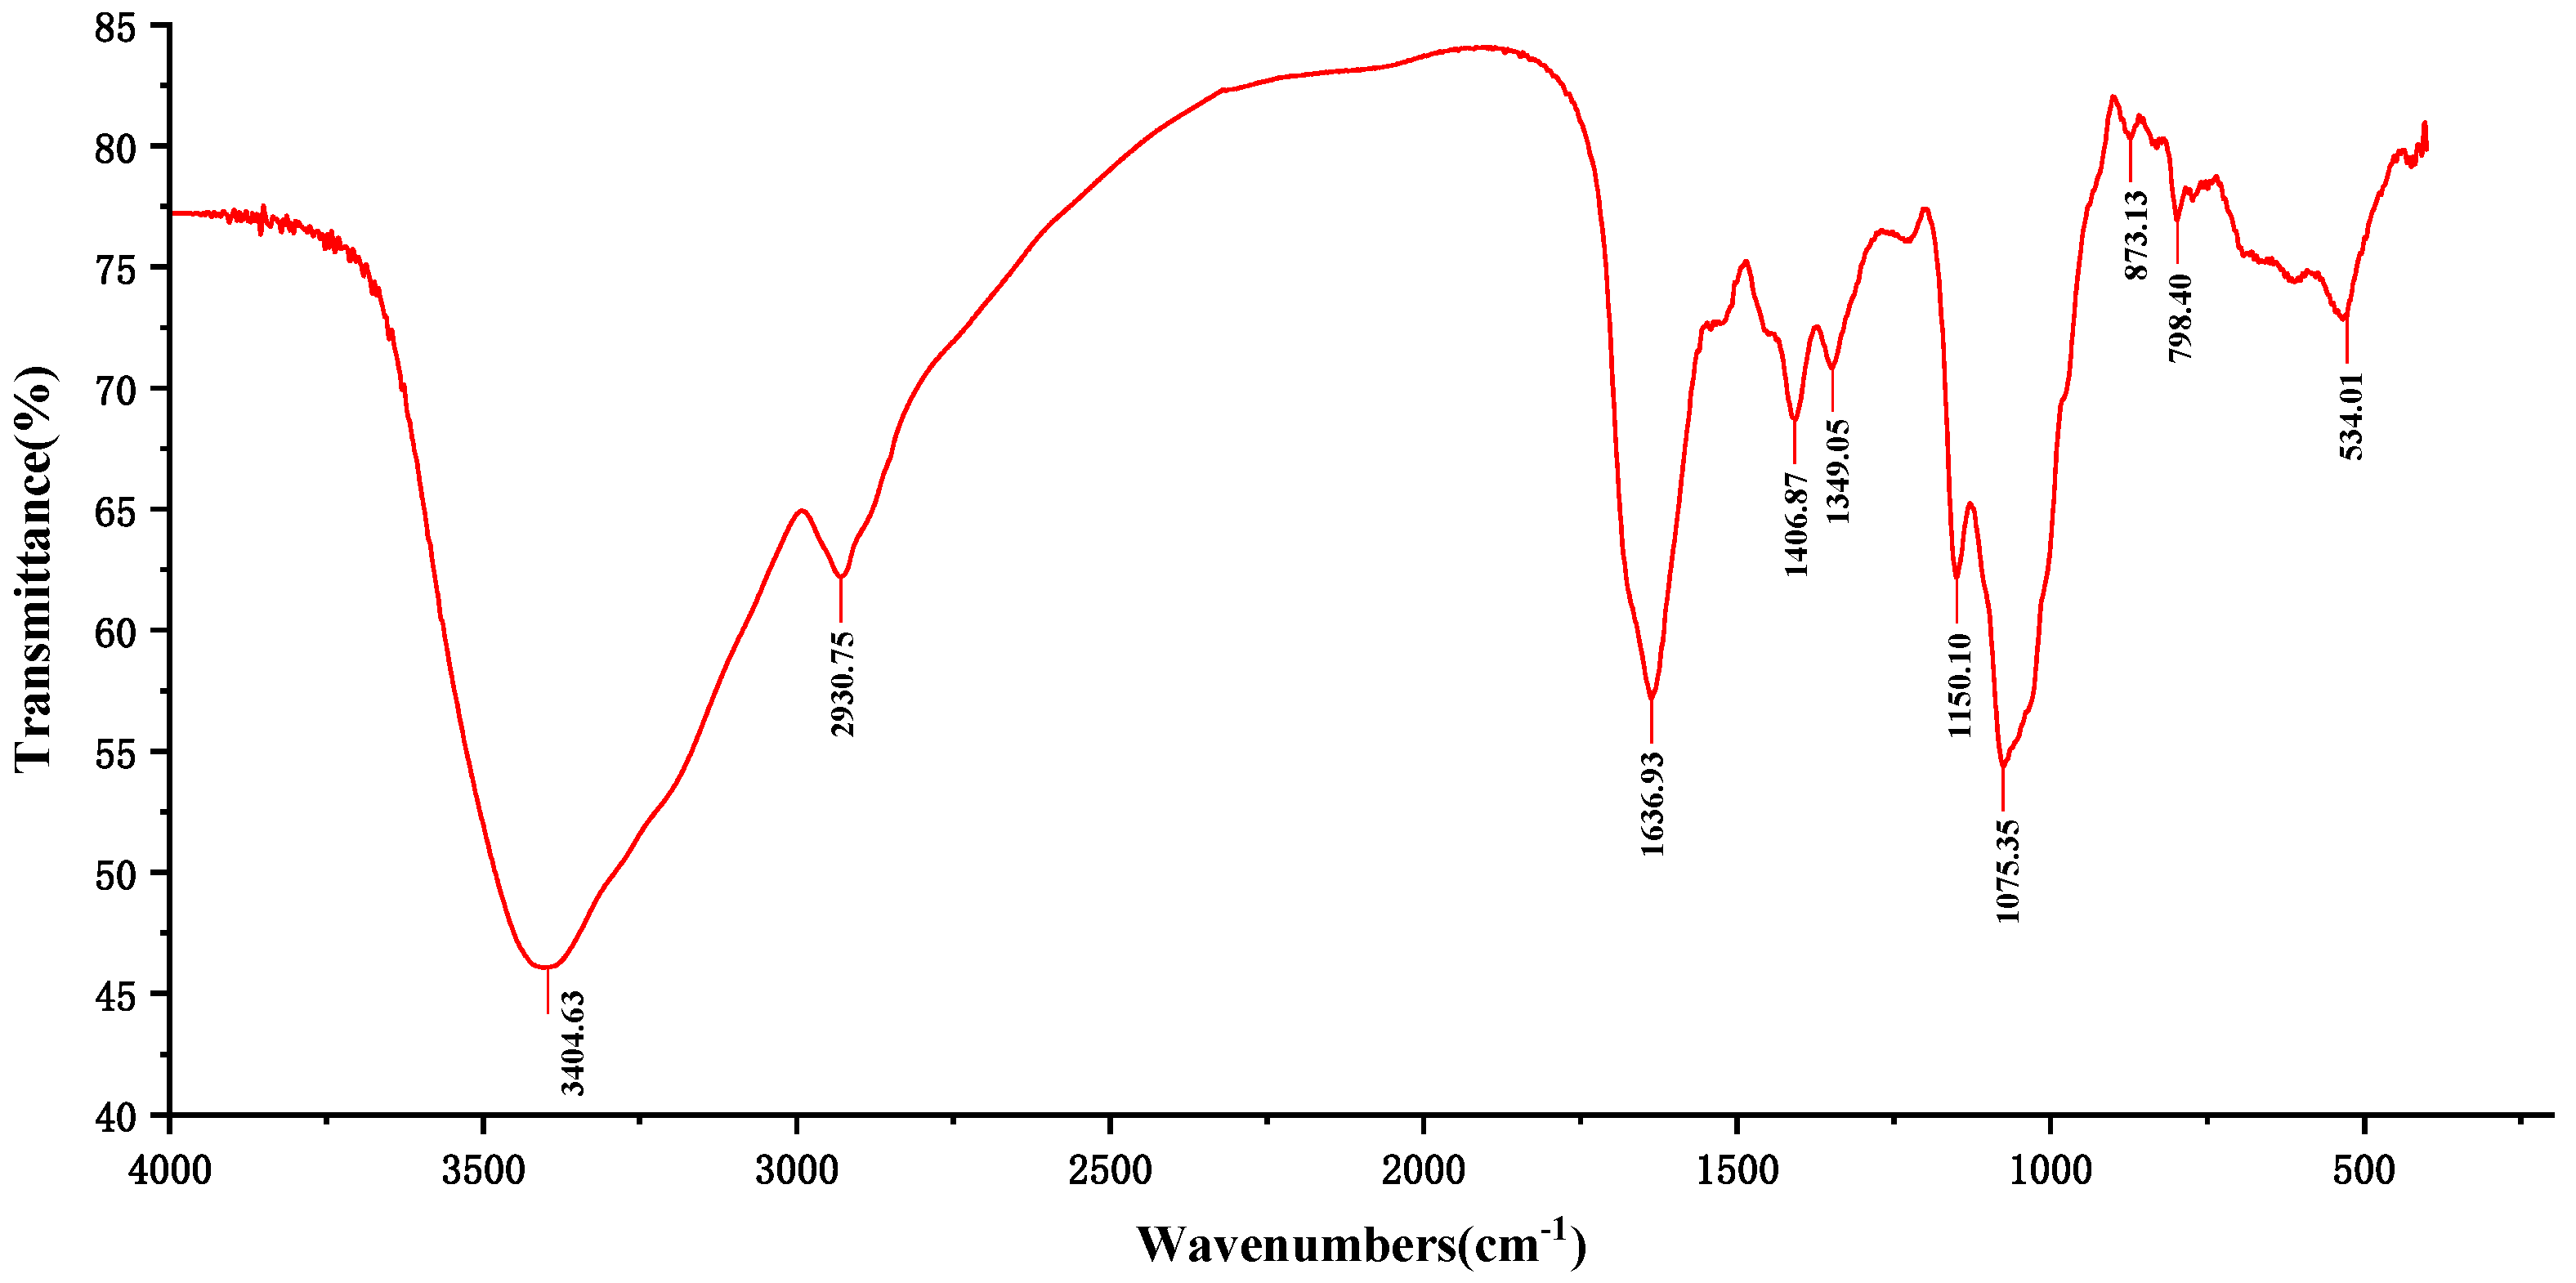
2.1. FT-IR Analysis
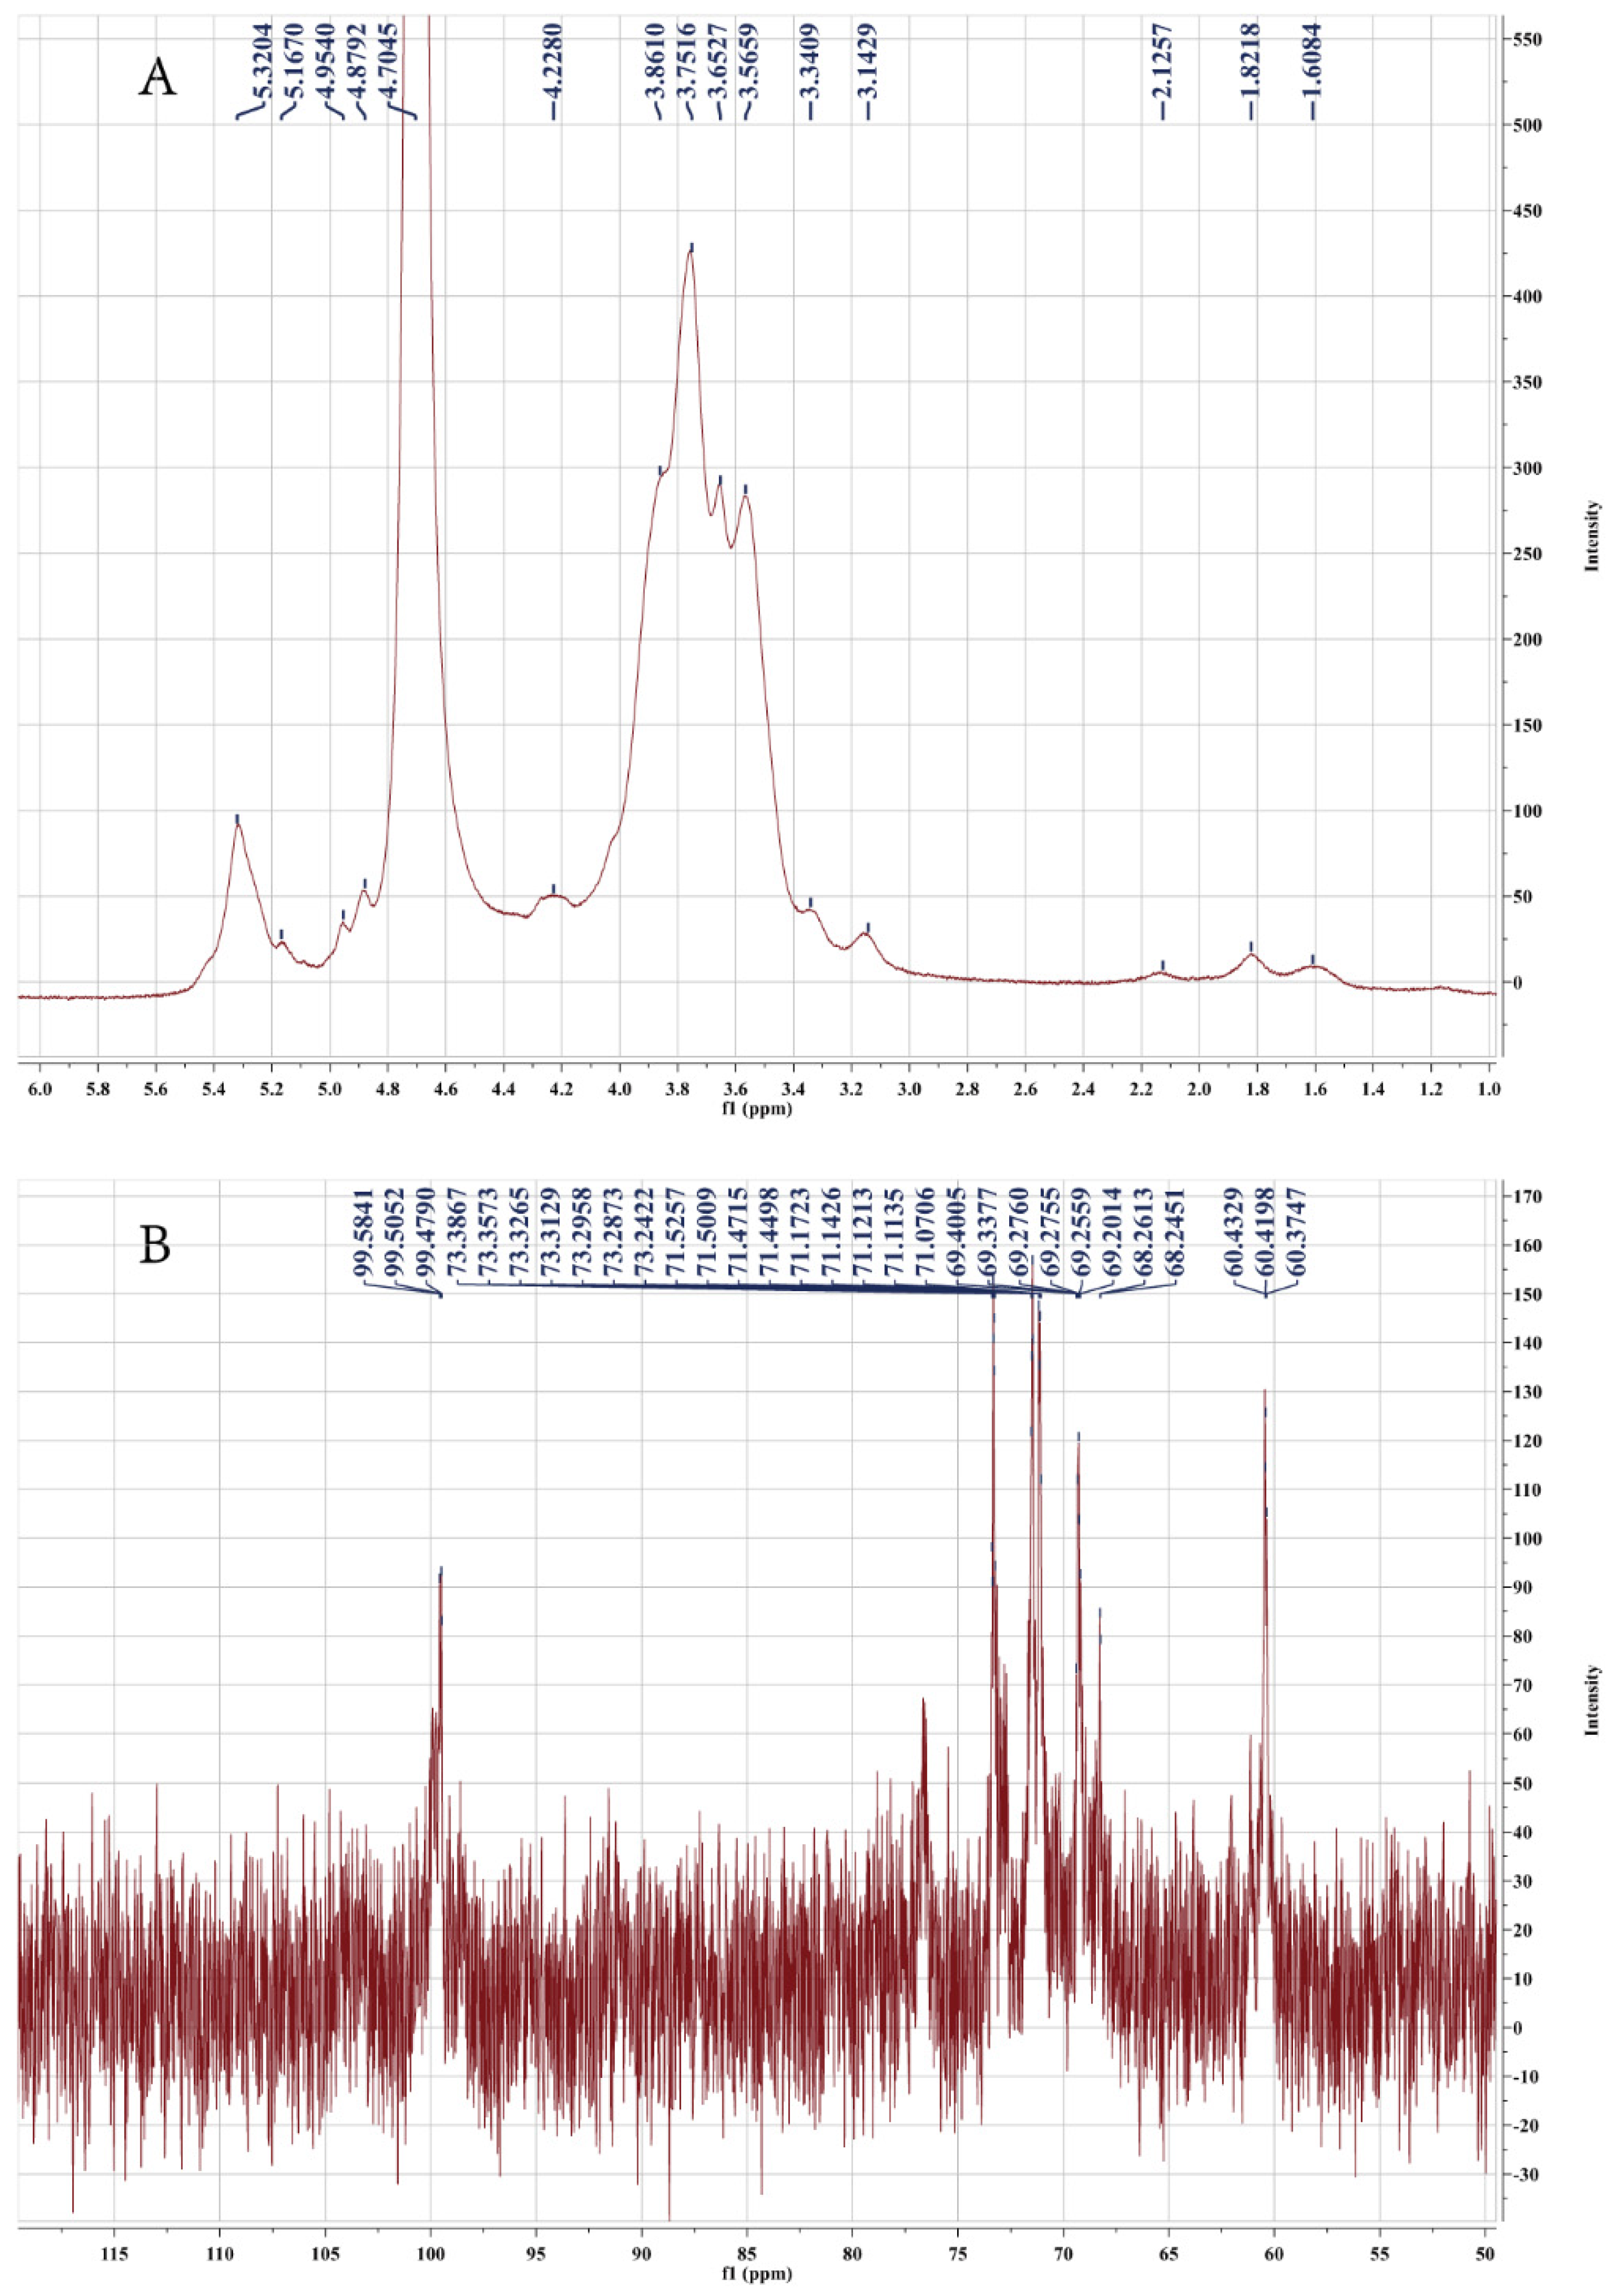
2.2. NMR Analysis
2.3. UV Analyses
2.4. Congo Red Test
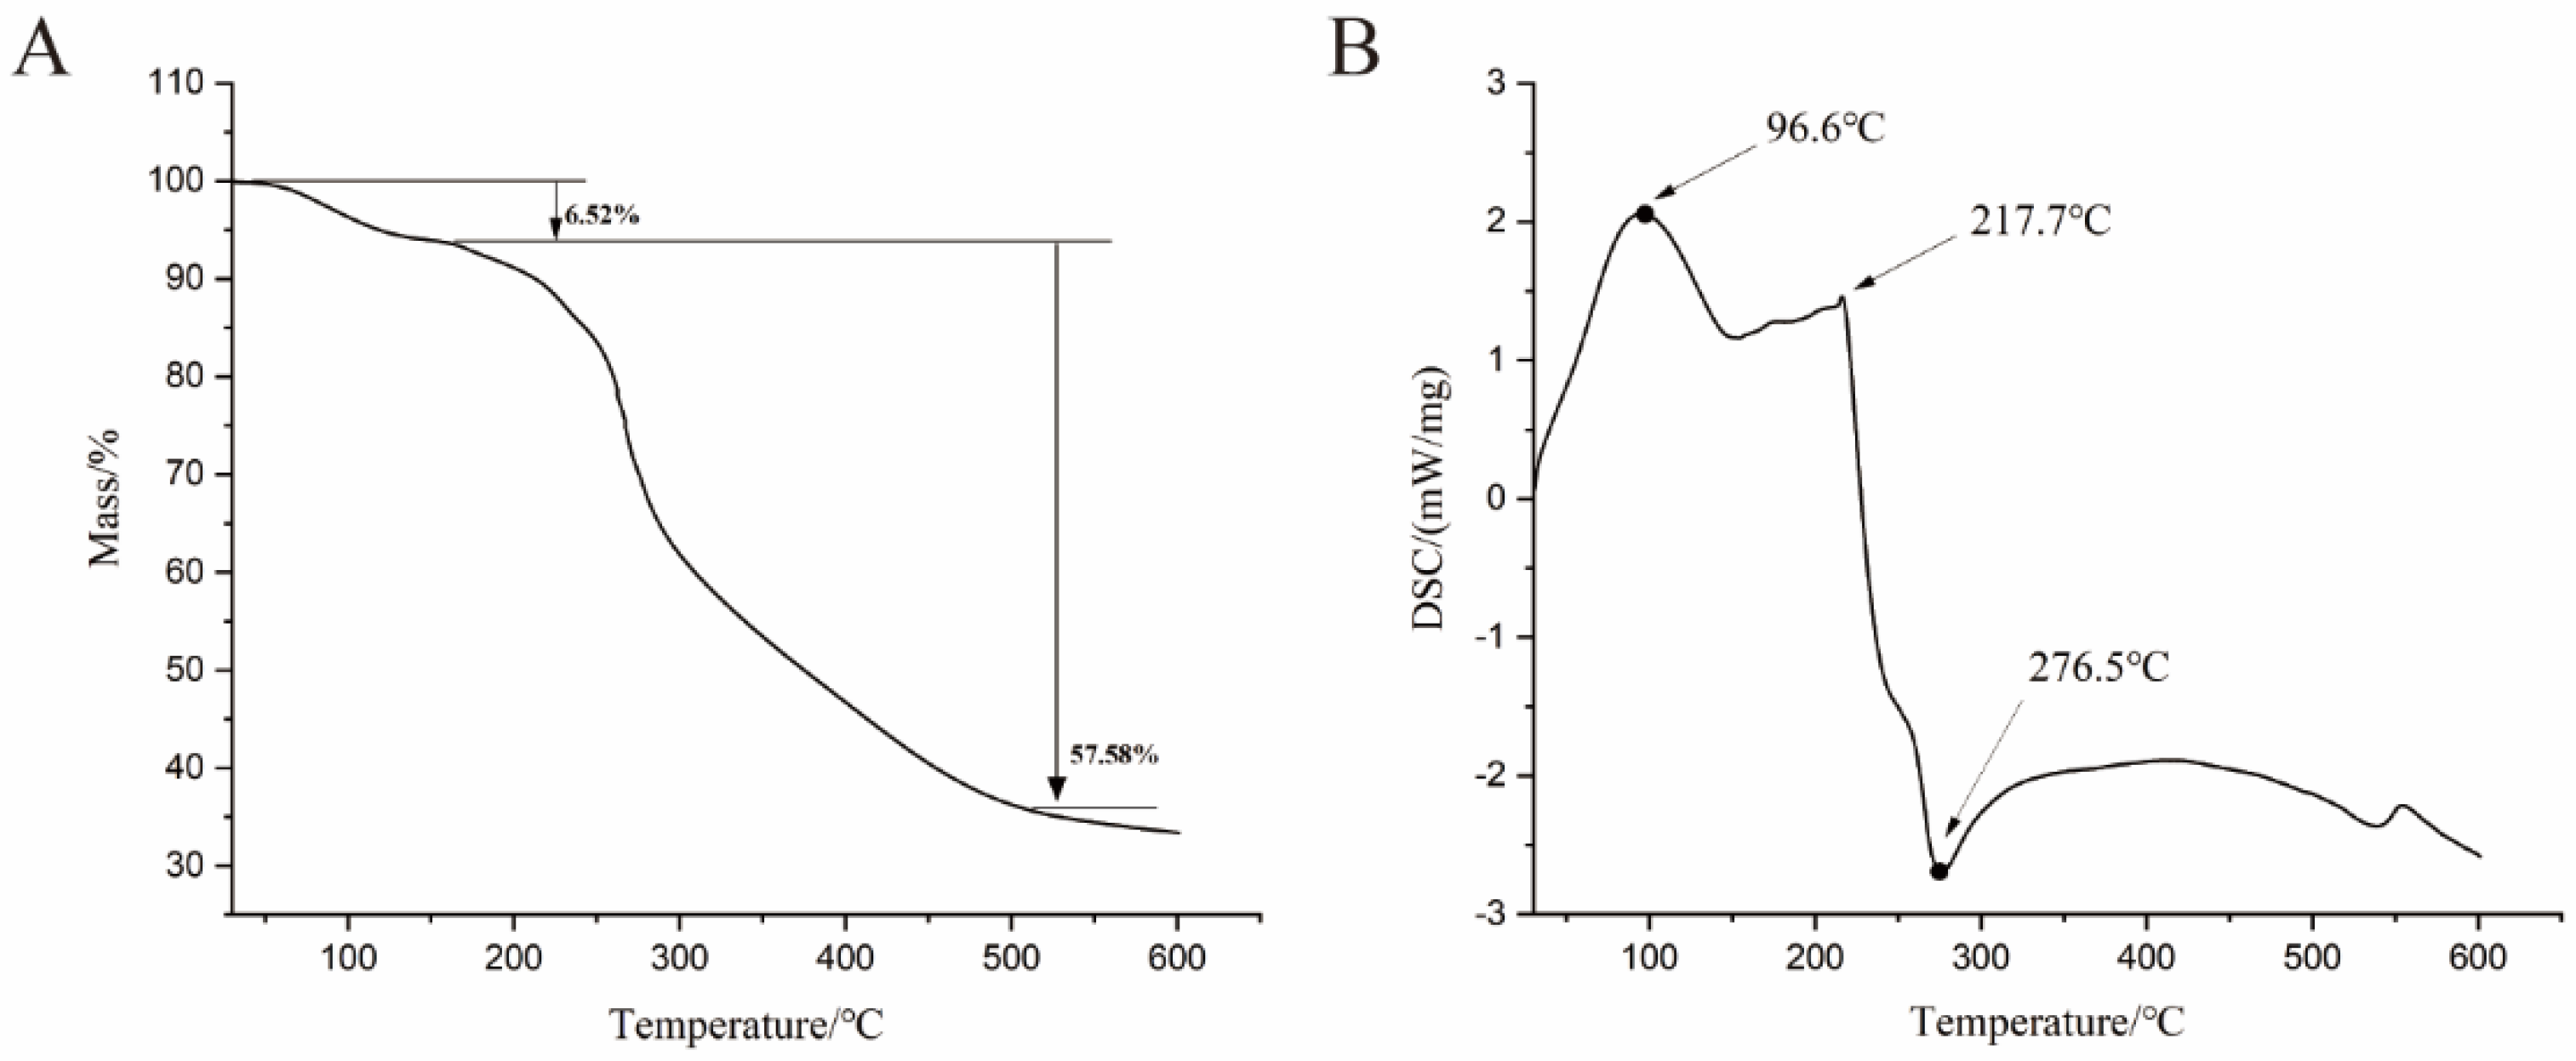
2.5. Thermogravimetric Analysis
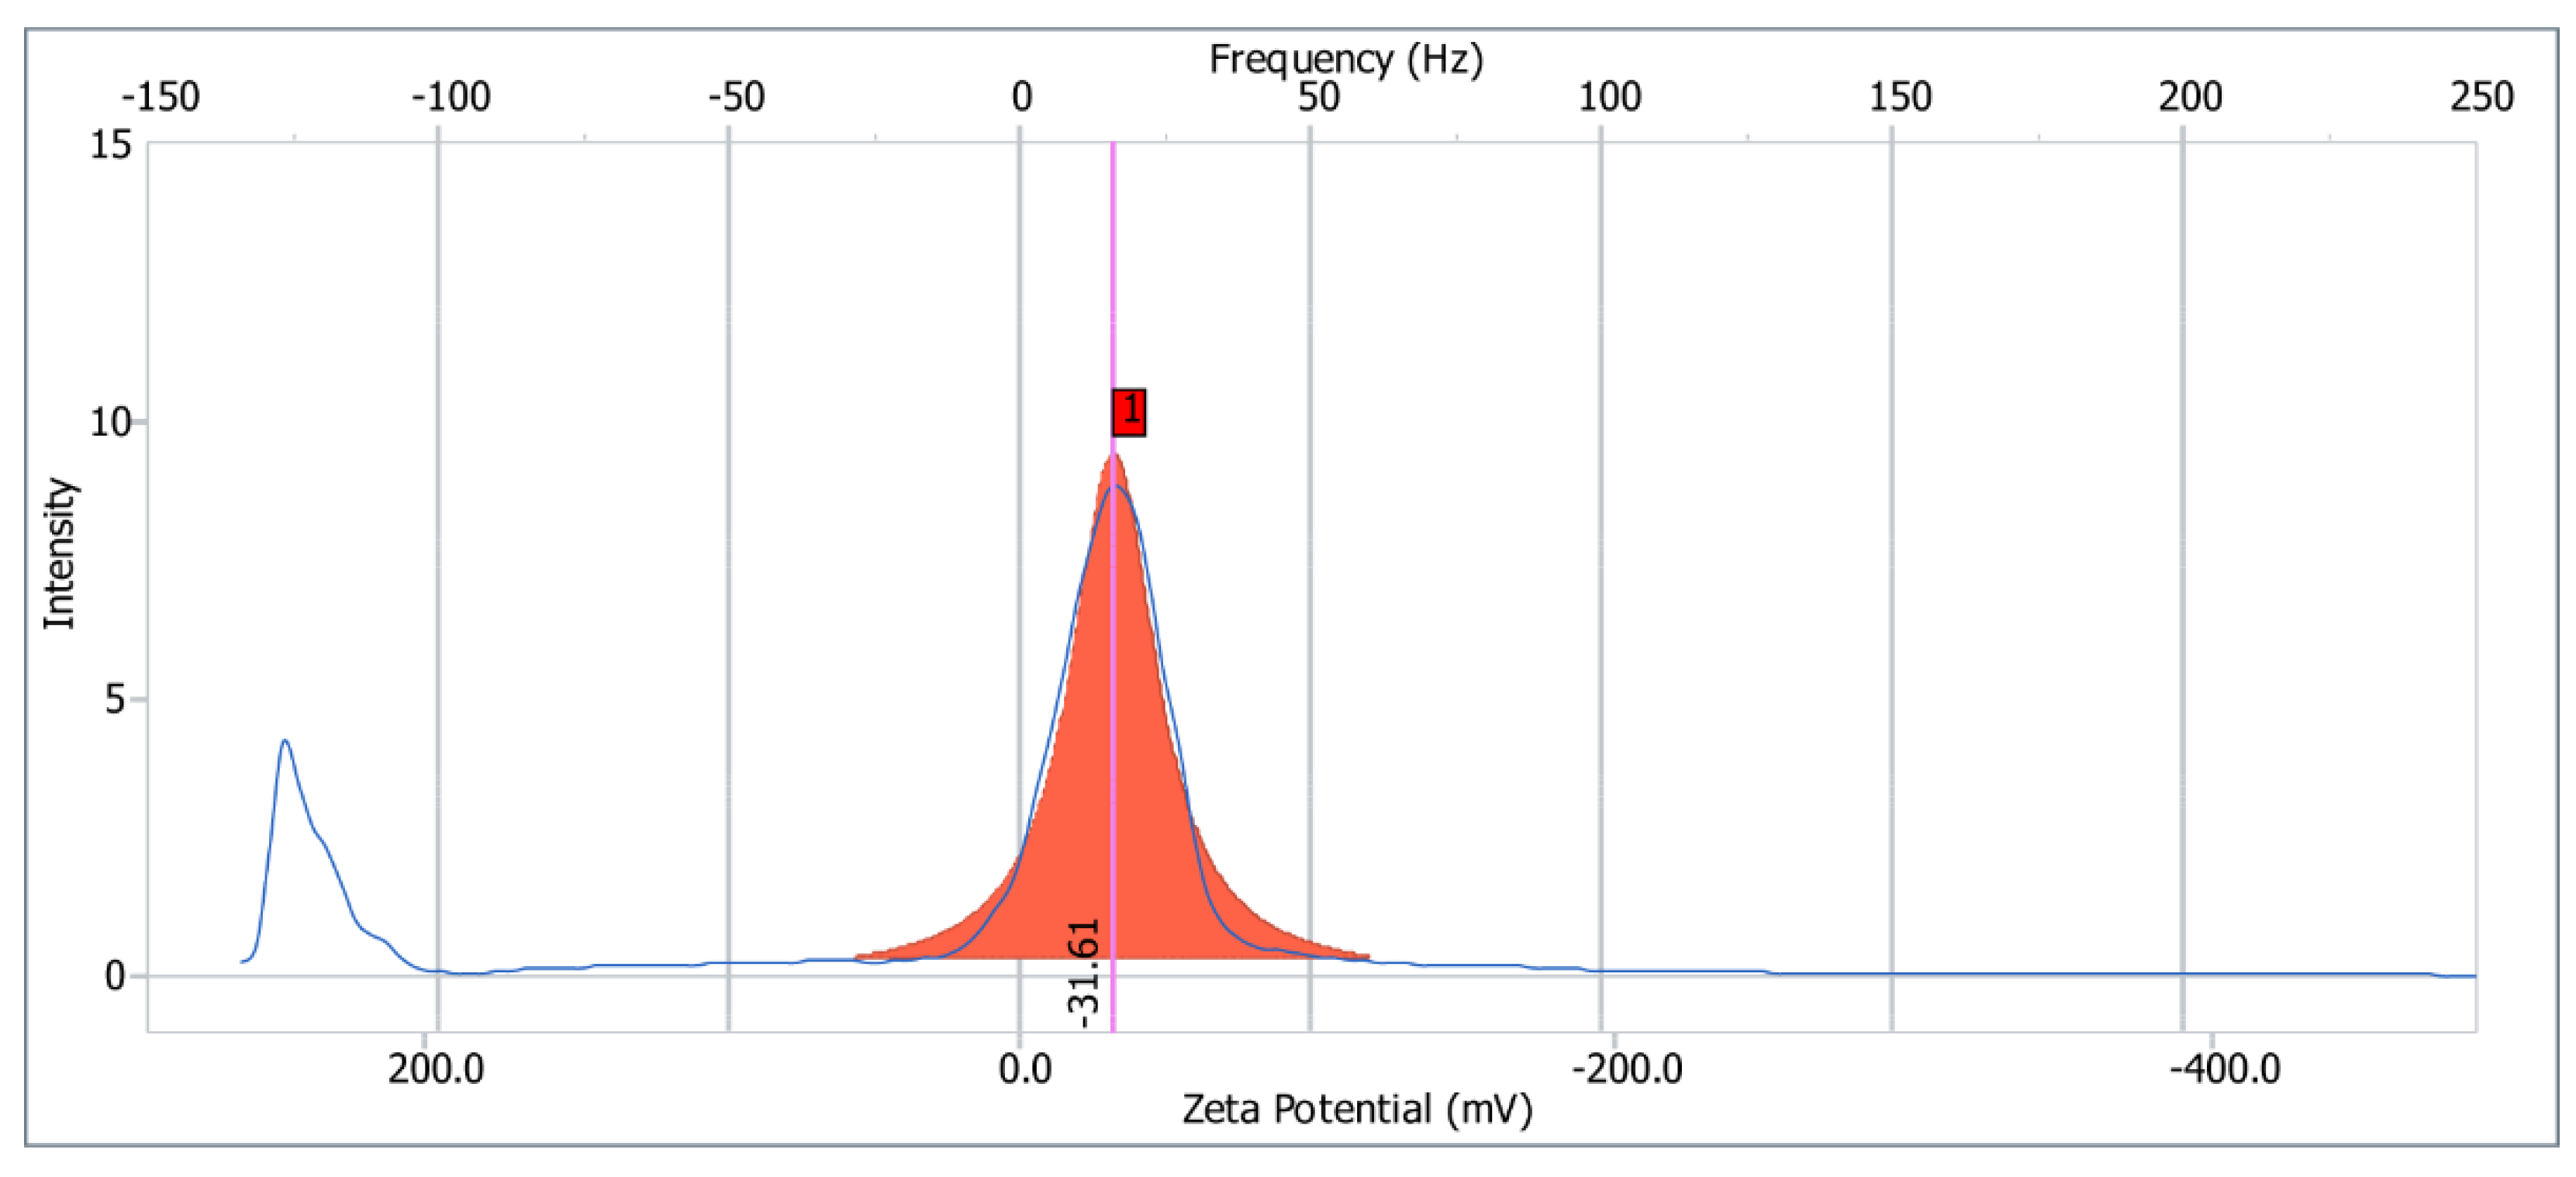
2.6. Zeta Potential
2.7. XRD Analysis
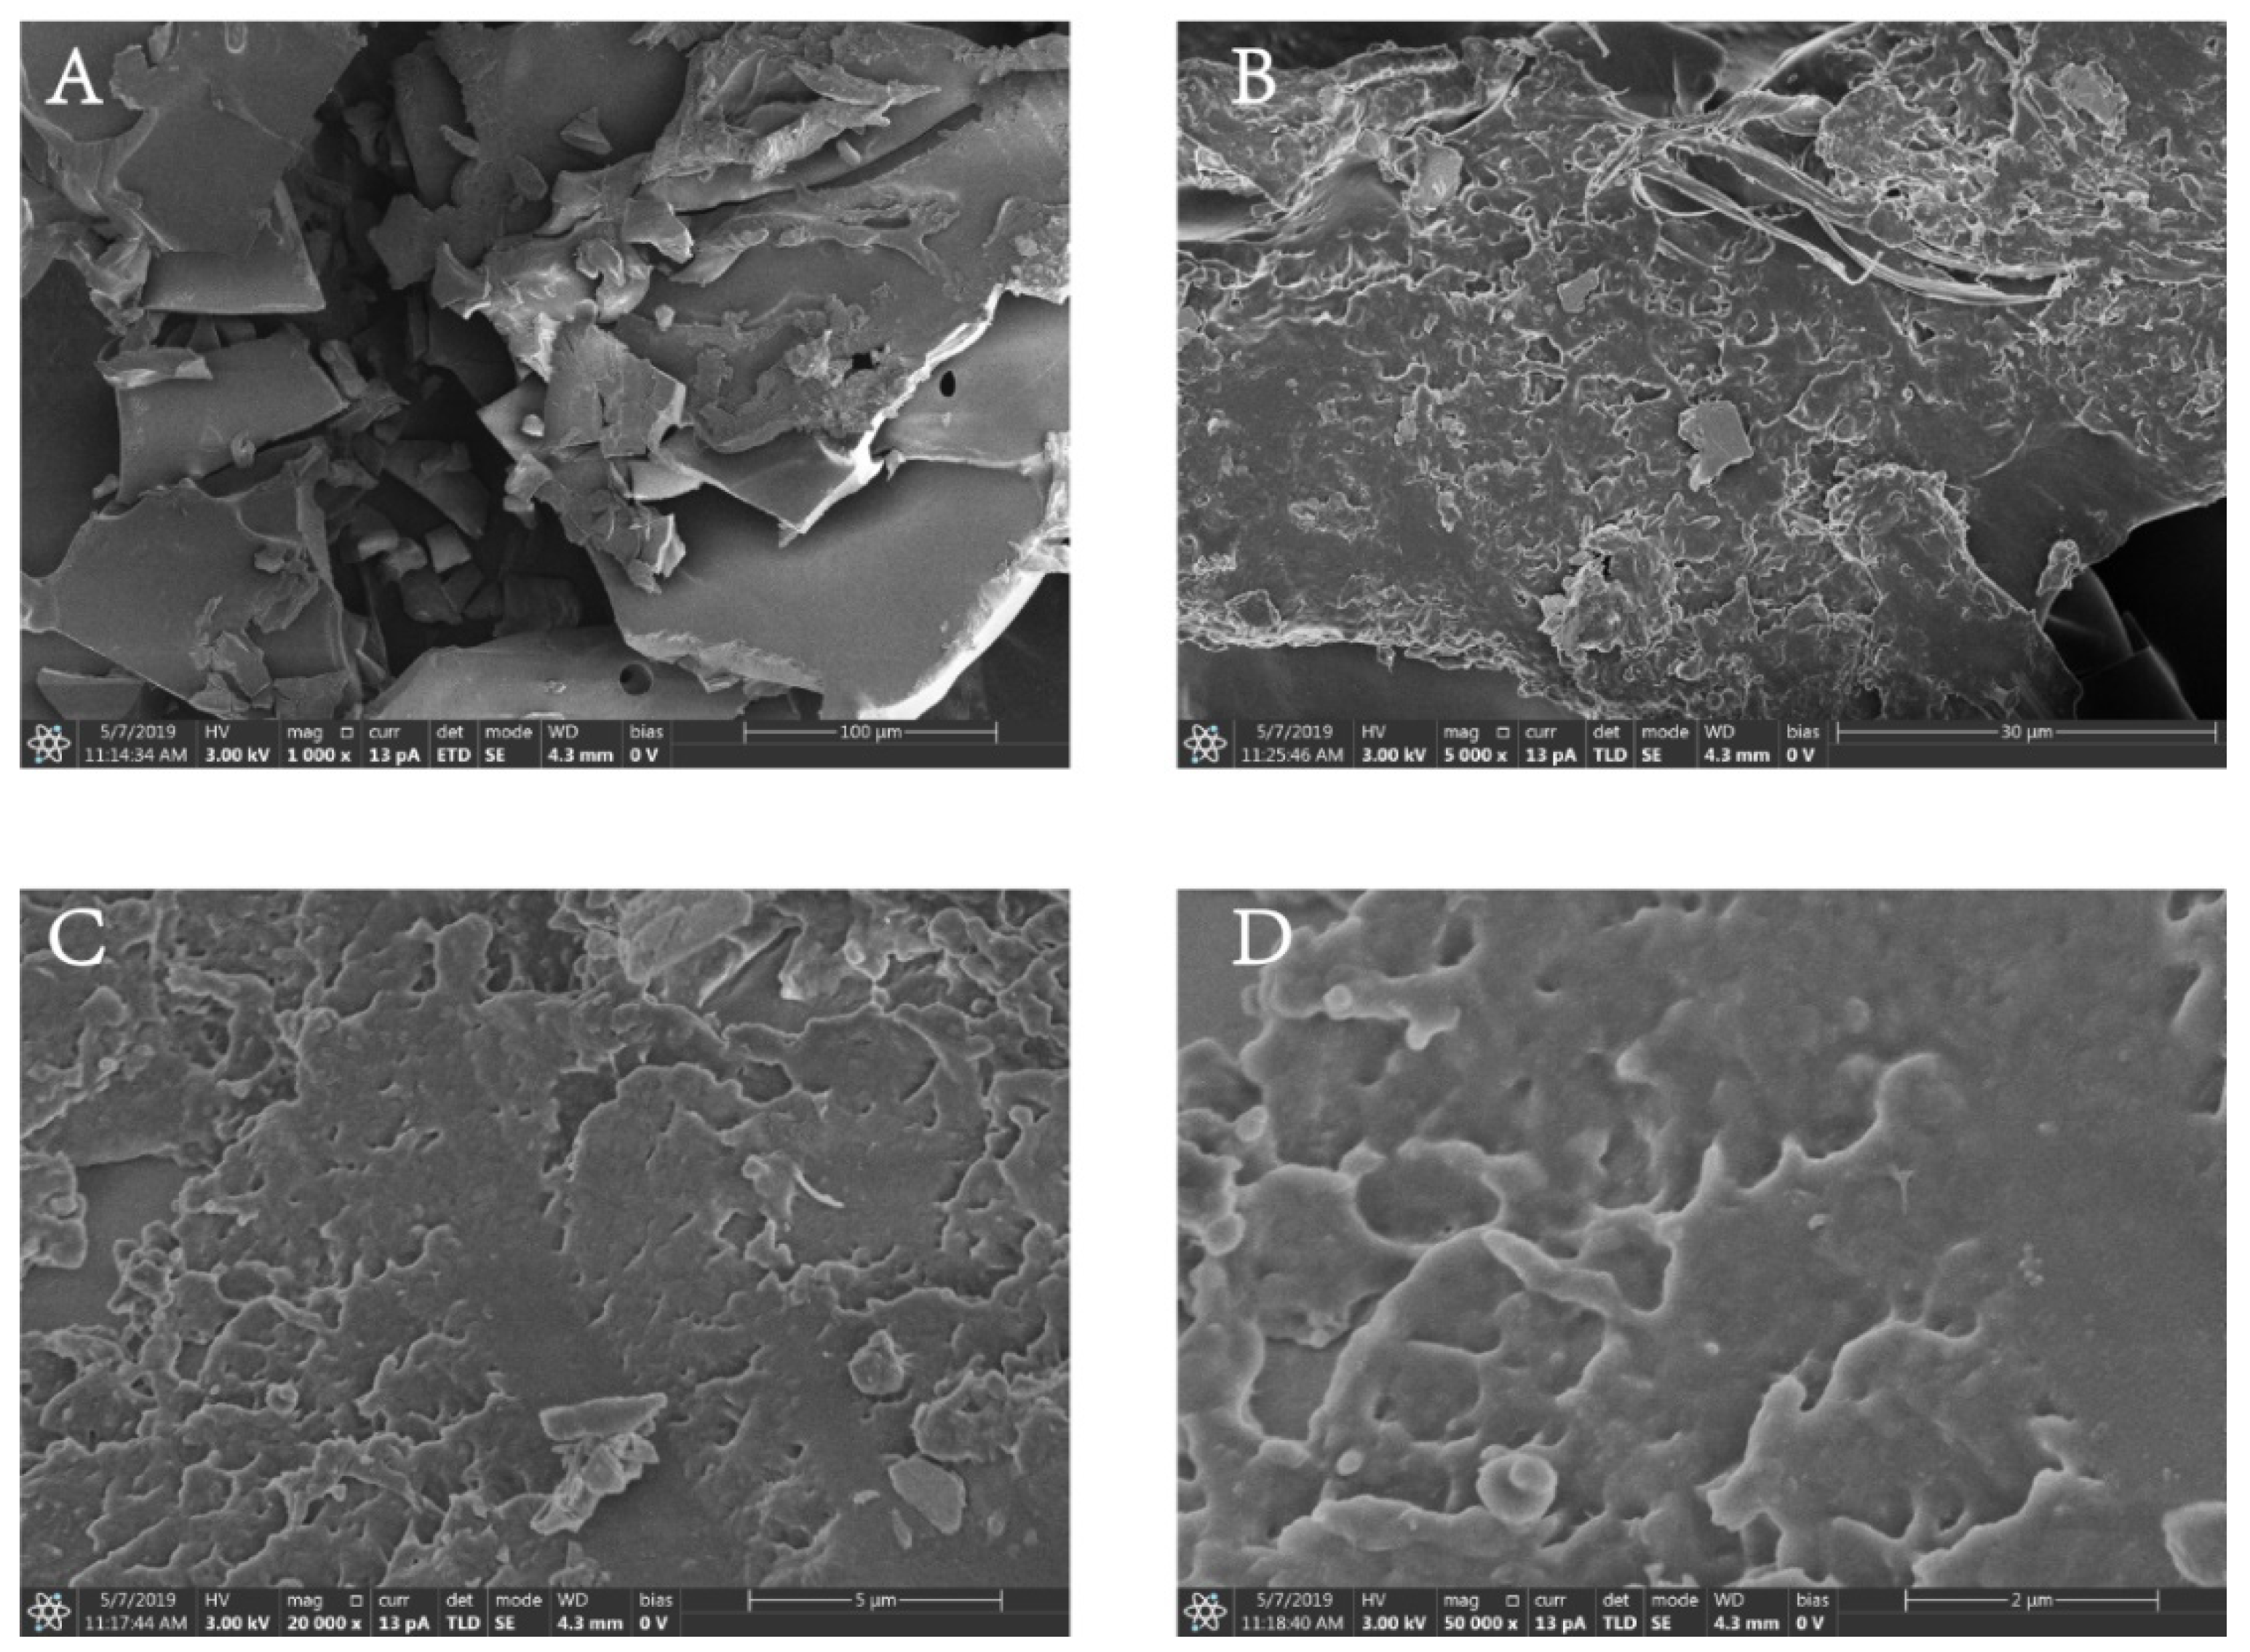
2.8. SEM Analysis
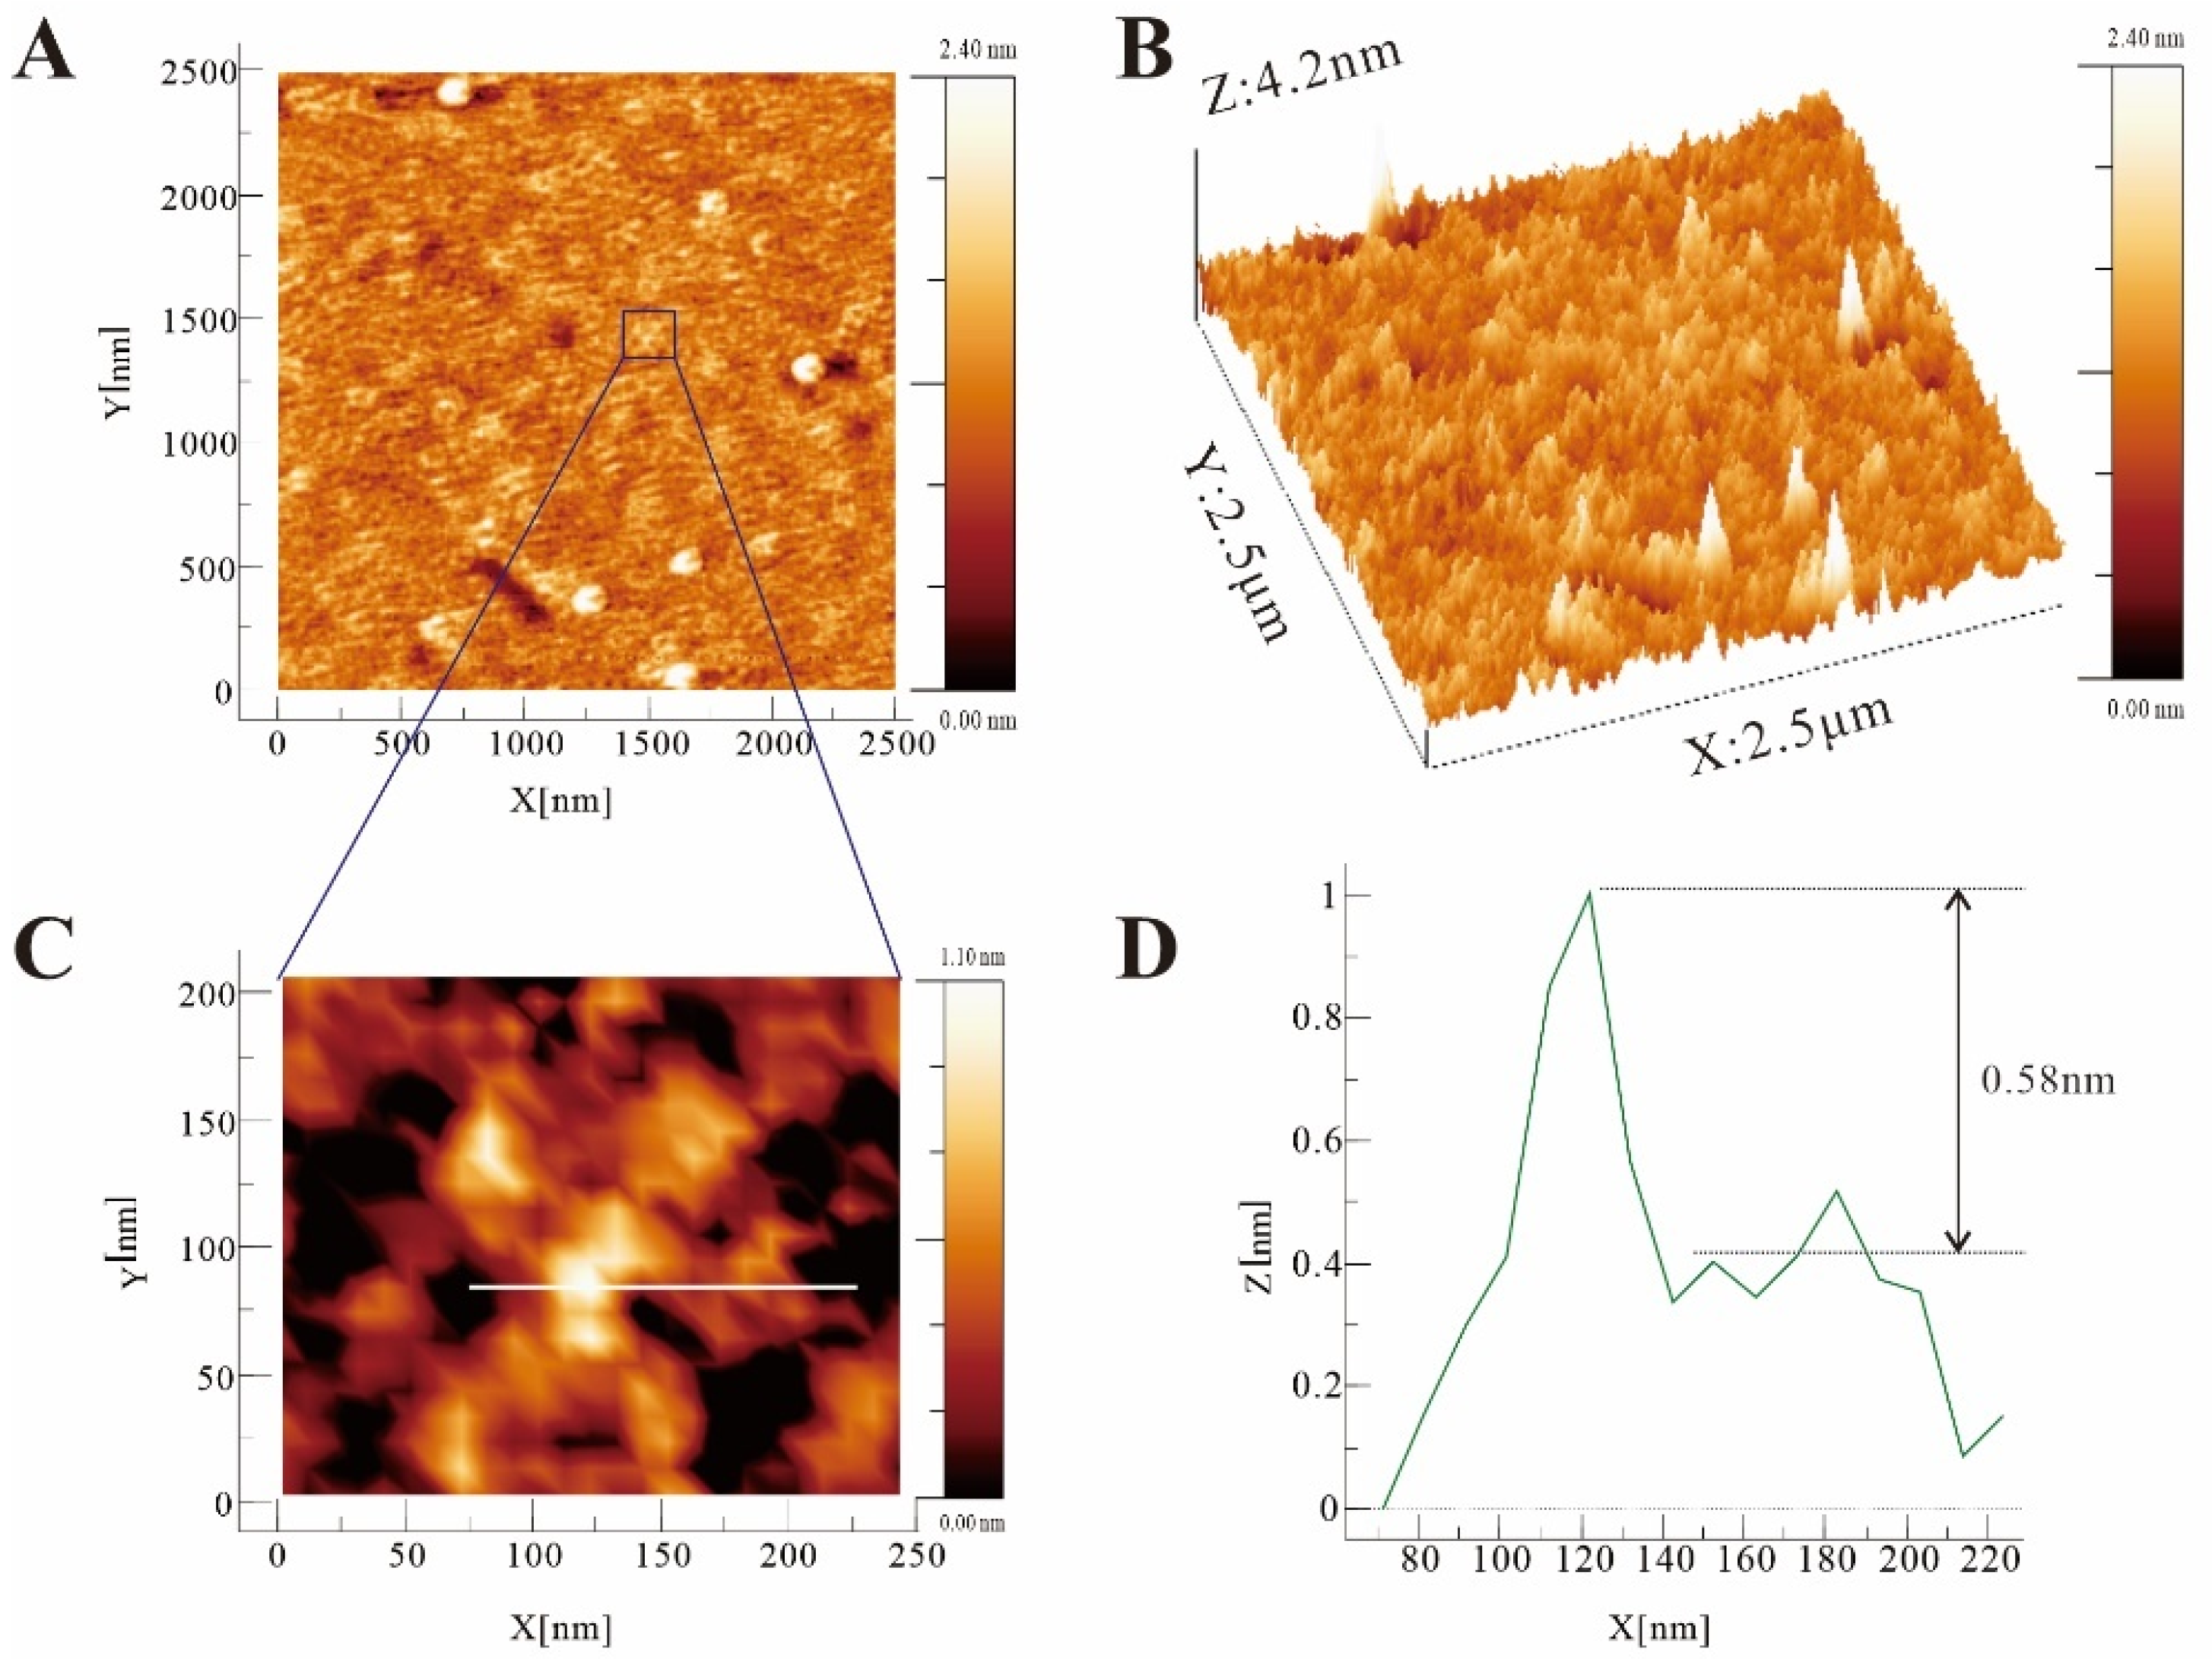
2.9. Molecular Imaging Analysis
2.10. Effects of PF40 on Fasting Blood Glucose, Insulin Levels, and HOMA-IR in T2DM Rats
2.11. PF40 Reduced Jejunal Tissue Damage in T2DM Rats
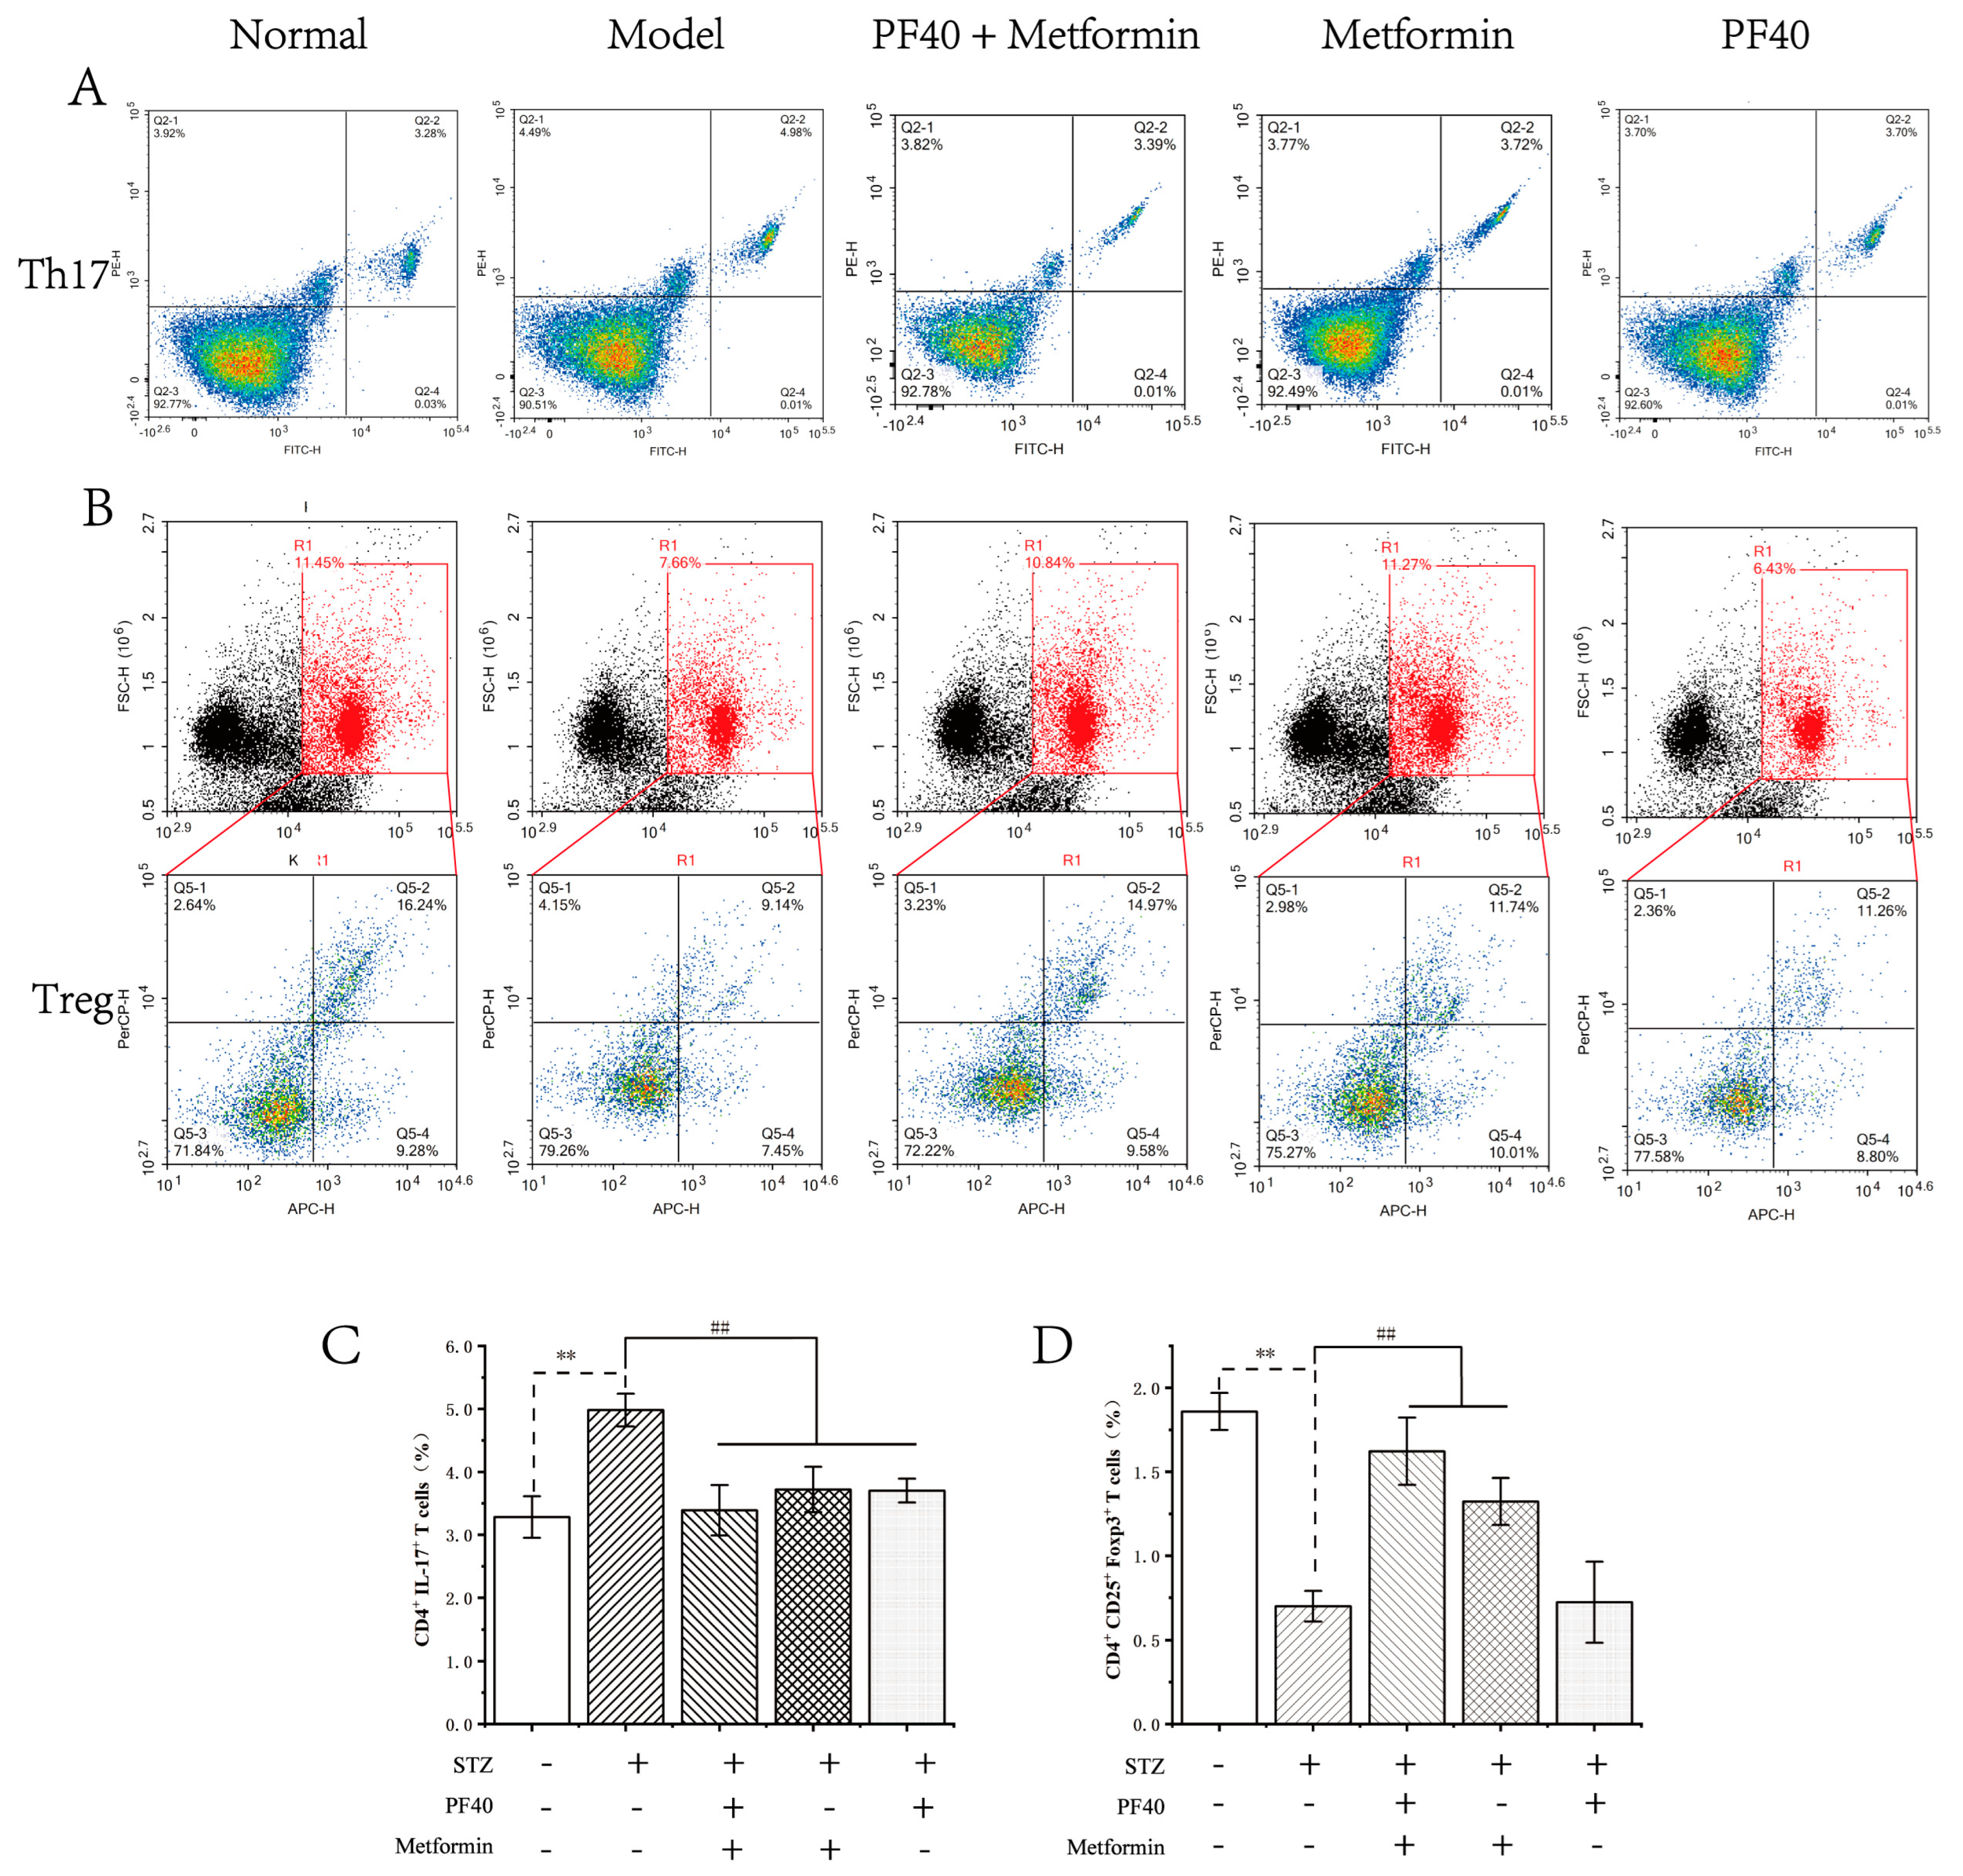
2.12. PF40 Restored Th17/Treg Balance
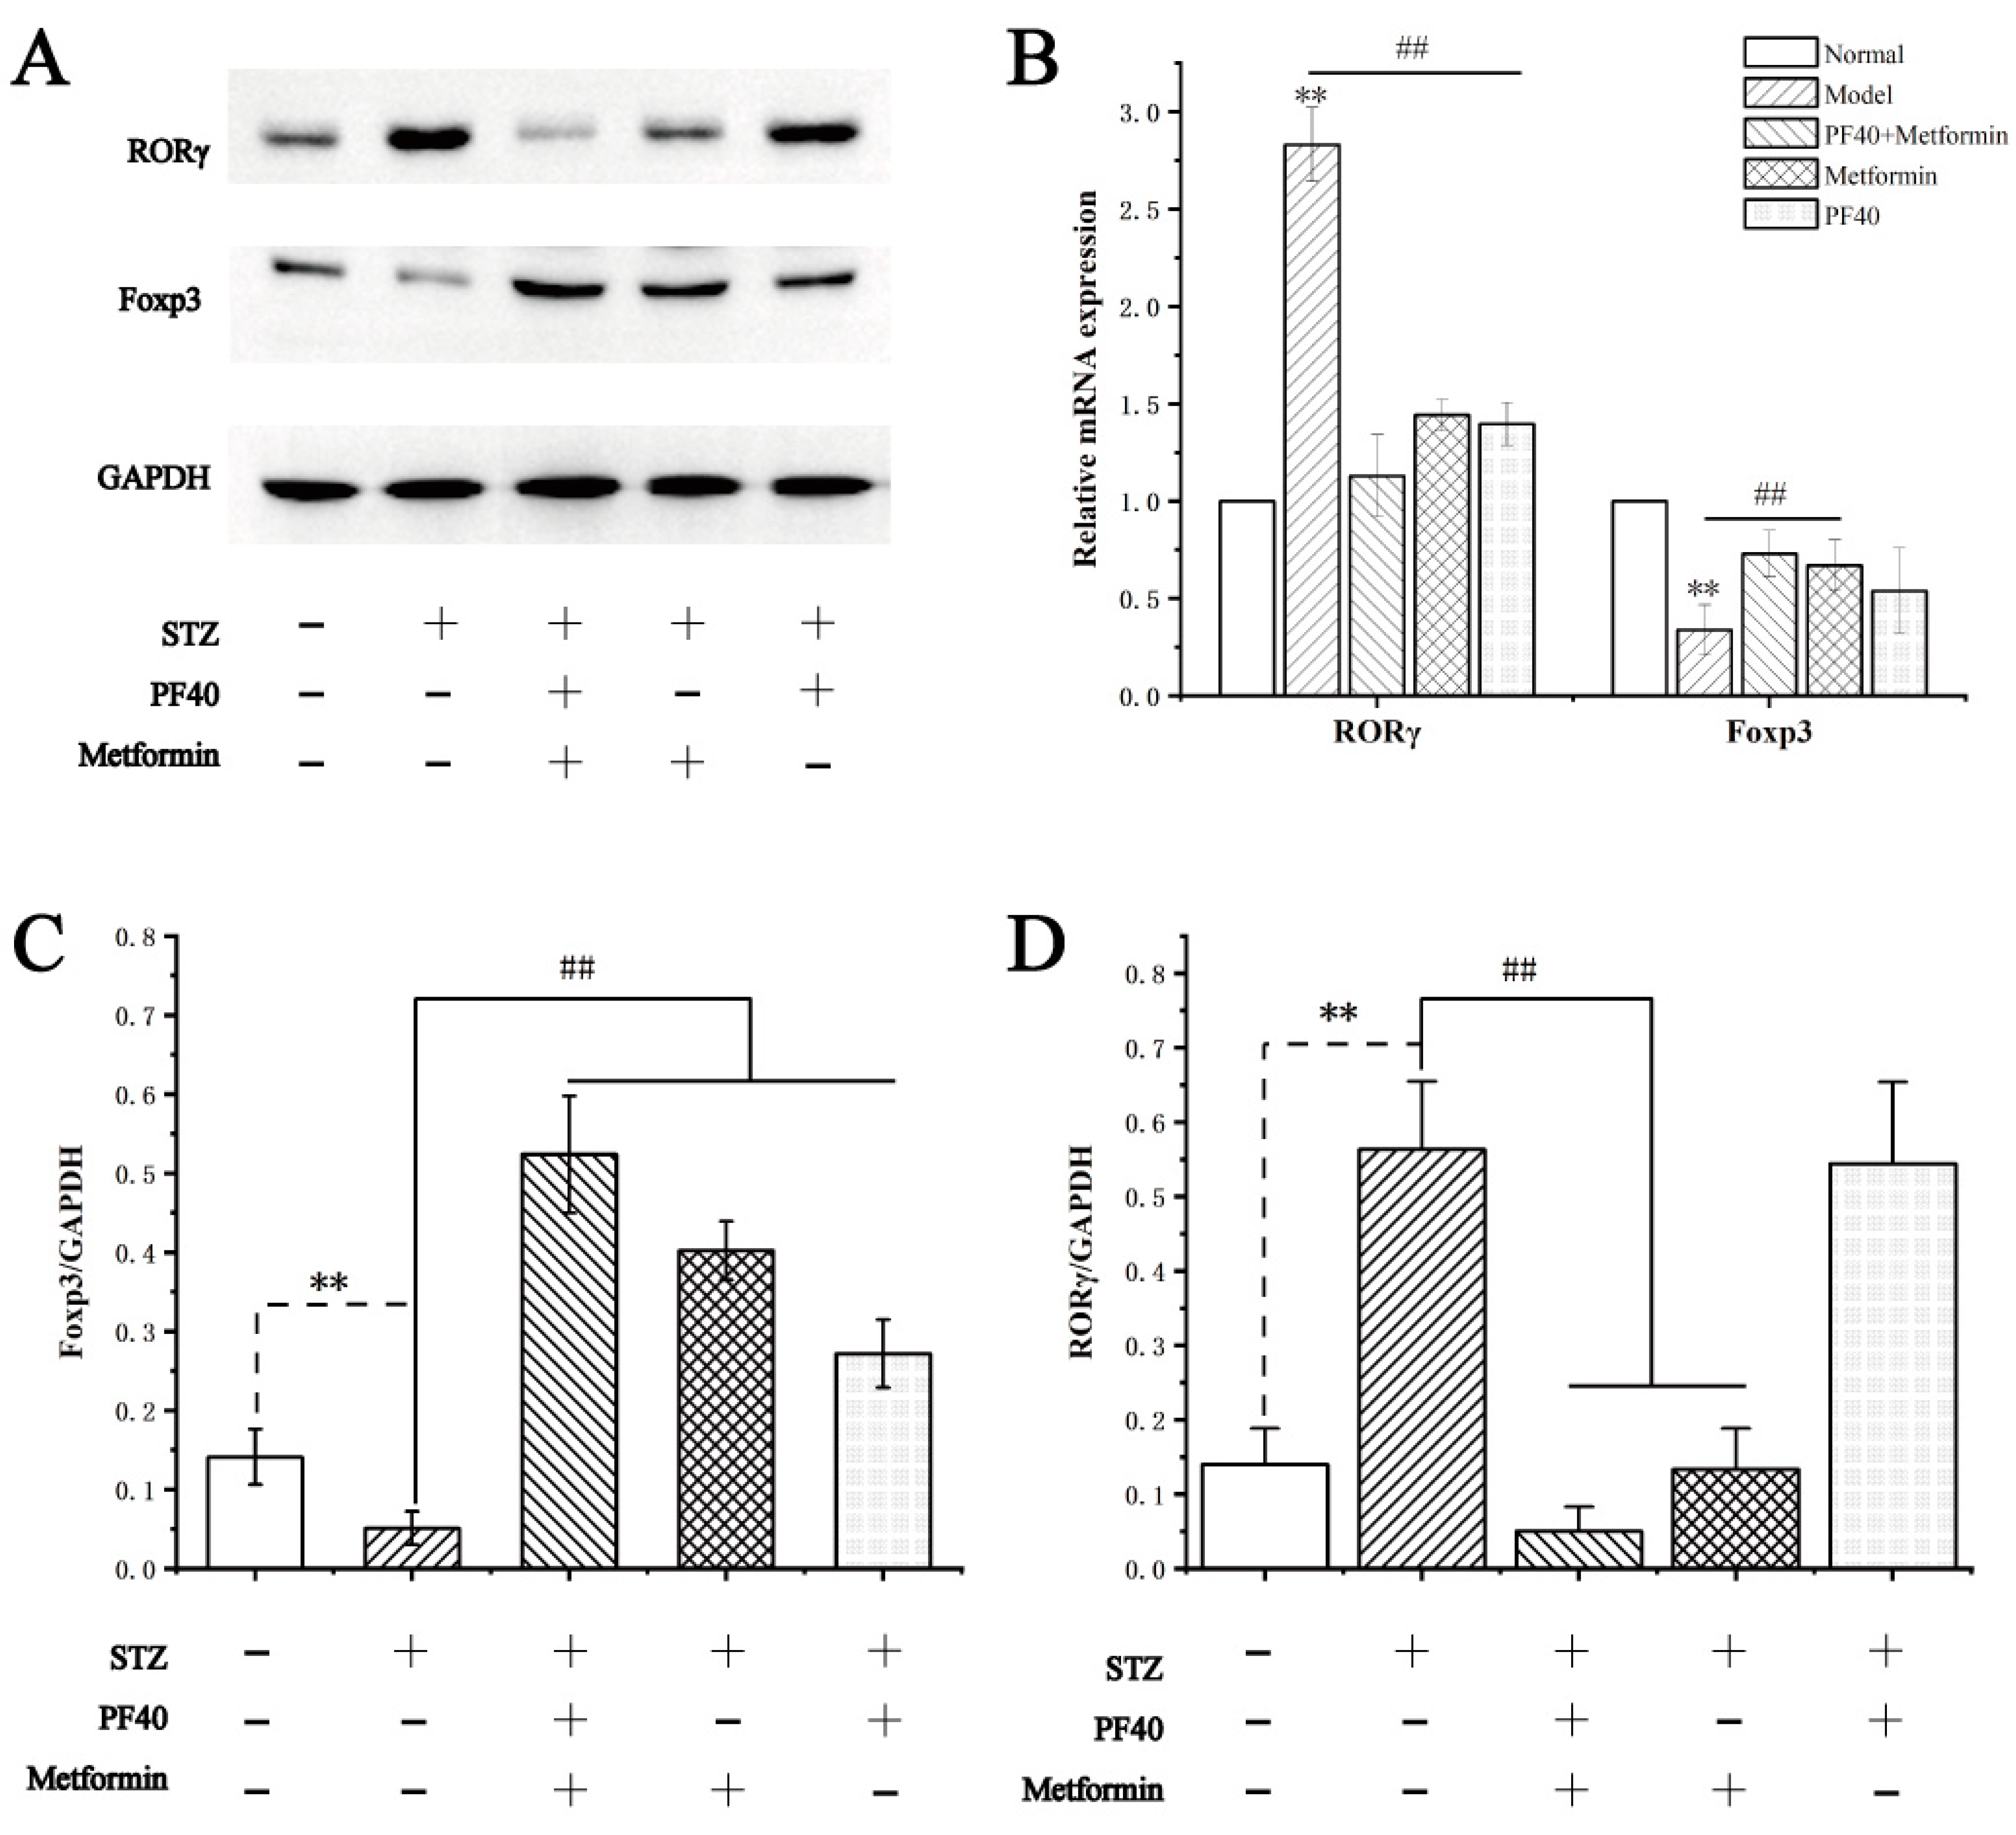
2.13. Effects of PF40 on the Expression of Transcription-Related Proteins and mRNAs in Treg and Th17 Cells
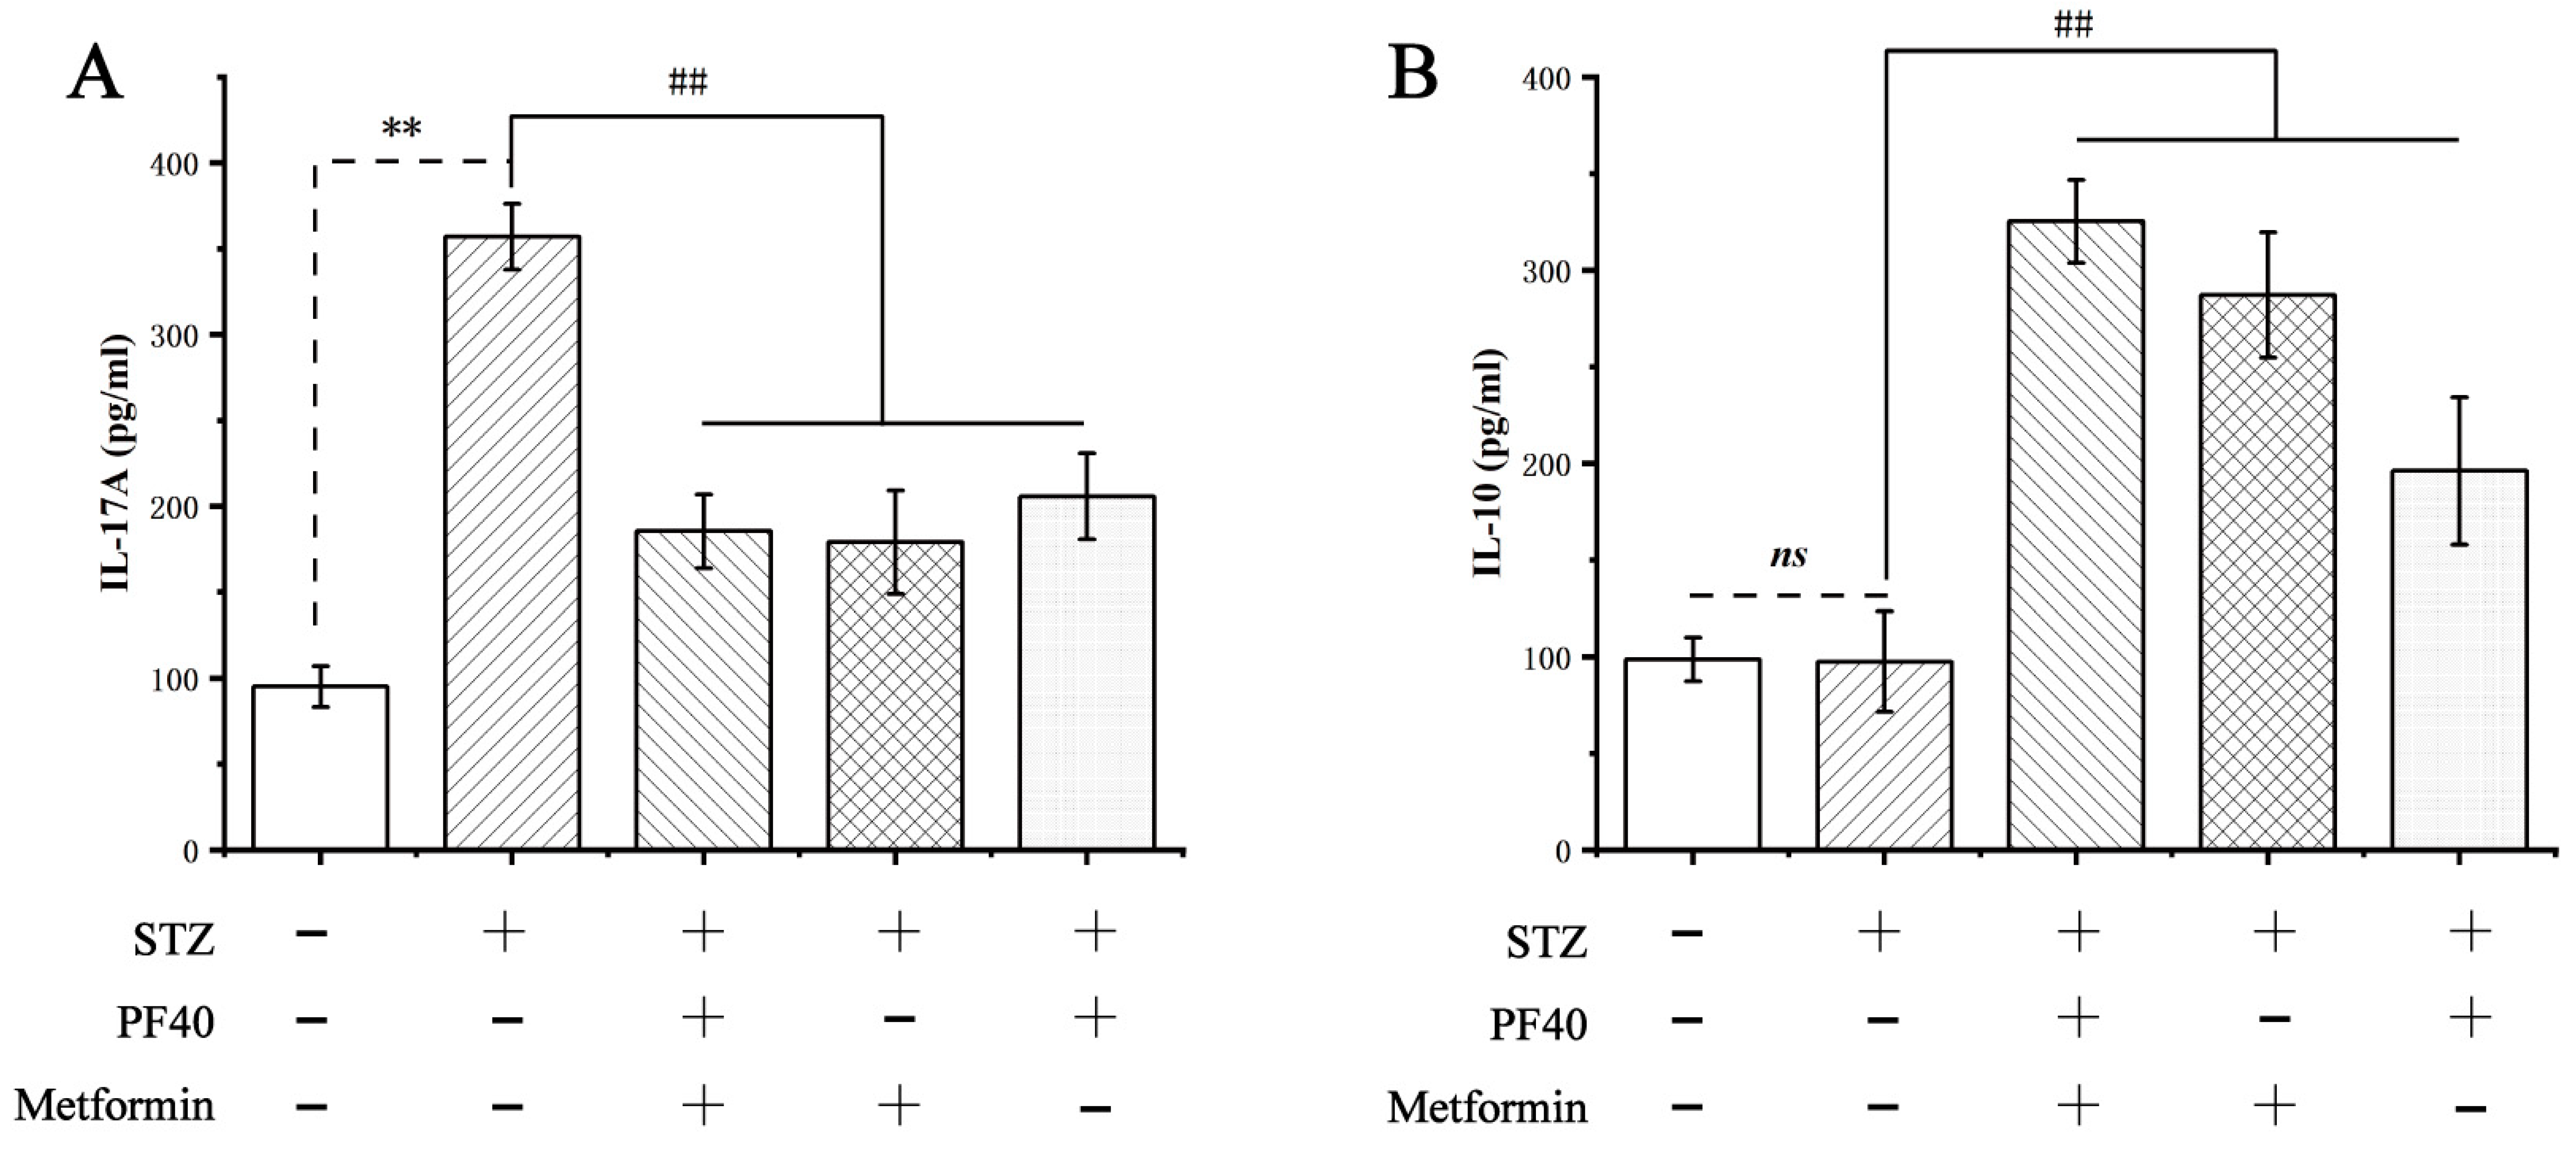
2.14. Effect of PF40 on the Levels of Cytokines
3. Materials and Methods
3.1. Materials
3.2. Preparation and Validation of PF40
3.3. FT-IR Spectroscopy
3.4. NMR Analysis
3.5. UV Spectroscopy Analysis
3.6. Congo Red Experiment
3.7. Thermal Analysis
3.8. Determination of Surface Charge
3.9. XRD Analysis
3.10. Scanning Electron Microscopy Analysis
3.11. Molecular Imaging Analysis
3.12. Animal Welfare and Ethical Statements
3.13. Establishment of an Insulin-Resistant T2DM Rat Model
3.14. Biochemical Index Tests
3.15. Morphological Analysis
3.16. Flow Cytometry Analysis
3.17. Western Blot Analysis
3.18. Real-Time Quantitative PCR Analysis
3.19. Statistical Analysis
4. Conclusions
Author Contributions
Funding
Institutional Review Board Statement
Informed Consent Statement
Data Availability Statement
Acknowledgments
Conflicts of Interest
Sample Availability
References
- Xu, L.; Li, Y.; Dai, Y.; Peng, J. Natural products for the treatment of type 2 diabetes mellitus: Pharmacology and mechanisms. Pharmacol. Res. 2018, 130, 451–465. [Google Scholar] [CrossRef] [PubMed]
- Gilleron, J.; Bouget, G.; Ivanov, S.; Meziat, C.; Ceppo, F.; Vergoni, B.; Djedaini, M.; Soprani, A.; Dumas, K.; Jacquel, A.; et al. Rab4b Deficiency in T Cells Promotes Adipose Treg/Th17 Imbalance, Adipose Tissue Dysfunction, and Insulin Resistance. Cell Rep. 2018, 25, 3329–3341. [Google Scholar] [CrossRef] [PubMed]
- Hong, C.P.; Park, A.; Yang, B.G.; Yun, C.H.; Kwak, M.J.; Lee, G.W.; Kim, J.H.; Jang, M.S.; Lee, E.J.; Jeun, E.J.; et al. Gut-Specific Delivery of T-Helper 17 Cells Reduces Obesity and Insulin Resistance in Mice. Gastroenterology 2017, 152, 1998–2010. [Google Scholar] [CrossRef] [PubMed]
- Xia, X.; Xiao, J. Natural Ingredients from Medicine Food Homology as Chemopreventive Reagents against Type 2 Diabetes Mellitus by Modulating Gut Microbiota Homoeostasis. Molecules 2021, 26, 6934. [Google Scholar] [CrossRef] [PubMed]
- Luo, A.; Leach, S.T.; Barres, R.; Hesson, L.B.; Grimm, M.C.; Simar, D. The Microbiota and Epigenetic Regulation of T Helper 17/Regulatory T Cells: In Search of a Balanced Immune System. Front. Immunol. 2017, 8, 417. [Google Scholar] [CrossRef]
- Kiernan, K.; MacIver, N.J. A Novel Mechanism for Th17 Inflammation in Human Type 2 Diabetes Mellitus. Trends Endocrinol. Metab. 2020, 31, 1–2. [Google Scholar] [CrossRef]
- Knochelmann, H.M.; Dwyer, C.J.; Bailey, S.R.; Amaya, S.M.; Elston, D.M.; Mazza-McCrann, J.M.; Paulos, C.M. When worlds collide: Th17 and Treg cells in cancer and autoimmunity. Cell. Mol. Immunol. 2018, 15, 458–469. [Google Scholar] [CrossRef]
- Zhang, S.; Gang, X.; Yang, S.; Cui, M.; Sun, L.; Li, Z.; Wang, G. The Alterations in and the Role of the Th17/Treg Balance in Metabolic Diseases. Front. Immunol. 2021, 12, 678355. [Google Scholar] [CrossRef]
- Song, B.; Li, P.; Yan, S.; Liu, Y.; Gao, M.; Lv, H.; Lv, Z.; Guo, Y. Effects of Dietary Astragalus Polysaccharide Supplementation on the Th17/Treg Balance and the Gut Microbiota of Broiler Chickens Challenged with Necrotic Enteritis. Front. Immunol. 2022, 13, 781934. [Google Scholar] [CrossRef]
- Wang, Y.J.; Li, Q.M.; Zha, X.Q.; Luo, J.P. Dendrobium fimbriatum Hook polysaccharide ameliorates dextran-sodium-sulfate-induced colitis in mice via improving intestinal barrier function, modulating intestinal microbiota, and reducing oxidative stress and inflammatory responses. Food Funct. 2022, 13, 143–160. [Google Scholar] [CrossRef]
- Chen, S.; Wang, J.; Fang, Q.; Dong, N.; Fang, Q.; Cui, S.W.; Nie, S. A polysaccharide from natural Cordyceps sinensis regulates the intestinal immunity and gut microbiota in mice with cyclophosphamide-induced intestinal injury. Food Funct. 2021, 12, 6271–6282. [Google Scholar] [CrossRef] [PubMed]
- Chen, J.; Pang, W.; Kan, Y.; Zhao, L.; He, Z.; Shi, W.; Yan, B.; Chen, H.; Hu, J. Structure of a pectic polysaccharide from Pseudostellaria heterophylla and stimulating insulin secretion of INS-1 cell and distributing in rats by oral. Int. J. Biol. Macromol. 2018, 106, 456–463. [Google Scholar] [CrossRef] [PubMed]
- Hu, J.; Pang, W.; Chen, J.; Bai, S.; Zheng, Z.; Wu, X. Hypoglycemic effect of polysaccharides with different molecular weight of Pseudostellaria heterophylla. BMC Complement. Altern. Med. 2013, 13, 267. [Google Scholar] [CrossRef] [PubMed]
- Barker, S.A.; Bourne, E.J.; Stacey, M.; Whiffen, D.H. Infra-red spectra of carbohydrates. Part I. Some derivatives of D-glucopyranose. J. Chem. Soc. 1954, 171–176. [Google Scholar] [CrossRef]
- Lemieszek, M.K.; Komaniecka, I.; Chojnacki, M.; Choma, A.; Rzeski, W. Immunomodulatory Properties of Polysaccharide-Rich Young Green Barley (Hordeum vulgare) Extract and Its Structural Characterization. Molecules 2022, 27, 1742. [Google Scholar] [CrossRef]
- Hong, T.; Yin, J.Y.; Nie, S.P.; Xie, M.Y. Applications of infrared spectroscopy in polysaccharide structural analysis: Progress, challenge and perspective. Food Chem. X 2021, 12, 100168. [Google Scholar] [CrossRef]
- Tan, M.; Zhao, Q.; Zhao, B. Physicochemical properties, structural characterization and biological activities of polysaccharides from quinoa (Chenopodium quinoa Willd.) seeds. Int. J. Biol. Macromol. 2021, 193 Pt B, 1635–1644. [Google Scholar] [CrossRef]
- Chen, J.; Pang, W.; Shi, W.; Yang, B.; Kan, Y.; He, Z.; Hu, J. Structural Elucidation of a Novel Polysaccharide from Pseudostellaria heterophylla and Stimulating Glucose Uptake in Cells and Distributing in Rats by Oral. Molecules 2016, 21, 1233. [Google Scholar] [CrossRef]
- Liu, W.; Lv, X.; Huang, W.; Yao, W.; Gao, X. Characterization and hypoglycemic effect of a neutral polysaccharide extracted from the residue of Codonopsis pilosula. Carbohydr. Polym. 2018, 197, 215–226. [Google Scholar] [CrossRef]
- Li, H.; Li, J.; Shi, H.; Li, C.; Huang, W.; Zhang, M.; Luo, Y.; Song, L.; Yu, R.; Zhu, J. Structural characterization and immunoregulatory activity of a novel acidic polysaccharide from Scapharca subcrenata. Int. J. Biol. Macromol. 2022, 210, 439–454. [Google Scholar] [CrossRef]
- Yang, B.; Luo, Y.; Sang, Y.; Kan, J. Isolation, purification, structural characterization, and hypoglycemic activity assessment of polysaccharides from Hovenia dulcis (Guai Zao). Int. J. Biol. Macromol. 2022, 208, 1106–1115. [Google Scholar] [CrossRef] [PubMed]
- Zhou, S.; Huang, G.; Chen, G. Extraction, structural analysis, derivatization and antioxidant activity of polysaccharide from Chinese yam. Food Chem. 2021, 361, 130089. [Google Scholar] [CrossRef] [PubMed]
- Zhang, X.; Zhang, X.; Gu, S.; Pan, L.; Sun, H.; Gong, E.; Zhu, Z.; Wen, T.; Daba, G.M.; Elkhateeb, W.A. Structure analysis and antioxidant activity of polysaccharide-iron (III) from Cordyceps militaris mycelia. Int. J. Biol. Macromol. 2021, 178, 170–179. [Google Scholar] [CrossRef] [PubMed]
- Tan, M.; Chang, S.; Liu, J.; Li, H.; Xu, P.; Wang, P.; Wang, X.; Zhao, M.; Zhao, B.; Wang, L.; et al. Physicochemical Properties, Antioxidant and Antidiabetic Activities of Polysaccharides from Quinoa (Chenopodium quinoa Willd.) Seeds. Molecules 2020, 25, 3840. [Google Scholar] [CrossRef]
- Ma, B.; Feng, T.; Zhang, S.; Zhuang, H.; Chen, D.; Yao, L.; Zhang, J. The Inhibitory Effects of Hericium erinaceus beta-glucan on in vitro Starch Digestion. Front. Nutr. 2020, 7, 621131. [Google Scholar] [CrossRef]
- Kolsi, R.B.A.; Fakhfakh, J.; Krichen, F.; Jribi, I.; Chiarore, A.; Patti, F.P.; Blecker, C.; Allouche, N.; Belghith, H.; Belghith, K. Structural characterization and functional properties of antihypertensive Cymodocea nodosa sulfated polysaccharide. Carbohydr. Polym. 2016, 151, 511–522. [Google Scholar] [CrossRef]
- Arab, K.; Ghanbarzadeh, B.; Ayaseh, A.; Jahanbin, K. Extraction, purification, physicochemical properties and antioxidant activity of a new polysaccharide from Ocimum album L. seed. Int. J. Biol. Macromol. 2021, 180, 643–653. [Google Scholar] [CrossRef]
- Li, X.; Wang, L. Effect of extraction method on structure and antioxidant activity of Hohenbuehelia serotina polysaccharides. Int. J. Biol. Macromol. 2016, 83, 270–276. [Google Scholar] [CrossRef]
- Varma, C.A.K.; Jayaram Kumar, K. Characterization and evaluation of smart releasing polysaccharide from yellow poinciana seed of Jharkhand. Int. J. Biol. Macromol. 2018, 118 Pt B, 2156–2162. [Google Scholar] [CrossRef]
- Wang, M.Z.; He, X.; Yu, Z.; Wu, H.; Yang, T.H. A Nano Drug Delivery System Based on Angelica sinensis Polysaccharide for Combination of Chemotherapy and Immunotherapy. Molecules 2020, 25, 3096. [Google Scholar] [CrossRef]
- Zhang, S.; He, Z.; Cheng, Y.; Xu, F.; Cheng, X.; Wu, P. Physicochemical characterization and emulsifying properties evaluation of RG-I enriched pectic polysaccharides from Cerasus humilis. Carbohydr. Polym. 2021, 260, 117824. [Google Scholar] [CrossRef] [PubMed]
- Wang, L.; Li, L.; Gao, J.; Huang, J.; Yang, Y.; Xu, Y.; Liu, S.; Yu, W. Characterization, antioxidant and immunomodulatory effects of selenized polysaccharides from dandelion roots. Carbohydr. Polym. 2021, 260, 117796. [Google Scholar] [CrossRef] [PubMed]
- Ji, X.; Hou, C.; Yan, Y.; Shi, M.; Liu, Y. Comparison of structural characterization and antioxidant activity of polysaccharides from jujube (Ziziphus jujuba Mill.) fruit. Int. J. Biol. Macromol. 2020, 149, 1008–1018. [Google Scholar] [CrossRef] [PubMed]
- Kouadri, I.; Layachi, A.; Makhlouf, A.; Satha, H. Optimization of extraction process and characterization of water-soluble polysaccharide (Galactomannan) from Algerian biomass; Citrullus colocynthis seeds. Int. J. Polym. Anal. Charact. 2018, 23, 362–375. [Google Scholar] [CrossRef]
- Wang, D.D.; Shao, S.; Zhang, Y.Q.; Zhao, D.Q.; Wang, M.X. Insight into Polysaccharides from Panax ginseng C. A. Meyer in Improving Intestinal Inflammation: Modulating Intestinal Microbiota and Autophagy. Front. Immunol. 2021, 12, 683911. [Google Scholar] [CrossRef]
- Nakamura, A.; Ohboshi, H.; Sakai, M.; Nomura, K.; Nishiyama, S.; Ashida, H. Extraction of water-soluble polysaccharides from kidney beans and examination of their protein dispersion and stabilization properties under acidic conditions. Food Res. Int. 2021, 144, 110357. [Google Scholar] [CrossRef]
- Nomura, K.; Sakai, M.; Ohboshi, H.; Nakamura, A. Extraction of a water-soluble polysaccharide fraction from lentils and its potential application in acidified protein dispersions. Food Hydrocoll. 2021, 117, 106740. [Google Scholar] [CrossRef]
- Liu, Y.J.; Tang, B.; Wang, F.C.; Tang, L.; Lei, Y.Y.; Luo, Y.; Huang, S.J.; Yang, M.; Wu, L.Y.; Wang, W.; et al. Parthenolide ameliorates colon inflammation through regulating Treg/Th17 balance in a gut microbiota-dependent manner. Theranostics 2020, 10, 5225–5241. [Google Scholar] [CrossRef]
- Sefik, E.; Geva-Zatorsky, N.; Oh, S.; Konnikova, L.; Zemmour, D.; McGuire, A.M.; Burzyn, D.; Ortiz-Lopez, A.; Lobera, M.; Yang, J.; et al. Individual intestinal symbionts induce a distinct population of RORgamma(+) regulatory T cells. Science 2015, 349, 993–997. [Google Scholar] [CrossRef]
- Yang, X.O.; Nurieva, R.; Martinez, G.J.; Kang, H.S.; Chung, Y.; Pappu, B.P.; Shah, B.; Chang, S.H.; Schluns, K.S.; Watowich, S.S.; et al. Molecular antagonism and plasticity of regulatory and inflammatory T cell programs. Immunity 2008, 29, 44–56. [Google Scholar] [CrossRef]
- Lochner, M.; Peduto, L.; Cherrier, M.; Sawa, S.; Langa, F.; Varona, R.; Riethmacher, D.; Si-Tahar, M.; Di Santo, J.P.; Eberl, G. In vivo equilibrium of proinflammatory IL-17+ and regulatory IL-10+ Foxp3+ RORgamma t+ T cells. J. Exp. Med. 2008, 205, 1381–1393. [Google Scholar] [CrossRef] [PubMed]
- Zhou, Y.; Qian, C.; Yang, D.; Tang, C.; Xu, X.; Liu, E.H.; Zhong, J.; Zhu, L.; Zhao, Z. Purification, Structural Characterization and Immunomodulatory Effects of Polysaccharides from Amomumvillosum Lour. on RAW 264.7 Macrophages. Molecules 2021, 26, 2672. [Google Scholar] [CrossRef] [PubMed]
- Zhou, S.; Huang, G.; Huang, H. Extraction, derivatization and antioxidant activities of onion polysaccharide. Food Chem. 2022, 388, 133000. [Google Scholar] [CrossRef] [PubMed]
- Yang, W.; Huang, G. Extraction, structural characterization, and physicochemical properties of polysaccharide from purple sweet potato. Chem. Biol. Drug Des. 2021, 98, 979–985. [Google Scholar] [CrossRef] [PubMed]
- Esquivel-Fajardo, E.A.; Martinez-Ascencio, E.U.; Oseguera-Toledo, M.E.; Londono-Restrepo, S.M.; Rodriguez-Garcia, M.E. Influence of physicochemical changes of the avocado starch throughout its pasting profile: Combined extraction. Carbohydr. Polym. 2022, 281, 119048. [Google Scholar] [CrossRef]
- Kumar Varma, C.A.; Jayaram Kumar, K. Structural, functional and pH sensitive release characteristics of water-soluble polysaccharide from the seeds of Albizia lebbeck L. Carbohydr. Polym. 2017, 175, 502–508. [Google Scholar] [CrossRef]
- Alyamani, A.A.; Albukhaty, S.; Aloufi, S.; AlMalki, F.A.; Al-Karagoly, H.; Sulaiman, G.M. Green Fabrication of Zinc Oxide Nanoparticles Using Phlomis Leaf Extract: Characterization and In Vitro Evaluation of Cytotoxicity and Antibacterial Properties. Molecules 2021, 26, 6140. [Google Scholar] [CrossRef]
- Fan, R.; Mao, G.; Xia, H.; Zeng, J. Chemical elucidation and rheological properties of a pectic polysaccharide extracted from Citrus medica L. fruit residues by gradient ethanol precipitation. Int. J. Biol. Macromol. 2022, 198, 46–53. [Google Scholar] [CrossRef]
- Okur, I.; Soyler, B.; Sezer, P.; Oztop, M.H.; Alpas, H. Improving the Recovery of Phenolic Compounds from Spent Coffee Grounds (SCG) by Environmentally Friendly Extraction Techniques. Molecules 2021, 26, 613. [Google Scholar] [CrossRef]
- Lipiec, E.; Sofinska, K.; Seweryn, S.; Wilkosz, N.; Szymonski, M. Revealing DNA Structure at Liquid/Solid Interfaces by AFM-Based High-Resolution Imaging and Molecular Spectroscopy. Molecules 2021, 26, 6476. [Google Scholar] [CrossRef]
- Guedes, P.L.R.; Carvalho, C.P.F.; Carbonel, A.A.F.; Simões, M.J.; Icimoto, M.Y.; Aguiar, J.A.K.; Kouyoumdjian, M.; Gazarini, M.L.; Nagaoka, M.R. Chondroitin Sulfate Protects the Liver in an Experimental Model of Extra-Hepatic Cholestasis Induced by Common Bile Duct Ligation. Molecules 2022, 27, 654. [Google Scholar] [CrossRef] [PubMed]
- Zha, Z.; Lv, Y.; Tang, H.; Li, T.; Miao, Y.; Cheng, J.; Wang, G.; Tan, Y.; Zhu, Y.; Xing, X.; et al. An orally administered butyrate-releasing xylan derivative reduces inflammation in dextran sulphate sodium-induced murine colitis. Int. J. Biol. Macromol. 2020, 156, 1217–1233. [Google Scholar] [CrossRef] [PubMed]
- Wei, Y.; Gao, J.; Qin, L.; Xu, Y.; Wang, D.; Shi, H.; Xu, T.; Liu, T. Tanshinone I alleviates insulin resistance in type 2 diabetes mellitus rats through IRS-1 pathway. Biomed. Pharmacother. 2017, 93, 352–358. [Google Scholar] [CrossRef] [PubMed]


| Blood Glucose (mmol/L) | Insulin Levels (mU/L) | HOMA-IR | |
|---|---|---|---|
| Normal | 5.14 ± 0.89 | 8.58 ± 0.24 | 1.95 ± 0.33 |
| Model | 17.22 ± 7.48 ** | 12.17 ± 0.23 ** | 10.90 ± 2.00 * |
| PF40 + metformin | 6.52 ± 2.21 ## | 8.73 ± 0.38 ## | 2.55 ± 0.99 ## |
| Metformin | 8.86 ± 3.81 # | 8.14 ± 0.38 ## | 3.19 ± 1.34 ## |
| PF40 | 8.90 ± 5.61 # | 9.12 ± 0.7 ## | 3.63 ± 2.41 ## |
Publisher’s Note: MDPI stays neutral with regard to jurisdictional claims in published maps and institutional affiliations. |
© 2022 by the authors. Licensee MDPI, Basel, Switzerland. This article is an open access article distributed under the terms and conditions of the Creative Commons Attribution (CC BY) license (https://creativecommons.org/licenses/by/4.0/).
Share and Cite
Liu, Y.; Kan, Y.; Huang, Y.; Jiang, C.; Zhao, L.; Hu, J.; Pang, W. Physicochemical Characteristics and Antidiabetic Properties of the Polysaccharides from Pseudostellaria heterophylla. Molecules 2022, 27, 3719. https://doi.org/10.3390/molecules27123719
Liu Y, Kan Y, Huang Y, Jiang C, Zhao L, Hu J, Pang W. Physicochemical Characteristics and Antidiabetic Properties of the Polysaccharides from Pseudostellaria heterophylla. Molecules. 2022; 27(12):3719. https://doi.org/10.3390/molecules27123719
Chicago/Turabian StyleLiu, Yingying, Yongjun Kan, Yating Huang, Chang Jiang, Li Zhao, Juan Hu, and Wensheng Pang. 2022. "Physicochemical Characteristics and Antidiabetic Properties of the Polysaccharides from Pseudostellaria heterophylla" Molecules 27, no. 12: 3719. https://doi.org/10.3390/molecules27123719
APA StyleLiu, Y., Kan, Y., Huang, Y., Jiang, C., Zhao, L., Hu, J., & Pang, W. (2022). Physicochemical Characteristics and Antidiabetic Properties of the Polysaccharides from Pseudostellaria heterophylla. Molecules, 27(12), 3719. https://doi.org/10.3390/molecules27123719