Enhanced Resolution Analysis for Water Molecules in MCM-41 and SBA-15 in Low-Field T2 Relaxometric Spectra
Abstract
1. Introduction
1.1. Importance of a Low Field, Bulk and Surface Signal from within a Pore
1.2. Our Mesoporous System and Experimental
2. Results and Discussion
2.1. Results for MCM-41
2.2. Results for SBA-15
2.3. Discussion
3. Conclusions
Author Contributions
Funding
Institutional Review Board Statement
Informed Consent Statement
Data Availability Statement
Acknowledgments
Conflicts of Interest
Appendix A
| % | T2I [ms] | T2II [ms] | T2III [ms] | T2IV [ms] |
|---|---|---|---|---|
| 96.0 | - | 16.6275 | 95.6983 | 1931.4715 |
| 77.0 | - | 15.9511 | 90.8495 | 940.6998 |
| 68.0 | 0.0131 | 15.6531 | 96.1959 | 1595.4480 |
| 53.0 | 0.0212 | 37.7980 | 643.4950 | |
| 37.0 | 0.0215 | 16.9998 | 262.8572 | |
| 24.0 | 0.0230 | 3.0997 | 305.1463 | |
| 14.0 | 0.0289 | 5.7398 | - | - |
| 12.0 | 0.0259 | 5.0470 | - | - |
| 11.0 | 0.0345 | 4.0882 | - | - |
| 8.9 | 0.0427 | 3.6844 | - | - |
| 7.0 | 0.0515 | 3.2950 | - | - |
| 4.5 | 0.0809 | 2.6328 | - | - |
| 2.3 | 0.0840 | 1.5408 | - | - |
| 0.7 | 0.1091 | 0.9608 | - | - |
| % | T2I [ms] | T2II+III [ms] | T2IV [ms] |
|---|---|---|---|
| 95.3 | - | 77.3073 | 1672.1316 |
| 61.9 | - | 63.1377 | 1215.8725 |
| 34.6 | 0.0133 | 33.2756 | 1008.1585 |
| 28.3 | 0.0121 | 26.6767 | 1240.6753 |
| 16.9 | 0.0231 | 15.8747 | 2322.2875 |
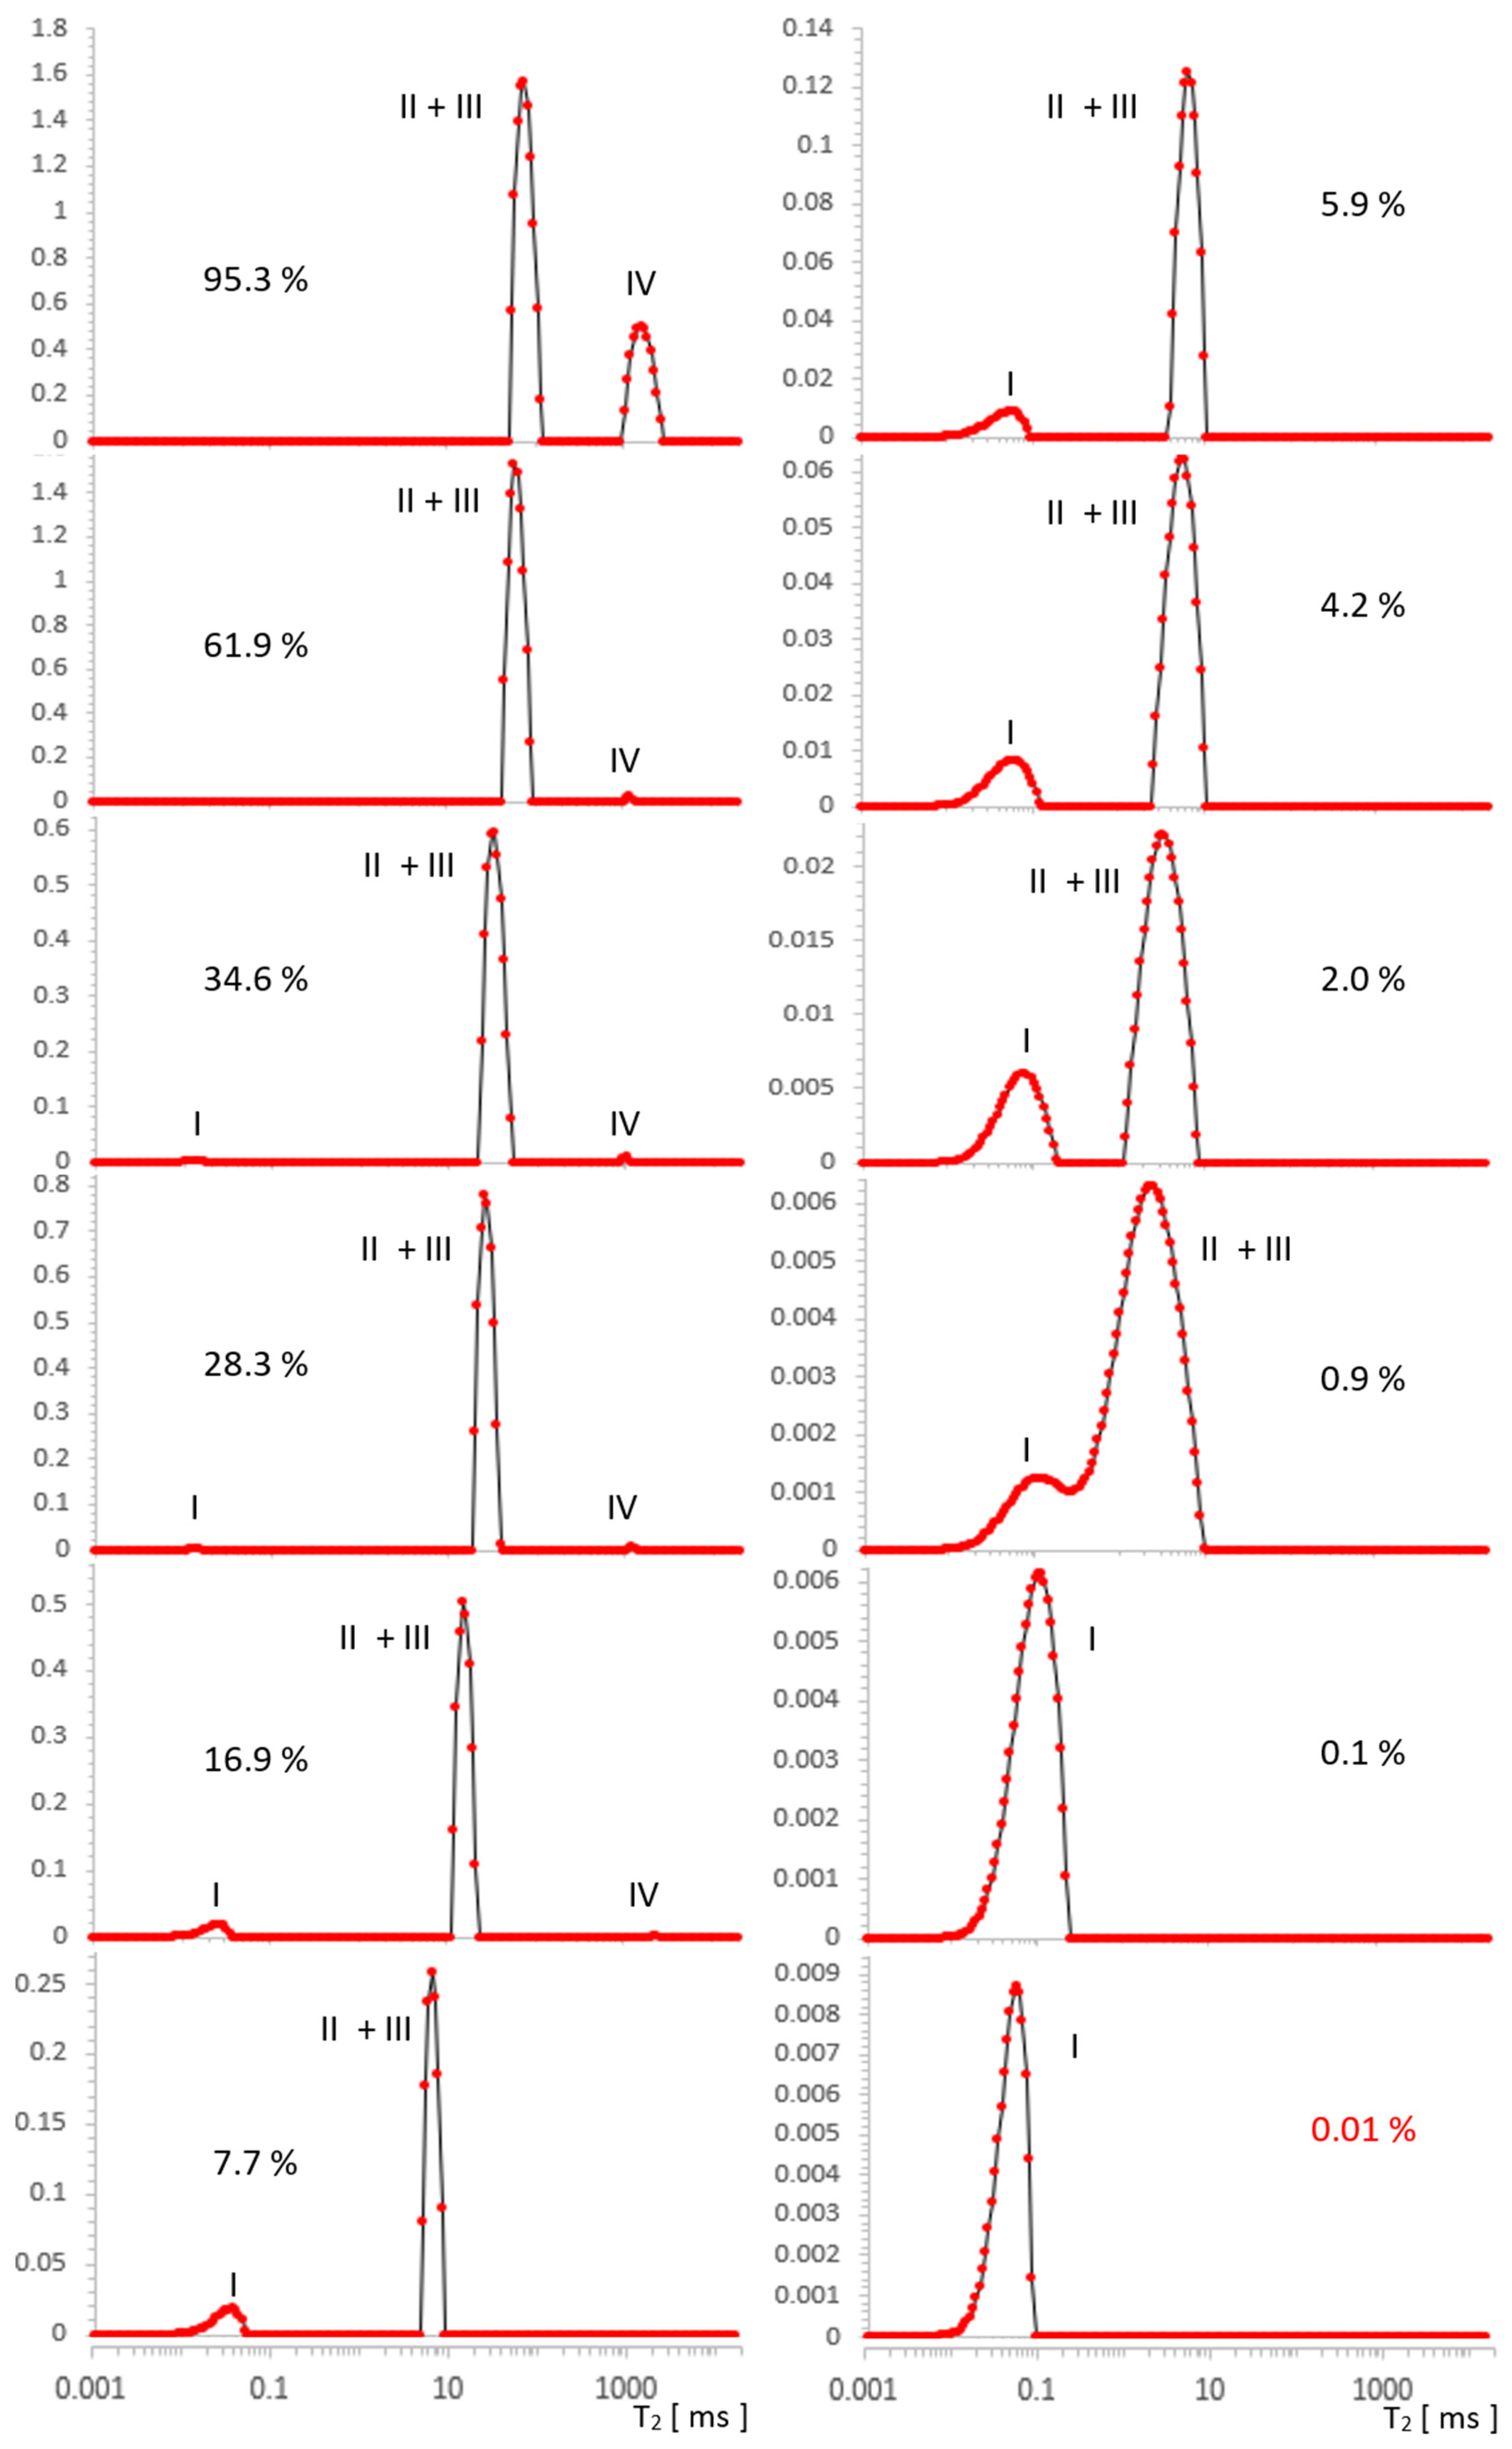
| 7.7 | 0.0320 | 7.2114 | - |
| 5.9 | 0.0482 | 6.6127 | - |
| 4.2 | 0.0554 | 5.5516 | - |
| 2.0 | 0.0755 | 3.6012 | - |
| 0.9 | 0.1154 | 2.5859 | - |
| 0.1 | 0.0984 | - | |
| ~0.0 | 0.0500 | - | |
References
- Grünberg, B.; Emmler, T.; Gedat, E.; Shenderovich, I.; Findenegg, G.H.; Limbach, H.H.; Buntkowsky, G. Hydrogen bonding of water confined in mesoporous silica MCM-41 and SBA-15 studied by 1H solid-state NMR. Chem. Eur. J. 2004, 10, 5689–5696. [Google Scholar] [CrossRef]
- Krzyżak, A.T.; Habina, I. Low field 1H NMR characterization of mesoporous silica MCM-41 and SBA-15 filled with different amount of water. Microporous Mesoporous Mater. 2016, 231, 230–239. [Google Scholar] [CrossRef]
- Stingaciu, L.R.; Weihermuller, L.; Haber-Pohlmeier, S.; Stapf, S.; Vereecken, H.; Pohlmeier, A. Determination of pore size distribution and hydraulic properties using nuclear magnetic resonance relaxometry: A comparative study of laboratory methods. Water Resour. Res. 2010, 46, W11510. [Google Scholar] [CrossRef]
- Schmidt, R.; Stocker, M.; Hansen, E.; Akporiaye, D.; Ellestad, O.H. MCM-41: A model system for adsorption studies on mesoporous materials. Microporous Mater. 1995, 3, 443–448. [Google Scholar] [CrossRef]
- Fordham, E.J.; Venkataramanan, L.; Mitchell, J.; Valori, A. What are, and what are not, Inverse Laplace Transforms. Diffus. Fundam. 2017, 29, 1–8. [Google Scholar]
- Kleinberg, R.L.; Horsfield, M.A. Transverse relaxation processes in porous sedimentary rock. J. Magn. Reson. 1990, 88, 9–19. [Google Scholar] [CrossRef]
- Mohnke, O.; Yaramanci, U. Pore size distributions and hydraulic conductivities of rocks derived from Magnetic Resonance Sounding relaxation data using multi-exponential decay time inversion. J. Appl. Geophys. 2008, 66, 73–81. [Google Scholar] [CrossRef]
- Meiboom, S.; Gill, D. Modified spin-echo method for measuring nuclear relaxation times. Rev. Sci. Instrum. 1958, 29, 688–691. [Google Scholar] [CrossRef]
- Straley, C.; Rosini, D.; Vinegar, H.; Tutunjijan, P.; Morris, C. Core analisis by low-field NMR. Log Anal. 1997, 38, 84–93. [Google Scholar]
- Brownstein, K.R.; Tarr, C.E. Importance of classical diffusion in NMR studies of water in biological cells. Phys. Rev. A 1979, 19, 2446–2453. [Google Scholar] [CrossRef]
- Buntkowsky, G.; Breitzke, H.; Adamczyk, A.; Roelofs, F.; Emmler, T.; Gedat, E.; Grunberg, B.; Xu, Y.; Limbach, H.-H.; Shenderovich, I.; et al. Structural and dynamical properties of guest molecules confined in mesoporous silica materials revealed by NMR. Phys. Chem. Chem. Phys. 2007, 9, 4843–4853. [Google Scholar] [CrossRef]
- Pérez, L.L.; van Eck, E.R.H.; Melián-Cabrera, I. On the hydrothermal stability of MCM-41. Evidence of capillary tension-induced effects. Microporous Mesoporous Mater. 2016, 220, 88–98. [Google Scholar] [CrossRef]
- Miller, K. Least squares methods for ill-posed problems with a prescribed bound. SIAM J. Math. Anal. 1970, 1, 52–74. [Google Scholar] [CrossRef]
- Tikhonov, A.N.; Glasko, V.B. Use of the regularization method in non-linear problems. USSR Comput. Math. Math. Phys. 1965, 5, 93–107. [Google Scholar] [CrossRef]
- Myre, J.M.; Frahm, E.; Lilja, D.J.; Saar, M.O. TNT-NN: A Fast Active Set Method for Solving Large Non-Negative Least Square Problems. Procedia Comput. Sci. 2017, 108C, 755–764. [Google Scholar] [CrossRef]
- Lawson, C.L.; Hanson, R.J. Solving Least Squares Problems. In Englewood Cliffs; Prentice-Hall: Hoboken, NJ, USA, 1974. [Google Scholar]
- Hansen, P.C.; O’Leary, D.P. The use of the L-curve in the regularization of discrete ill-posed problems. SIAM J. Sci. Comput. 1993, 14, 1487–1503. [Google Scholar] [CrossRef]
- Magritek. NMR Rock Core Analyzer: RCA Toolbox version 4.25. In Magritek Software User Manual; Magritek: Wellington, New Zealand, 2016. [Google Scholar]
- Golub, G.H.; Heath, M.T.; Wahba, G. Generalized cross-validation as a method for choosing a good ridge parameter. Technometrics 1979, 21, 215–223. [Google Scholar] [CrossRef]
- Wahba, G. Practical approximate solutions to linear operator equations when the data are noisy. SIAM J. Numer. Anal. 1977, 14, 651–667. [Google Scholar] [CrossRef]
- Kaufman, L.; Neumaier, A. PET regularization by envelope guided gradients. IEEE Trans. Med Imaging 1996, 15, 385–389. [Google Scholar] [CrossRef][Green Version]
- Luan, F.; Lee, C.; Choi, J.H.; Jung, H.-K. A Comparison of Regularization Techniques for Magnetoencephalography Source Reconstruction. IEEE Trans. Magn. 2010, 46, 3209–3212. [Google Scholar] [CrossRef]
- Chen, L.Y.; Chen, J.T.; Hong, H.-K.; Chen, C.H. Application of Cesàro mean and the L-curve for the deconvolution problem. Soil Dyn. Earthq. Eng. 1995, 14, 361–373. [Google Scholar] [CrossRef]
- Krzyżak, A.; Mazur, W.; Matyszkiewicz, J.; Kochman, A. Identification of Proton Populations in Cherts as Natural Analogues of Pure Silica Materials by Means of Low Field NMR. J. Phys. Chem. C 2020, 124, 5225–5240. [Google Scholar] [CrossRef] [PubMed]
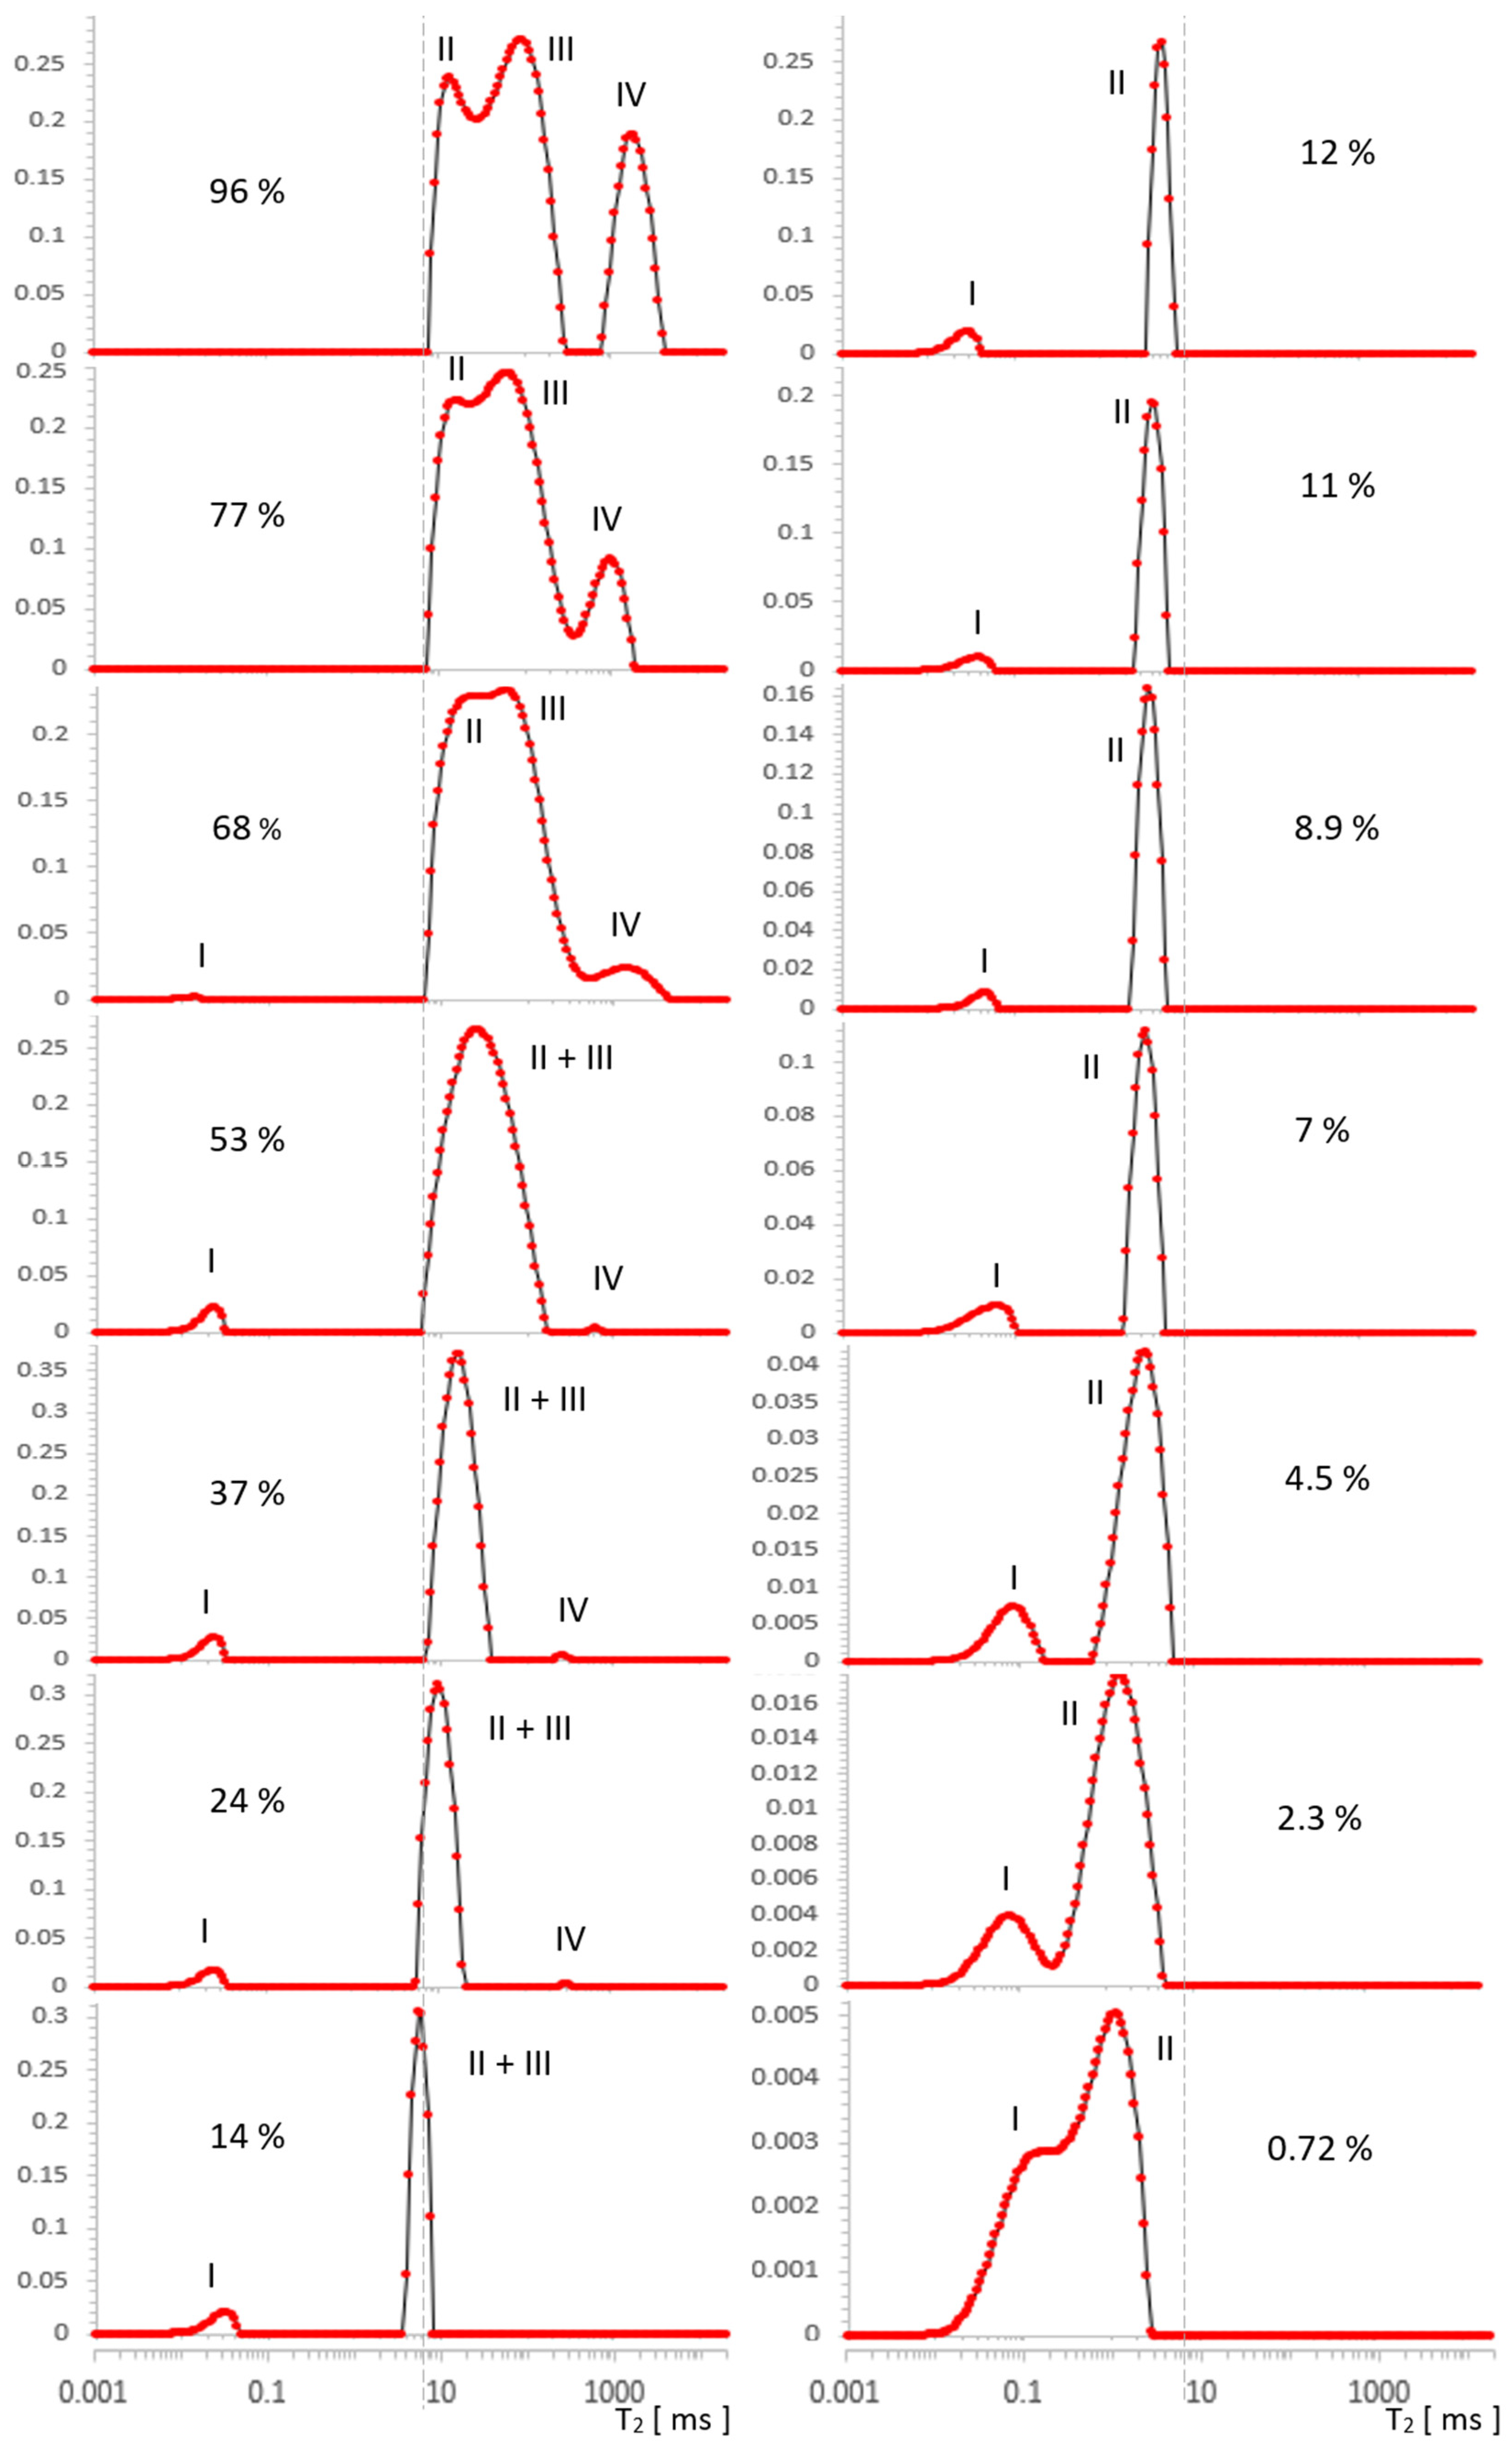
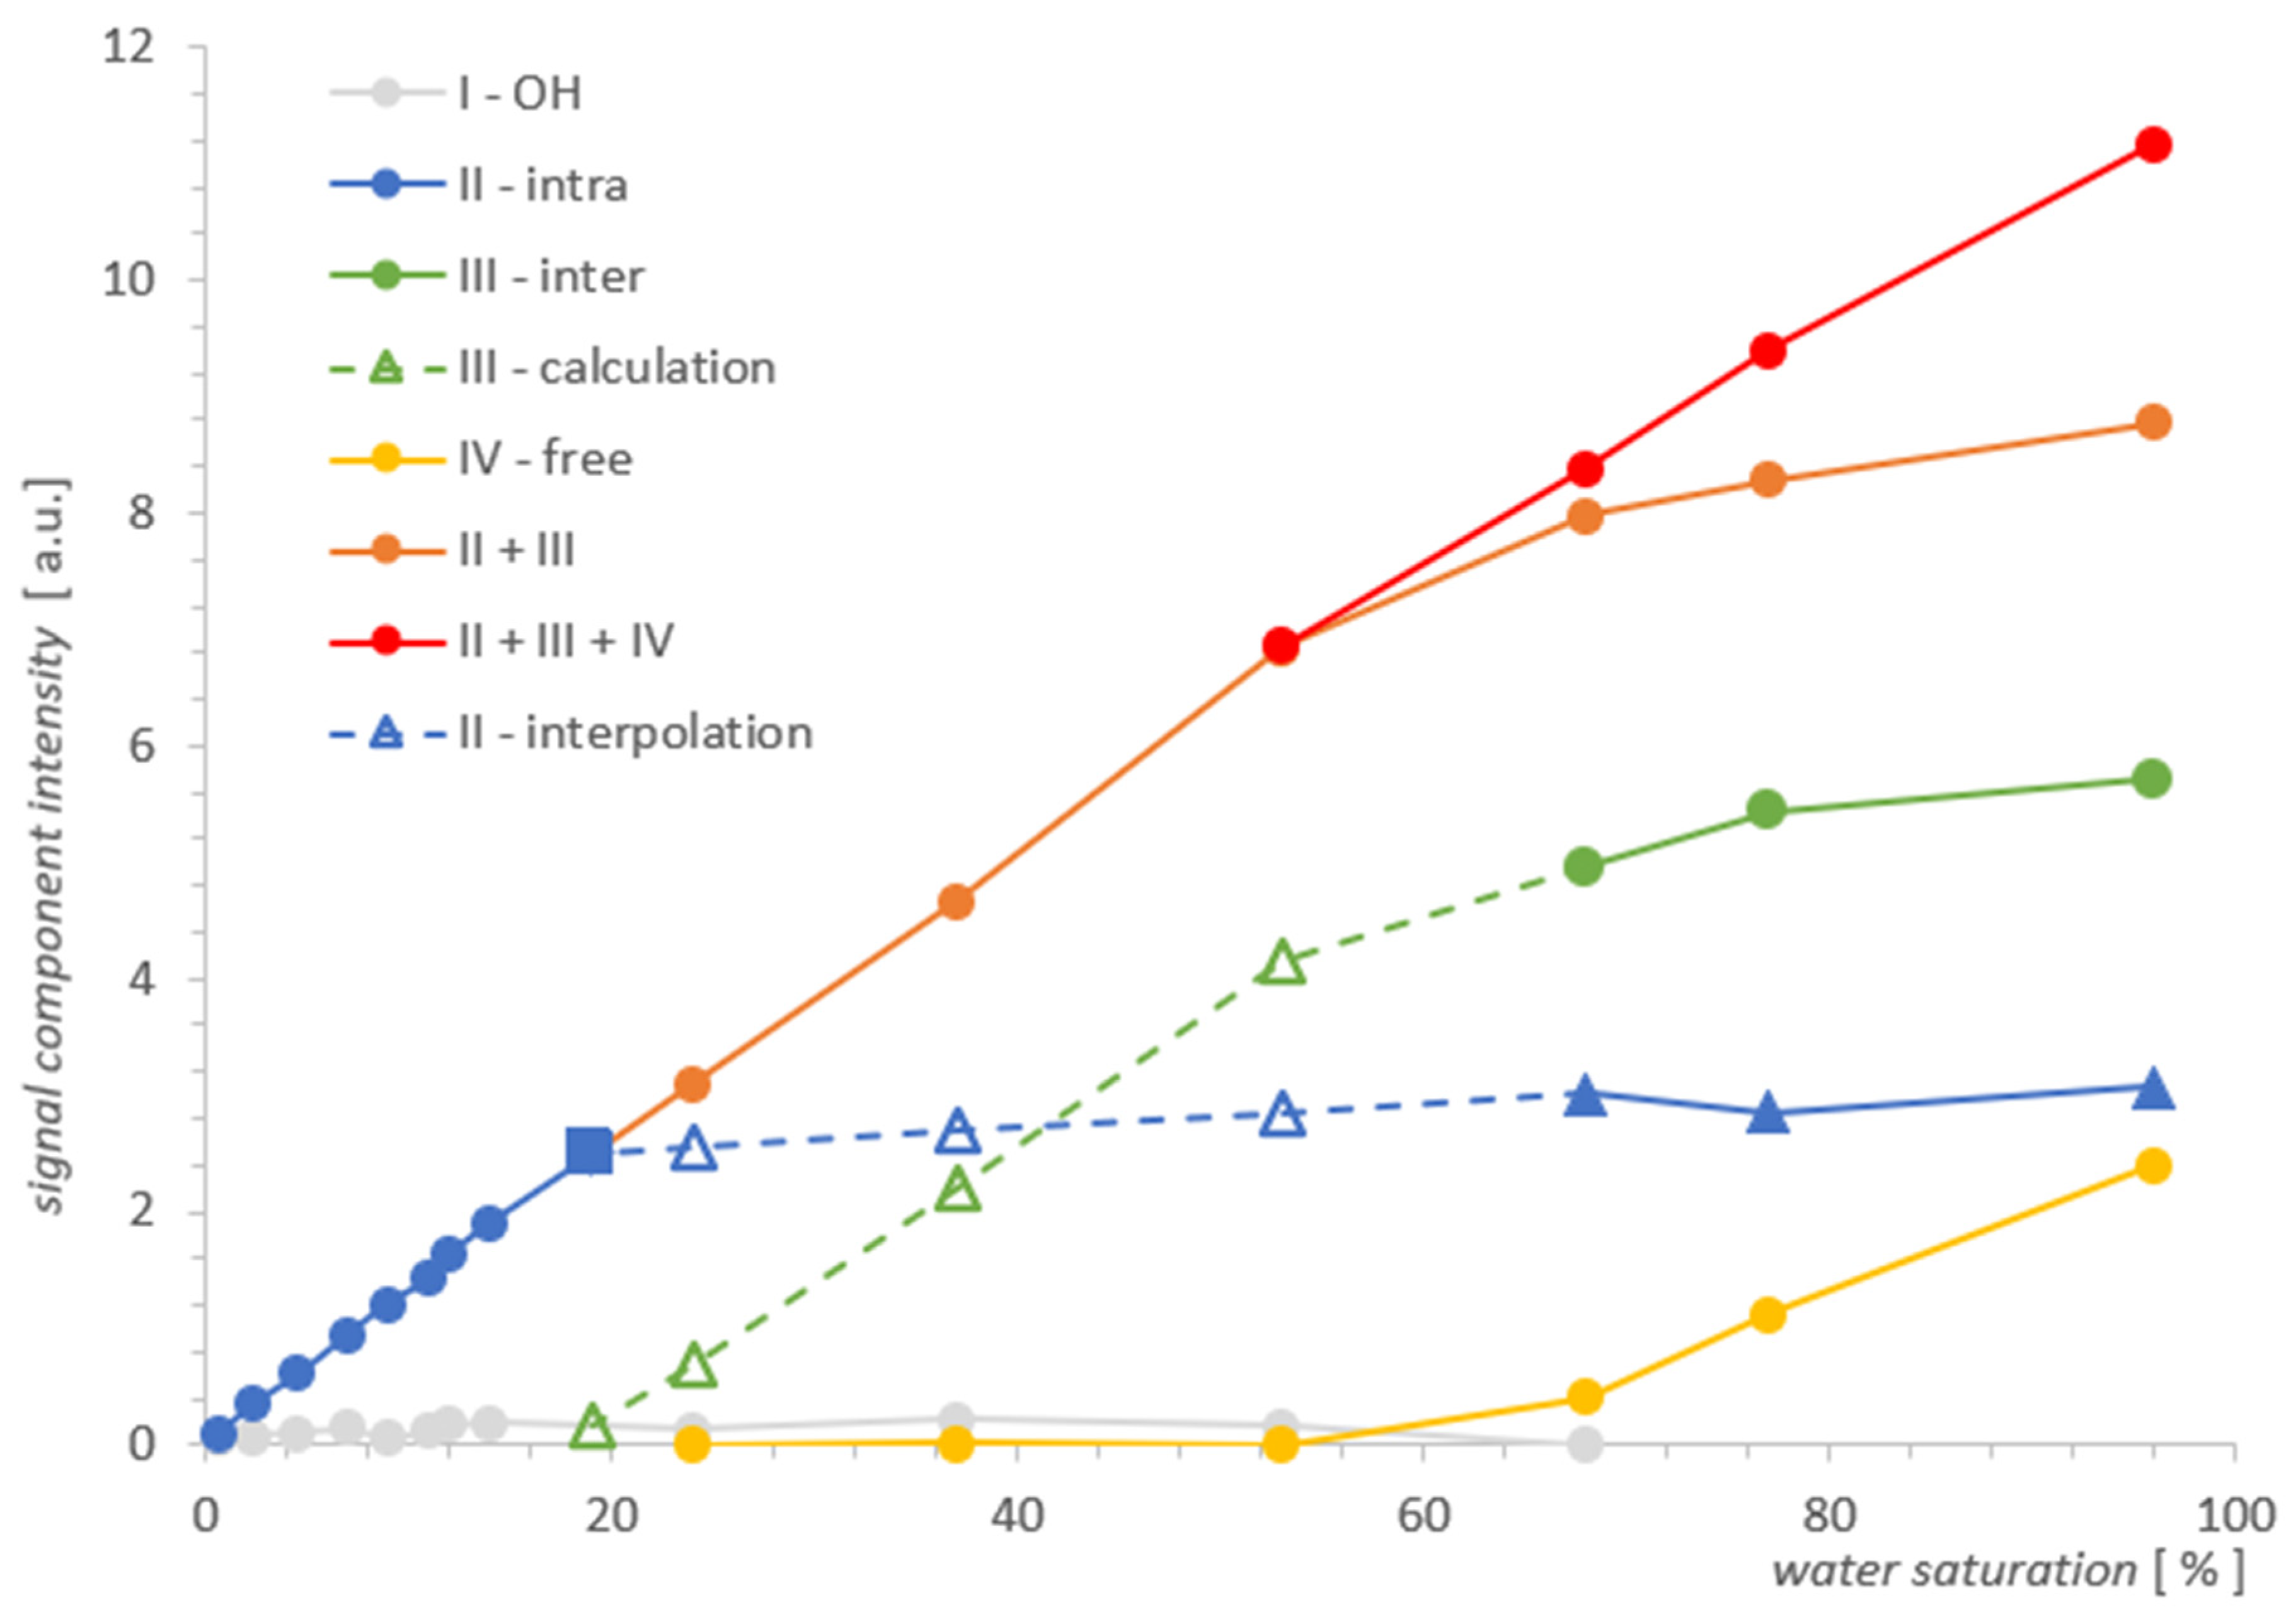
| % | I [a.u.] | II [a.u.] | III [a.u.] | IV [a.u.] |
|---|---|---|---|---|
| 96.0 | 0 | 3.0638 | 5.7096 | 2.3942 |
| 77.0 | 0 | 2.8497 | 5.4366 | 1.1180 |
| 68.0 | 0.0085 | 3.0152 | 4.9602 | 0.4101 |
| 53.0 | 0.1658 | 6.8461 | 0.0108 | |
| 37.0 | 0.2163 | 4.6720 | 0.0161 | |
| 24.0 | 0.1417 | 3.0997 | 0.0062 | |
| 14.0 | 0.1891 | 1.9050 | - | - |
| 12.0 | 0.1749 | 1.6437 | - | - |
| 11.0 | 0.1134 | 1.4223 | - | - |
| 8.9 | 0.0666 | 1.2053 | - | - |
| 7.0 | 0.1423 | 0.9463 | - | - |
| 4.5 | 0.1101 | 0.6165 | - | - |
| 2.3 | 0.0746 | 0.3472 | - | - |
| 0.7 | 0.0562 | 0.1077 | - | - |
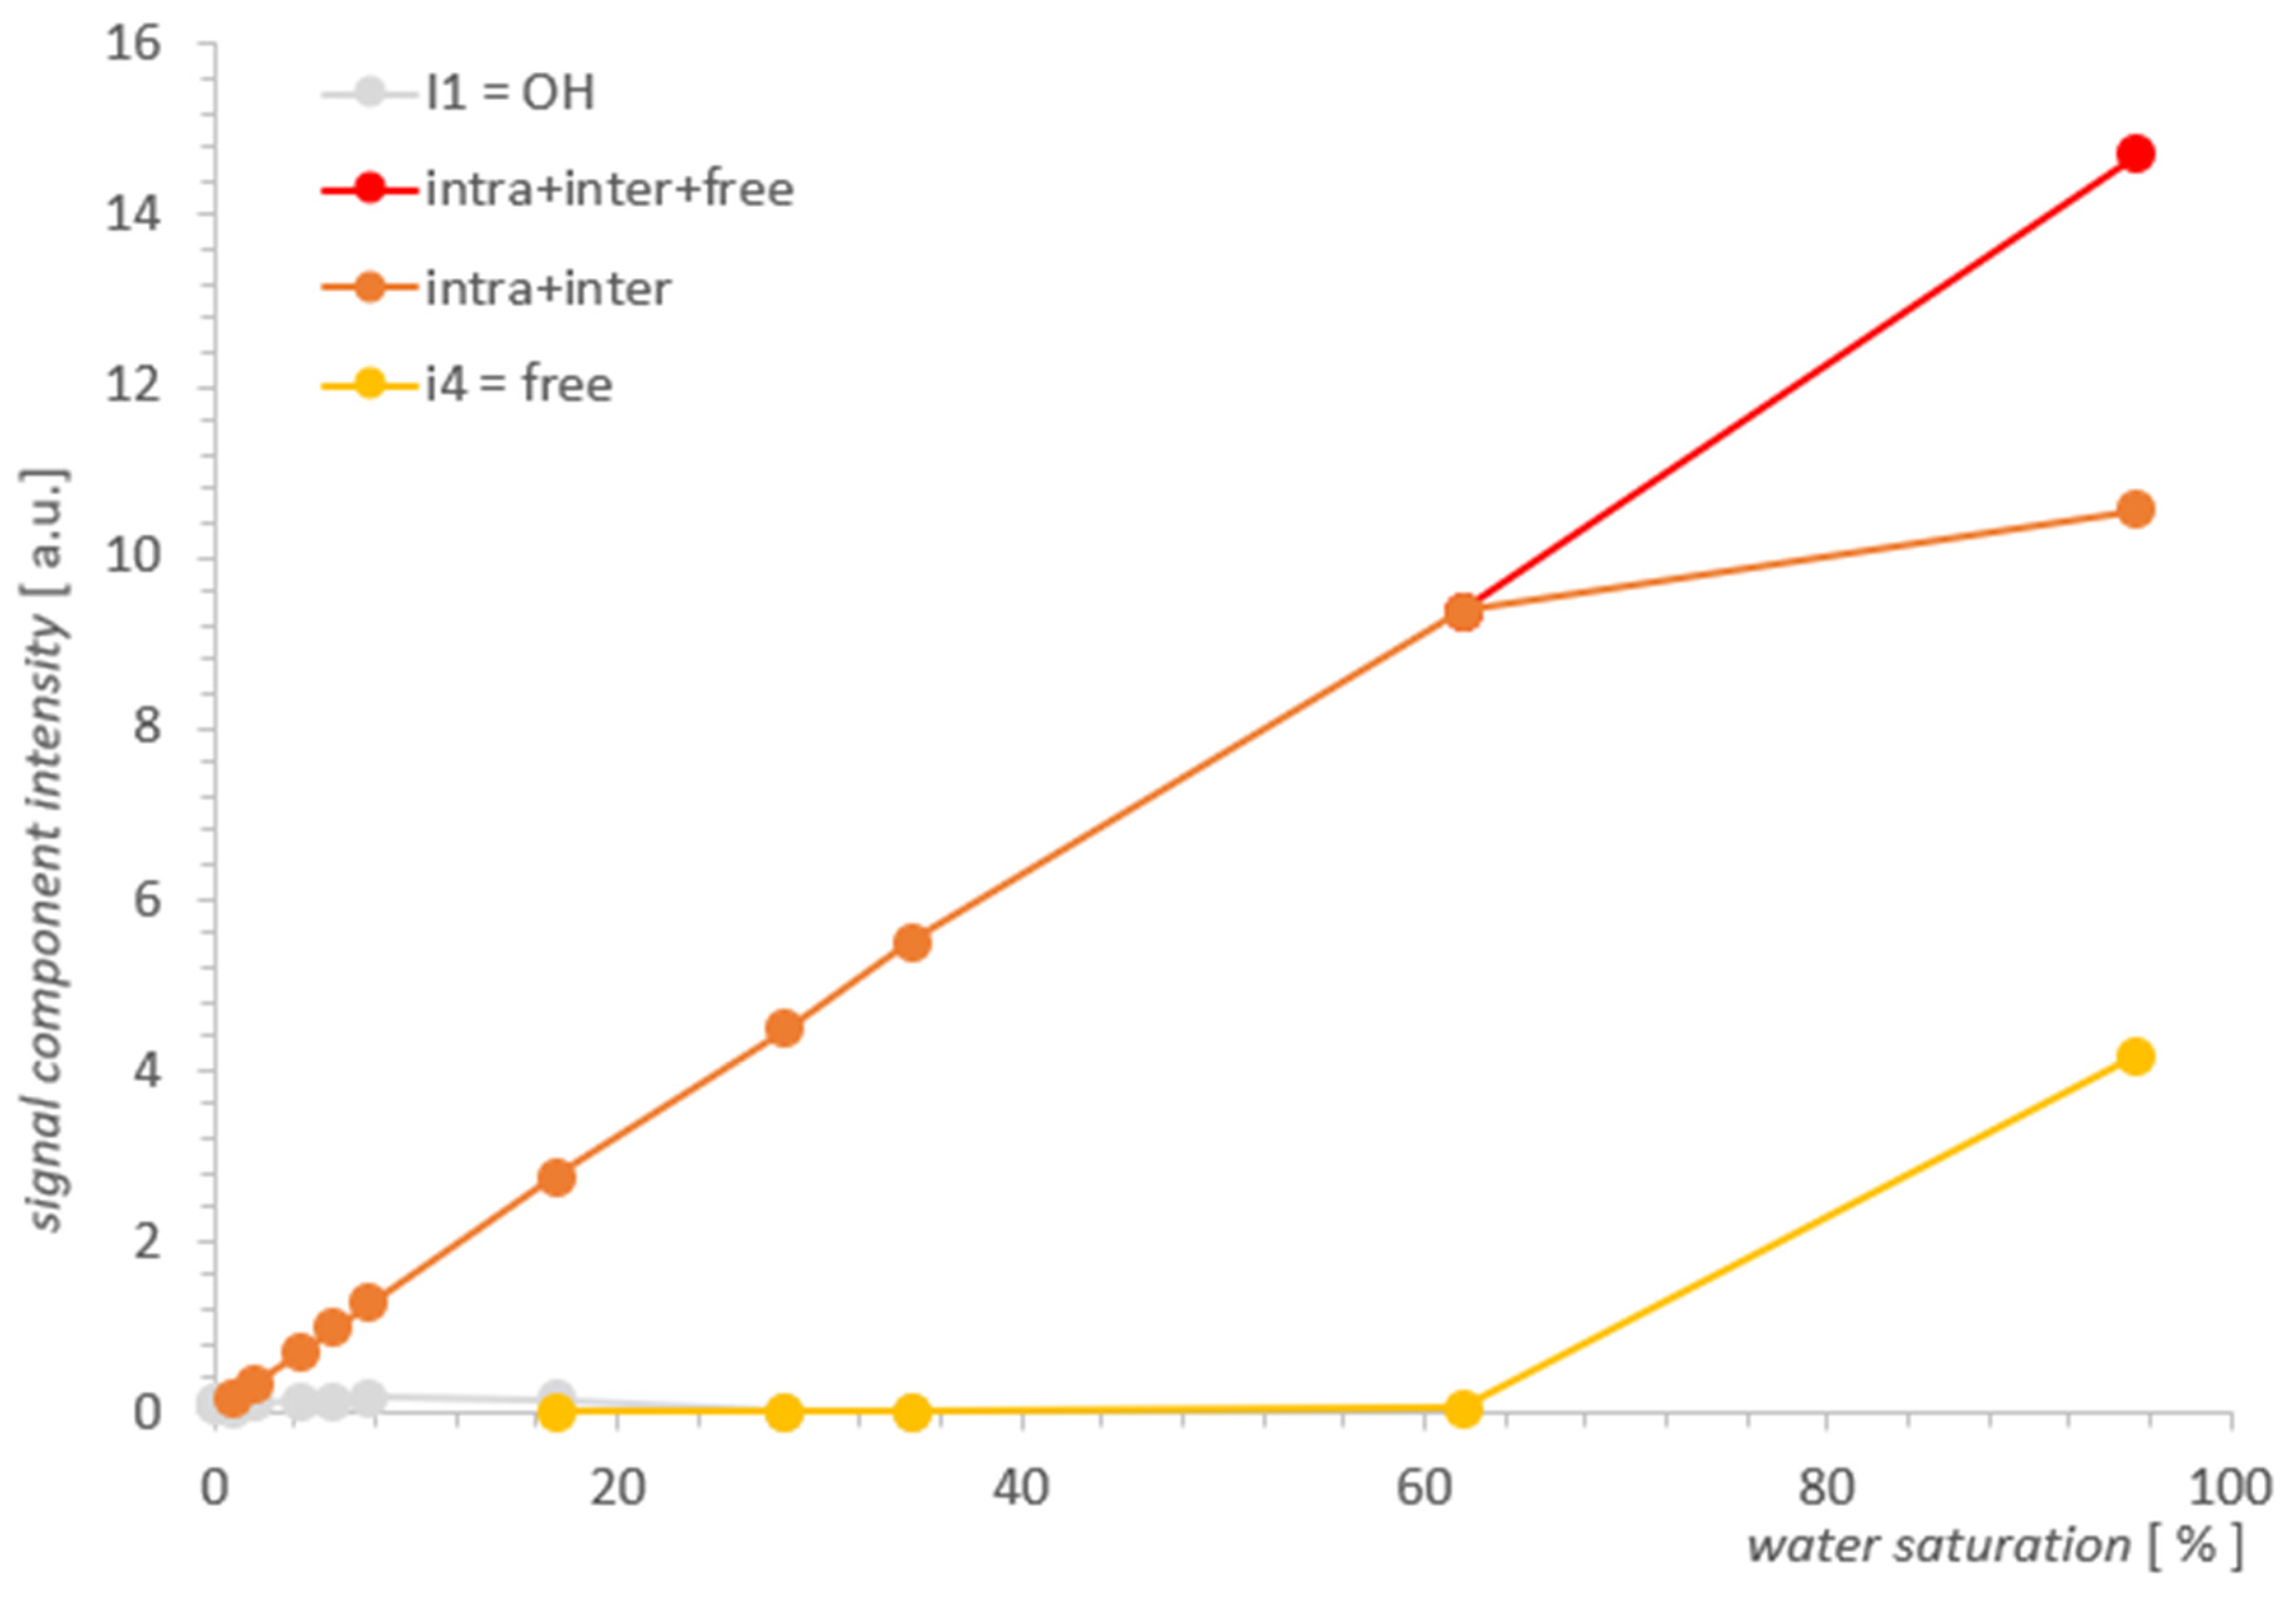
| % | I [a.u.] | II + III [a.u.] | IV [a.u.] |
|---|---|---|---|
| 95.3 | - | 10.5503 | 4.1646 |
| 61.9 | - | 9.3590 | 0.0429 |
| 34.6 | 0.0057 | 4.0409 | 0.0163 |
| 28.3 | 0.0028 | 4.4826 | 0.0124 |
| 16.9 | 0.1509 | 2.7507 | 0.0027 |
| 7.7 | 0.1768 | 1.2683 | - |
| 5.9 | 0.1116 | 0.9836 | - |
| 4.2 | 0.1268 | 0.7019 | - |
| 2.0 | 0.1003 | 0.3405 | - |
| 0.9 | 0.0270 | 0.1540 | - |
| 0.1 | 0.1012 | - | |
| ~0.0 | 0.0967 | - | |
Publisher’s Note: MDPI stays neutral with regard to jurisdictional claims in published maps and institutional affiliations. |
© 2021 by the authors. Licensee MDPI, Basel, Switzerland. This article is an open access article distributed under the terms and conditions of the Creative Commons Attribution (CC BY) license (https://creativecommons.org/licenses/by/4.0/).
Share and Cite
Stoch, G.; Krzyżak, A.T. Enhanced Resolution Analysis for Water Molecules in MCM-41 and SBA-15 in Low-Field T2 Relaxometric Spectra. Molecules 2021, 26, 2133. https://doi.org/10.3390/molecules26082133
Stoch G, Krzyżak AT. Enhanced Resolution Analysis for Water Molecules in MCM-41 and SBA-15 in Low-Field T2 Relaxometric Spectra. Molecules. 2021; 26(8):2133. https://doi.org/10.3390/molecules26082133
Chicago/Turabian StyleStoch, Grzegorz, and Artur T. Krzyżak. 2021. "Enhanced Resolution Analysis for Water Molecules in MCM-41 and SBA-15 in Low-Field T2 Relaxometric Spectra" Molecules 26, no. 8: 2133. https://doi.org/10.3390/molecules26082133
APA StyleStoch, G., & Krzyżak, A. T. (2021). Enhanced Resolution Analysis for Water Molecules in MCM-41 and SBA-15 in Low-Field T2 Relaxometric Spectra. Molecules, 26(8), 2133. https://doi.org/10.3390/molecules26082133


