Article

Effect of Alkaline Salts on Calcium Sulfoaluminate Cement Hydration

by
Luís Urbano D. Tambara Júnior
1,2,*,
Janaíde C. Rocha
1,
Malik Cheriaf
1,
Pilar Padilla-Encinas
2,
Ana Fernández-Jiménez
2 and
Angel Palomo
2,*
1
Laboratory of Waste Valorization and Sustainable Materials (ValoRes), Department of Civil Engineering, Federal University of Santa Catarina (UFSC), Florianópolis 88040900, Brazil
2
Eduardo Torroja Institute, National Research Council (CSIC), 28033 Madrid, Spain
*
Authors to whom correspondence should be addressed.
Molecules 2021, 26(7), 1938; https://doi.org/10.3390/molecules26071938
Submission received: 1 March 2021 / Revised: 24 March 2021 / Accepted: 26 March 2021 / Published: 30 March 2021
(This article belongs to the Special Issue Advances in Alkali-Activated Materials)

Abstract

:
This work analyzes the effect of the presence of 5 wt.% of solid sodium salts (Na2SO4, Na2CO3, and Na2SiO3) on calcium sulfoaluminate cement (CSA) hydration, addresses hydration kinetics; 2-, 28-, and 90-d mechanical strength, and reaction product microstructure (with X-ray diffraction (XRD), and Fourier transform infrared spectroscopy, (FTIR). The findings show that the anions affect primarily the reactions involved. Ettringite and AH3, are the majority hydration products, while monosulfates are absent in all of the samples. All three salts hasten CSA hydration and raise the amount of ettringite formed. Na2SO4 induces cracking in the ≥28-d pastes due to post-hardening gypsum and ettringite formation from the excess SO42– present. Anhydrite dissolves more rapidly in the presence of Na2CO3, prompting carbonation. Na2SiO3 raises compressive strength and exhibits strätlingite as one of its reaction products.

1. Introduction

Due primarily to the immensity of worldwide output, Portland cement (PC) manufacture is deemed a major source of greenhouse gases, in particular CO2, prompting the scientific community and the industry to develop and use alternative cements. Calcium sulfoaluminate (CSA) cement is more eco-friendly than PC, inasmuch as CSA clinker contains less calcium, requires calcination temperatures around 200 °C lower and is more readily ground, factors that together translate into lower energy consumption and CO2 emissions [1].
CSA first began to be industrially developed in China in the nineteen seventies. Its foremost mineral phases include ye’elimite (C4A3$) and belite (C2S), with smaller contents of ferrite (C4AF), calcium aluminate (CA), and calcium sulfate (C$). That third mineral is also added during grinding in the form of gypsum or anhydrite [2,3,4]. CSA exhibits high early-age mechanical strength, although the hydration products formed, which differ from the ettringite and AH3 (Equation (1)) [5,6,7] found in PC, might cause durability problems at later ages.
Manufacture has spread to other countries in recent years, where CSA is often used as a component of blended cements for applications requiring high early-age strength [8].
C4A3$ + 2 C$Hx + (38 − 2x) H → C6A$3H32 + 2 AH3 x = 0, 0.5, 2 (ettringite formation)
According to some studies, when blended with PC, calcium sulfoaluminate cement may raise early-age mechanical strength, reduce shrinkage, control setting time, and improve frost resistance [9,10,11,12]. In CSA + PC blends, the calcium hydroxide released during PC hydration combines with C4A3$ and calcium sulfate to generate microcrystalline ettringite, which largely offsets shrinkage. The pore size distribution in CSA + PC blends is skewed toward the submicron range [13,14]. Earlier setting times and earlier strength development have also been observed in CSA/PC/calcium aluminate cement (CAC) ternary systems, along with strength growth at later ages due primarily to the low porosity of these materials [15].
Another possibility, scantly explored to date, is to formulate new CSA blends with what are known as alkaline cements (HYC) [16,17]. The latter are characterized by high proportions of additions or cement replacements (usually fly ash (FA), blast furnace slag, or calcined clay) and a low PC content (<30%). Whilst either liquid or solid alkalis may be added to catalyze the initial reaction in the replacements [18], the use of solids, such as Na2CO3, Na2SO4, or Na2SiO3, are able to react with the portlandite forming during PC hydration, generating caustic soda in situ, is much more practical [19,20,21,22].
The use of CSA blended with hybrid alkaline cements to raise early-age strength entails an understanding of how the presence of such salts may affect hydration and mechanical strength development. Prior studies [23] have shown the presence of Li2CO3 in ternary systems (CSA/CP/anhydrite) to hasten ye’elimite and C3S dissolution and with it ettringite precipitation. Excess Li2CO3 modified the Ca/Al ratio of the aqueous phase, however, as well as the hydration reactions, in which the CSA hydration initially prevalent (aluminium hydroxide, ettringite, and strätlingite precipitation) was followed by a predominance of PC hydration, with C-S-H and ettringite formation. Na2SO4, in turn, proved able to form strätlingite (a phase stable in high aluminosilicate systems but which decomposes in the presence of portlandite) in CAC/silica fume blends due to the action of sodium ions [24].
The present study aimed to determine the effect of three sodium salts (Na2SO4, Na2CO3, and Na2Si2O5·2H2O) on the hydration of a commercial CSA. More specifically, it explored how these salts impact setting, mechanical strength development over time, and the nature of the reaction products formed.

2. Results

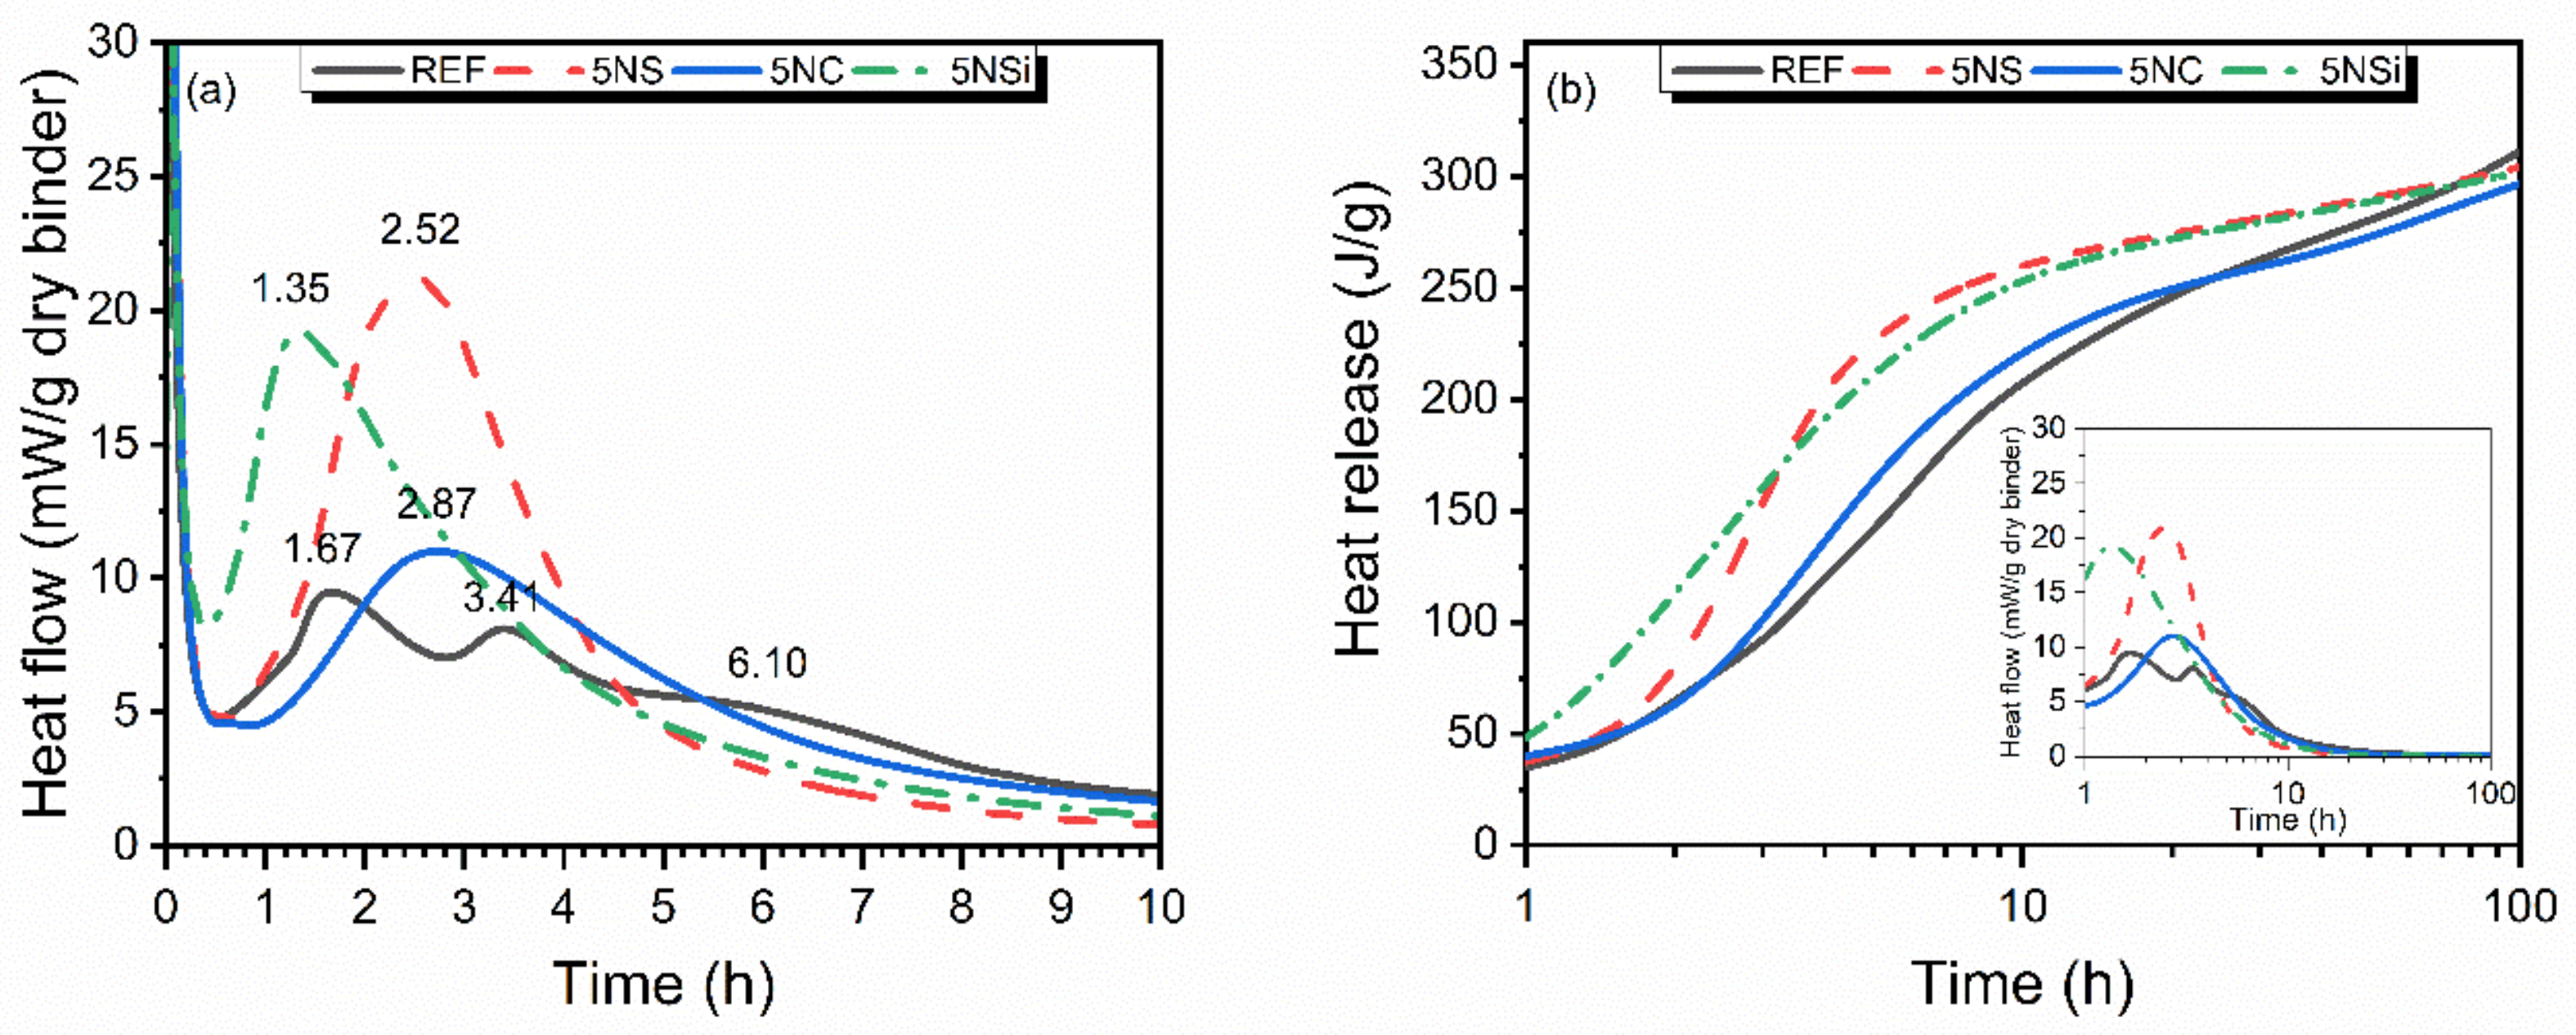
2.1. Isothermal Conduction Calorimetry

The effect of the salts on heat flow and total heat released during CSA hydration is illustrated in Figure 1a) and Table 1. The heat flow curve for reference (REF) exhibited a number of peaks, the first beginning with initial contact between the material and the water, although the instrument recorded only the downward slope of that peak. The second peak reached a maximum at 1.67 h and the third at 3.41 h, with a shoulder appearing after 5 h of hydration. The pastes containing alkaline salts exhibited a single peak on the heat flow curves, which was more intense than any observed for REF, especially when the salt was Na2SO4. The induction period was delayed slightly with Na2CO3, remained unchanged with Na2SO4 and was shortened with sodium disilicate.
Total heat release for the four systems is graphed in Figure 1b). The presence of any of the three salts raised the heat initially released, although the values tended to converge at around 300 J/g after 90 h. The higher initial value is consistent with the greater intensity of the peaks on the heat flow curve.

2.2. Mechanical Strength, Consistency, and Setting Times

The presence of salts affected CSA paste flowability. Further to the mini-slump test results, CSA paste was less fluid in the presence of Na2CO3 (68.5 mm) and Na2SiO3 (95.25 mm) than in the reference paste (103.5 mm) and more fluid with Na2SO4 (115 mm), although all four materials exhibited suitable workability.
Two-day, 28-d, and 90-d compressive strength is graphed in Figure 2a). The 2-d strength found for the water-hydrated CSA (REF), 38 to 46 MPa, grew with time, reaching 59.37 MPa in the 90-d cement. Whilst the use of 5% Na2SO4 (5NS) in place of cement raised 2-d compressive strength relative to the reference, the 28-d specimens exhibited surface cracks and a decline in strength values. The 90-d specimens were too cracked to test for compressive strength (see Supplementary Material Figure S1).
The compressive strength observed in paste 5NC (containing Na2CO3) was slightly lower than in the reference (REF) at all ages studied. Although these specimens were not cracked, they exhibited efflorescence (see Figure S1), which when analyzed with Fourier transform infrared spectroscopy, (FTIR) (see Figure S2) was found to be due to sodium sulfate and calcium carbonate formation.
The presence of sodium silicate (5NSi) translated into higher strength than the reference (REF) at all of the ages studied. Strength gain with time grew by around 20 MPa between the 28- and 90-d specimens, compared to just under 10 MPa in the reference CSA.
According to the initial and final setting times plotted in Figure 2b), REF exhibited initial setting (ti) after 1 h and final setting (tf) after 2 h 21 min. Initial setting came very early in 5NC, which broke and had to be remixed, a behaviour associated with false setting. Otherwise, as Figure 2b) shows, this paste had setting times very similar to those observed for REF (ti = 1 h 6 min; tf = 2 h 30 min). Paste 5NS also exhibited times (ti = 56 min; tf = 2 h 10 min) resembling the REF values, whilst initial and final setting times were shorter in paste 5NSi, at 38 min and 1 h 30 min, respectively. Vicat apparatus-determined initial setting was fairly consistent with the beginning of the heat flow curve peaks (Figure 1), according to which acceleration had a shorter duration in 5NSi. Final setting time was very close to the maximum variation in heat flow in all but REF, in which final setting time appeared at mid-downslope of the second peak.

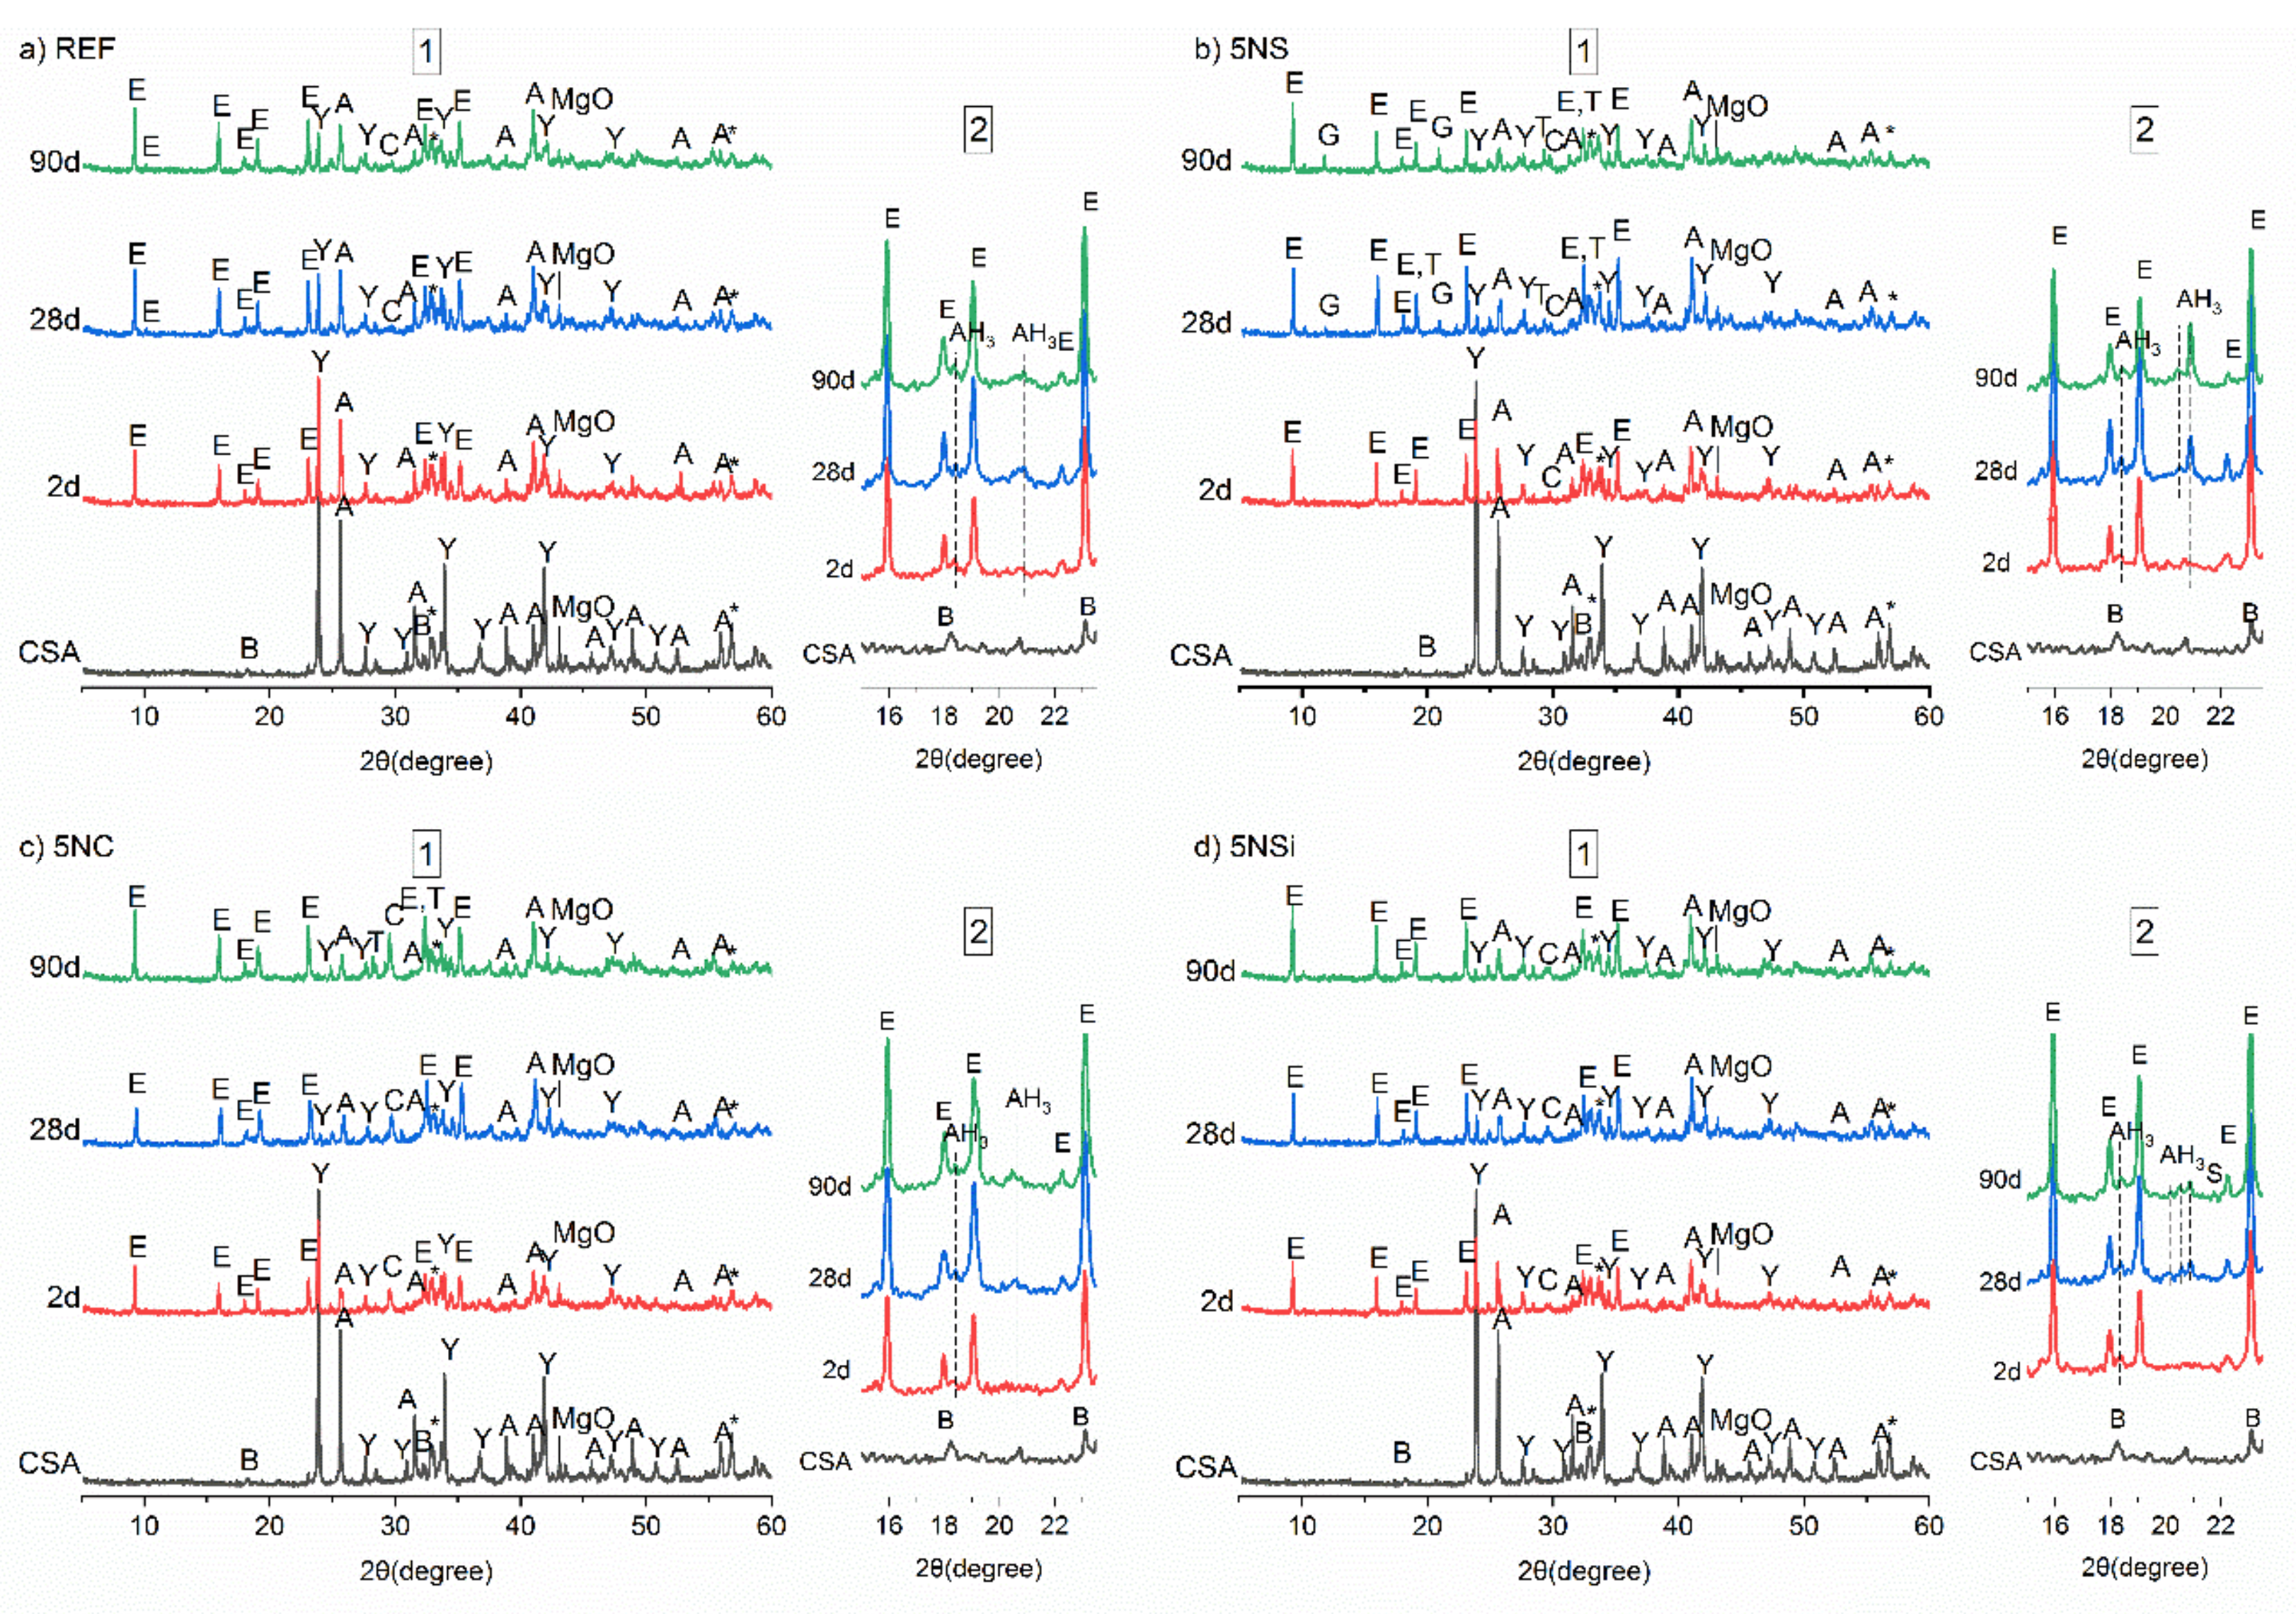
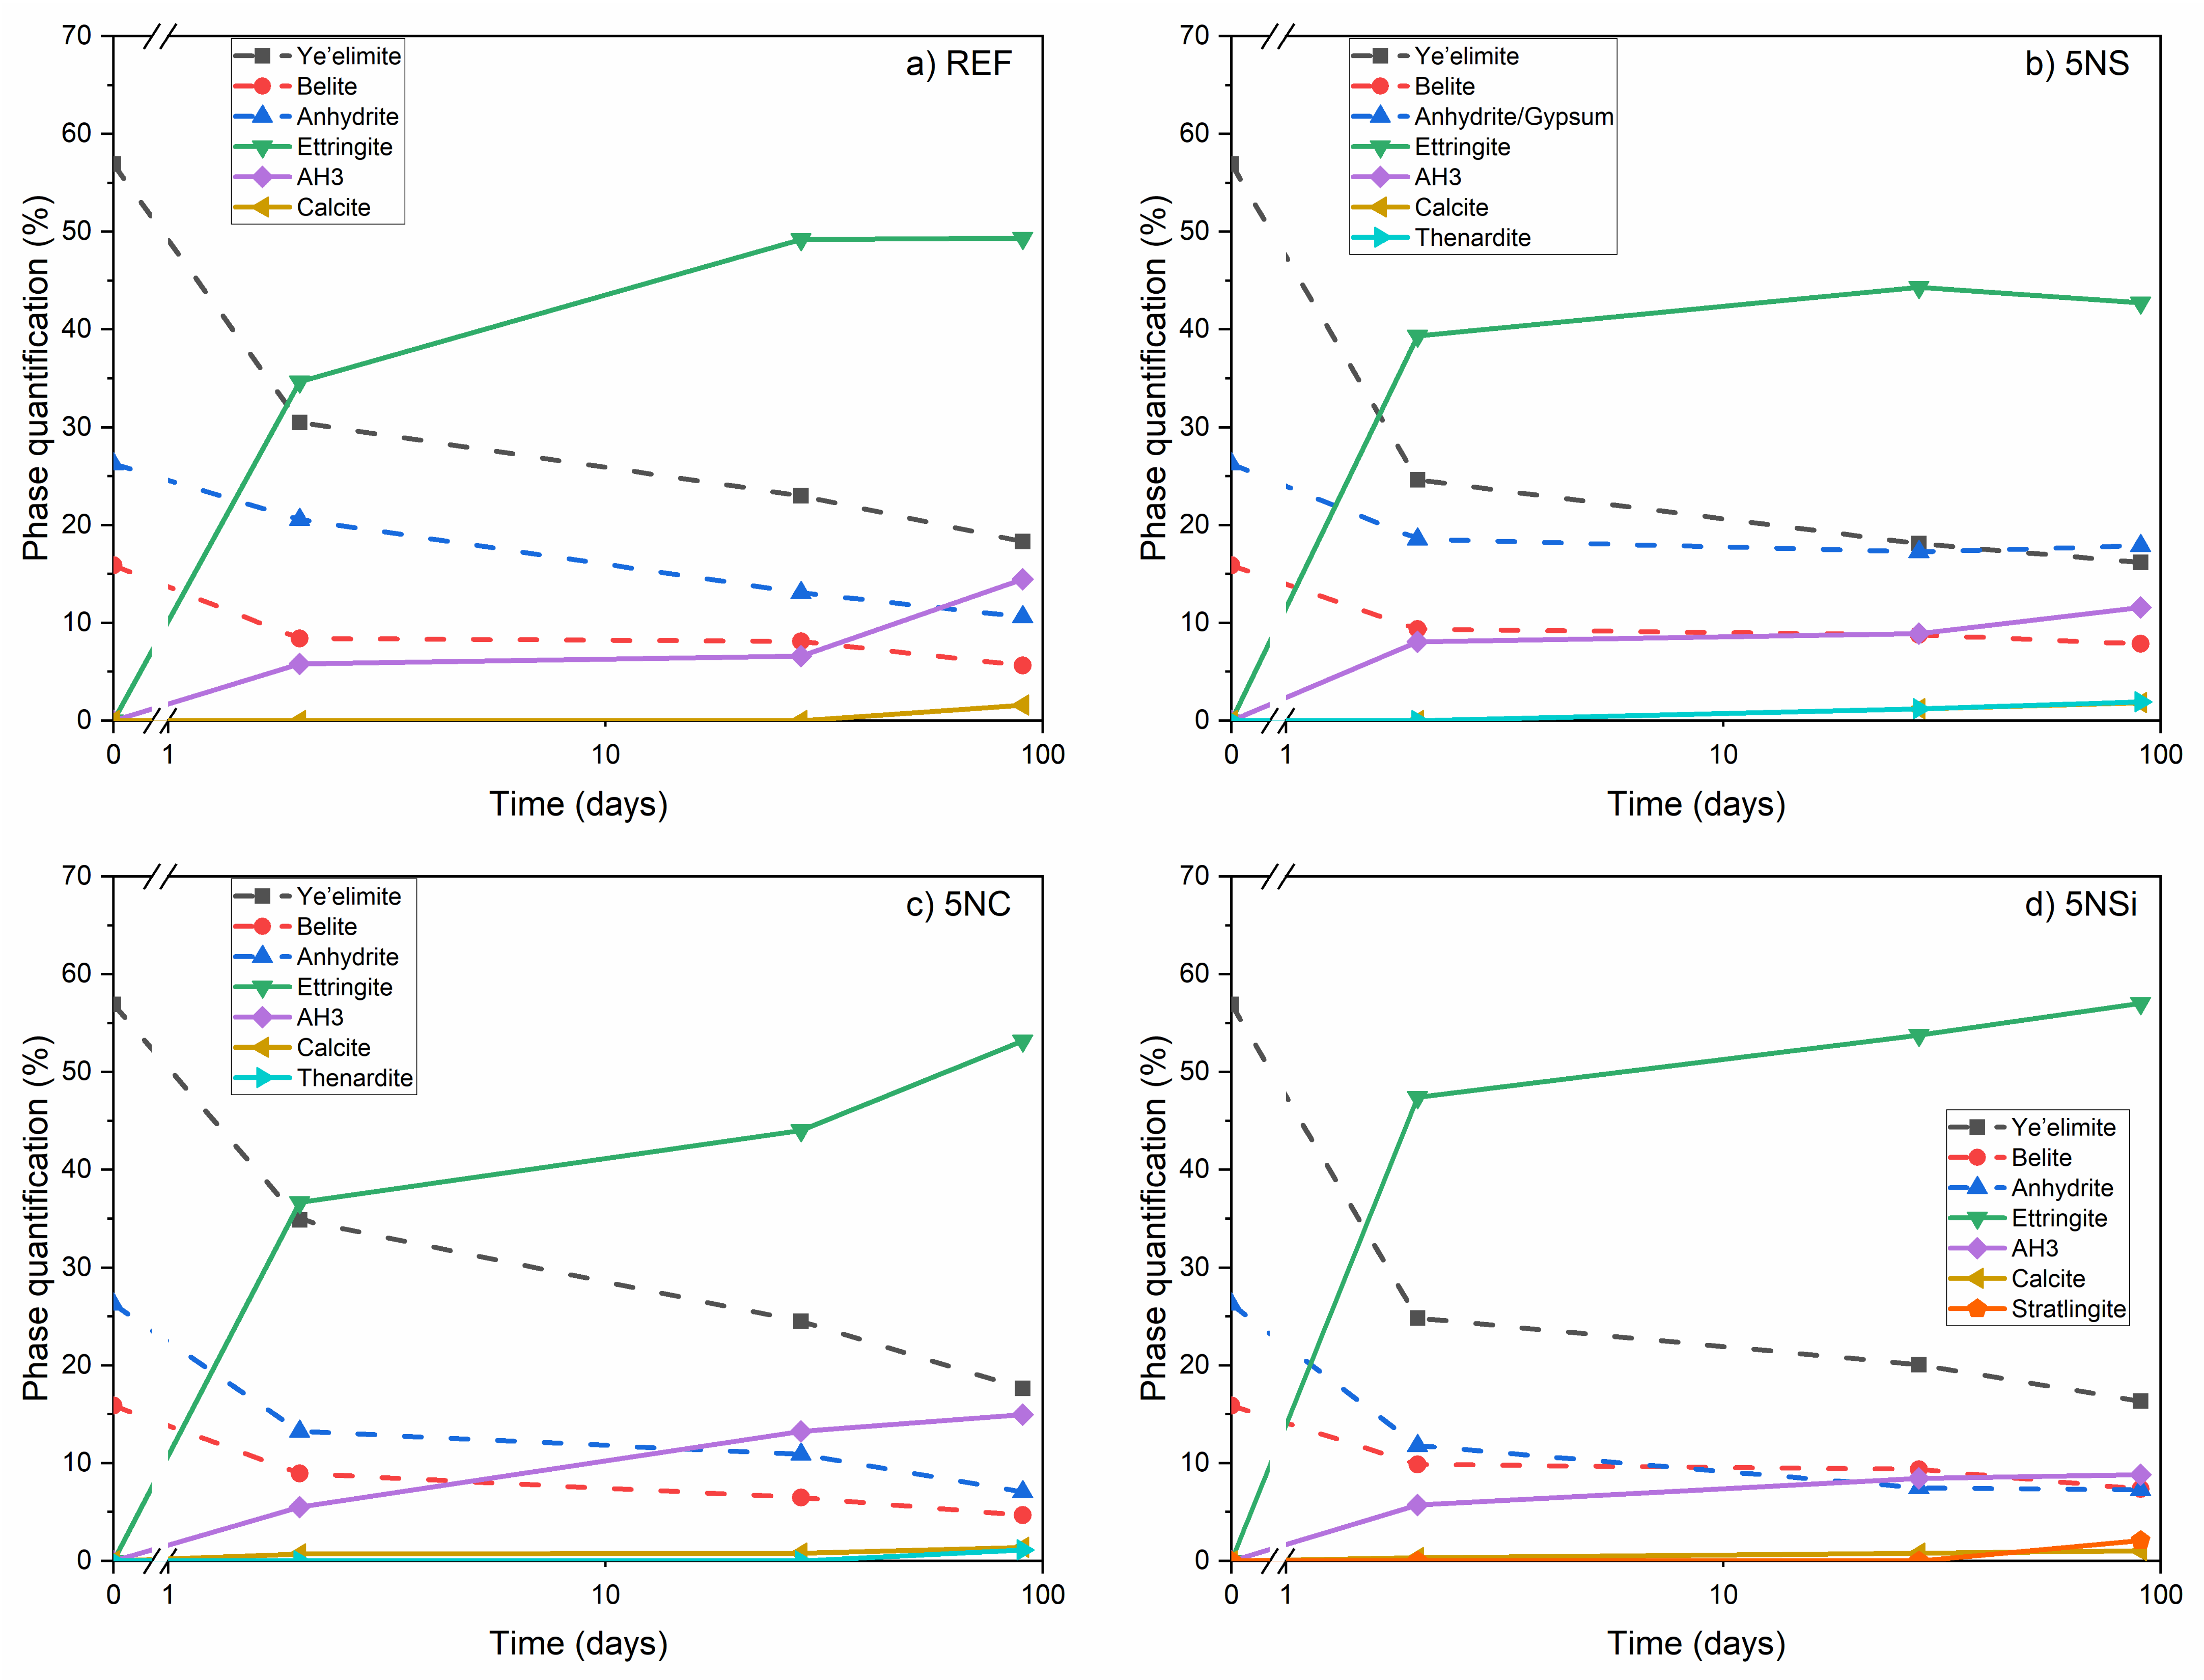
2.3. Characterization

The X-ray diffraction (XRD) patterns for anhydrous CSA and 2-, 28-, and 90-d water-hydrated pastes in the absence (REF) and presence (5NS, 5NC, and 5NSi) of alkaline salts are reproduced in Figure 3. The main diffraction lines on the diffractogram for water-hydrated CSA paste (REF) matched the reflections for ettringite and the unreacted phases C4A3$ and C$, which declined in intensity with hydration time. The many weak reflections at 18° to 19° and 20° to 22°, which rose in intensity over time, were indicative of the formation of scantly crystalline AH3 [25] (see detail in Figure 3a). No AFm-like phases were identified.
The most intense reflections on the diffractograms for the pastes hydrated in the presence of salts were related to ettringite formation. The intensity of the signals associated with ye’elimite was apparently lower than on the patterns for REF pastes. In the presence of Na2SO4 (Figure 3b), 5NS pastes, in addition to ettringite, AH3, gypsum, and thenardite were observed to form in the 28-d specimens, with the respective reflections rising in intensity in the 90-d pastes. The intensity of the line for ettringite declined slightly between 28 and 90 d in sample 5NS, whilst no AFm was observed to form. The AH3 in this paste exhibited greater crystallinity than in the reference.
In the 5NC pastes (bearing Na2CO3), the lower intensity of the anhydrite reflections than in REF at all three ages was associated with greater phase dissolution. No gypsum was observed to form, although calcite was present in the ≥2-d pastes and thenardite in the 90-d specimens. The signals associated with AH3 formation were scantly detectable in the pastes hydrated in the presence of this salt.
The 5NSi pastes exhibited the same products as in the reference, namely ettringite, AH3, and calcite, although the 90-d reflections for calcite and ettringite were slightly more intense. Strätlingite (C2ASH8), not identified with XRD in any of the other pastes, was also observed to form, with low intensity reflections at 12.6° and 21.3° (see detailed in Figure 3d).

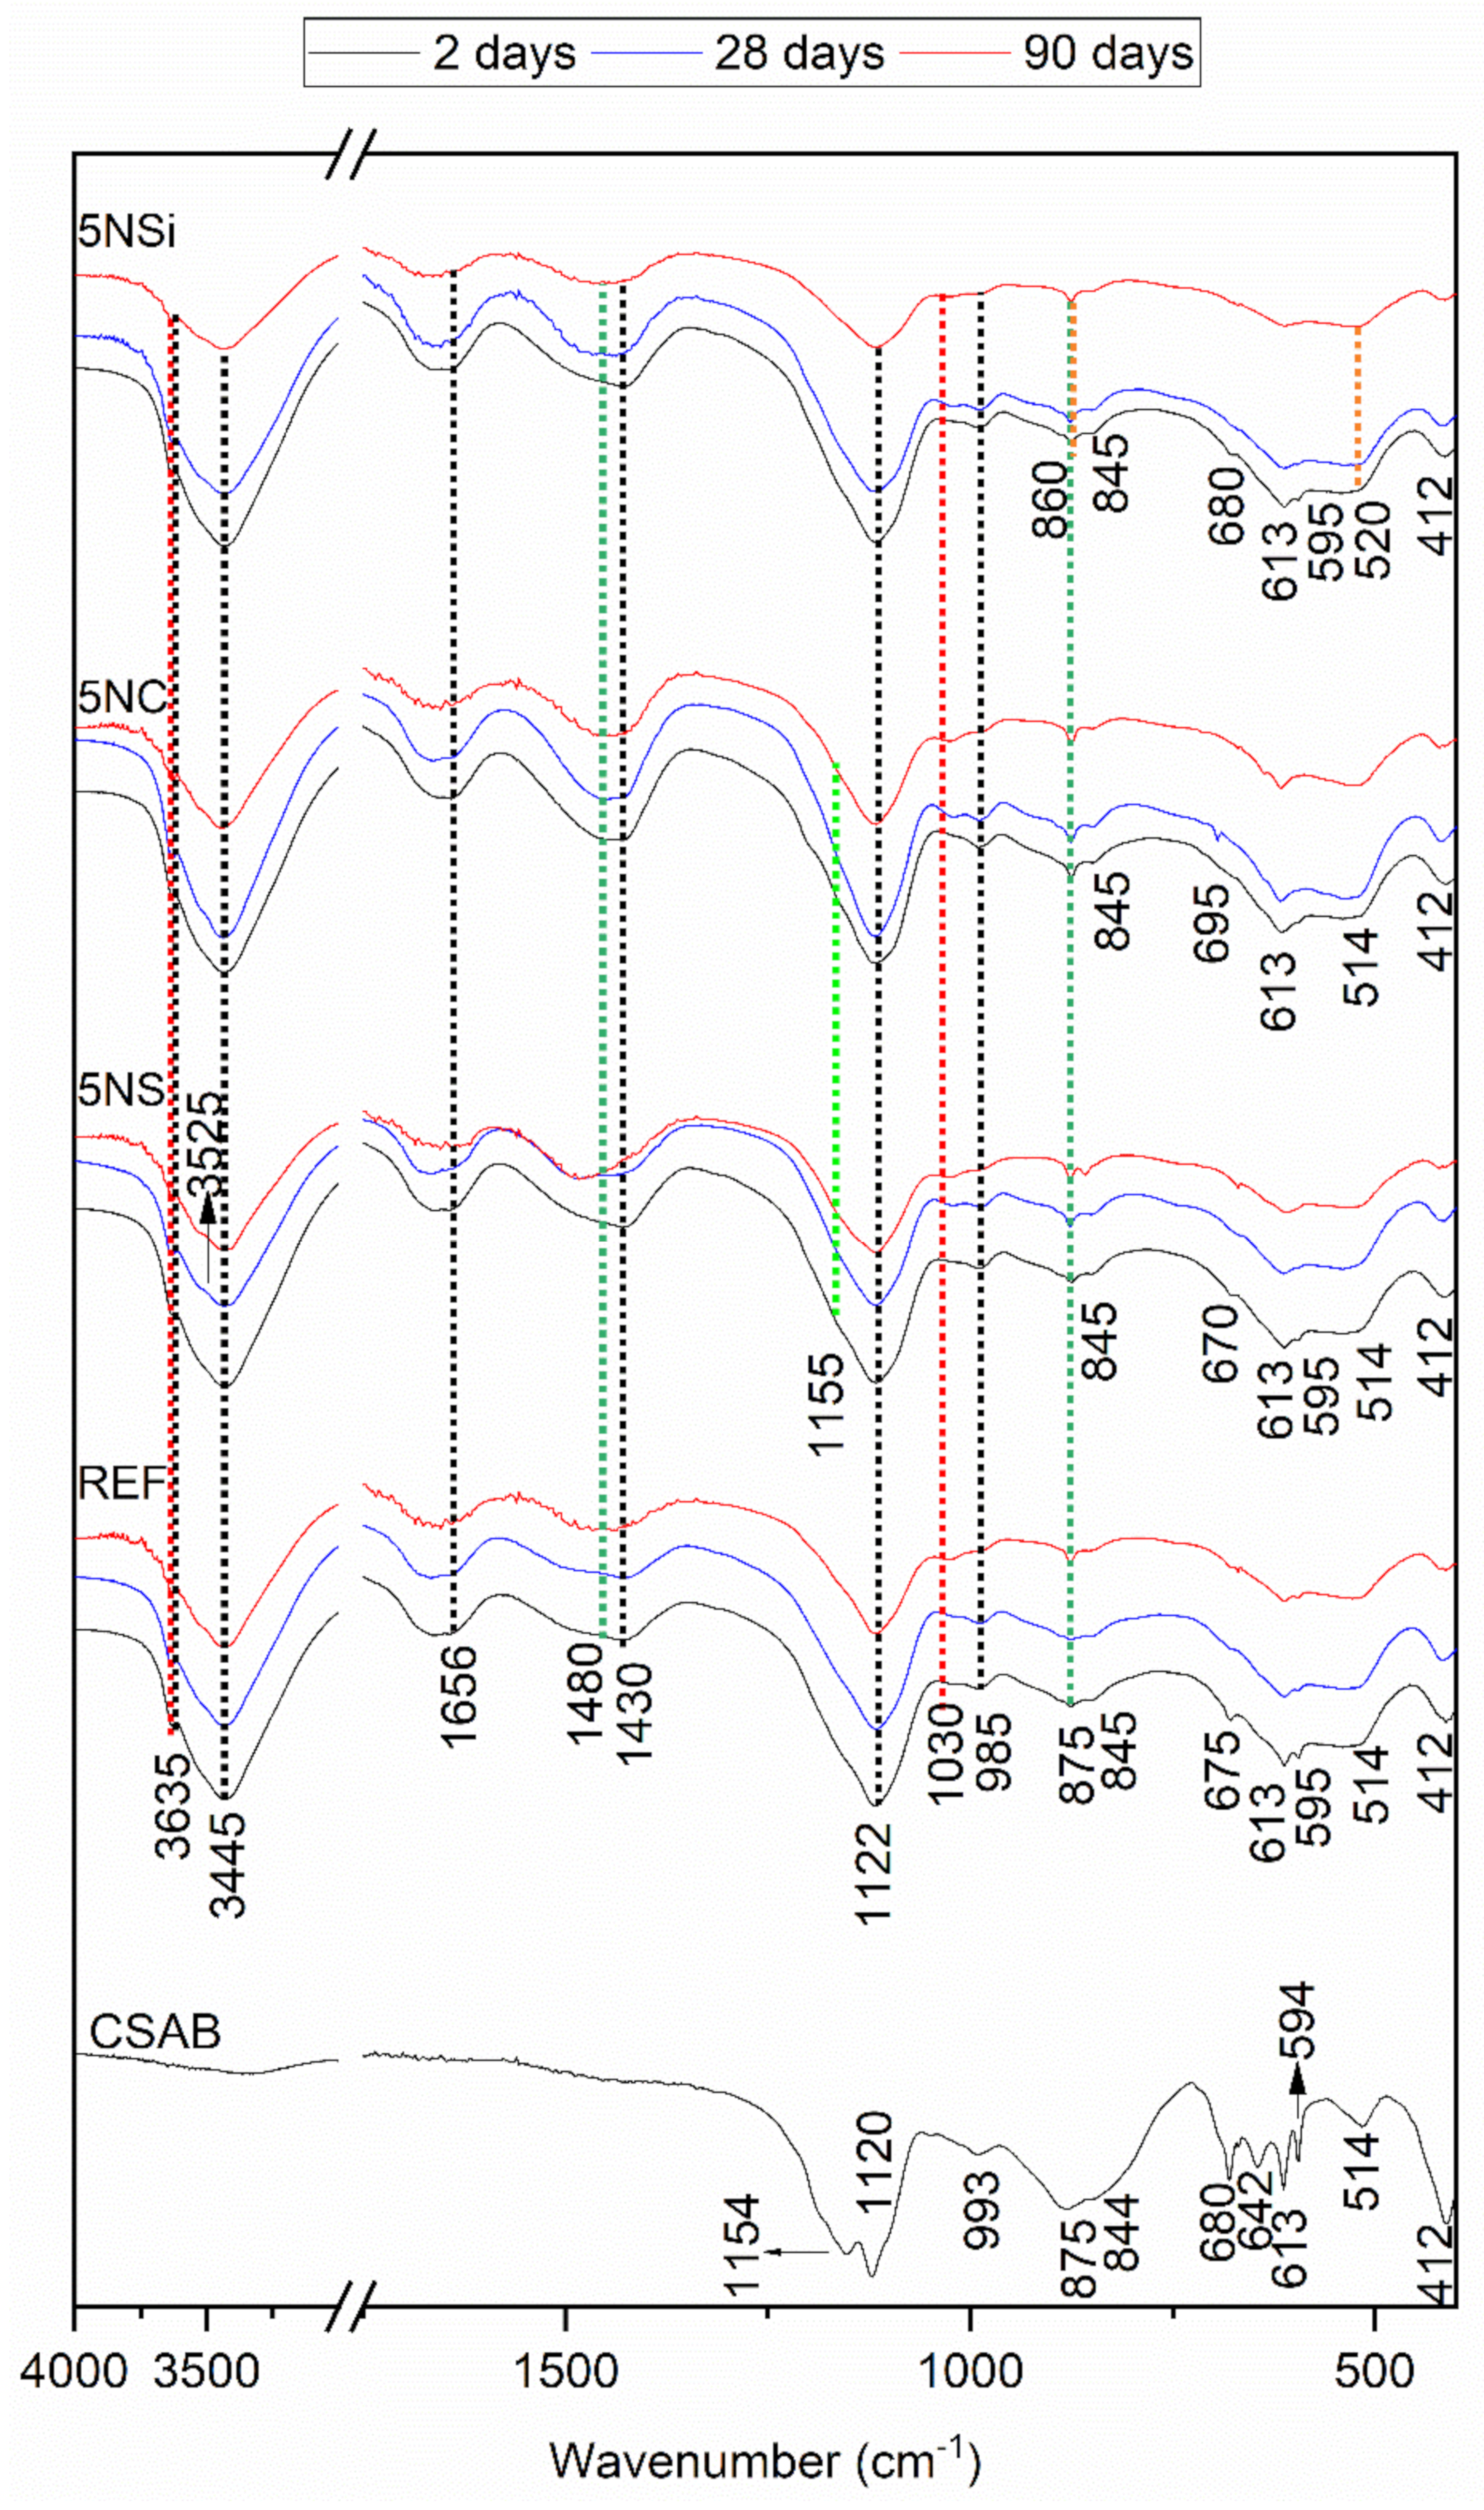
2.4. Microstructural Analysis, FTIR

The FTIR spectra for the anhydrous CSA and all of the 2-, 28-, and 90-d pastes studied, reproduced in Figure 4, confirmed and supplemented the XRD findings. The main bands on the anhydrous CSA spectrum were associated with asymmetric stretching vibrations at 1190 cm−1 and 1100 cm−1 attributable to SO42−, along with υ1 stretching bands at 875 cm−1 and 812 cm−1, indicative of the AlO4 present in ye’elimite [26]. Signals associated with the presence of anhydrite, generated by υ3 SO4 were visible at 1175 cm−1, 1150 cm−1, 1120 cm−1 and 1048 cm−1 and with υ1 SO4 at 680 cm−1, 613 cm−1 and 594 cm−1. The presence of C2S in CSA was inferred by the υ3 Si-O vibrations at 999 cm−1 and 911 cm−1, υ1 Si-O vibrations at 845 cm−1 and υ4 Si-O vibrations at 514 cm−1 [27].
The spectra for the pastes clearly exhibited bands associated with vibration frequencies at: 3635–3637 cm−1 and 3440 cm−1, indicative of OH-stretching in AH3 (a phase difficult to detect with XRD, given its low crystallinity); 1025 cm−1, of Al-O-H bending; and 854 cm−1, of AlO4 stretching. Some of the AH3 bands (at 3635 cm−1 and 3440 cm−1) overlapped with signals associated with OH stretching or (at 1656 cm−1) with OH bending in ettringite, whereas another band at 1115 cm−1 was indicative of AlO4 asymmetric stretching [28].
The 28- and 90-d spectra for the pastes hydrated with 5NS contained bands: attributed to gypsum; at 3520 cm−1 a band associated with OH bending vibrations in water; one at 1480 cm−1 generated by S-O stretching; and one at 856 cm−1 by SO4 tetrahedron bending [29] (data confirmed by XRD). Thenardite was identified on the grounds of the SO4 asymmetric stretching bands at 613 cm−1 and 1155 cm−1 [30].
The highest intensity bands on the 5NC spectrum were associated with carbonates in the form of calcite (1450 cm−1 and 875 cm−1) [31]. Nahcolite (NaHCO3) was visible primarily in the 28-d specimens, identified as absorption bands at 1646 cm−1 and 1630 cm−1 (O-H bending) and 695 cm−1 (HCO3 group bonds) [32]. The 5NSi spectra exhibited the same hydration products as the reference paste, while at later ages the presence of vibration bands associated with strätlingite formation were also detected [33].

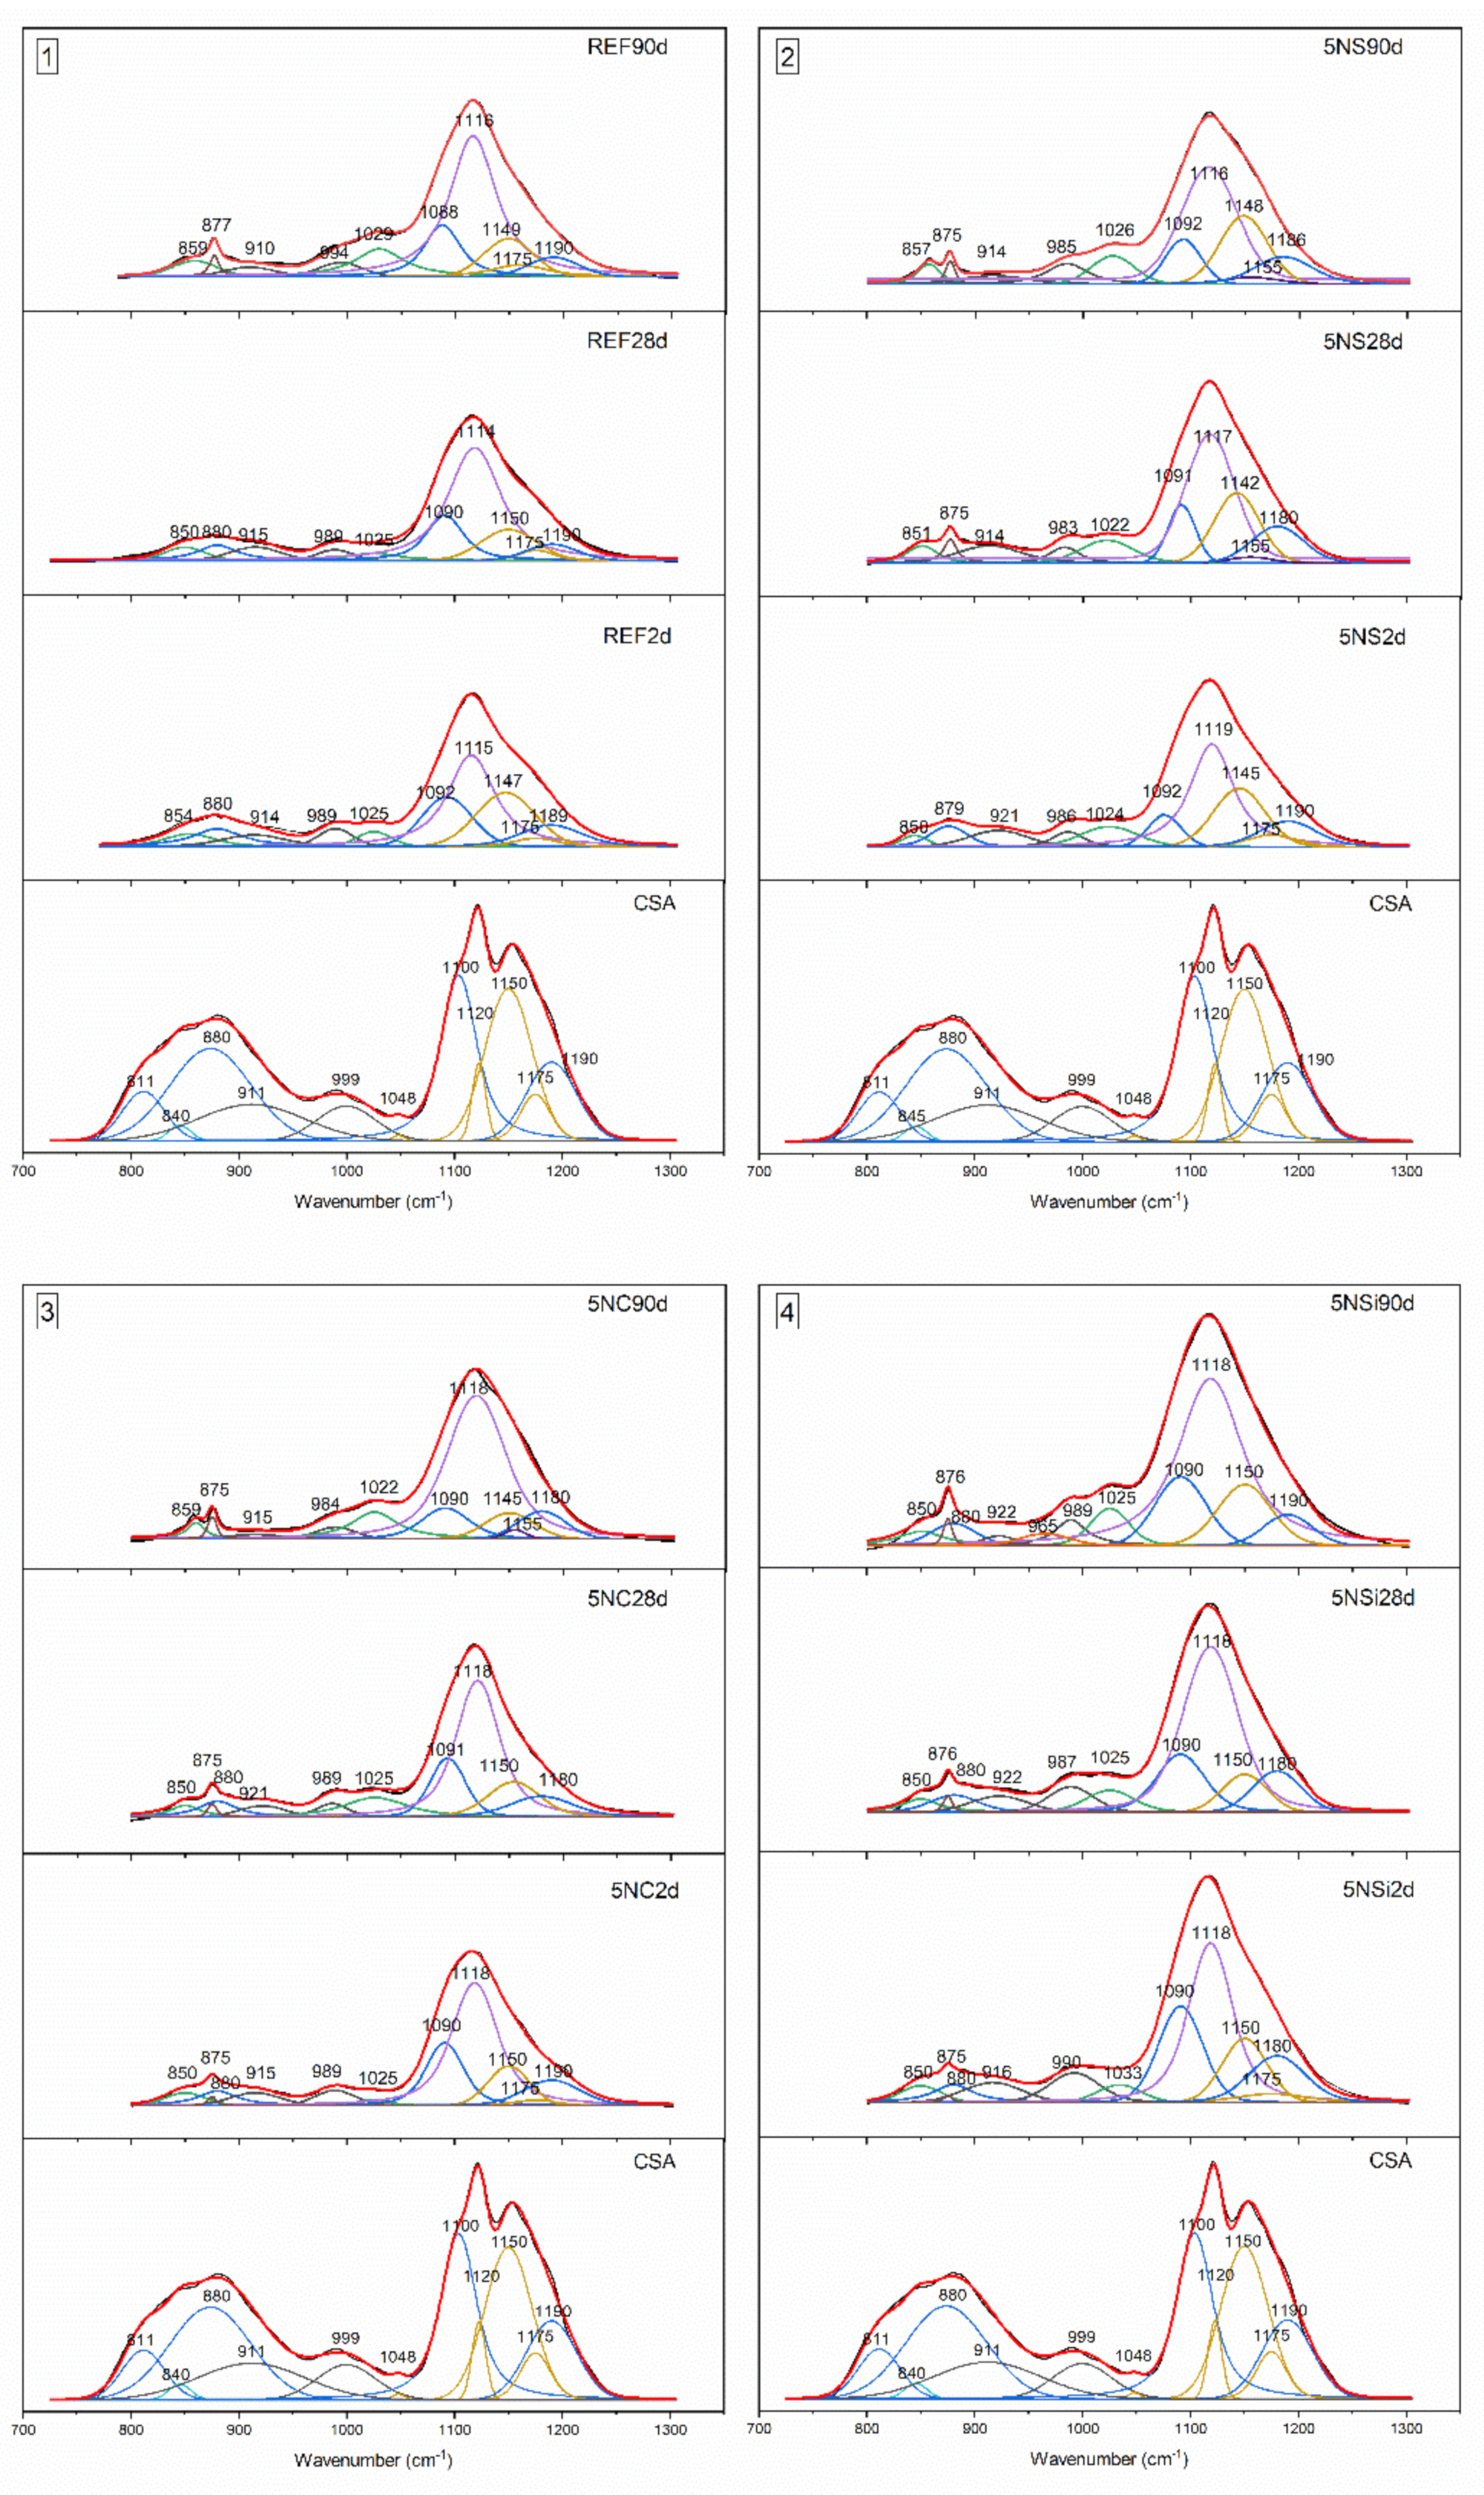
Deconvolution of FTIR Spectra in the 1350 cm−1 to 700 cm−1 Range

Given the overlapping observed and the concomitant complexity involved in differentiating bands, a detailed study was conducted of the 1350 cm−1 to 700 cm−1 spectral range using the Voigt function. Regression coefficients (r2) varied from 0.99996 to 0.99921. The band positions resulting from second derivative analysis are shown in Figure 5, while the positions and respective areas are listed in Table 2.
The deconvoluted spectrum for anhydrous CSA contained 11 signals (see Table 2) associated with the phases in the original material, all of which declined in intensity with hydration time. Some of the bands associated with phases indicative of AlO4 stretching (811 and 845 cm−1) and SO42− asymmetric stretching (1048 and 1120 cm−1) were absent even in in the 2-d spectra for all of the mixes, whilst the signal at 1175 cm−1 declined more gradually over time.
Similar bands were observed in the spectra for all of the pastes at: 1115 to 1119 cm−1, indicative of the SO42− asymmetric stretching in ettringite [28]; 850 to 859 cm−1, of AlO4 stretching; and 1022 to 1023 cm−1, of Al-O-H bending in AH3. The band at 1150 cm−1 on the spectrum for 5NS, associated with gypsum formation, rose in the 28- and 90-d specimens. The band at 1155 cm−1 on the 5NS and 5NC spectra was indicative of thenardite formation. The area under the ettringite band (~1116 cm−1) increased in keeping with hydration time, except in 5NS, where the area declined slightly from 34.88% in the 28-d to 32.87% in the 90-d specimens. The 90-d spectra for the 5NSi pastes exhibited a band at 965 cm−1 associated with strätlingite formation [33].

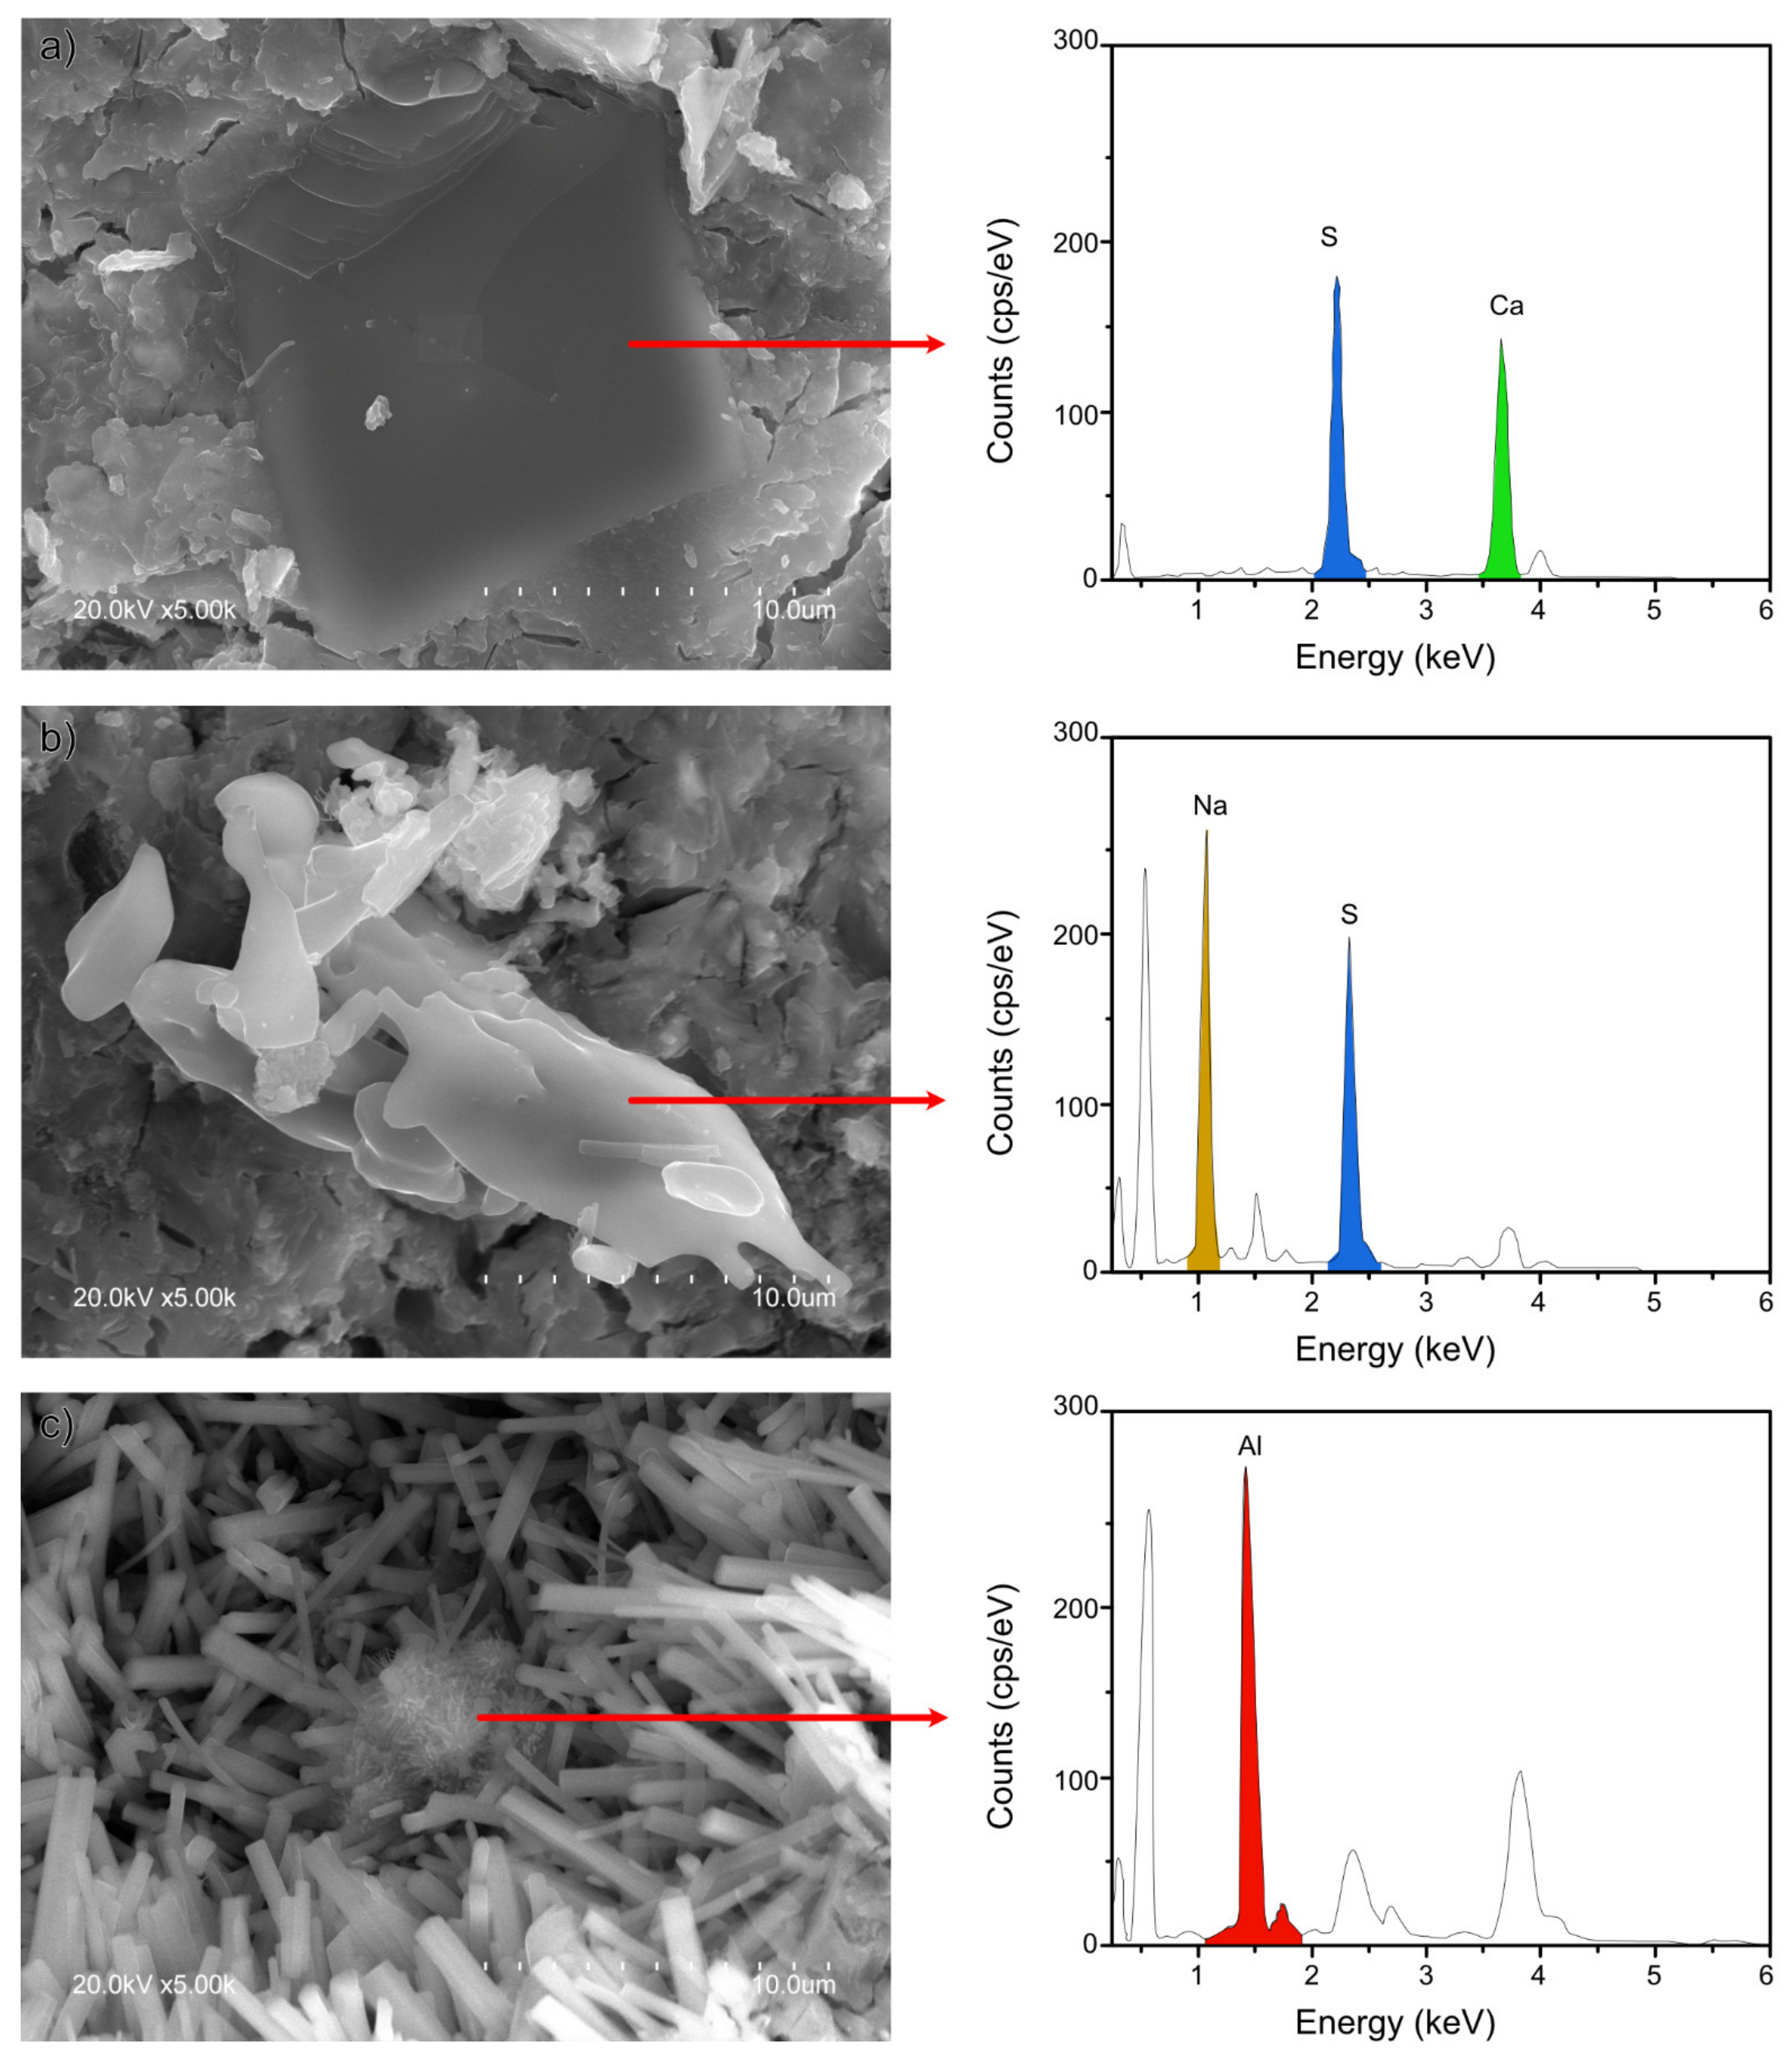
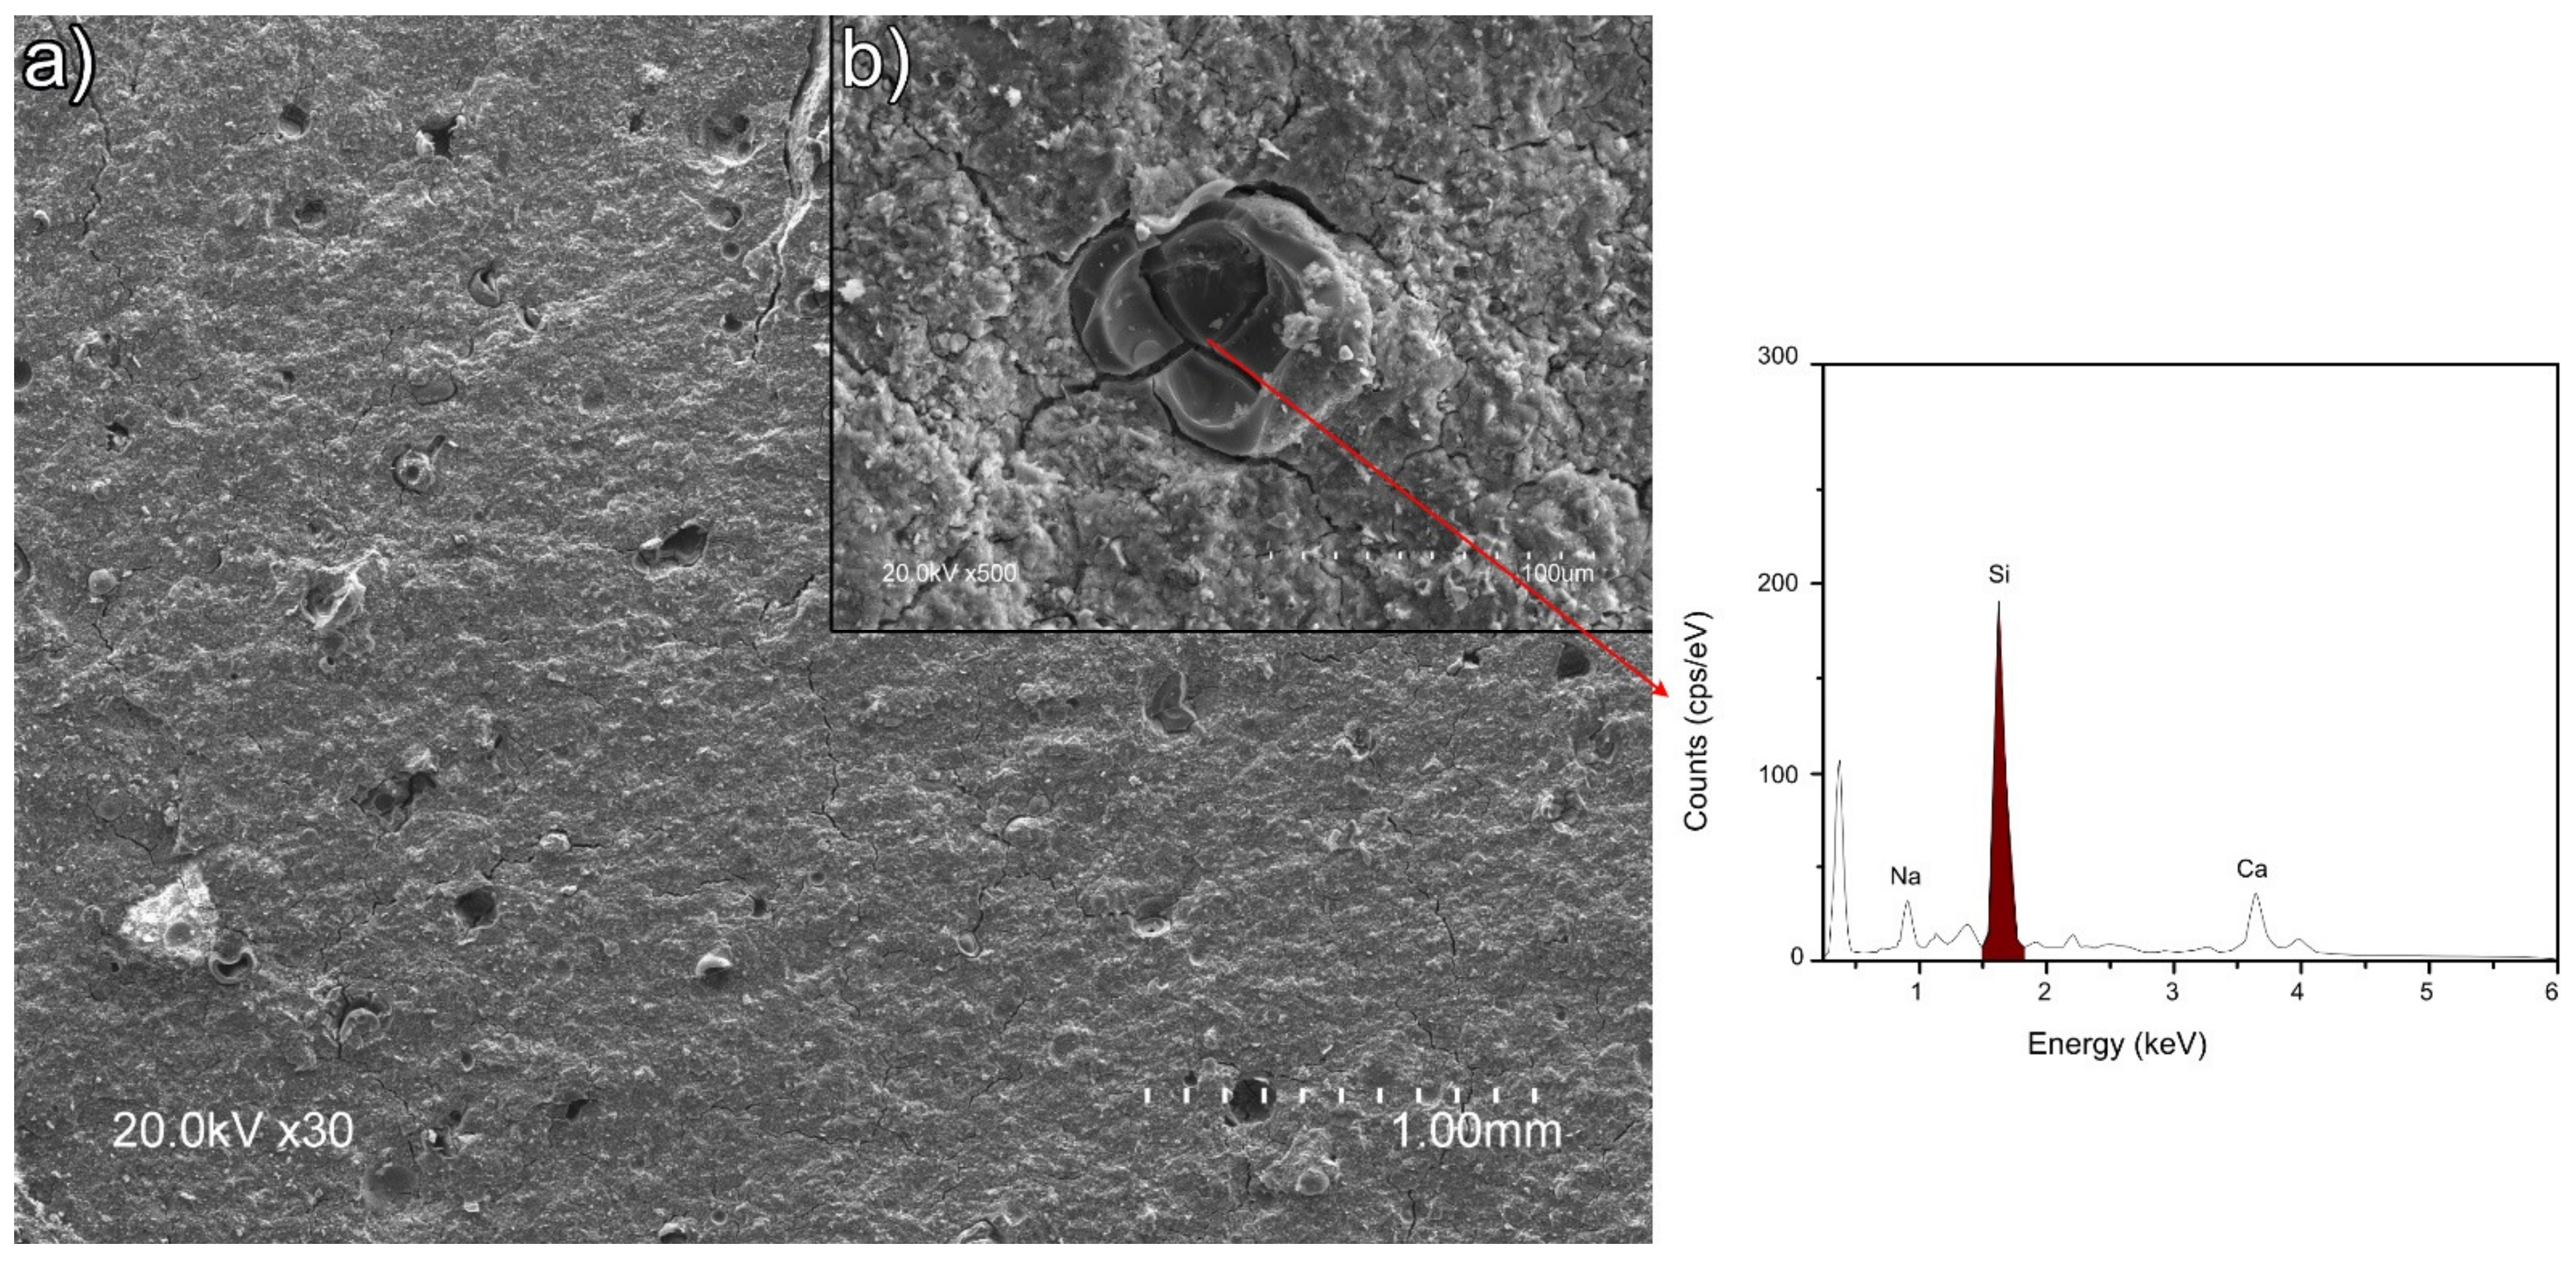
2.5. Scanning Electron Microscope (SEM)

The 28-d micrographs for REF, 5NC, 5NS, and 5NSi are reproduced in Figure 6. All of the pastes exhibited a dense and generally amorphous microstructure. That type of morphology, identified by Gastaldi et al. [34], is associated with CSA pastes hydrated with low water/cement ratios such as those used in this study. The presence of crystalline ettringite needles was detected in the paste pores, most abundantly in the 5NS materials (Figure 6B.2). Gypsum (Figure 7a), sodium sulfates (Figure 7b) and AH3 microcrystals (Figure 7c) were also observed to form in 5NS. Cracking in these matrices was attributable primarily to the presence of gypsum prismatic and thenardite clustered crystals (see Energy Dispersive X-Ray Spectroscopy (EDS) analysis in Figure 7). Thenardite was also identified in paste 5NC (Figure 6C.2), which exhibited the shortest ettringite needles.
The size of the ettringite crystals in sample 5NSi was similar to the dimensions observed for REF. No strätlingite-like particles (identified only after 90 d by XRD and FTIR) were detected on the 28-d micrographs, inasmuch as that mineral forms more slowly [35]. EDS analysis of the amorphous matrix revealed the presence of silicon (see Figure 6D.2), a Ca/Si ratio of 0.15 to 0.35 and an Al/Ca ratio of around 1, the theoretical value. Unreacted, low solubility (11.5 g/100 mL [36]) sodium silicate was observed in the 28-d micrographs (Figure 8). The qualitative SEM-EDS analyses identified phases with similar morphologies and compositions. Further to the data, the Ca/S ratios for the ettringite needles were slightly higher than the theoretical ratio of 2 (~2.38 for REF; 2.18 for 5NS; 2.34 for 5NC; and 2.63 for 5NSi).

3. Discussion

Further to Equation (1), for ye’elimite hydrated in the presence of anhydrite to yield ettringite, the water/CSA (w/c) ratio would need to be 0.78 (Equation (2). The CSA used in this study contained around 70% C4A3$ + C$, inferring that the w/c ratio used here should have been the stoichiometric 0.54. That notwithstanding and in keeping with actual practice, a slightly lower ratio (w/c = 0.5) was applied, although the resulting pastes were workable. That lower amount of water than stoichiometrically required delivered denser matrices and less crystalline hydration products [37], as observed in Figure 6, Figure 7 and Figure 8.
(w/s)st = gr H2O/gr (C4A3$ + C$) = (34 × 18)/(610 + 2 × 136.14) = 0.78
The heat flow curve for CSA hydration (REF, see Figure 1) contained a signal peaking at 1.67 h, according to Jensen et al. [38] a time associated with synchronized C4A3$ + C$ reaction-induced ettringite and amorphous AHx (AH3 with a higher water content) formation and precipitation. The two following peaks, at 3.41 and 5 h, would be indicative of more ettringite precipitation, which would dissolve no more calcium sulfate nor consume unbound water. Rather, the water for ettringite precipitation would be sourced from the excess water in the amorphous AHx forming. The presence of AFt and AH3 was verified by XRD and FTIR characterization of the 2-d pastes, which exhibited some minor carbonation in the form of calcite (see Figure 3), observed to increase in intensity over time.
The presence of salts modified the heat flow curve. A single peak, instead of the three observed in REF, appeared at different times and with a higher intensity, suggesting that the salts may have induced simultaneous coursing of some of the reactions involved. Similar behaviour was found in an earlier study analyzing the effect of pH on CSA hydration [17], where ~0.1 to ~1 M NaOH solutions hastened the initial CSA reaction, raising the initial heat of hydration and early-age strength. That behaviour differed at pH > 14. In addition to the effect of the presence of alkalis (pH < 12), the present study analyzed the effect of anions SO42−, CO32−, and SiO42−.
Figure 9 compares the areas associated with the deconvoluted FTIR bands in the 1350 to 700 cm−1 range on the spectra for the 2-, 28-, and 90-d pastes. The pastes hydrated in the presence of the salts were observed to consume more anhydrite and ye’elemite. The 2-d belite content declined slightly, but remained essentially flat thereafter. The effect of each salt is discussed in greater detail below.

3.1. Hydration in the Presence of Na2SO4

Sodium sulfate may cause severe durability problems in conventional Portland cements [39,40]. In contrast, the use of sodium silicate at concentrations of 5% to 8% in hybrid cements (~70% to 80% fly ash and 30% to 20% PC) has yielded promising results [41]. The data in Figure 1 and Figure 2 show that in CSA cements 5% Na2SO4 hastened initial hydration and improved 2-d compressive strength, while inducing material cracking and a decline in strength at later ages (see Figure S1).
As Na2SO4 is a very soluble salt (~20 g/100 mL of water at 20 °C), only traces of its presence were detected by XRD or FTIR in 2-d 5NS pastes. The presence of a higher sulfate ion content appeared to hasten the initial ye’elimite reaction, giving rise to the formation of more ettringite and AH3 gel in the 2-d pastes. That would explain the higher 2-d strength values (Figure 2), as well as the presence of an intense peak on the heat flow curve (Figure 1). Cracking appeared between the 2- and 28-d 5NS specimens (see Figure S1b), whilst the XRD and FTIR spectra revealed an ongoing decline in ye’elimite content, a rise in the proportion of ettringite and the onset of sulfate salts (gypsum and thenardite). The cracks appearing at 28 d and especially at 90 d were associated with the internal stresses generated in the specimens. Due to the precipitation of these salts in the hardened matrix (Figure 7), the process was intensified in the 90-d material by the slight decline in ettringite content (Figure 9b). The products identified were similar to the ones found when PC, attacked by sulfates, cracks in response to their formation [42,43].
The aforementioned developments were exacerbated by carbonation, in turn favoured by the higher pH generated by the presence of alkalis. That affected AFt stability and induced gypsum formation, as per Equation (3) [44].
3CaO∙Al2O3∙3CaSO4∙32H2O + 3CO2 → 3CaSO4∙2H2O + 3CaCO3 + 2Al(OH)3 + 23H2O
Figure 9b clearly shows that ettringite content declined between 28 and 90 d, while the gypsum, calcite, and AH3 contents rose. There was more AH3 in paste 5NS than in REF (CSA + water). The XRD and SEM findings (Figure 3 and Figure 6) also revealed gibbsite formation, an indication of greater AH3 crystallinity. Gibbsite crystal growth may have been related to the increase in voids generated by the cracks induced by ettringite and gypsum formation.
The change in hydrate content observed for 5NS was associated with the AFt stability domain in CaO∙Al2O3∙Ca2SO4∙H2O systems. Rising sulfate concentration modifies the stability field of ettringite [45], inducing its decomposition along with the formation of gypsum, calcite, and thenardite [46,47,48]. Such ettringite destabilization, together with what is known as ‘sulfate salt crystallization distress’, prompts variations in volume and material cracking (see Figure S1) [40,47].
In contrast, the presence of 5% Na2SO4 appeared to have no significant impact on the degree of C2S hydration. That result is consistent with other studies published in the literature [49] on the effect of 4% sodium sulfate on synthetic C2S hydration.

3.2. Hydration in the Presence of Na2CO3

The Na2CO3 content (ranging from 2 to 4 wt.%) in PC may induce carbonation and efflorescence [50]. In hybrid cements it is used to catalyze hydration and raise early-age strength [51,52]. This highly soluble salt (30.7 g/100 mL) also raises pH to values of ~11.5. Its presence during CSA hydration appeared to have no significant effect on that reaction at either early or later ages. Setting times and strength development in the specimens studied here were very similar to the findings for the reference paste (REF = CSA + water), although more calcite and surface efflorescence were observed (see Figure 9). Surface efflorescence poses aesthetic problems but apparently causes no structural damage to the material. As it consisted primarily of sodium or calcium carbonate, its presence was tantamount to releasing the salt added, thereby mitigating the potential effect of the activator and generating matrices that resembled the reference more closely than the other two salts.
These pastes did have a higher calcite content than the reference (Figure 3 and Figure 5), however, visible at 29.5° on the XRD patterns, as the deconvoluted FTIR band at 875 cm−1 as well as the band at 1450 cm−1. Thenardite also precipitated in these matrices at later ages (90 d), further to the reaction described in Equation (4) [53].
CaSO 4 + Na 2 CO 3     Na 2 SO 4 + CaCO 3
The carbonates added formed calcite or soluble calcium salts but appeared not to react with ettringite to any significant extent (Equation (3)), for the latter was not observed to decline or form gypsum. On the contrary, the amount of ettringite continued to rise over time (Figure 9c), which would explain the steady rise in mechanical strength (Figure 2a). Follow-up studies on developments in >90-d specimens would be advisable.

3.3. Hydration in the Presence of Sodium Disilicate

At 11.5 g/100 mL, solubility was lower in Na2SiO3 than in the other salts studied here [36]. This salt raised the (highly reactive) SiO2 content in the overall cement composition by nearly 2%. The 90-d XRD patterns exhibited strätlingite (C2ASH8), a product not identified in the other two mixes, whose precipitation was largely induced by the higher silica content in the binder.
Siliceous hydrogarnet (C3ASH4), observed to form in calcium aluminate cements (CAC) blended with sodium silicate, retards CAC hydration slightly [54]. In the presence of reactive silica (silica fume), however, CAC hydration has been reported to generate strätlingite (C2ASH8) [24,55,56], a reaction expedited by the presence of alkaline ions that favour silica fume dissolution. Later-age belite/ye’elimite/ferrite (BYF) cement pastes and BYF-FA blended cements have also been reported to form strätlingite and siliceous hydrogarnet. The presence of strätlingite in CSA/sodium silicate blends in this study was associated primarily with the reaction of the soluble Si ions in the silicate with the AH3 in the presence of calcium. The sodium silicate-induced rise in the degree of ye’elimite reaction and ettringite content and the decline in AH3 content, all relative to the reference, are illustrated in Figure 9d). Those data confirm reports in the literature to the effect that strätlingite formation entails the uptake of AH3 [57].

4. Materials and Methods

A commercial cement, ALICEM i-tech©, was used in this study. According to the particle size distribution determined on a COULTER LS130 analyzer covering a range of 0.1 to 900.0 µm, the diameter of 90% of the particles was under 11.51 µm and 10% <1.06 µm. Cement density was 2.90 g/cm3, its Blaine fineness 474.6 m2/kg and its BET specific surface 1373 ± 13 m2/kg (see Table 3).
Table 3 also shows the chemical composition of the CSA established on a Bruker S8 Tiger X-ray fluorescence spectrometer fitted with an Rh-anode X-ray tube, as well as its XRD-defined mineralogical composition (interpreted with the Rietveld method using Topas [58] software and COD data). Ye’elimite accounted for 49.4% of the total, anhydrite (possibly a result of gypsum water loss during joint milling) for 23%, calcium silicate phases for 18.5% and tricalcium aluminate for 1.8%.
The CSA cement was hydrated with water in the absence (REF) or presence (5 wt.%) of one of three alkaline salts: sodium sulfate (Panreac 99% reagent grade Na2SO4), (Silicates Manufacturing Company, Madrid, Spain) sodium disilicate powder (with a SiO2/Na2O molar ratio of approximately 2.00 and a solids content of 82%) and sodium carbonate (Panreac 99.8% reagent grade Na2CO3). Mixes containing 95 g of CSA and 5 g of salt (see Table 4) were dry-blended for 30 min in a shaker-mixer and subsequently hydrated with water at a w/b ratio of 0.5, the proportion of water required to hydrate CSA further to the consistency test described in European and British standard BS EN 196-3 [59]. A low w/b ratio is recommended for CSA hydration to control porosity and limit the diffusion of aggressive agents such as carbonates and chlorides to enhance durability [34]. The weight percentages of Na2O and the anions SO32−, CO32−, and SiO32− are listed in Table 4. The CSA + salt + water mixes were stirred automatically at 350 rpm for 3 min.
Setting times were determined with an automatic Vicat apparatus further to EN 196-3 [59] specifications. The initial setting was defined as the time when the plunger penetrated 34 mm into the sample and the final setting as when penetration declined to 0.5 mm.
The effect of the alkaline solution on paste fluidity, determined with the mini-slump test [60], was defined as the mean of four slump diameter readings using a mould proportional in size to the standard cone (small mould/standard cone = 0.19). Mechanical strength was found on prismatic specimens (1 × 1 × 6 cm) [61], initially cured in their moulds in a climatic chamber (22 ± 2 °C, relative humidity >90%) for 24 h, when they were removed from the moulds and stored in the chamber until the test age (2, 28, or 90 d).
Twelve samples were tested for compressive strength on an Ibertest Autotest-200/10-SW frame at a load rate of 0.07 kN/s [62]. Some of the specimens were subsequently milled to a fine powder for microscopic analysis, after detaining hydration by soaking for 7 d in 1:10 volume isopropanol [63] and vacuum drying to a constant weight.
CSA mineralogical phases were determined on a Bruker D8 Advance X-ray diffractometer (Bruker Corporation, Madrid, Spain) at the following instrumental settings: Cu Kα1,2 radiation, 1540 Å, 1544 Å; configuration, no monochromator; and goniometer radius, 217.5 mm. The conditions for anhydrous cement scanning for subsequent Rietveld refinement were: 0.5° fixed divergence slit; 2θ angle range, 5° to 70°; step time, 2 s; step size, 0.02°. The recording conditions for the pastes, using the same instrument, were: variable 6-mm divergence slit; 2θ angle 5° to 60°; step time, 0.5 s; step size, 0.02°.
Microstructure was analyzed on pellets prepared with 300 mg KBr and 1.0 mg of problem sample and scanned with a Thermo Scientific Nicolet 6700 Fourier transform infrared spectrophotometer covering a frequency range of 4000 to 400 cm−1. The spectra acquired with 64 scans at a spectral resolution of 4 cm−1 were deconvoluted in the 1350 to 700 cm−1 range by fitting to the theoretical curve for the original spectrum (regression coefficient = 1). The second derivative method was applied to identify the position of the bands overlapping on the spectra [64].
Scanning electron microscopic (SEM) studies were conducted on carbon-coated, vacuum-dried 28-d specimens with a Hitachi S-4800 microscope featuring a maximum resolution of 1.4 nm and fitted with a Bruker XRD detector (Billerica, MA, USA). The data were processed with Quantax 400 software.
The heat flow and total heat released associated with the hydration reactions were found with isothermal conduction calorimetry as per standard American Society for Testing and Materials—ASTM C1702 [65] on a Thermometric TAM AIR calorimeter (New Castle, PA, USA) at a constant 25 °C. Pastes containing 10 g of solid and 5 g of distilled water were mixed at a low speed (200 rpm) for 30 s and high speed (800 rpm) for up to 3 min, after which 7.5 g were weighed and placed in the calorimeter.

5. Conclusions

The ettringite and AH3 formation attendant upon CSA hydration (REF) consumed ye’elimite and anhydrite. Due to the use of a lower-than-stoichiometric w/c ratio (0.5), the ettringite formed was scantly crystalline and the matrix generated was dense. Typical ettringite needles were observed only inside the pores, which afforded sufficient space for crystal growth.
The presence of 5% alkaline salts impacted process kinetics, the reaction products formed and strength development, although these effects varied with the type of salt.
The use of sodium sulfate had adverse effects. Whilst its presence hastened the initial ye’elimite reaction, raising 2-d strength, at later ages the excess sulfates and alkalis induced thenardite re-precipitation, ettringite carbonation, and gypsum formation. The presence of those minerals in the hardened matrix generated stresses that led to material cracking.
The addition of sodium carbonate appeared to have no significant effect. Its presence initially induced false setting which after remixing delayed setting times relative to the reference. This was nonetheless the system with the closest resemblance to the reference, possibly because part of the carbonate forming was released in the form of efflorescence. Since thenardite was observed to form at the latest age studied here, however, research on >90-d materials would be advisable.
Adding sodium silicate had a beneficial effect, hastening hydration and raising mechanical strength relative to the reference at all of the ages studied, 90 d in particular. The presence of this salt catalyzed ye’elimite hydration, raised the amount of ettringite and induced minor strätlingite formation, yielding denser, stronger matrices.

Supplementary Materials

The following are available online, Figure S1. Twenty-eight-day air-cured specimens: (a) REF; (b) 5NS; (c) 5NC; (d) 5NSi.; Figure S2. FTIR spectrum for efflorescence on 28-d 5NC pastes.

Author Contributions

Conceptualization, L.U.D.T.J., A.P., and A.F.-J.; methodology, L.U.D.T.J., A.P., and A.F.-J.; validation, L.U.D.T.J. and A.F.-J.; formal analysis, L.U.D.T.J., P.P.-E., and A.F.-J.; investigation, L.U.D.T.J., P.P.-E., and A.F.-J.; resources, M.C., A.P., and A.F.-J.; data curation, L.U.D.T.J. and A.F.-J.; writing—original draft preparation, L.U.D.T.J. and A.F.-J.; writing—review and editing, L.U.D.T.J., A.P., and A.F.-J.; supervision, J.C.R., A.P., and A.F.-J.; project administration, L.U.D.T.J. and A.F.-J.; funding acquisition, L.U.D.T.J., J.C.R., and A.F.-J. All authors have read and agreed to the published version of the manuscript.

Funding

This research was funded by the Brazilian National Council for Scientific and Technological Development (CNPq), grant number 208380/2017-5 and 151890/2020-0 and furnished by the Spanish Ministry of the Economy and Competitiveness and FEDER under research project BIA2016-76466-R and funding from BES-2017-082022.

Institutional Review Board Statement

Not applicable.

Informed Consent Statement

Not applicable.

Data Availability Statement

The data presented in this study are available in Supplementary Materials.

Acknowledgments

This study was partially supported by the Brazilian National Council for Scientific and Technological Development (CNPq) under projects 208380/2017-5 and 151890/2020-0, and CAPES. Financial support was also furnished by the Spanish Ministry of the Economy and Competitiveness and FEDER under research project BIA2016-76466-R and funding from BES-2017-082022. PhD. student Pilar Padilla-Encinas thanks the Autonomous University of Madrid for the opportunity to complete her thesis in its Applied Chemistry program. The cement supplied by Heidelberg Cement Hispania is gratefully acknowledged.

Conflicts of Interest

The authors declare no conflict of interest.

Sample Availability

Not available.

References

  1. Gartner, E. Industrially interesting approaches to “low-CO2” cements. Cem. Concr. Res. 2004, 34, 1489–1498. [Google Scholar] [CrossRef]
  2. Sharp, J.H.; Lawrence, C.D.; Yang, R. Calcium sulfoaluminate cements—low-energy cements, special cements or what? Adv. Cem. Res. 1999, 11, 3–13. [Google Scholar] [CrossRef]
  3. Aranda, M.A.G.; De la Torre, A.G. Eco-Efficient Concrete; Elsevier: Amsterdam, The Netherlands, 2013; ISBN 9780857094247. [Google Scholar]
  4. Zhang, L.; Glasser, F.P. Hydration of calcium sulfoaluminate cement at less than 24 h. Adv. Cem. Res. 2002, 14, 141–155. [Google Scholar] [CrossRef]
  5. Dovál, M.; Palou, M.; Kovár, V. Heat evolution and mechanism of hydration in CaO–Al2O3–SO3 system. Ceram. Silik. 2005, 49, 104–108. [Google Scholar]
  6. Janotka, I.; Krajči, L.; Mojumdar, S.C. Performance of sulphoaluminate-belite cement with high C4A3$ content. Ceram. Silik. 2007, 51, 74–81. [Google Scholar]
  7. García-Maté, M.; De La Torre, A.G.; León-Reina, L.; Aranda, M.A.G.; Santacruz, I. Hydration studies of calcium sulfoaluminate cements blended with fly ash. Cem. Concr. Res. 2013, 54, 12–20. [Google Scholar] [CrossRef] [Green Version]
  8. Hanein, T.; Galvez-martos, J.; Bannerman, M.N. Carbon footprint of calcium sulfoaluminate clinker production. J. Clean. Prod. 2018, 172, 2278–2287. [Google Scholar] [CrossRef] [Green Version]
  9. Gastaldi, D.; Canonico, F.; Capelli, L.; Bianchi, M.; Pace, M.L.; Telesca, A.; Valenti, G.L. Hydraulic behaviour of calcium sulfoaluminate cement alone and in mixture with Portland cement. In Proceedings of the 13th International Congress on the Chemistry of Cement, Madrid, Spain, 3–8 July 2011; p. 412. [Google Scholar]
  10. Bertola, F.; Gastaldi, D.; Irico, S.; Paul, G.; Canonico, F. Behavior of blends of CSA and Portland cements in high chloride environment. Constr. Build. Mater. 2020, 262, 120852. [Google Scholar] [CrossRef]
  11. Trauchessec, R.; Tobón, J.I.; Lecomte, A. Influence of the ye’elimite/anhydrite ratio on PC-CSA hybrid cements. Mater. Today Commun. 2020, 22, 100778. [Google Scholar] [CrossRef]
  12. Qin, L.; Gao, X.; Zhang, A. Potential application of Portland cement-calcium sulfoaluminate cement blends to avoid early age frost damage. Constr. Build. Mater. 2018, 190, 363–372. [Google Scholar] [CrossRef]
  13. Saoût, G.L.; Lothenbach, B.; Hori, A.; Higuchi, T.; Winnefeld, F. Hydration of Portland cement with additions of calcium sulfoaluminates. Cem. Concr. Res. 2013, 43, 81–94. [Google Scholar] [CrossRef]
  14. Trauchessec, R.; Mechling, J.; Lecomte, A.; Roux, A.; Rolland, B. Le Hydration of ordinary Portland cement and calcium sulfoaluminate cement blends. Cem. Concr. Compos. 2015, 56, 106–114. [Google Scholar] [CrossRef]
  15. Zhang, J.; Li, G.; Yang, X.; Ren, S.; Song, Z. Study on a high strength ternary blend containing calcium sulfoaluminate cement/calcium aluminate cement/ordinary Portland cement. Constr. Build. Mater. 2018, 191, 544–553. [Google Scholar] [CrossRef]
  16. Sánchez-Herrero, M.J.; Fernández-Jiménez, A.; Palomo, A. C4A3Š hydration in different alkaline media. Cem. Concr. Res. 2013, 46, 41–49. [Google Scholar] [CrossRef]
  17. Tambara, L.U.D., Jr.; Cheriaf, M.; Rocha, J.C.; Palomo, A.; Fernandez-Jimenez, A. Effect of alkalis content on calcium sulfoaluminate (CSA) cement hydration. Cem. Concr. Res. 2020, 128, 105953. [Google Scholar] [CrossRef]
  18. Fernández-Jiménez, A.; Sobrados, I.; Sanz, J.; Palomo, A. Hybrid cements with very low OPC content Alkaline activation of metakaolin-slag-clinker blends. In Proceedings of the 13th International Congress on the Chemistry of Cement, Madrid, Spain, 3–8 July 2011. [Google Scholar]
  19. Garcia-Lodeiro, I.; Boudissa, N.; Fernandez-Jimenez, A.; Palomo, A. Use of clays in alkaline hybrid cement preparation. The role of bentonites. Mater. Lett. 2018, 233, 134–137. [Google Scholar] [CrossRef]
  20. García-Lodeiro, I.; Fernández-Jiménez, A.; Palomo, A. Variation in hybrid cements over time. Alkaline activation of fly ash-portland cement blends. Cem. Concr. Res. 2013, 52, 112–122. [Google Scholar] [CrossRef]
  21. Joseph, S.; Snellings, R.; Cizer, Ö. Activation of Portland cement blended with high volume of fly ash using Na2SO4. Cem. Concr. Compos. 2019, 104, 103417. [Google Scholar] [CrossRef]
  22. Donatello, S.; Fernández-Jimenez, A.; Palomo, A. Very high volume fly ash cements. Early age hydration study using Na2SO4 as an activator. J. Am. Ceram. Soc. 2013, 96, 900–906. [Google Scholar] [CrossRef]
  23. Wolf, J.J.; Jansen, D.; Neubauer, J. Impact of varying Li2CO3 additions on the hydration of ternary CSA-OPC- anhydrite mixes. Cem. Concr. Res. 2020, 131, 106015. [Google Scholar] [CrossRef]
  24. Ding, J.; Fu, Y.; Beaudoln, J.J. Strätlingite formation in high alumina cement - silica fume systems: Significance of sodium ions. Cem. Concr. Res. 1995, 25, 1311–1319. [Google Scholar] [CrossRef]
  25. Zhang, Y.; Chang, J.; Zhao, J.; Fang, Y. Nanostructural characterization of Al(OH)3 formed during the hydration of calcium sulfoaluminate cement. J. Am. Ceram. Soc. 2018, 101, 4262–4274. [Google Scholar] [CrossRef]
  26. Van der Marel, H.M.; Beutelspacher, H. Atlas of Infrared Spectroscopy of Clay Minerals and their Admixtures; Elsevier Science Publish, Co.: Amsterdam, The Netherlands, 1976. [Google Scholar]
  27. Chukanov, N.V. Infrared Spectra of Mineral Species; Springer: Dordrecht, The Netherlands, 2014; Volume 1, ISBN 978-94-007-7127-7. [Google Scholar]
  28. Myneni, S.C.B.; Traina, S.J.; Waychunas, G.A.; Logan, T.J. Vibrational spectroscopy of functional group chemistry and arsenate coordination in ettringite. Geochim. Cosmochim. Acta 1998, 62, 3499–3514. [Google Scholar] [CrossRef]
  29. El-Alfi, E.A.; Gado, R.A. Preparation of calcium sulfoaluminate-belite cement from marble sludge waste. Constr. Build. Mater. 2016, 113, 764–772. [Google Scholar] [CrossRef]
  30. Vázquez-Moreno, T.; Blanco-Varela, M.T. Tabla de frecuencias y espectros de absorción infrarroja de compuestos relacionados con la química del cemento. Mater. Constr. 1981, 31, 31–48. [Google Scholar] [CrossRef] [Green Version]
  31. Baltakys, K.; Jauberthie, R.; Siauciunas, R.; Kaminskas, R. Influence of modification of SiO2 on the formation of calcium silicate hydrate. Mater. Sci. 2007, 25, 663–670. [Google Scholar]
  32. Huang, C.K.; Kerr, P.F. The Infrared Study of the Carbonate Minerals. Am. Mineral. 1960, 45, 311–324. [Google Scholar]
  33. Okoronkwo, M.U.; Glasser, F.P. Strätlingite: Compatibility with sulfate and carbonate Stra cement phases. Mater. Struct. 2016, 49, 3569–3577. [Google Scholar] [CrossRef] [Green Version]
  34. Gastaldi, D.; Paul, G.; Marchese, L.; Irico, S.; Boccaleri, E.; Mutke, S.; Buzzi, L.; Canonico, F. Hydration products in sulfoaluminate cements: Evaluation of amorphous phases by XRD/solid-state NMR. Cem. Concr. Res. 2016, 90, 162–173. [Google Scholar] [CrossRef]
  35. Rayment, D.L.; Majumdar, A.J. Microanalysis of high-alumina cement clinker and hydrated HAC/SLAG mixtures. Cem. Concr. Res. 1994, 24, 335–342. [Google Scholar] [CrossRef]
  36. Morey, G.W.; Fournier, R.; Rowe, J.J. The Solubility of Amorphous Silica at 25 °C. J. Geophys. Res. 1964, 69, 1995–2002. [Google Scholar] [CrossRef]
  37. Hargis, C.W.; Kirchheim, A.P.; Monteiro, P.J.M.; Gartner, E.M. Early age hydration of calcium sulfoaluminate (synthetic ye’elimite, C 4A3S) in the presence of gypsum and varying amounts of calcium hydroxide. Cem. Concr. Res. 2013, 48, 105–115. [Google Scholar] [CrossRef]
  38. Jansen, D.; Spies, A.; Neubauer, J.; Ectors, D.; Goetz-Neunhoeffer, F. Studies on the early hydration of two modifications of ye’elimite with gypsum. Cem. Concr. Res. 2017, 91, 106–116. [Google Scholar] [CrossRef]
  39. Hossack, A.M.; Thomas, M.D.A. The effect of temperature on the rate of sulfate attack of Portland cement blended mortars in Na2SO4 solution. Cem. Concr. Res. 2015, 73, 136–142. [Google Scholar] [CrossRef]
  40. Steiger, M.; Asmussen, S. Crystallization of sodium sulfate phases in porous materials: The phase diagram Na2SO4–H2O and the generation of stress. Geochim. Cosmochim. Acta 2008, 72, 4291–4306. [Google Scholar] [CrossRef]
  41. Criado, M.; Jiménez, A.F.; Palomo, A. Effect of sodium sulfate on the alkali activation of fly ash. Cem. Concr. Compos. 2010, 32, 589–594. [Google Scholar] [CrossRef]
  42. Irassar, E.F.; Bonavetti, V.L.; González, M. Microstructural study of sulfate attack on ordinary and limestone Portland cements at ambient temperature. Cem. Concr. Res. 2003, 33, 31–41. [Google Scholar] [CrossRef]
  43. Gu, Y.; Martin, R.P.; Omikrine Metalssi, O.; Fen-Chong, T.; Dangla, P. Pore size analyses of cement paste exposed to external sulfate attack and delayed ettringite formation. Cem. Concr. Res. 2019, 123, 1–11. [Google Scholar] [CrossRef]
  44. Grounds, T.; Midgley, H.G.; Novell, D.V. Carbonation of ettringite by atmospheric carbon dioxide. Thermochim. Acta 1988, 135, 347–352. [Google Scholar] [CrossRef]
  45. Damidot, D.; Atkins, M.; Kindness, A.; Glasser, F.P.; Walk, M. Sulphate attack on concrete: Limits of the AFt stability domain. Cem. Concr. Res. 1992, 22, 229–234. [Google Scholar] [CrossRef]
  46. Liu, Z.; Hu, W.; Pei, M.; Deng, D. The role of carbonation in the occurrence of MgSO4 crystallization distress on concrete. Constr. Build. Mater. 2018, 192, 167–178. [Google Scholar] [CrossRef]
  47. Tsui, N.; Flatt, R.J.; Scherer, G.W. Crystallization damage by sodium sulfate. J. Cult. Herit. 2003, 4, 109–115. [Google Scholar] [CrossRef]
  48. Ndiaye, K.; Cyr, M.; Ginestet, S. Durability and stability of an ettringite-based material for thermal energy storage at low temperature. Cem. Concr. Res. 2017, 99, 106–115. [Google Scholar] [CrossRef]
  49. Sánchez-Herrero, M.J.; Fernández-Jiménez, A.; Palomo, A. C3S and C2S hydration in the presence of Na2CO3 and Na2SO4. J. Am. Ceram. Soc. 2017, 100, 3188–3198. [Google Scholar] [CrossRef]
  50. Janotka, I. Hydration of the cement paste with Na2CO3 addition. Ceram. Silik. 2001, 45, 16–23. [Google Scholar]
  51. Fernandez-Jimenez, A.; Puertas, F.; Arteaga, A. Determination of kinetic equations of alkaline activation of blast furnace slag by means of calorimetric data. J. Therm. Anaysis 1998, 52, 945–955. [Google Scholar] [CrossRef]
  52. Bernal, S.A.; Provis, J.L.; Myers, R.J.; San Nicolas, R.; van Deventer, J.S.J. Role of carbonates in the chemical evolution of sodium carbonate-activated slag binders. Mater. Struct. Constr. 2014, 48, 517–529. [Google Scholar] [CrossRef]
  53. Contreras, M.; Pérez-López, R.; Gázquez, M.J.; Morales-Flórez, V.; Santos, A.; Esquivias, L.; Bolívar, J.P. Fractionation and fluxes of metals and radionuclides during the recycling process of phosphogypsum wastes applied to mineral CO2 sequestration. Waste Manag. 2014, 45, 412–419. [Google Scholar] [CrossRef] [PubMed] [Green Version]
  54. Fernández-Jiménez, A.; Vázquez, T.; Palomo, A. Effect of sodium silicate on calcium aluminate cement hydration in highly alkaline media: A microstructural characterization. J. Am. Ceram. Soc. 2011, 94, 1297–1303. [Google Scholar] [CrossRef]
  55. Bentsen, S.; Seltveit, A.; Sanderg, B. Effect of Microsilica on Conversion High Alumina Cement. In Calcium Aluminates Cements; Mangabhai, R.J., Ed.; E. & FN. SPON: London, UK, 1990; pp. 294–319. [Google Scholar]
  56. Ding, J.; Fu, Y.; Beaudoin, J.J. Study of hydation mechanisms in the high alumina cement—sodium silicate system. Cem. Concr. Res. 1996, 26, 799–804. [Google Scholar] [CrossRef]
  57. Koga, G.Y.; Albert, B.; Nogueira, R.P. On the hydration of Belite-Ye’elimite-Ferrite (BYF) cement pastes: Effect of the water-to-cement ratio and presence of fly ash. Cem. Concr. Res. 2020, 137, 106215. [Google Scholar] [CrossRef]
  58. Coelho, A.A. Topas’ Academic, version 6’ Technical Reference. Coelho Softw. 2016, 6, 208. [Google Scholar]
  59. BS EN 196-3:2016 Methods of Testing Cement. Determination of Setting Times and Soundness; BSI: London, UK, 2016.
  60. Kantro, D.L. Influence of water-reducing admixtures on properties of cement paste—A miniature slump test. Cem. Concr. Aggreg. 1980, 2, 95–102. [Google Scholar]
  61. Koch, A.; Steinegger, H. A fast-track procedure for evaluating cements on their behavior in sulfate attack. Zement-Kalk-Gips 1960, 13, 317–324. [Google Scholar]
  62. BS EN 196-1:2016 Methods of Testing Cement. Determination of Strength; BSI: London, UK, 2016.
  63. Zhang, J.; Scherer, G.W. Comparison of methods for arresting hydration of cement. Cem. Concr. Res. 2011, 41, 1024–1036. [Google Scholar] [CrossRef]
  64. Criado, M.; Fernández-Jiménez, A.; Palomo, A. Alkali Activation of fly ash: Effect of the SiO2/Na2O ratio Part I: FTIR study. Microporous Mesoporous Mater. 2007, 106, 180–191. [Google Scholar] [CrossRef]
  65. ASTM C1702-17. Standard Test Method for Measurement of Heat of Hydration of Hydraulic Cementitious Materials Using Isothermal Conduction Calorimetry; ASTM International: West Conshohocken, PA, USA, 2009. [Google Scholar]
Figure 1. (a) Heat flow and (b) total heat released and detail of heat flow curve.
Molecules 26 01938 g001
Figure 2. (a) Compressive strength and (b) setting times for 2-, 28-, and 90-d pastes.
Molecules 26 01938 g002
Figure 3. 1—Full diffractograms; 2—detail of patterns across 2θ 16° to 22° for anhydrous calcium sulfoaluminate cement (CSA) and pastes: (a) reference (REF); (b) 5% Na2SO4 (5NS); (c) 5NC; (d) sodium silicate (5NSi); legend: A—anhydrite; Y—ye’elimite; E—ettringite; B—belite, bredigite; T—thenardite; C—calcite; G—gypsum; AH3—aluminum hydroxide; S—strätlingite (C2ASH8).
Molecules 26 01938 g003
Figure 4. Two-day, 28-d and 90-d Fourier transform infrared spectroscopy, (FTIR) spectra for REF, 5NS, 5NC, and 5NSi pastes; legend: red line—AH3, black line—ettringite, green line—calcite, blue line: thenardite, orange line—strätlingite.
Molecules 26 01938 g004
Figure 5. Deconvoluted 2-, 28-, and 90-d spectra (1350 to 700 cm−1 range) for CSA hydrated with water and alkaline salts; legend: blue: —/ye’elimite; yellow—C$; grey—C2S; green—AH3; violet -ettringite; brown—CaCO3; burgundy—strätlingite; purple—thenardite; lime—C3A, red—cumulative fit.
Molecules 26 01938 g005
Figure 6. Scanning electron microscope (SEM) micrographs (at 1000× and 5000×) of 28-d: (A) REF; (B) 5NS; (C) 5NC; and (D) 5NSi.
Molecules 26 01938 g006
Figure 7. SEM micrographs (at 5000×) of sample 5NS showing: (a) gypsum; (b) thenardite; and (c) AH3.
Molecules 26 01938 g007
Figure 8. SEM micrograph of sample 5NSi showing: (a) porous zones and (b) enlargement of insoluble silicate.
Molecules 26 01938 g008
Figure 9. Phase content found by deconvoluting FTIR spectra for: (a) REF; (b) 5NS; (c) 5NC; and (d) 5NSi.
Molecules 26 01938 g009
Table 1. Isothermal conduction calorimetry parameter values.
Calorimetric ParameterREF5NS5NSi5NC
Tp (h) 11.67; 3.41; 6.102.521.352.87; 6.10
Vp (J/g) 254.02; 103.87;162.8120.374.991.7; 184.27
Heat released (J/g), 90 h305.4301.9299.8293.1
1 Tp: peak time. 2 Vp: maximum peak intensity.
Table 2. FTIR spectrum band positions and areas (in per cent of total) of the reaction products in all systems at all ages analyzed.
REF5NS
0 d2 d28 d90 d0 d2 d28 d90 d
W 1A 2WAWAWAWAWAWAWA
AlO4 stretching 8115.56 8115.56
8450.96 8450.96
-8542.888503.288593.74--8501.598512.298574.21
88019.918807.518804.15 88219.918794.67
CO32− bending - 8771.59 - 8751.28751.86
Al-O-H bending - -
-10252.9510253.32102910.71 -10246.4910226.610267.36
SiO4 asymmetric stretching 91110.429144.789154.719102.5191110.429216.339145.789145.04
9895.469893.649893.49943.159895.469863.059833.019852.81
SO42 asymmetric stretching10480.2 10480.2
110020.94109214.40109013.61108813.23110020.94109210.0710918.3510927.72
-111534.67111449.22111649.34 -111939.36111744.33111642.72
11202.85 11202.85
115019.09114717.98115010.4711498.35115019.09114515.45114217.29114817.88
11754.1111752.6111752.611752.2911754.1111753.11
- - 11551.2311551.93
119010.511898.5811905.2411905.08119010.511909.8811809.7711868.47
5NC5NSi
0 d2 d28 d90 d0 d2 d28 d90 d
WAWAWAWAWAWAWAWA
AlO4 stretching 8115.56 8115.56
8450.96 8450.96
-8503.618503.988594.68 8502.658503.218503.42
88219.918806.128804.948800.64 9652.08
88219.918804.148804.058803.79
CO32 bending 8750.728750.788751.37 8750.338760.818761.04
Al-O-H bending
10251.9310259.28102210.28 10333.0710255.2410255.42
91110.429154.569212.959152.0991110.429164.649224.179223.22
SiO4 asymmetric stretching 9995.469894.389893.549842.589995.469905.249875.29894.15
SO42 asymmetric stretching10480.2 10480.2
110020.94109017.95109110.7110909.66110020.94109011.1710908.8410906.25
-111836.68111844.03111853.18 -111847.42111853.79111857.05
11202.85 11202.85
115019.09115011.58115010.9211457.06115019.0911508.9111507.511507.26
11754.1111751.67 11754.1111752.9
- 11551.11 -
119010.5119010.7911808.8711807.35119010.511809.5311807.1911906.32
Legend:C3AYe’elimiteBeliteAnhydriteThenarditeAH3EttringiteCalciteSträtlingite
1 Wavenumber in cm−1; 2 Area in percentage of total deconvolution.
Table 3. CSA chemical and physical composition and mineralogical phases.
Chemical Composition
OxideCaOAl2O3SO3SiO2MgOFe2O3Na2OSrOK2OOthersLoI 1
(wt.%)41.523.218.368.143.221.050.860.450.441.331.45
Mineralogical Phase
PhaseC4A3$C$C2SC3ABredigiteMgOGehlenite
(wt.%)49.423.014.61.86.42.72.1
Physical PropertyDiameter
Blaine (m2/kg)474.6D10 (μm)1.06
BET (m2/kg)1373D50 (μm)4.12
Density (g/cm3)2.90D90 (μm)11.51
1 Loss on ignition.
Table 4. Material nomenclature and pastes composition.
SampleCSA (wt.%)H2O (wt.%)Solid Activator (wt.%)w/b%Na2O%Anion
Na2SO4Na2CO3Sodium Disilicate ¹
REF10045 0.45--
5NS955 1.512.33
5NC 5 2.021.95
5NSi 50.981.90
1 Silicate sourced from 2SiO2·1Na2O·2H2O.
Publisher’s Note: MDPI stays neutral with regard to jurisdictional claims in published maps and institutional affiliations.

