
Comparative Toxicity of Fly Ash: An In Vitro Study


 ,
,  ,
,  and
and 
Abstract
1. Introduction
2. Results and Discussion
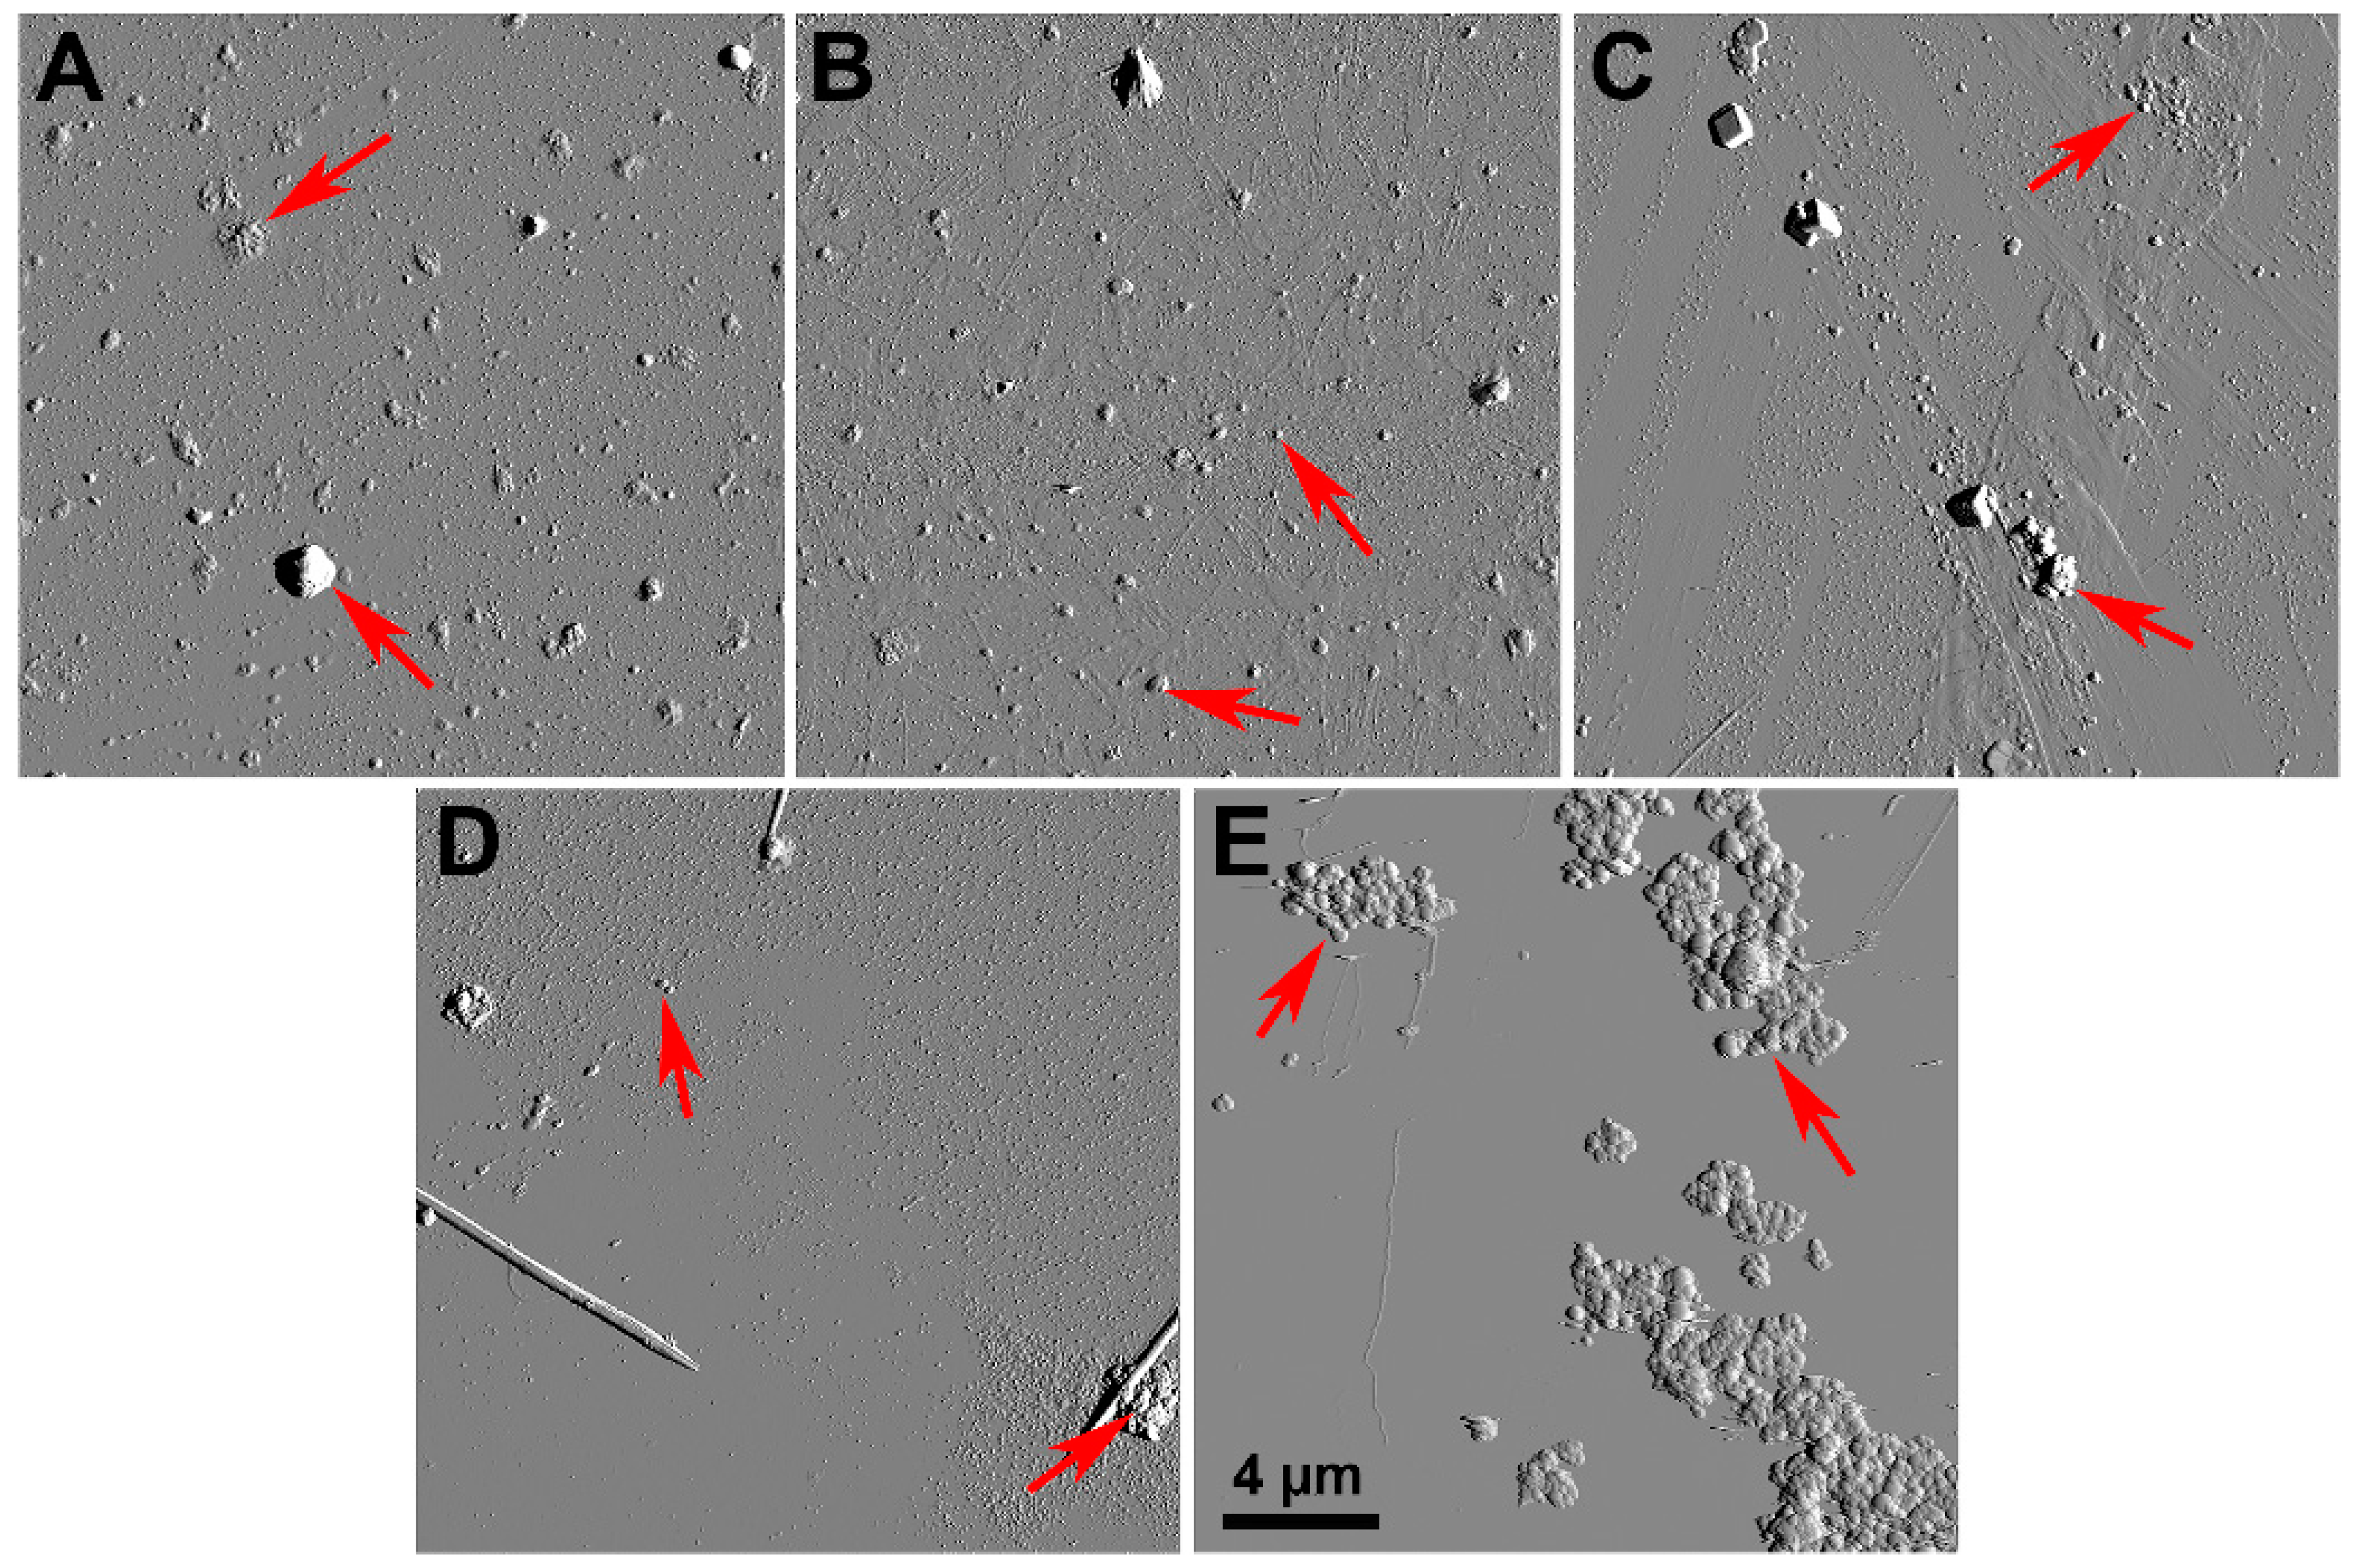
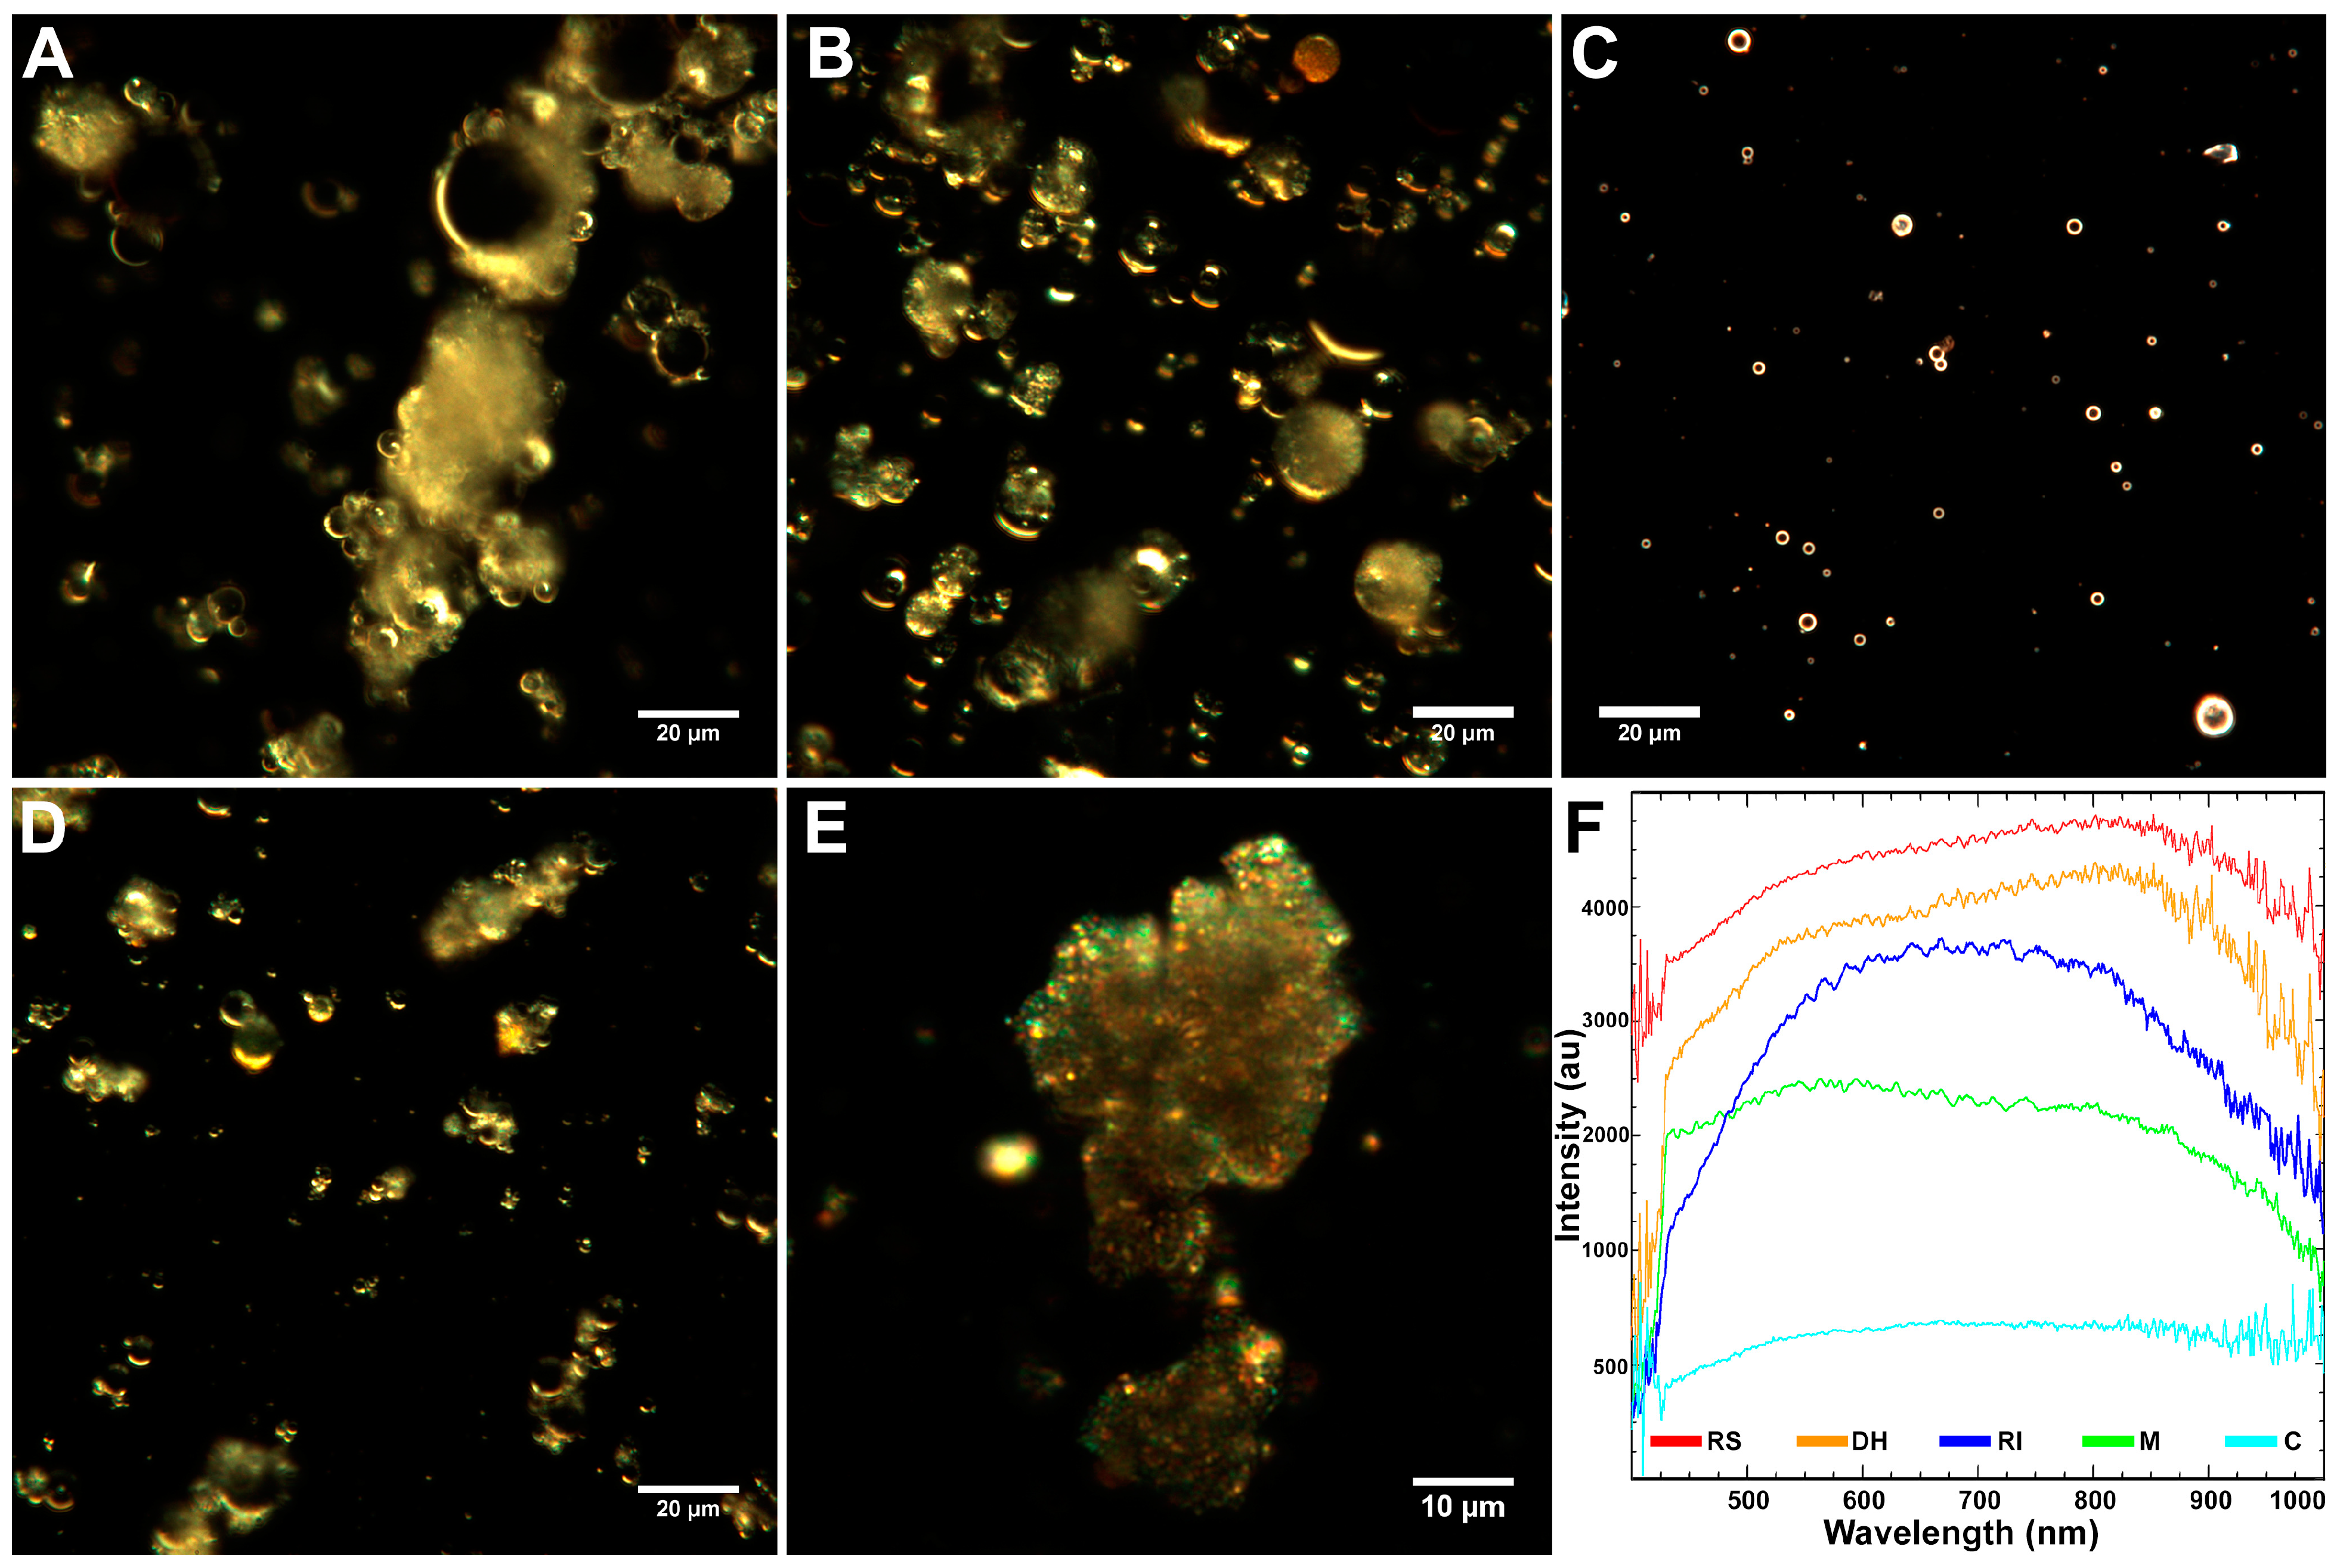
2.1. Characteristics of Coal Fly Ash Particles
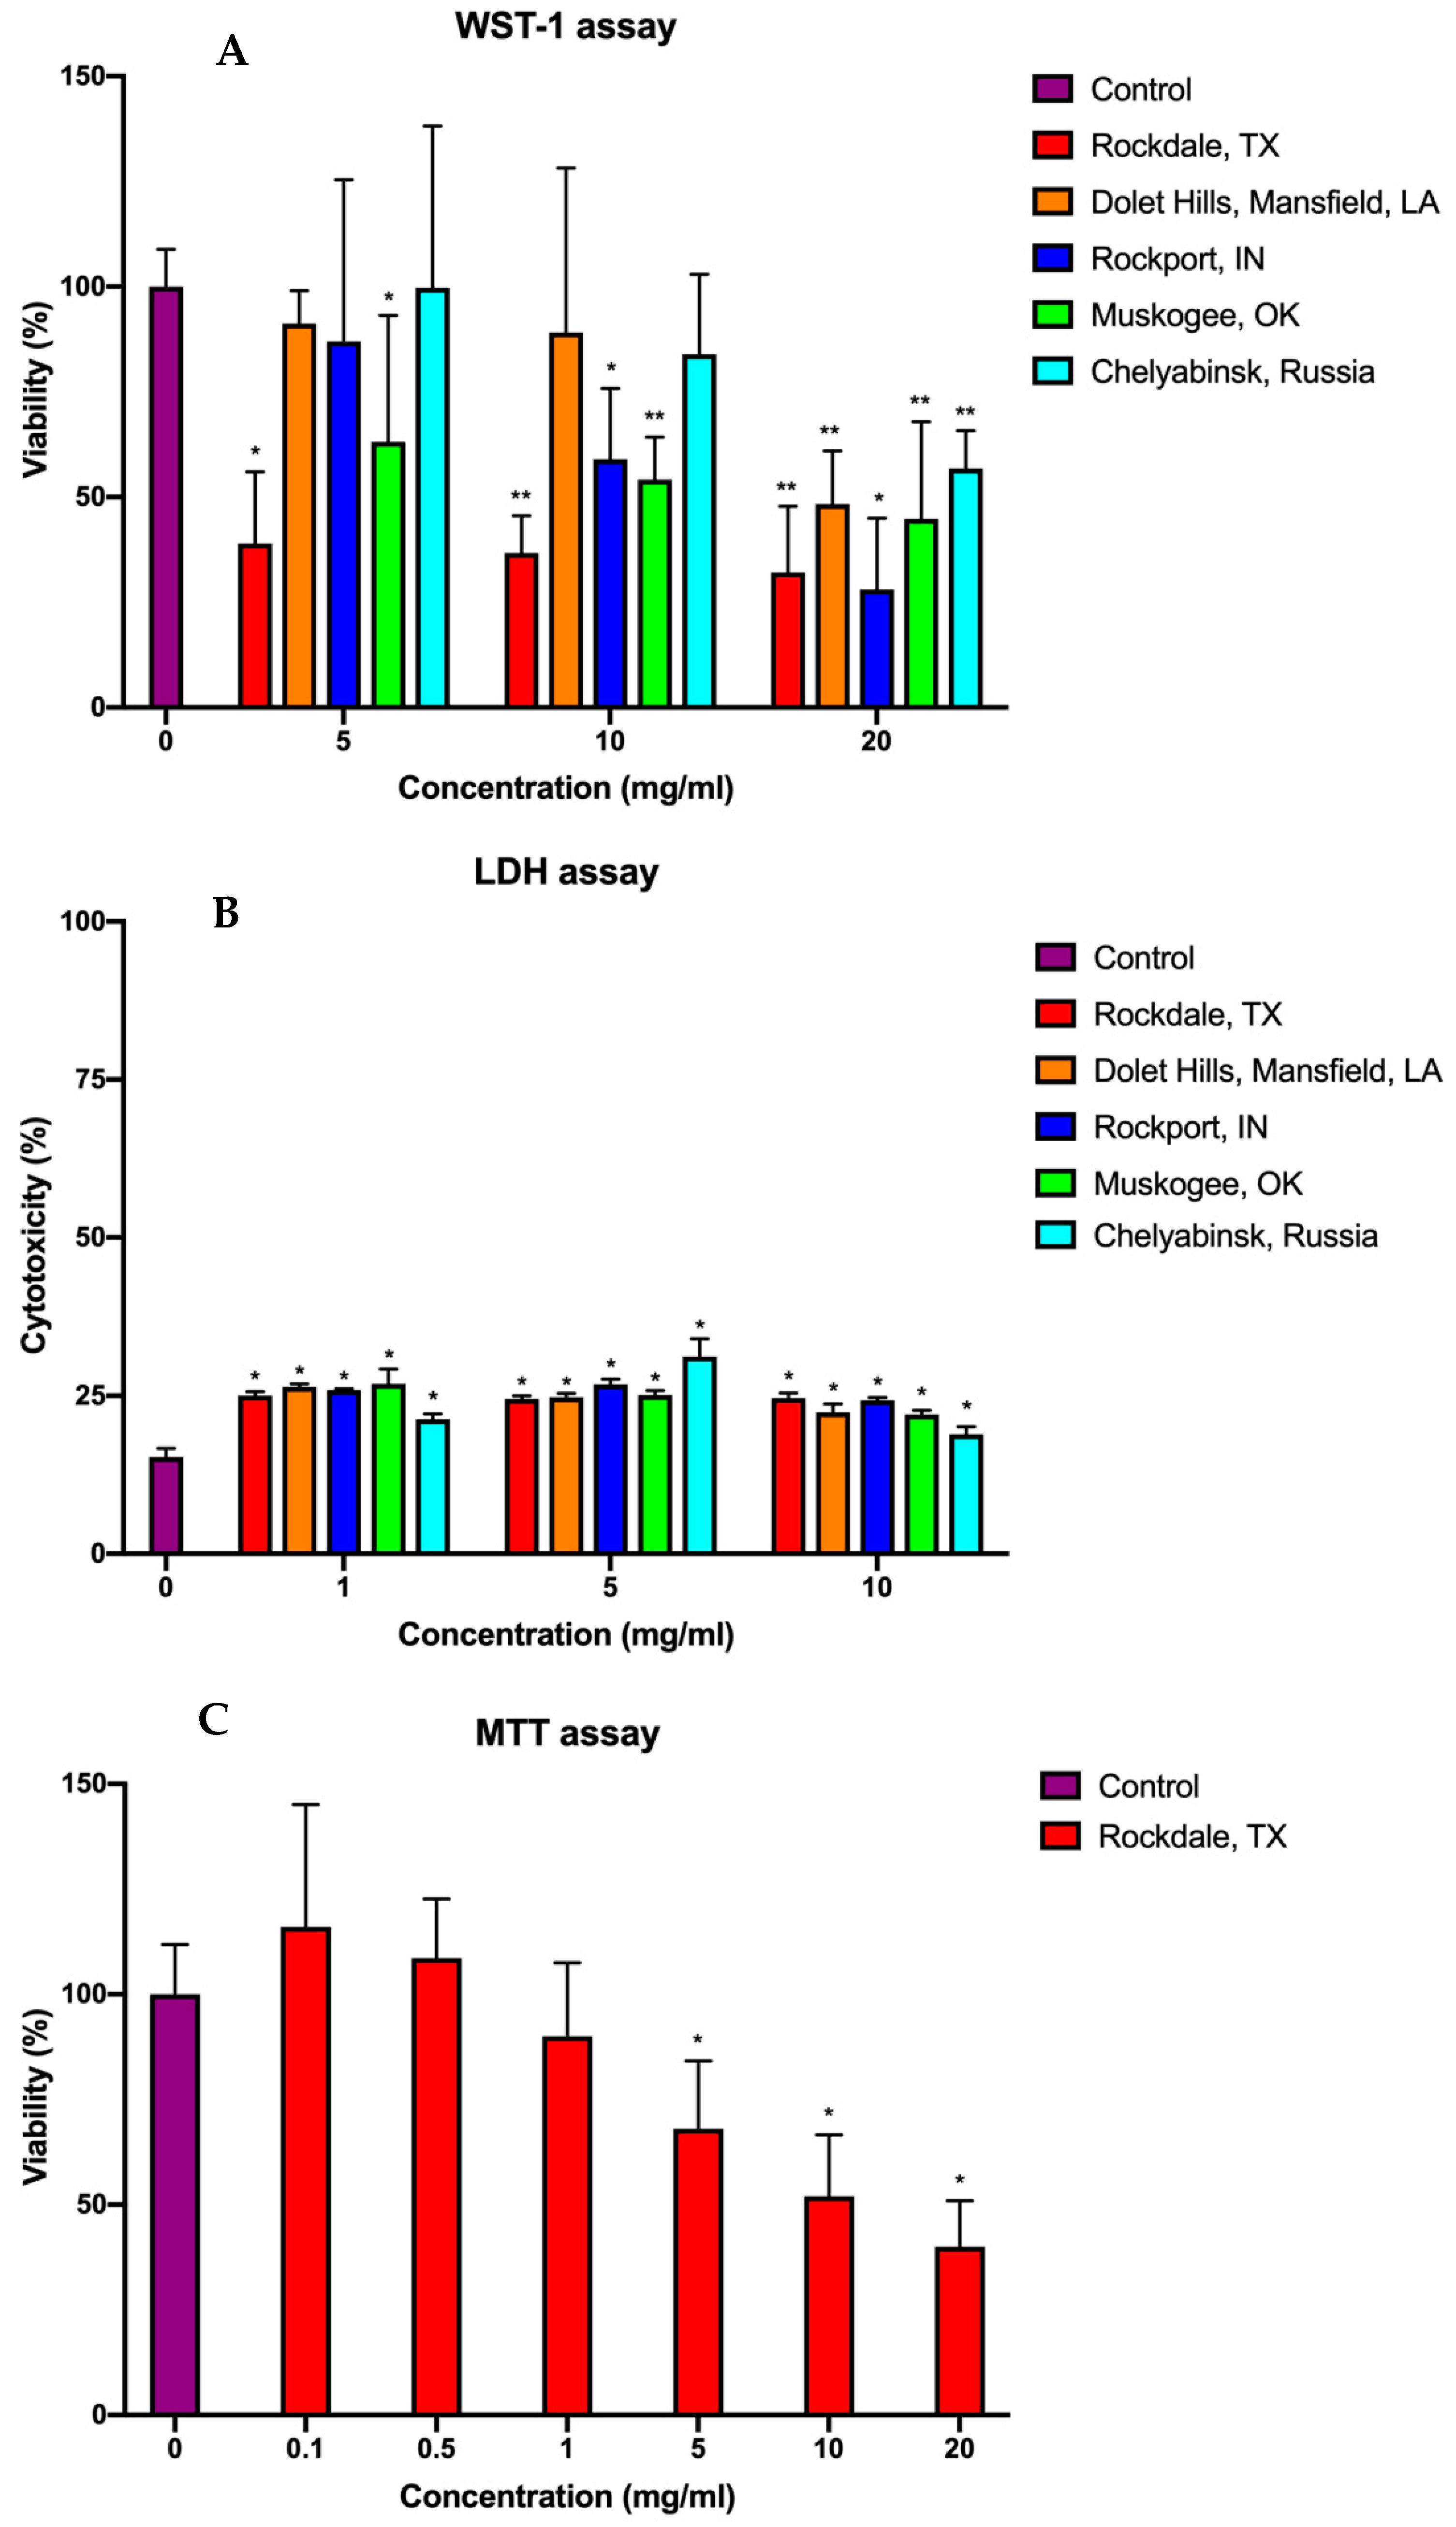
2.2. Cytotoxicity
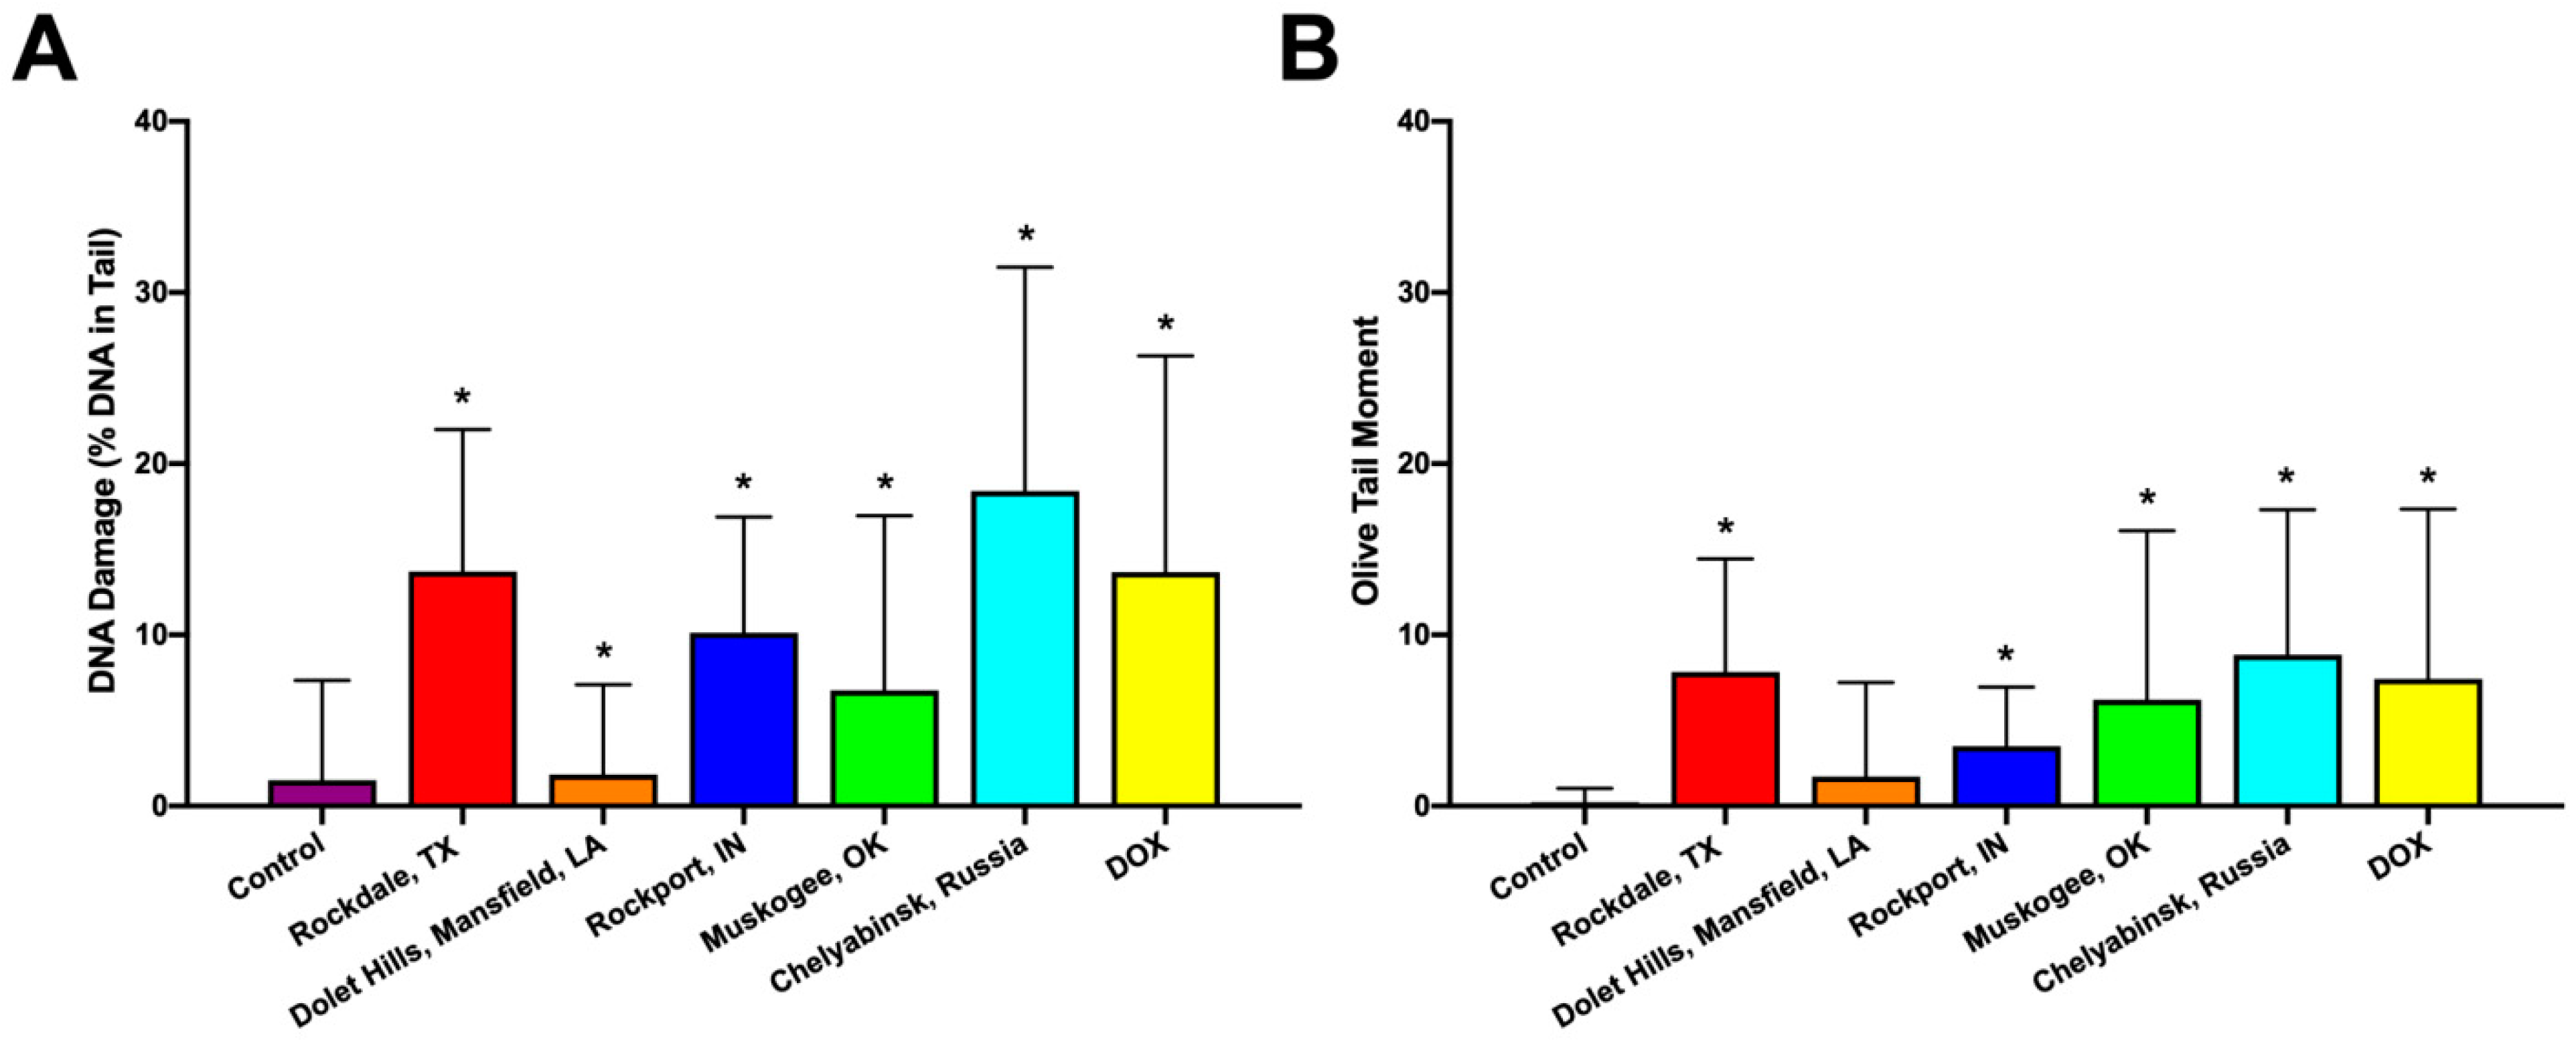
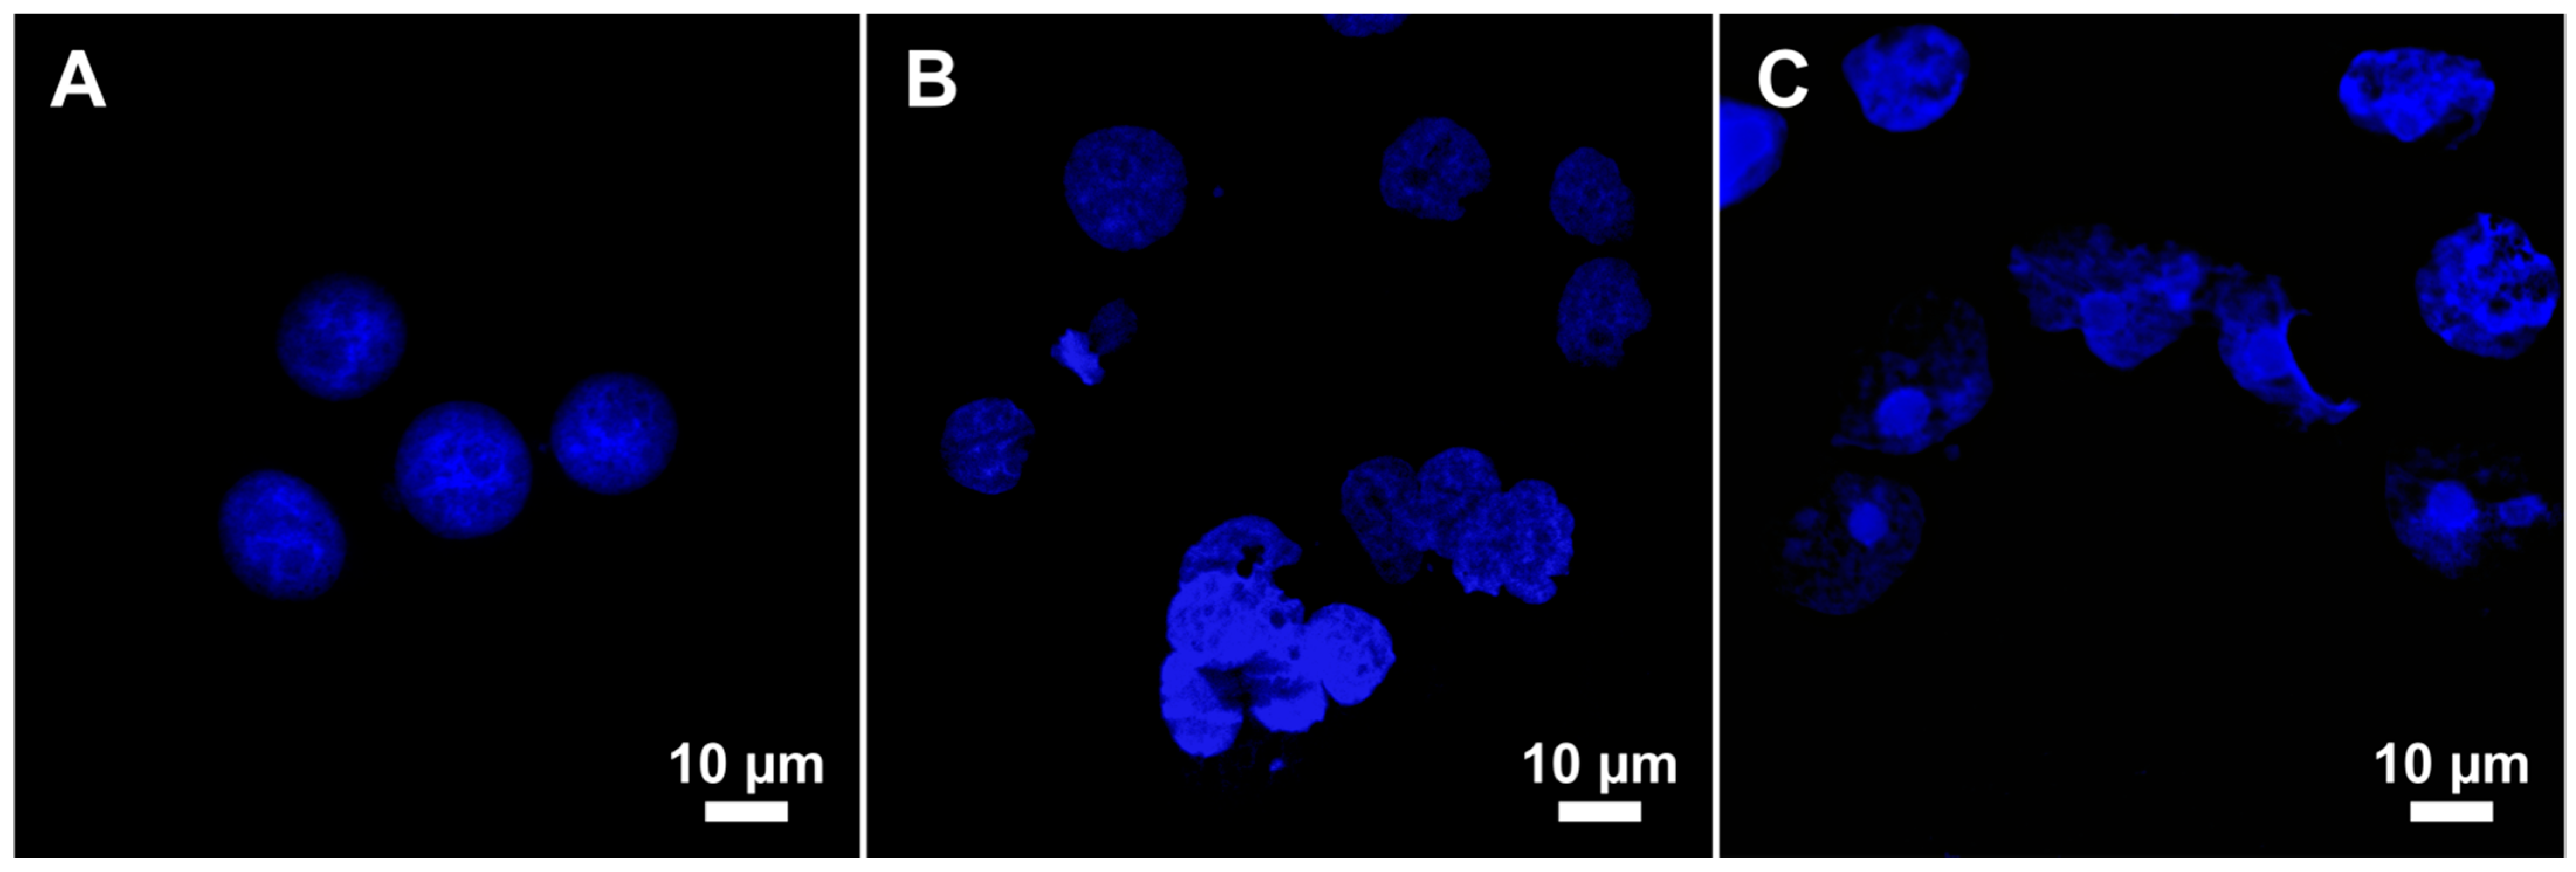
2.3. Genotoxicity
2.4. Flow Cytometry
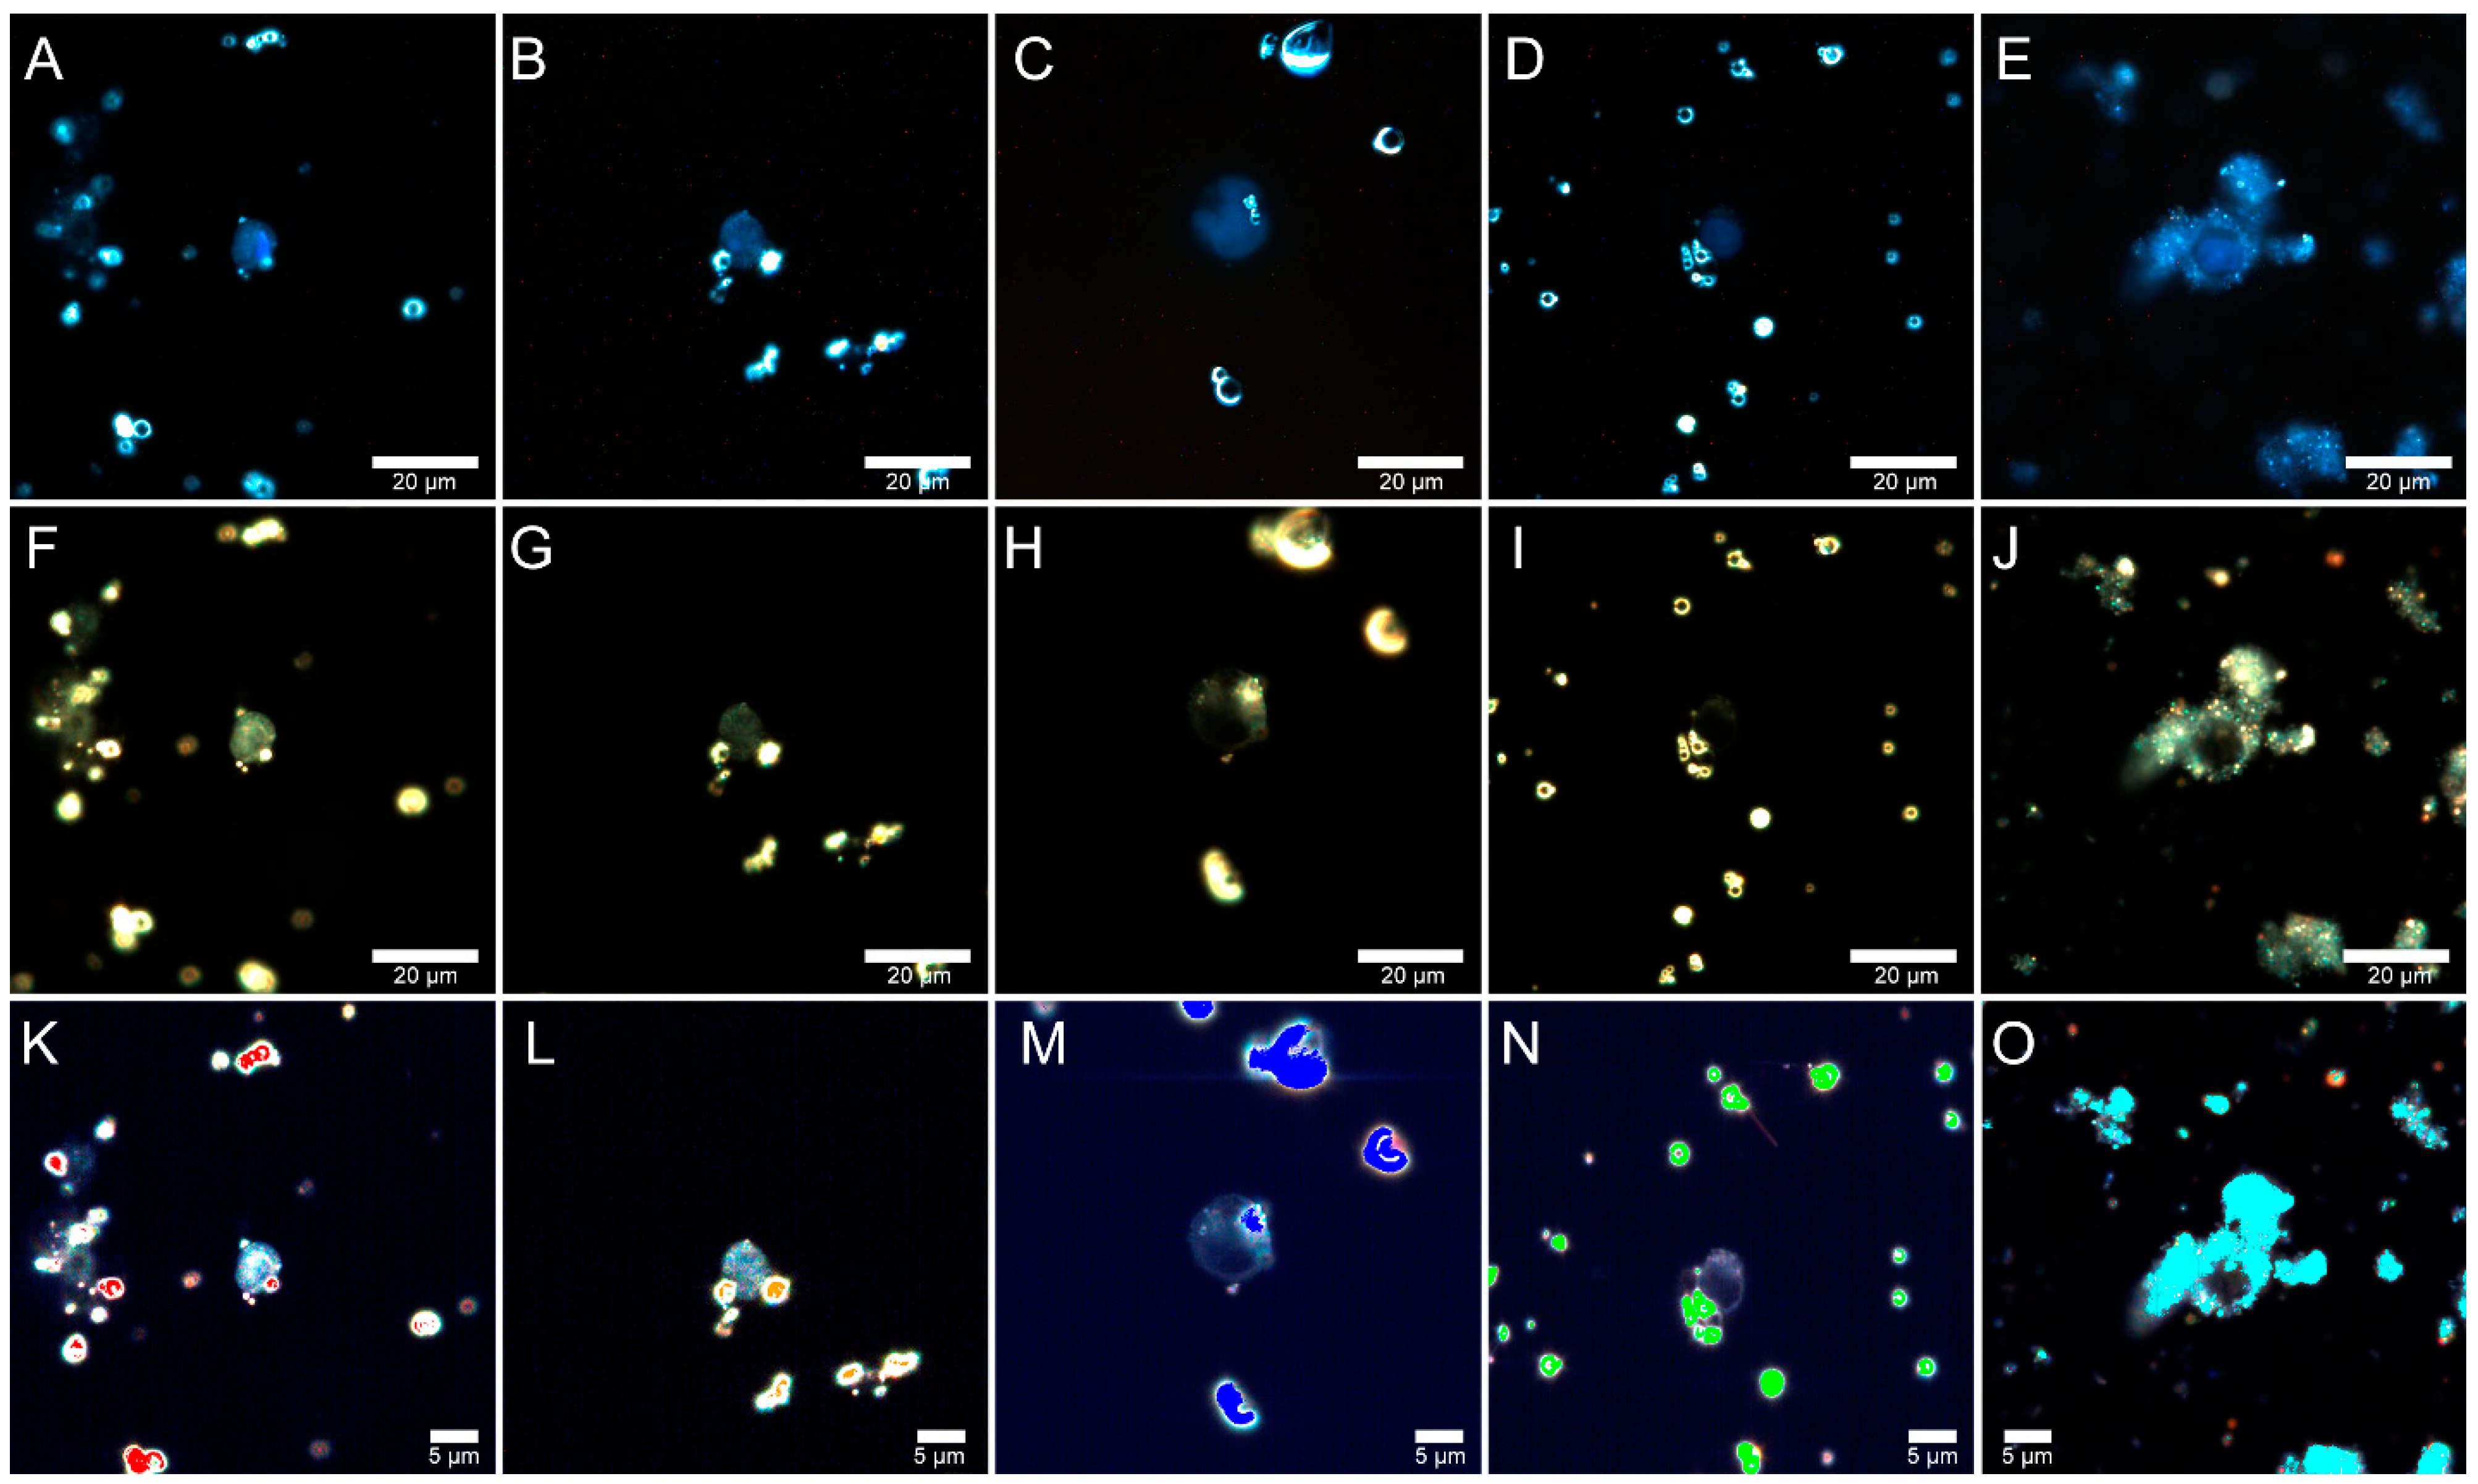
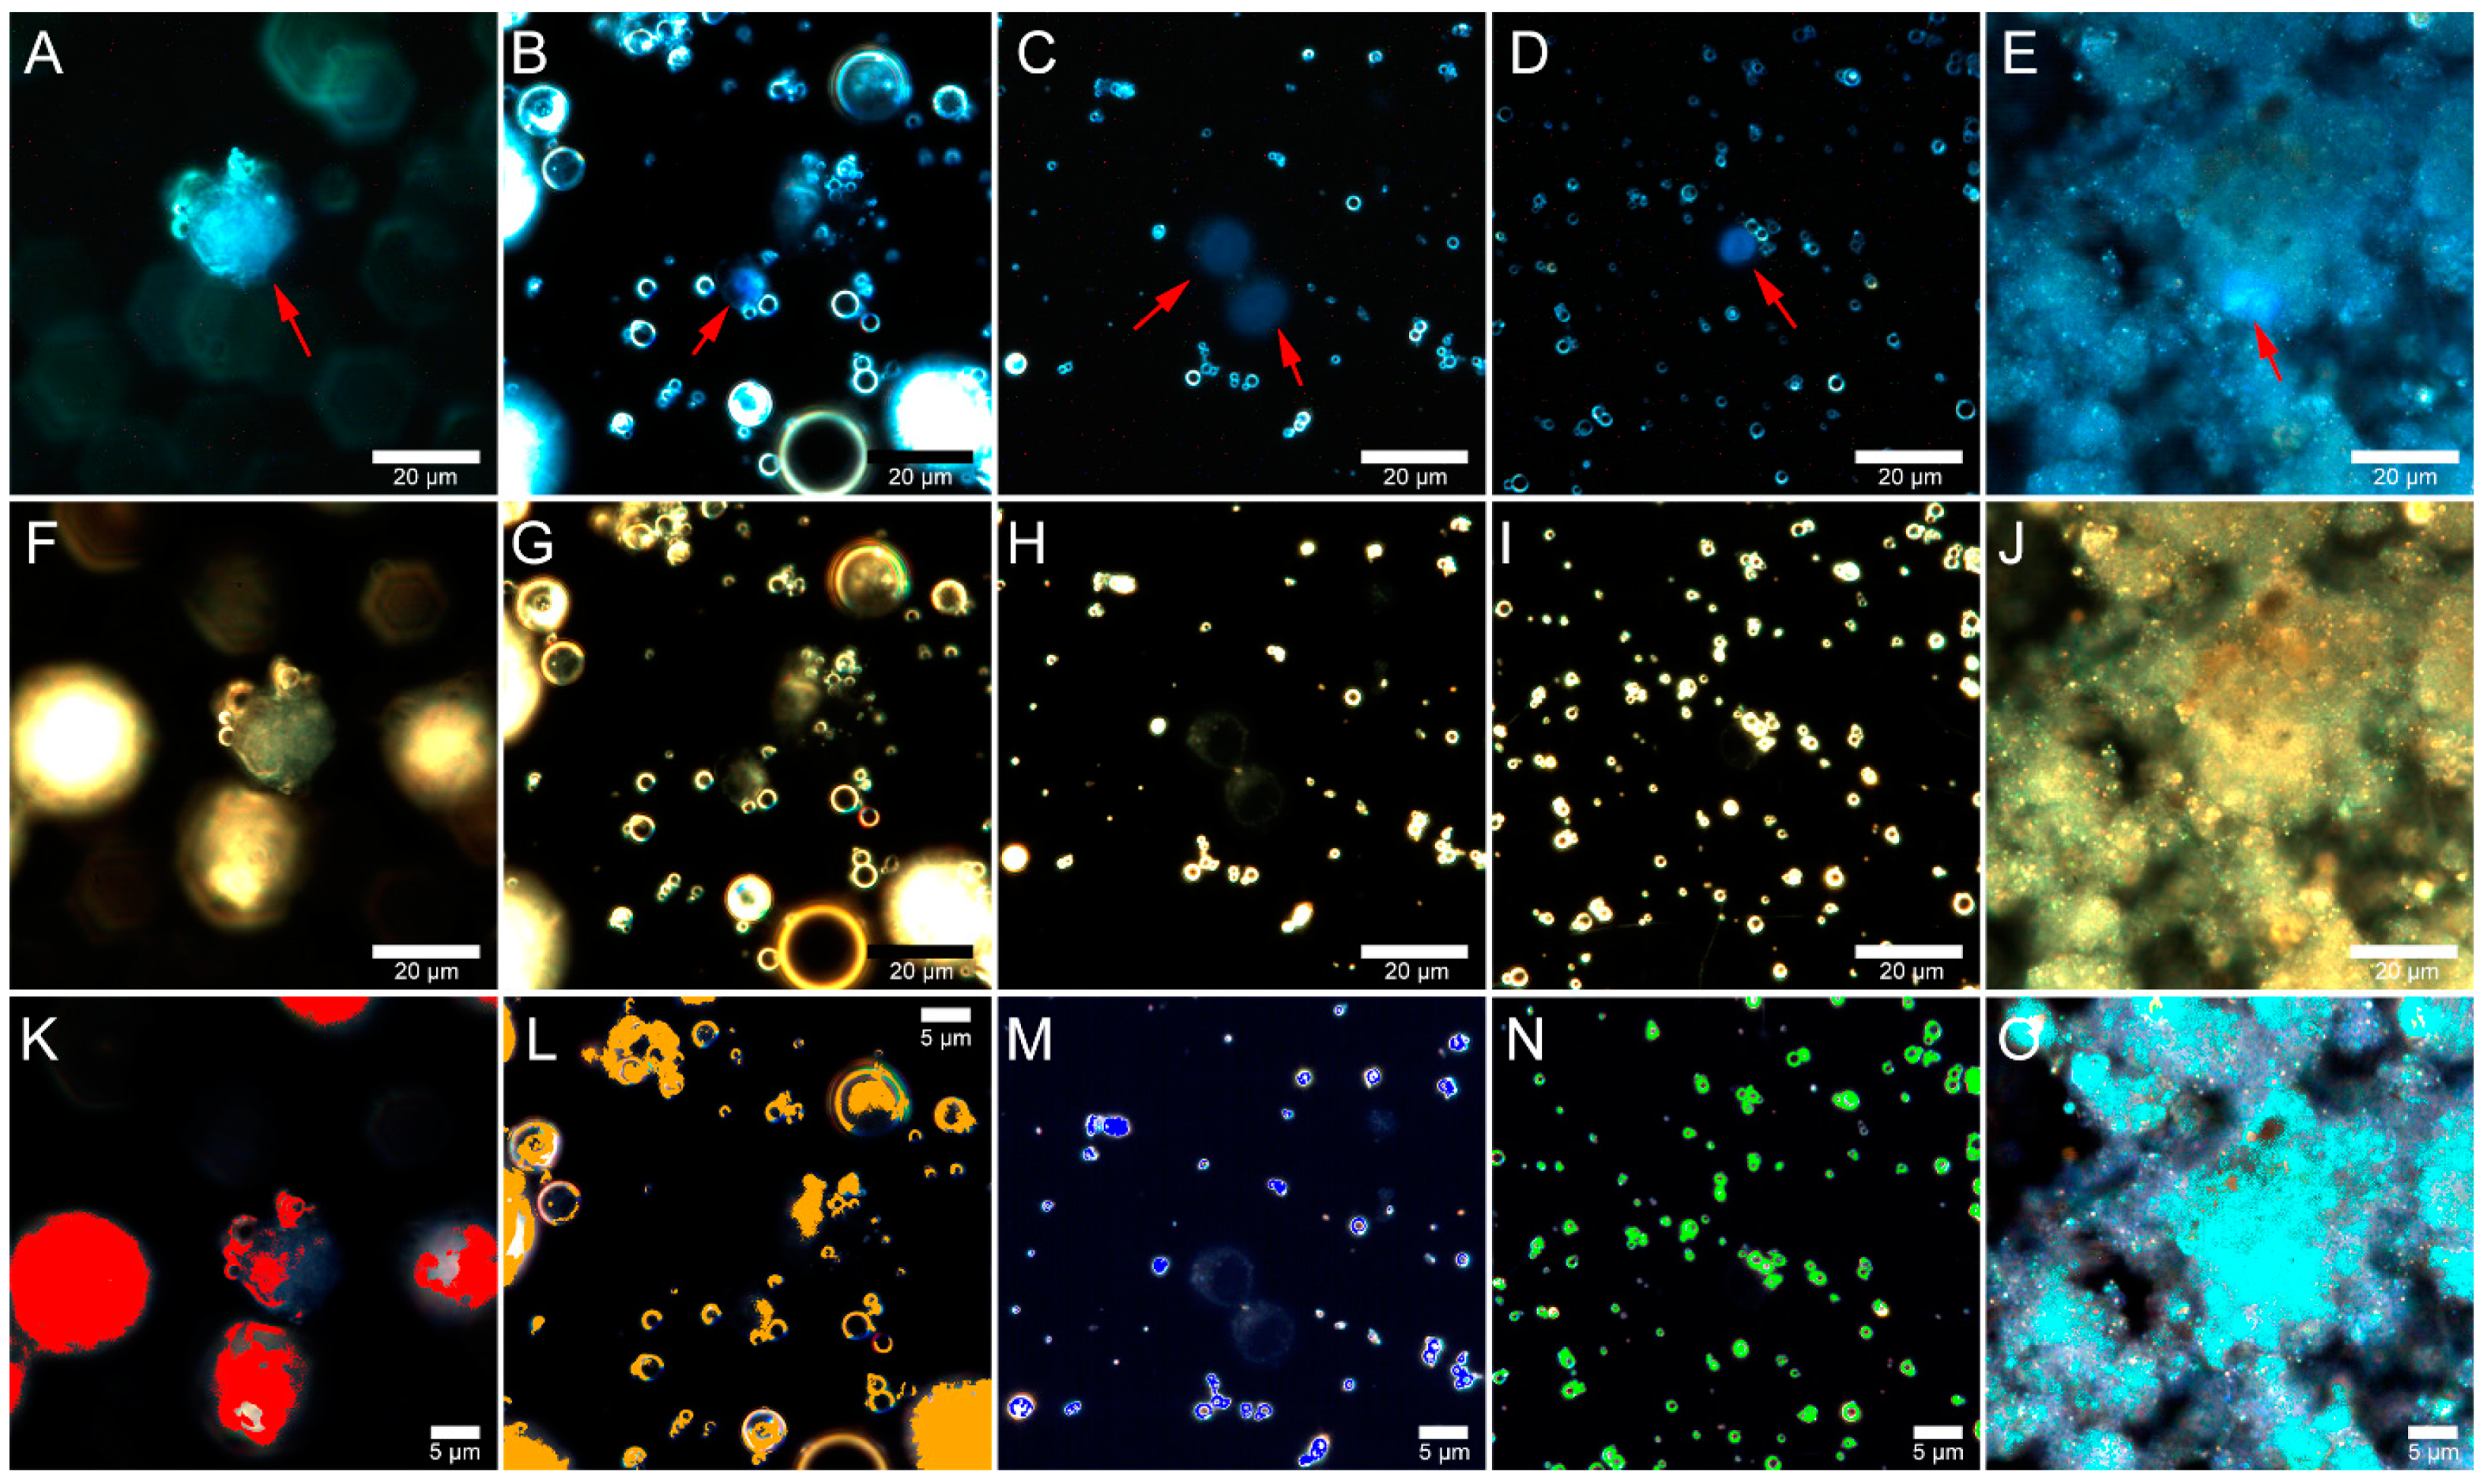
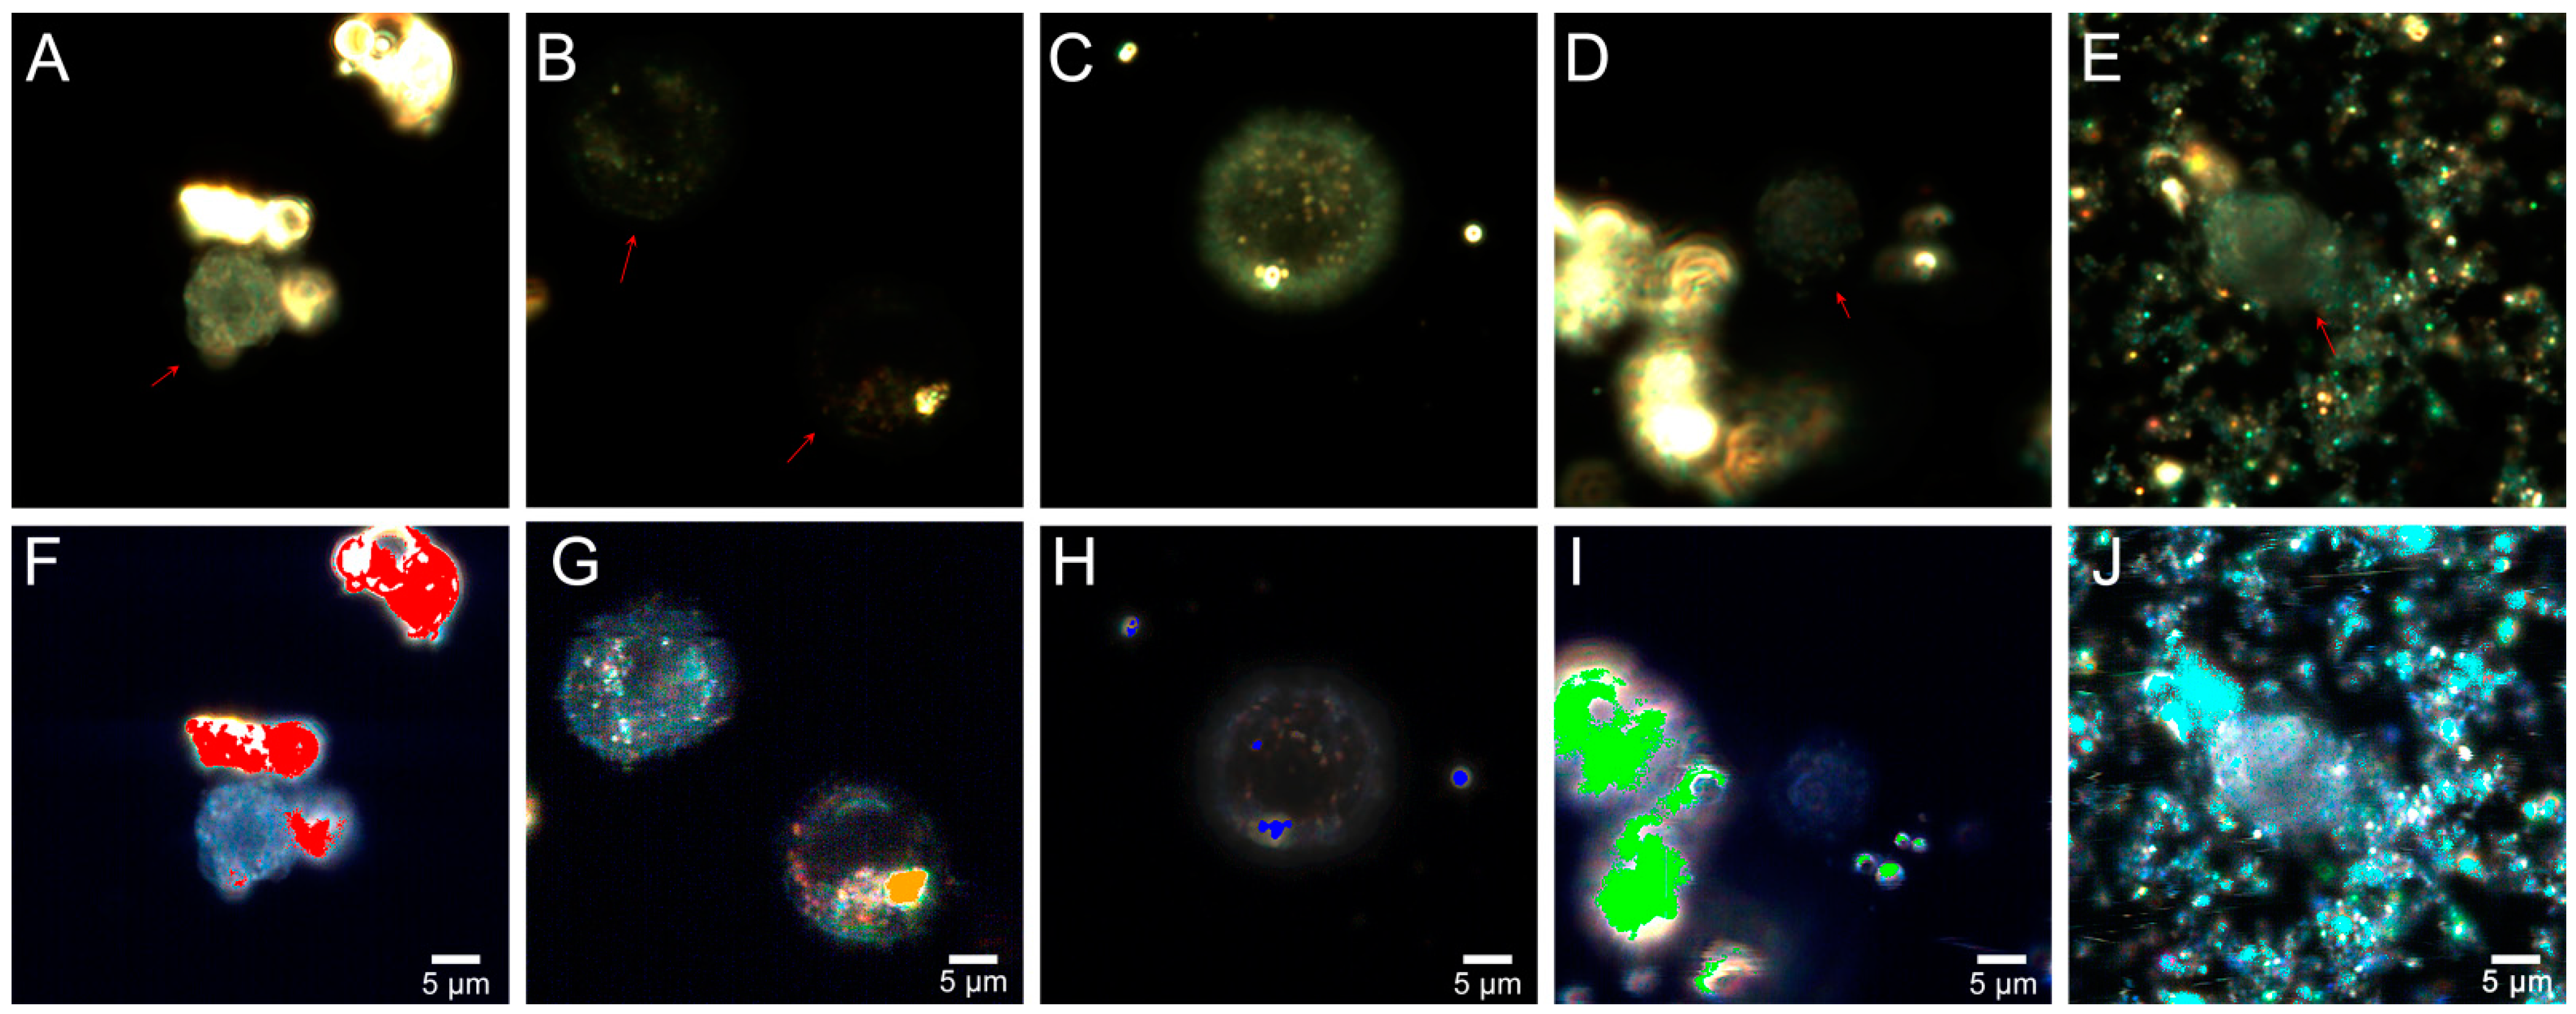
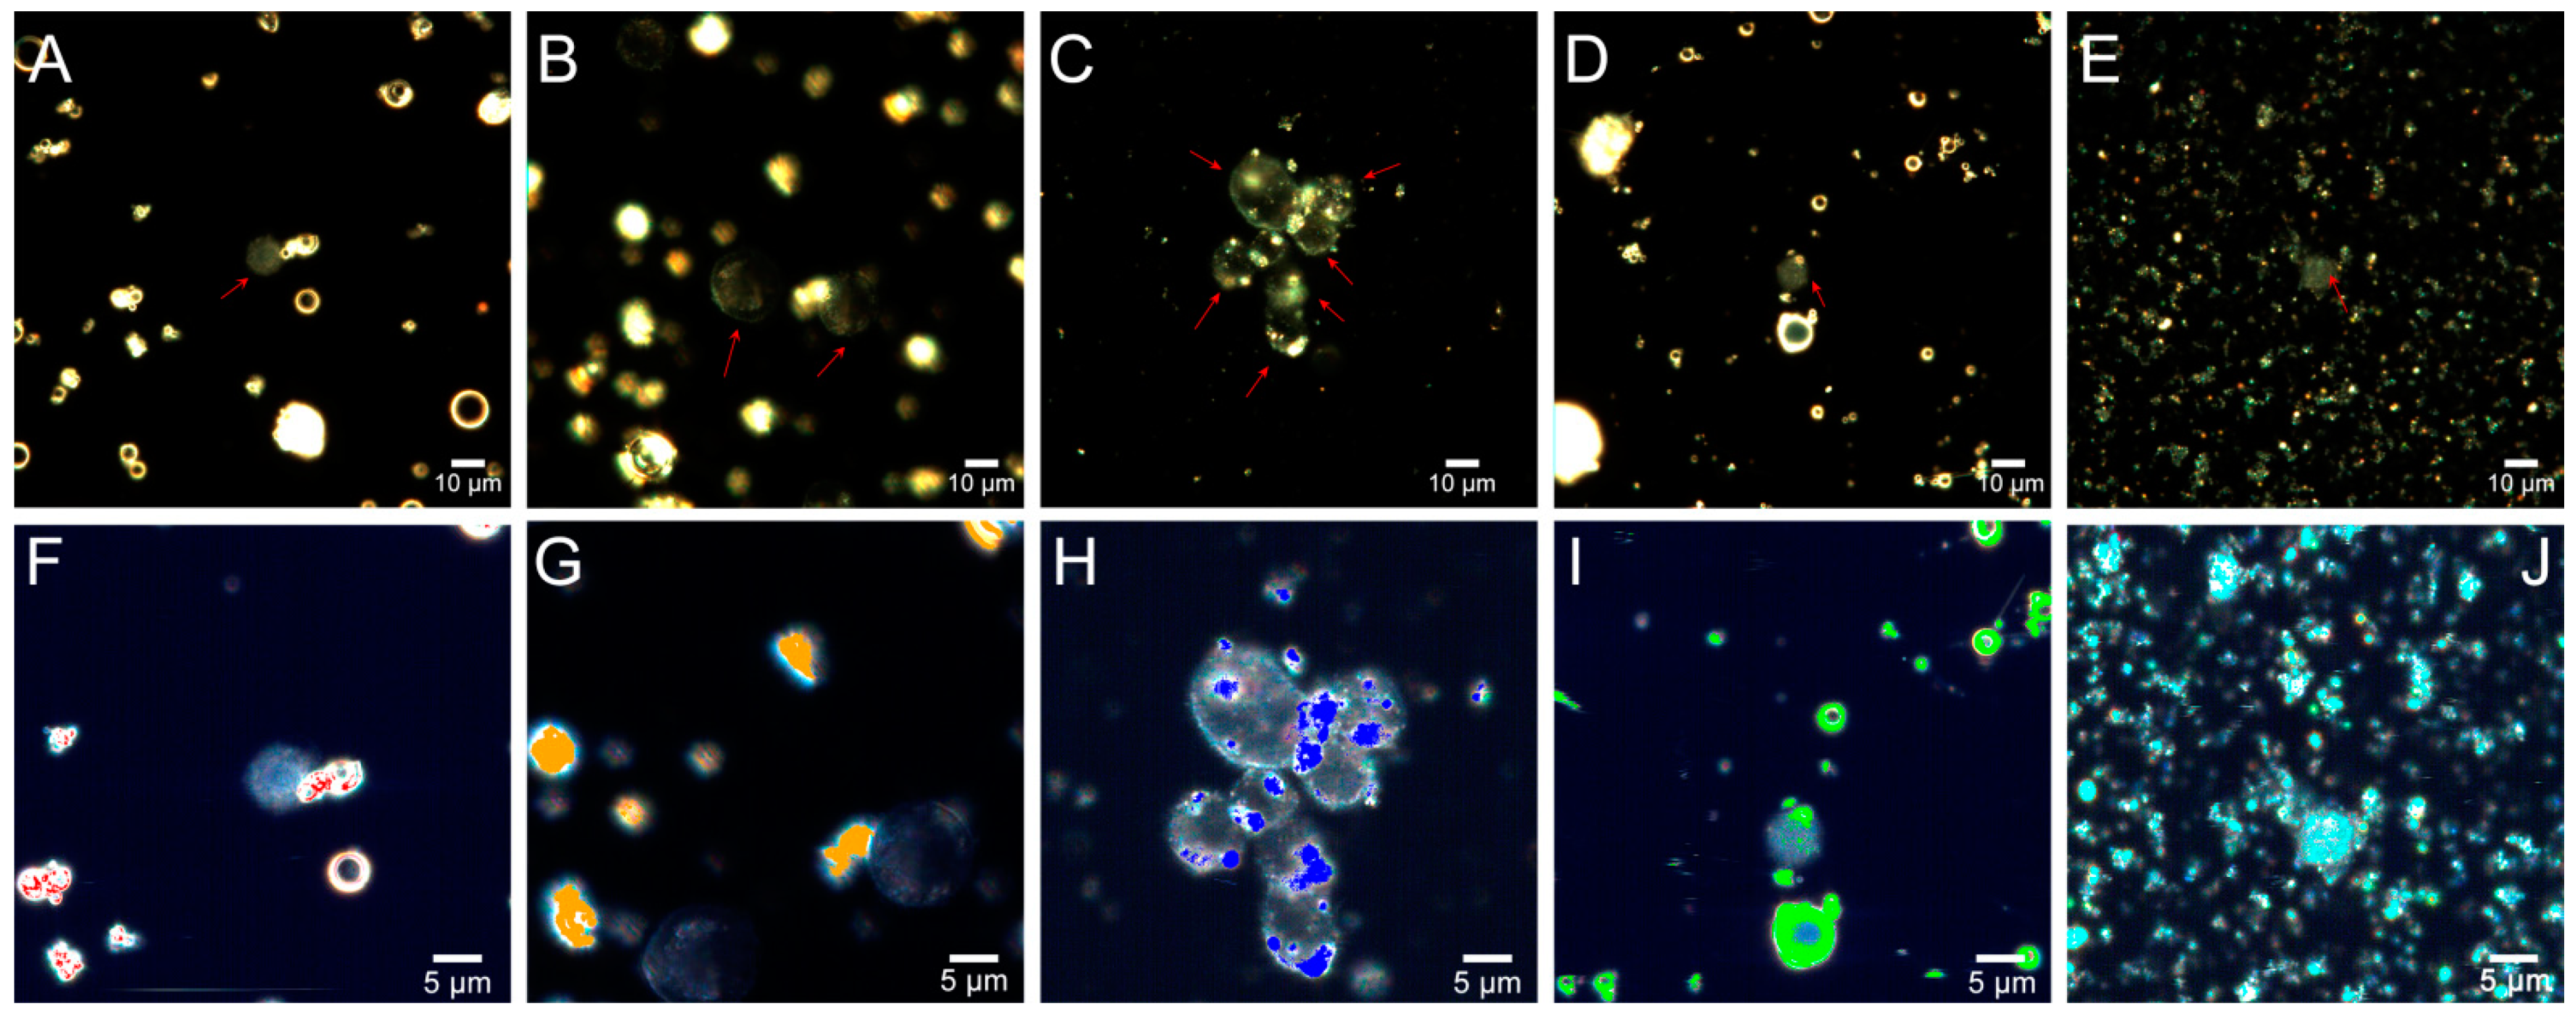
2.5. Fly Ash Biodistribution
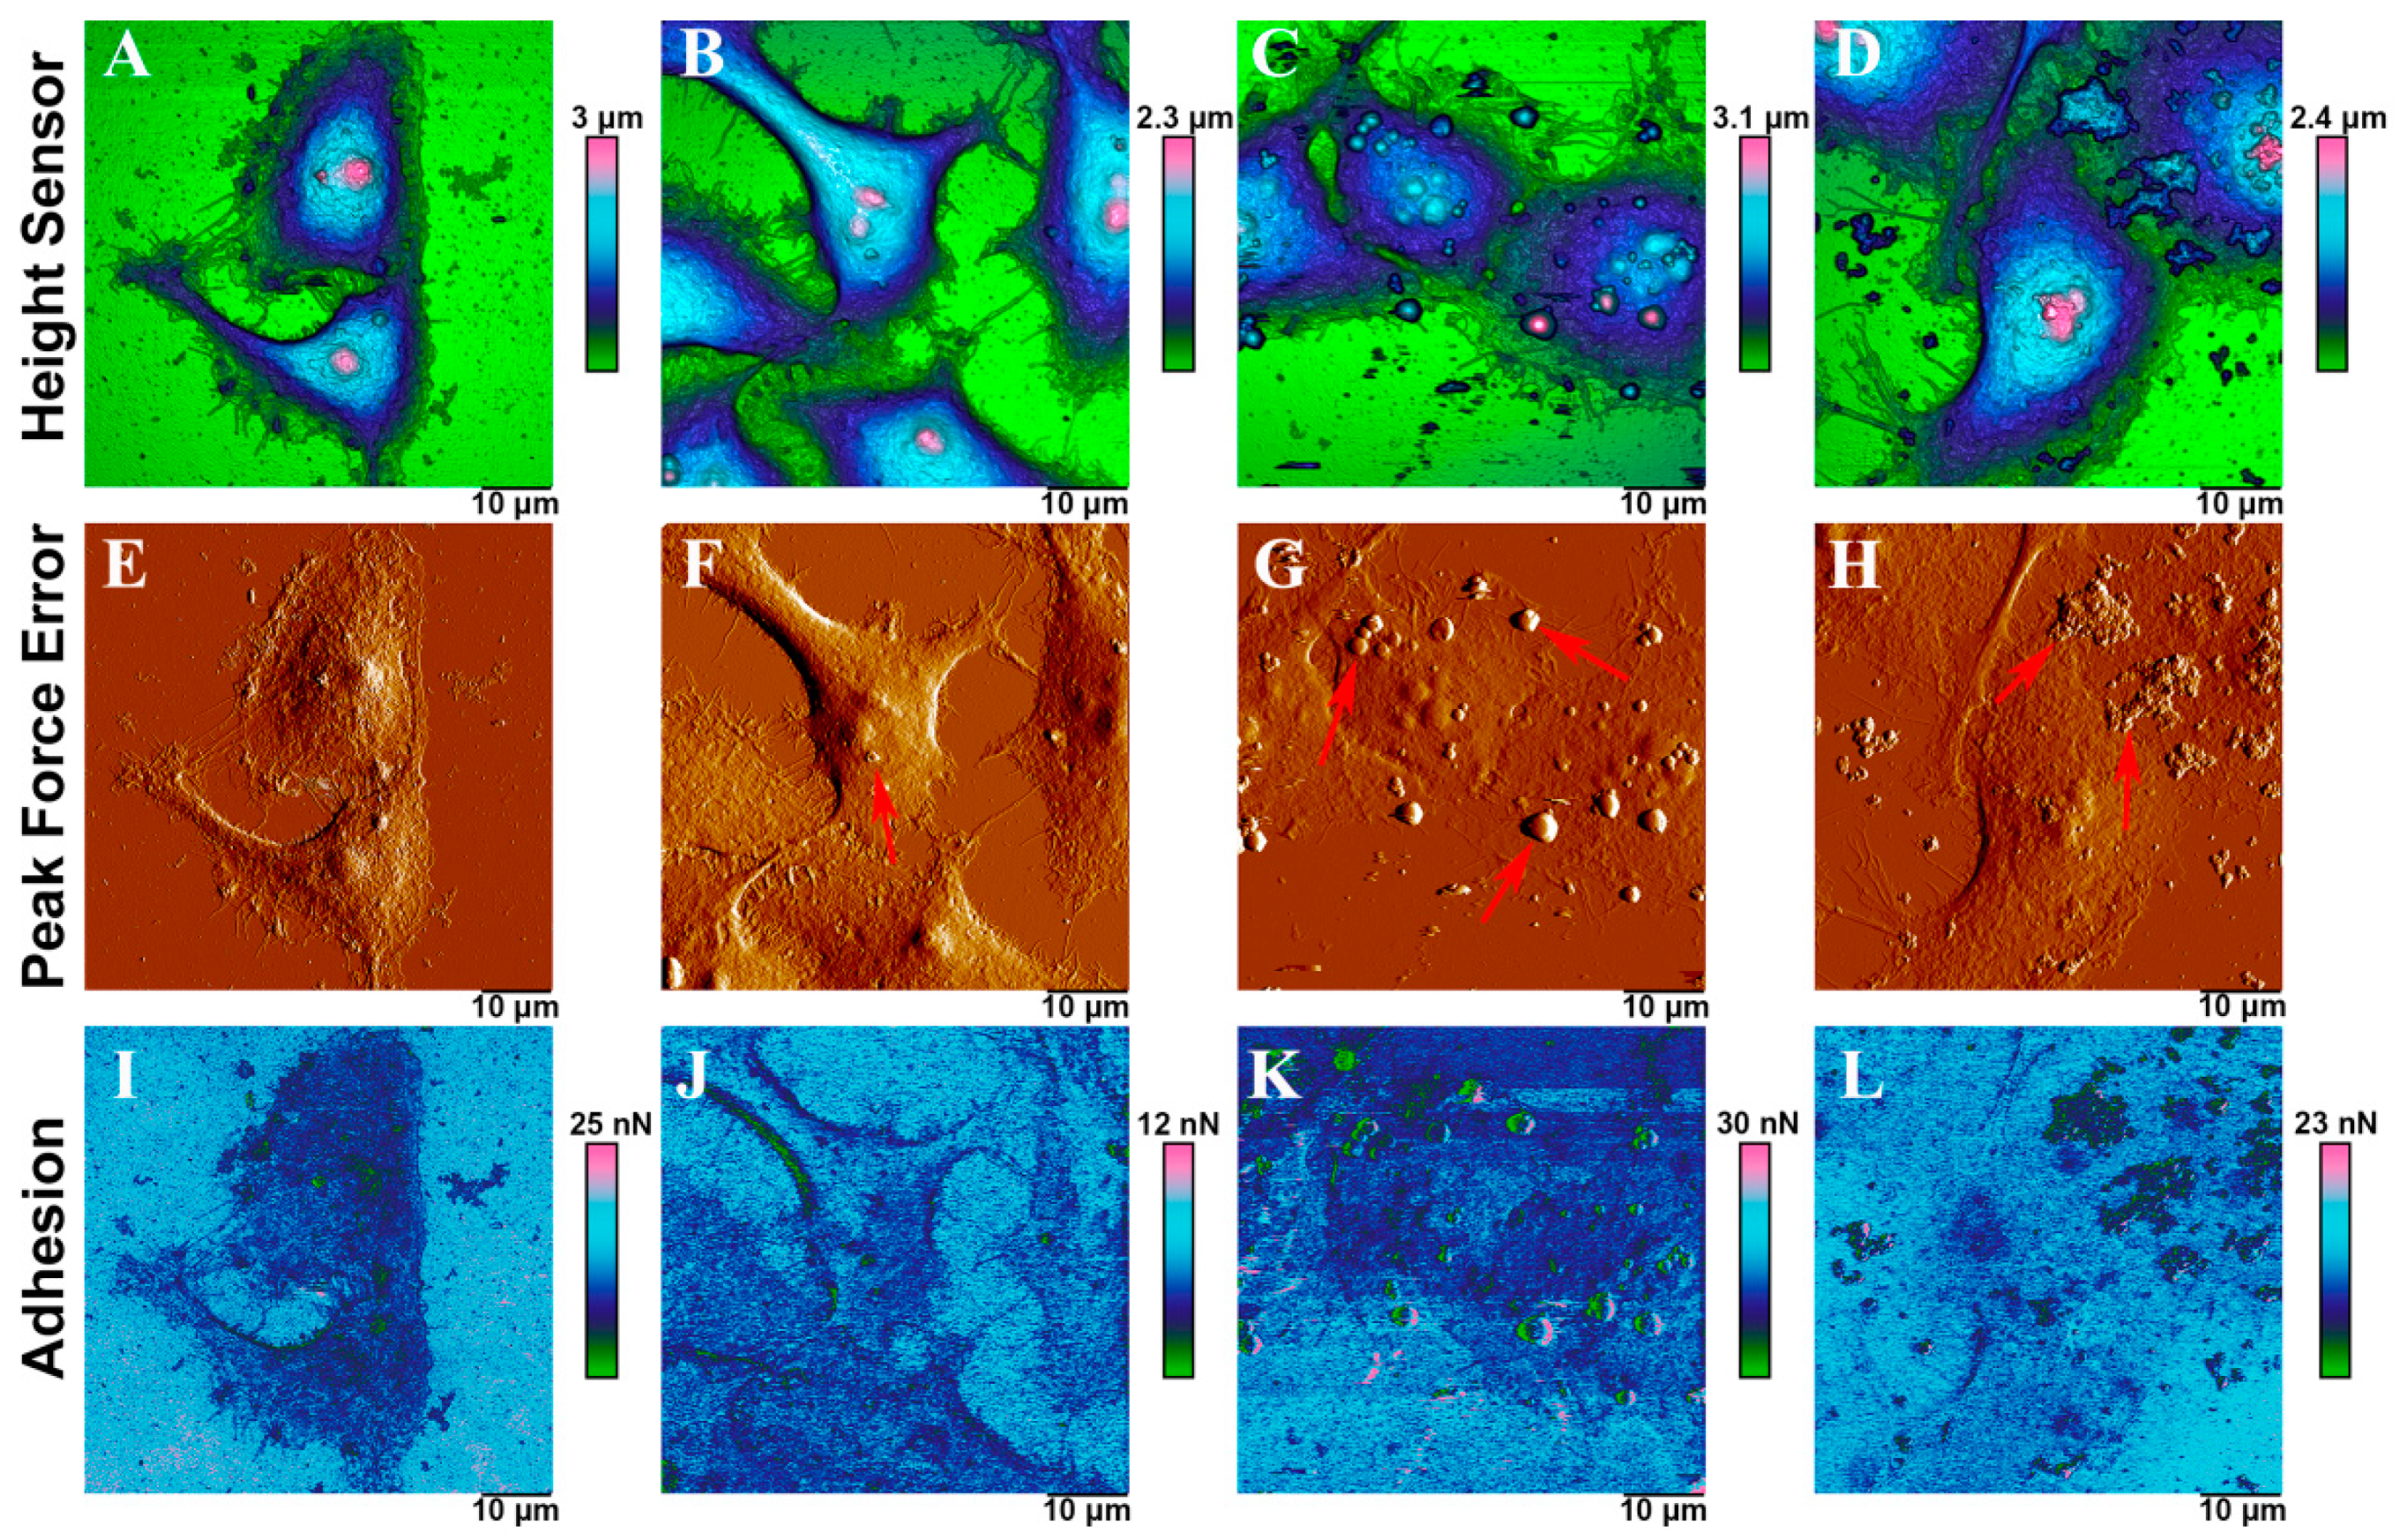
2.6. Interaction Force between Mammalian Cell and Fly Ashes
3. Materials and Methods
3.1. Materials
3.2. Cell Culture
3.3. WST-1 Assay
3.4. LDH Assay
3.5. MTT Assay
3.6. Comet Assay
3.7. Flow Cytometry
3.8. Preparation of Samples for Microscopic Analysis
3.9. Dark-Field Microscopy and Hyperspectral Imaging
3.10. Atomic Force Microscopy
3.11. Fly Ash Analysis Techniques
3.12. Statistics
4. Conclusions
Supplementary Materials
Author Contributions
Funding
Institutional Review Board Statement
Informed Consent Statement
Data Availability Statement
Conflicts of Interest
Sample Availability
References
- Falcon-Rodriguez, C.I.; Osornio-Vargas, A.R.; Sada-Ovalle, I.; Segura-Medina, P. Aeroparticles, Composition, and Lung Diseases. Front. Immunol. 2016, 7, 3. [Google Scholar] [CrossRef]
- Yao, Z.; Ji, X.; Sarker, P.; Tang, J.; Ge, L.; Xia, M.; Xi, Y. A comprehensive review on the applications of coal fly ash. Earth-Sci. Rev. 2015, 141, 105–121. [Google Scholar] [CrossRef]
- Gupt, C.B.; Bordoloi, S.; Sekharan, S.; Sarmah, A.K. A feasibility study of Indian fly ash-bentonite as an alternative adsorbent composite to sand-bentonite mixes in landfill liner. Environ. Pollut. 2020, 265, 114811. [Google Scholar] [CrossRef]
- Chen, Y.; Wild, O.; Conibear, L.; Ran, L.; He, J.; Wang, L.; Wang, Y. Local characteristics of and exposure to fine particulate matter (PM2.5) in four indian megacities. Atmos. Environ. X 2020, 5, 100052. [Google Scholar] [CrossRef]
- Van Dingenen, R.; Raes, F.; Putaud, J.-P.; Baltensperger, U.; Charron, A.; Facchini, M.-C.; Decesari, S.; Fuzzi, S.; Gehrig, R.; Hansson, H.-C.; et al. A European aerosol phenomenology—1: Physical characteristics of particulate matter at kerbside, urban, rural and background sites in Europe. Atmos. Environ. 2004, 38, 2561–2577. [Google Scholar] [CrossRef]
- Loomis, D.; Grosse, Y.; Lauby-Secretan, B.; El Ghissassi, F.; Bouvard, V.; Benbrahim-Tallaa, L.; Guha, N.; Baan, R.; Mattock, H.; Straif, K. The carcinogenicity of outdoor air pollution. Lancet Oncol. 2013, 14, 1262–1263. [Google Scholar] [CrossRef]
- Li, M.; Wang, T.; Han, Y.; Xie, M.; Li, S.; Zhuang, B.; Chen, P. Modeling of a severe dust event and its impacts on ozone photochemistry over the downstream Nanjing megacity of eastern China. Atmos. Environ. 2017, 160, 107–123. [Google Scholar] [CrossRef]
- Fu, Q.; Zhuang, G.; Li, J.; Huang, K.; Wang, Q.; Zhang, R.; Fu, J.; Lu, T.; Chen, M.; Wang, Q.; et al. Source, long-range transport, and characteristics of a heavy dust pollution event in Shanghai. J. Geophys. Res. Space Phys. 2010, 115, 1–12. [Google Scholar] [CrossRef]
- Lee, Y.G.; Ho, C.-H.; Kim, J.-H.; Kim, J. Quiescence of Asian dust events in South Korea and Japan during 2012 spring: Dust outbreaks and transports. Atmos. Environ. 2015, 114, 92–101. [Google Scholar] [CrossRef]
- Wu, Y.; Han, Z.; Nazmi, C.; Gross, B.; Moshary, F. A trans-Pacific Asian dust episode and its impacts to air quality in the east coast of U.S. Atmos. Environ. 2015, 106, 358–368. [Google Scholar] [CrossRef]
- Creamean, J.M.; Suski, K.J.; Rosenfeld, D.; Cazorla, A.; DeMott, P.J.; Sullivan, R.C.; White, A.B.; Ralph, F.M.; Minnis, P.; Comstock, J.M.; et al. Dust and Biological Aerosols from the Sahara and Asia Influence Precipitation in the Western U.S. Science 2013, 339, 1572–1578. [Google Scholar] [CrossRef] [PubMed]
- Stabile, L.; Massimo, A.; Rizza, V.; D’Apuzzo, M.; Evangelisti, A.; Scungio, M.; Frattolillo, A.; Cortellessa, G.; Buonanno, G. A novel approach to evaluate the lung cancer risk of airborne particles emitted in a city. Sci. Total Environ. 2019, 656, 1032–1042. [Google Scholar] [CrossRef] [PubMed]
- Tian, Q.; Guo, B.; Nakama, S.; Sasaki, K. Distributions and Leaching Behaviors of Toxic Elements in Fly Ash. ACS Omega 2018, 3, 13055–13064. [Google Scholar] [CrossRef]
- Ahmaruzzaman, M. A review on the utilization of fly ash. Prog. Energy Combust. Sci. 2010, 36, 327–363. [Google Scholar] [CrossRef]
- Akar, G.; Polat, M.; Galecki, G.; Ipekoglu, U. Leaching behavior of selected trace elements in coal fly ash samples from Yenikoy coal-fired power plants. Fuel Process. Technol. 2012, 104, 50–56. [Google Scholar] [CrossRef]
- Satterfield, J. On 10th Anniversary of Kingston Coal Ash Spill, Workers Who Went ‘Through Hell and Back’ Honored. Available online: https://www.knoxnews.com/story/news/crime/2018/12/22/kingston-coal-ash-spill-workers-10th-anniversary/2333826002/ (accessed on 22 December 2018).
- Gottlieb, B.; Gilbert, S.G.; Evans, L.G. Coal Ash-The Toxic Threat to Our Health and Environment, a Report from Physicians for Social Responsibility and Earthjustice; Physicians for Social Responsibility: Washington, DC, USA, 2010. [Google Scholar]
- Environmental Protection Agency. Hazardous and Solid Waste Management System; Disposal of Coal Combustion Residuals from Electric Utilities. Federal Regist. 2015, 80, 20501–21302. Available online: https://www.govinfo.gov/content/pkg/FR-2015-04-17/pdf/2015-00257.pdf (accessed on 1 February 2020).
- Gollakota, A.R.; Volli, V.; Shu, C.-M. Progressive utilisation prospects of coal fly ash: A review. Sci. Total Environ. 2019, 672, 951–989. [Google Scholar] [CrossRef]
- Kalra, N.; Jain, M.C.; Joshi, H.C.; Chaudhary, R.; Kumar, S.; Pathak, H.; Sharma, S.K.; Kumar, V.; Kumar, R.; Harit, R.C.; et al. Soil properties and crop productivity as influenced by flyash incorporation in soil. Environ. Monit. Assess. 2003, 87, 93–109. [Google Scholar] [CrossRef]
- Chen, Y.; Xu, L.; Tan, S.N.; Sun, X.; Deng, Y.; Yang, W. Solidification and multi-cytotoxicity evaluation of thermally treated MSWI fly ash. J. Hazard. Mater. 2020, 388, 122041. [Google Scholar] [CrossRef]
- Li, F.; Liu, L.; Yang, Z.; Li, S. Physical and mechanical properties and micro characteristics of fly ash-based geopolymer paste incorporated with waste Granulated Blast Furnace Slag (GBFS) and functionalized Multi-Walled Carbon Nanotubes (MWCNTs). J. Hazard. Mater. 2021, 401, 123339. [Google Scholar] [CrossRef]
- Park, J.-H.; Eom, J.-H.; Lee, S.-L.; Hwang, S.-W.; Kim, S.-H.; Kang, S.-W.; Yun, J.-J.; Cho, J.-S.; Lee, Y.-H.; Seo, D.-C. Exploration of the potential capacity of fly ash and bottom ash derived from wood pellet-based thermal power plant for heavy metal removal. Sci. Total Environ. 2020, 740, 140205. [Google Scholar] [CrossRef]
- Damasceno, K.; Cavalcante, A.; Maziero, J.; Martini, G.; Ormênio, M.; Mamede, F.; Miranda, C.; Campello, F.; Izidoro, J.; Rogero, S.; et al. In vitro and in vivo toxicity of coal fly Ash Lechatee. Ecotoxicol. Environ. Contam. 2018, 13, 73–78. [Google Scholar] [CrossRef]
- Liu, W.; Tam, J.; Wong, M. Size dependent cytotoxicity of fly ash particles. Environ. Int. 1988, 14, 473–477. [Google Scholar] [CrossRef]
- Kondo, T.; Takahashi, S.; Sato, H.; Yamada, M.; Kikuchi, T.; Furuya, K. Cytotoxicity of size-density fractionated coal fly ash in rat alveolar macrophages cultured in vitro. Toxicol. Vitr. 1993, 7, 61–67. [Google Scholar] [CrossRef]
- Micó-Vicent, B.; Martínez-Verdú, F.M.; Novikov, A.; Stavitskaya, A.; Vinokurov, V.; Rozhina, E.; Fakhrullin, R.; Yendluri, R.; Lvov, Y. Stabilized Dye-Pigment Formulations with Platy and Tubular Nanoclays. Adv. Funct. Mater. 2018, 28, 1703553. [Google Scholar] [CrossRef]
- Carlson, C.L.; Adriano, D.C. Environmental Impacts of Coal Combustion Residues. J. Environ. Qual. 1993, 22, 227–247. [Google Scholar] [CrossRef]
- ASTM C618-19. Standard Specification for Coal Fly Ash and Raw or Calcined Natural Pozzolan for Use in Concrete; ASTM International: West Conshohocken, PA, USA, 2019. [Google Scholar]
- Vassilev, S.V.; Vassileva, C.G. A new approach for the classification of coal fly ashes based on their origin, composition, properties, and behaviour. Fuel 2007, 86, 1490–1512. [Google Scholar] [CrossRef]
- Bhatt, A.; Priyadarshini, S.; Mohanakrishnan, A.A.; Abri, A.; Sattler, M.; Techapaphawit, S. Physical, chemical, and geotechnical properties of coal fly ash: A global review. Case Stud. Constr. Mater. 2019, 11, e00263. [Google Scholar] [CrossRef]
- Wong, G.; Gan, M.; Fan, X.; Ji, Z.; Chen, X.; Wang, Z. Co-disposal of municipal solid waste incineration fly ash and bottom slag: A novel method of low temperature melting treatment. J. Hazard. Mater. 2021, 408, 124438. [Google Scholar] [CrossRef]
- Lighty, J.S.; Veranth, J.M.; Sarofim, A.F. Combustion Aerosols: Factors Governing Their Size and Composition and Implications to Human Health. J. Air Waste Manag. Assoc. 2000, 50, 1565–1618. [Google Scholar] [CrossRef]
- Diabaté, S.; Bergfeldt, B.; Plaumann, D.; Übel, C.; Weiss, C. Anti-oxidative and inflammatory responses induced by fly ash particles and carbon black in lung epithelial cells. Anal. Bioanal. Chem. 2011, 401, 3197–3212. [Google Scholar] [CrossRef]
- Sambandam, B.; Palanisami, E.; Abbugounder, R.; Prakhya, B.; Thiyagarajan, D. Characterizations of coal fly ash nanoparticles and induced in vitro toxicity in cell lines. J. Nanopart. Res. 2014, 16, 1–9. [Google Scholar] [CrossRef]
- Li, N.; Sioutas, C.; Cho, A.; Schmitz, D.; Misra, C.; Sempf, J.; Wang, M.; Oberley, T.; Froines, J.; Nel, A. Ultrafine particulate pollutants induce oxidative stress and mitochondrial damage. Environ. Health Perspect. 2003, 111, 455–460. [Google Scholar] [CrossRef]
- Gilmour, M.I.; O’Connor, S.; Dick, C.A.; Miller, C.A.; Linak, W.P. Differential pulmonary inflammation and in vitro cytotoxicity of size-fractionated fly ash particles from pulverized coal combustion. J. Air Waste Manag. Assoc. 2004, 54, 286–295. [Google Scholar] [CrossRef]
- Hill, J.O.; Hobbs, C.H. Comparative cytotoxicity of DQ12-quartz and fly ash particles from coal combustion. Toxicol. Lett. 1982, 10, 399–403. [Google Scholar] [CrossRef]
- Kaw, J.; Khanna, A.; Waseem, M. In vitro cytotoxic and hemolytic potential of coal fly ash. J. Environ. Sci. Health Part A Environ. Sci. Eng. 1988, 23, 711–723. [Google Scholar] [CrossRef]
- Präbst, K.; Engelhardt, H.; Ringgeler, S.; Hübner, H. Basic Colorimetric Proliferation Assays: MTT, WST, and Resazurin. Methods Mol. Biol. 2017, 1601, 1–17. [Google Scholar] [CrossRef]
- Depoi, F.S.; Pozebon, D.; Kalkreuth, W.D. Chemical characterization of feed coals and combustion-by-products from Brazilian power plants. Int. J. Coal Geol. 2008, 76, 227–236. [Google Scholar] [CrossRef]
- Zhao, S.; Duan, Y.; Lu, J.; Gupta, R.; Pudasainee, D.; Liu, S.; Liu, M.; Lu, J. Chemical speciation and leaching characteristics of hazardous trace elements in coal and fly ash from coal-fired power plants. Fuel 2018, 232, 463–469. [Google Scholar] [CrossRef]
- León-Mejía, G.; Silva, L.F.O.; Civeira, M.S.; Oliveira, M.L.S.; Machado, M.; Villela, I.V.; Hartmann, A.; Premoli, S.; Corrêa, D.S.; Da Silva, J.; et al. Cytotoxicity and genotoxicity induced by coal and coal fly ash particles samples in V79 cells. Environ. Sci. Pollut. Res. 2016, 23, 24019–24031. [Google Scholar] [CrossRef]
- Dwivedi, S.; Saquib, Q.; Al-Khedhairy, A.A.; Ali, A.-Y.S.; Musarrat, J. Characterization of coal fly ash nanoparticles and induced oxidative DNA damage in human peripheral blood mononuclear cells. Sci. Total Environ. 2012, 437, 331–338. [Google Scholar] [CrossRef]
- Chakraborty, R.; Mukherjee, A. Mutagenicity and genotoxicity of coal fly ash water leachate. Ecotoxicol. Environ. Saf. 2009, 72, 838–842. [Google Scholar] [CrossRef]
- Thurnherr, T.; Su, D.S.; Diener, L.; Weinberg, G.; Manser, P.; Pfänder, N.; Arrigo, R.; Schuster, M.E.; Wick, P.; Krug, H.F. Comprehensive evaluation of in vitro toxicity of three large-scale produced carbon nanotubes on human Jurkat T cells and a comparison to crocidolite asbestos. Nanotoxicology 2009, 3, 319–338. [Google Scholar] [CrossRef]
- Kim, J.S.; Sung, J.H.; Song, K.S.; Lee, J.H.; Kim, S.M.; Lee, G.H.; Ahn, K.H.; Lee, J.S.; Shin, J.H.; Park, J.D.; et al. Persistent DNA Damage Measured by Comet Assay of Sprague Dawley Rat Lung Cells after Five Days of Inhalation Exposure and 1 Month Post-Exposure to Dispersed Multi-Wall Carbon Nanotubes (MWCNTs) Generated by New MWCNT Aerosol Generation System. Toxicol. Sci. 2012, 128, 439–448. [Google Scholar] [CrossRef] [PubMed]
- Das, G.K.; Anderson, N.S.; Wallis, C.D.; Carratt, S.A.; Kennedy, I.M.; Van Winkle, L.S. Novel multi-functional europium-doped gadolinium oxide nanoparticle aerosols facilitate the study of deposition in the developing rat lung. Nanoscale 2016, 8, 11518–11530. [Google Scholar] [CrossRef]
- Russ, K.A.; Thompson, J.A.; Reynolds, J.S.; Mercer, R.R.; Porter, D.W.; McKinney, W.; Dey, R.D.; Barger, M.; Cumpston, J.; Batchelor, T.P.; et al. Biological effects of inhaled hydraulic fracturing sand dust. IV. Pulmonary effects. Toxicol. Appl. Pharmacol. 2020, 409, 115284. [Google Scholar] [CrossRef]
- Cheng, Z.; Liang, X.; Liang, S.; Yin, N.; Faiola, F. A human embryonic stem cell-based in vitro model revealed that ultrafine carbon particles may cause skin inflammation and psoriasis. J. Environ. Sci. 2020, 87, 194–204. [Google Scholar] [CrossRef]
- Mohanta, D.; Patnaik, S.; Sood, S.; Das, N. Carbon nanotubes: Evaluation of toxicity at biointerfaces. J. Pharm. Anal. 2019, 9, 293–300. [Google Scholar] [CrossRef]
- Buzea, C.; Pacheco, I.I.; Robbie, K. Nanomaterials and nanoparticles: Sources and toxicity. Biointerphases 2007, 2, MR17–MR71. [Google Scholar] [CrossRef]
- Glovsky, M.; Miguel, A.G.; Cass, G.R. Particulate air pollution: Possible relevance in asthma. Allergy Asthma Proc. 1997, 18, 163–166. [Google Scholar] [CrossRef]
- Sohaebuddin, S.K.; Thevenot, P.T.; Baker, D.; Eaton, J.W.; Tang, L. Nanomaterial cytotoxicity is composition, size, and cell type dependent. Part. Fibre Toxicol. 2010, 7, 1–17. [Google Scholar] [CrossRef]
- Blechinger, J.; Bauer, A.T.; Torrano, A.A.; Gorzelanny, C.; Bräuchle, C.; Schneider, S.W. Uptake Kinetics and Nanotoxicity of Silica Nanoparticles Are Cell Type Dependent. Small 2013, 9, 3970–3980. [Google Scholar] [CrossRef]
- Schins, R.P. Mechanisms and Mediators in Coal Dust InducedToxicity: A Review. Ann. Occup. Hyg. 1999, 43, 7–33. [Google Scholar] [CrossRef]
- Oberdörster, G.; Sharp, Z.; Atudorei, V.; Elder, A.; Gelein, R.; Kreyling, W.; Cox, C. Translocation of Inhaled Ultrafine Particles to the Brain. Inhal. Toxicol. 2004, 16, 437–445. [Google Scholar] [CrossRef] [PubMed]
- Matzenbacher, C.A.; Garcia, A.L.H.; Dos Santos, M.S.; Nicolau, C.C.; Premoli, S.; Corrêa, D.S.; De Souza, C.T.; Niekraszewicz, L.; Dias, J.F.; Delgado, T.V.; et al. DNA damage induced by coal dust, fly and bottom ash from coal combustion evaluated using the micronucleus test and comet assay in vitro. J. Hazard. Mater. 2017, 324, 781–788. [Google Scholar] [CrossRef]
- Joshi, A.; Montes, C.; Salehi, S.; Allouche, E.; Lvov, Y. Optimization of Geopolymer Properties by Coating of Fly-Ash Microparticles with Nanoclays. J. Inorg. Organomet. Polym. Mater. 2014, 25, 282–292. [Google Scholar] [CrossRef]
- Rozhina, E.; Panchal, A.; Akhatova, F.; Lvov, Y.; Fakhrullin, R. Cytocompatibility and cellular uptake of alkylsilane-modified hydrophobic halloysite nanotubes. Appl. Clay Sci. 2020, 185, 105371. [Google Scholar] [CrossRef]
- Guryanov, I.; Naumenko, E.; Akhatova, F.; Lazzara, G.; Cavallaro, G.; Nigamatzyanova, L.; Fakhrullin, R. Selective Cytotoxic Activity of Prodigiosin@halloysite Nanoformulation. Front. Bioeng. Biotechnol. 2020, 8, 424. [Google Scholar] [CrossRef]
- Dzamukova, M.R.; Naumenko, E.A.; Rozhina, E.V.; Trifonov, A.A.; Fakhrullin, R.F. Cell surface engineering with polyelectrolyte-stabilized magnetic nanoparticles: A facile approach for fabrication of artificial multicellular tissue-mimicking clusters. Nano Res. 2015, 8, 2515–2532. [Google Scholar] [CrossRef]
- Akhatova, F.; Danilushkina, A.; Kuku, G.; Saricam, M.; Culha, M.; Fakhrullin, R. Simultaneous Intracellular Detection of Plasmonic and Non-Plasmonic Nanoparticles Using Dark-Field Hyperspectral Microscopy. Bull. Chem. Soc. Jpn. 2018, 91, 1640–1645. [Google Scholar] [CrossRef]
- Batasheva, S.; Kryuchkova, M.; Fakhrullin, R.; Cavallaro, G.; Lazzara, G.; Akhatova, F.; Nigamatzyanova, L.; Evtugyn, V.; Rozhina, E.; Fakhrullin, R. Facile Fabrication of Natural Polyelectrolyte-Nanoclay Composites: Halloysite Nanotubes, Nucleotides and DNA Study. Molecules 2020, 25, 3557. [Google Scholar] [CrossRef]
- Stavitskaya, A.V.; Kozlova, E.A.; Kurenkova, A.Y.; Glotov, A.P.; Selischev, D.S.; Ivanov, E.V.; Kozlov, D.V.; Vinokurov, V.A.; Fakhrullin, R.F.; Lvov, Y.M. Ru/CdS Quantum Dots Templated on Clay Nanotubes as Visible-Light-Active Photocatalysts: Optimization of S/Cd Ratio and Ru Content. Chem. Eur. J. 2020, 26, 13085–13092. [Google Scholar] [CrossRef] [PubMed]
- Panchal, A.; Fakhrullina, G.; Fakhrullin, R.; Lvov, Y. Self-assembly of clay nanotubes on hair surface for medical and cosmetic formulations. Nanoscale 2018, 10, 18205–18216. [Google Scholar] [CrossRef]
- Tarasova, E.; Naumenko, E.; Rozhina, E.; Akhatova, F.; Fakhrullin, R. Cytocompatibility and uptake of polycations-modified halloysite clay nanotubes. Appl. Clay Sci. 2019, 169, 21–30. [Google Scholar] [CrossRef]


| Sample Origin | Size, µm | ζ-Potential, mV |
|---|---|---|
| Rockdale, TX | 2.7 ± 0.1 | −28.1 ± 1.2 |
| Dolet Hills, LA | 2.0 ± 0.3 | −12.3 ± 1.5 |
| Rockport, IN | 1.2 ± 0.3 | −28.9 ± 2.1 |
| Muskogee, OK | 2.0 ± 0.1 | −30.0 ± 2.9 |
| Chelyabinsk, Russia | 0.4 ± 0.2 | −35.2 ± 0.6 |
| Elements | Rockdale | Dolet Hills | Rockport | Muskogee | Chelyabinsk |
|---|---|---|---|---|---|
| O | 46.94 | 47.03 | 42.59 | 42.97 | 51.27 |
| Si | 25.79 | 26.19 | 14.89 | 17.37 | 43.06 |
| Al | 13.10 | 12.46 | 13.36 | 11.96 | 0.56 |
| Na | 0.22 | 1.39 | 5.52 | 0.92 | 0.63 |
| Mg | 0.90 | 1.58 | 1.76 | 4.07 | 1.00 |
| S | 0.43 | 0.50 | 2.21 | 0.59 | - |
| K | 1.19 | 0.76 | 0.55 | 0.36 | 1.34 |
| Ca | 6.20 | 5.31 | 8.13 | 17.17 | 0.28 |
| Ti | 1.04 | 0.40 | 1.22 | 1.14 | - |
| Fe | 3.83 | 3.71 | 2.32 | 3.26 | 0.93 |
| Sample Origin | Ash Concentration, mg/mL | Live, % | An+\PI+, % | An+, % | PI+, % |
|---|---|---|---|---|---|
| Control | - | 97.8 ± 0.4 | 0 | 2.2 ± 0.1 | 0 |
| Rockdale | 1 | 69.7 ± 0.8 | 21.1 ± 1.1 | 1.3 ± 0.1 | 8.0 ± 0.3 |
| 5 | 65.2 ± 2,1 | 19.6 ± 0.7 | 1.9 ± 0.1 | 13.5 ± 0.4 | |
| 10 | 61.9 ± 0.4 | 17.9 ± 0.9 | 2.0 ± 0.2 | 18.3 ± 1.5 | |
| Dolet Hills | 1 | 68.4 ± 0.6 | 22.2 ± 1.9 | 1.3 ± 4.8 | 8.2 ± 2.7 |
| 5 | 66.7 ± 1.6 | 19.0 ± 1.0 | 1.5 ± 5.4 | 12.9 ± 1.2 | |
| 10 | 63.0 ± 1.2 | 17.7 ± 0.2 | 1.8 ± 5.0 | 17.5 ± 2.3 | |
| Rockport | 1 | 71.6 ± 3.1 | 19.5 ± 0.4 | 1.6 ± 6.2 | 7.3 ± 1.4 |
| 5 | 67.6 ± 2.1 | 19.7 ± 0.9 | 1.6 ± 5.8 | 11.2 ± 1.4 | |
| 10 | 63.8 ± 0.5 | 19.5 ± 0.4 | 1.8 ± 6.0 | 14.9 ± 0.8 | |
| Muskogee | 1 | 70.0 ± 1.0 | 20.1 ± 1.1 | 1.5 ± 5.4 | 8.4 ± 2.2 |
| 5 | 61.4 ± 3.1 | 23.6 ± 0.8 | 1.6 ± 5.6 | 13.4 ± 2.8 | |
| 10 | 56.0 ± 0.6 | 25.5 ± 0.5 | 1.5 ± 4.8 | 16.9 ± 1.7 | |
| Chelyabinsk | 1 | 37.6 ± 0.5 | 32.7 ± 1.2 | 1.8 ± 5.2 | 27.9 ± 3.1 |
| 5 | 13.9 ± 0.2 | 46.4 ± 3.1 | 1.7 ± 3.0 | 37.2 ± 2.8 | |
| 10 | 11.9 ± 0.9 | 50.9 ± 1.8 | 0.2 ± 2.9 | 37.2 ± 3.3 |
| Control | Rockdale | Dolet Hills | Rockport | Muskogee | Chelyabinsk |
|---|---|---|---|---|---|
| 9.4 ± 3.3 | 7.1 ± 2.9 | 11.2 ± 1.9 | 17.2 ± 4.4 | 12.5 ± 3.4 | 10.7 ± 2.0 |
Publisher’s Note: MDPI stays neutral with regard to jurisdictional claims in published maps and institutional affiliations. |
© 2021 by the authors. Licensee MDPI, Basel, Switzerland. This article is an open access article distributed under the terms and conditions of the Creative Commons Attribution (CC BY) license (http://creativecommons.org/licenses/by/4.0/).
Share and Cite
Rozhina, E.; Ishmukhametov, I.; Nigamatzyanova, L.; Akhatova, F.; Batasheva, S.; Taskaev, S.; Montes, C.; Lvov, Y.; Fakhrullin, R. Comparative Toxicity of Fly Ash: An In Vitro Study. Molecules 2021, 26, 1926. https://doi.org/10.3390/molecules26071926
Rozhina E, Ishmukhametov I, Nigamatzyanova L, Akhatova F, Batasheva S, Taskaev S, Montes C, Lvov Y, Fakhrullin R. Comparative Toxicity of Fly Ash: An In Vitro Study. Molecules. 2021; 26(7):1926. https://doi.org/10.3390/molecules26071926
Chicago/Turabian StyleRozhina, Elvira, Ilnur Ishmukhametov, Läysän Nigamatzyanova, Farida Akhatova, Svetlana Batasheva, Sergey Taskaev, Carlos Montes, Yuri Lvov, and Rawil Fakhrullin. 2021. "Comparative Toxicity of Fly Ash: An In Vitro Study" Molecules 26, no. 7: 1926. https://doi.org/10.3390/molecules26071926
APA StyleRozhina, E., Ishmukhametov, I., Nigamatzyanova, L., Akhatova, F., Batasheva, S., Taskaev, S., Montes, C., Lvov, Y., & Fakhrullin, R. (2021). Comparative Toxicity of Fly Ash: An In Vitro Study. Molecules, 26(7), 1926. https://doi.org/10.3390/molecules26071926