
Nonadiabatic Absorption Spectra and Ultrafast Dynamics of DNA and RNA Photoexcited Nucleobases

 ,
,  , and
, and 
Abstract
1. Introduction
2. Materials and Methods
2.1. Diabatisation and Linear Vibronic Coupling Model
2.2. Absorption Spectra
3. Computational Details
4. Results
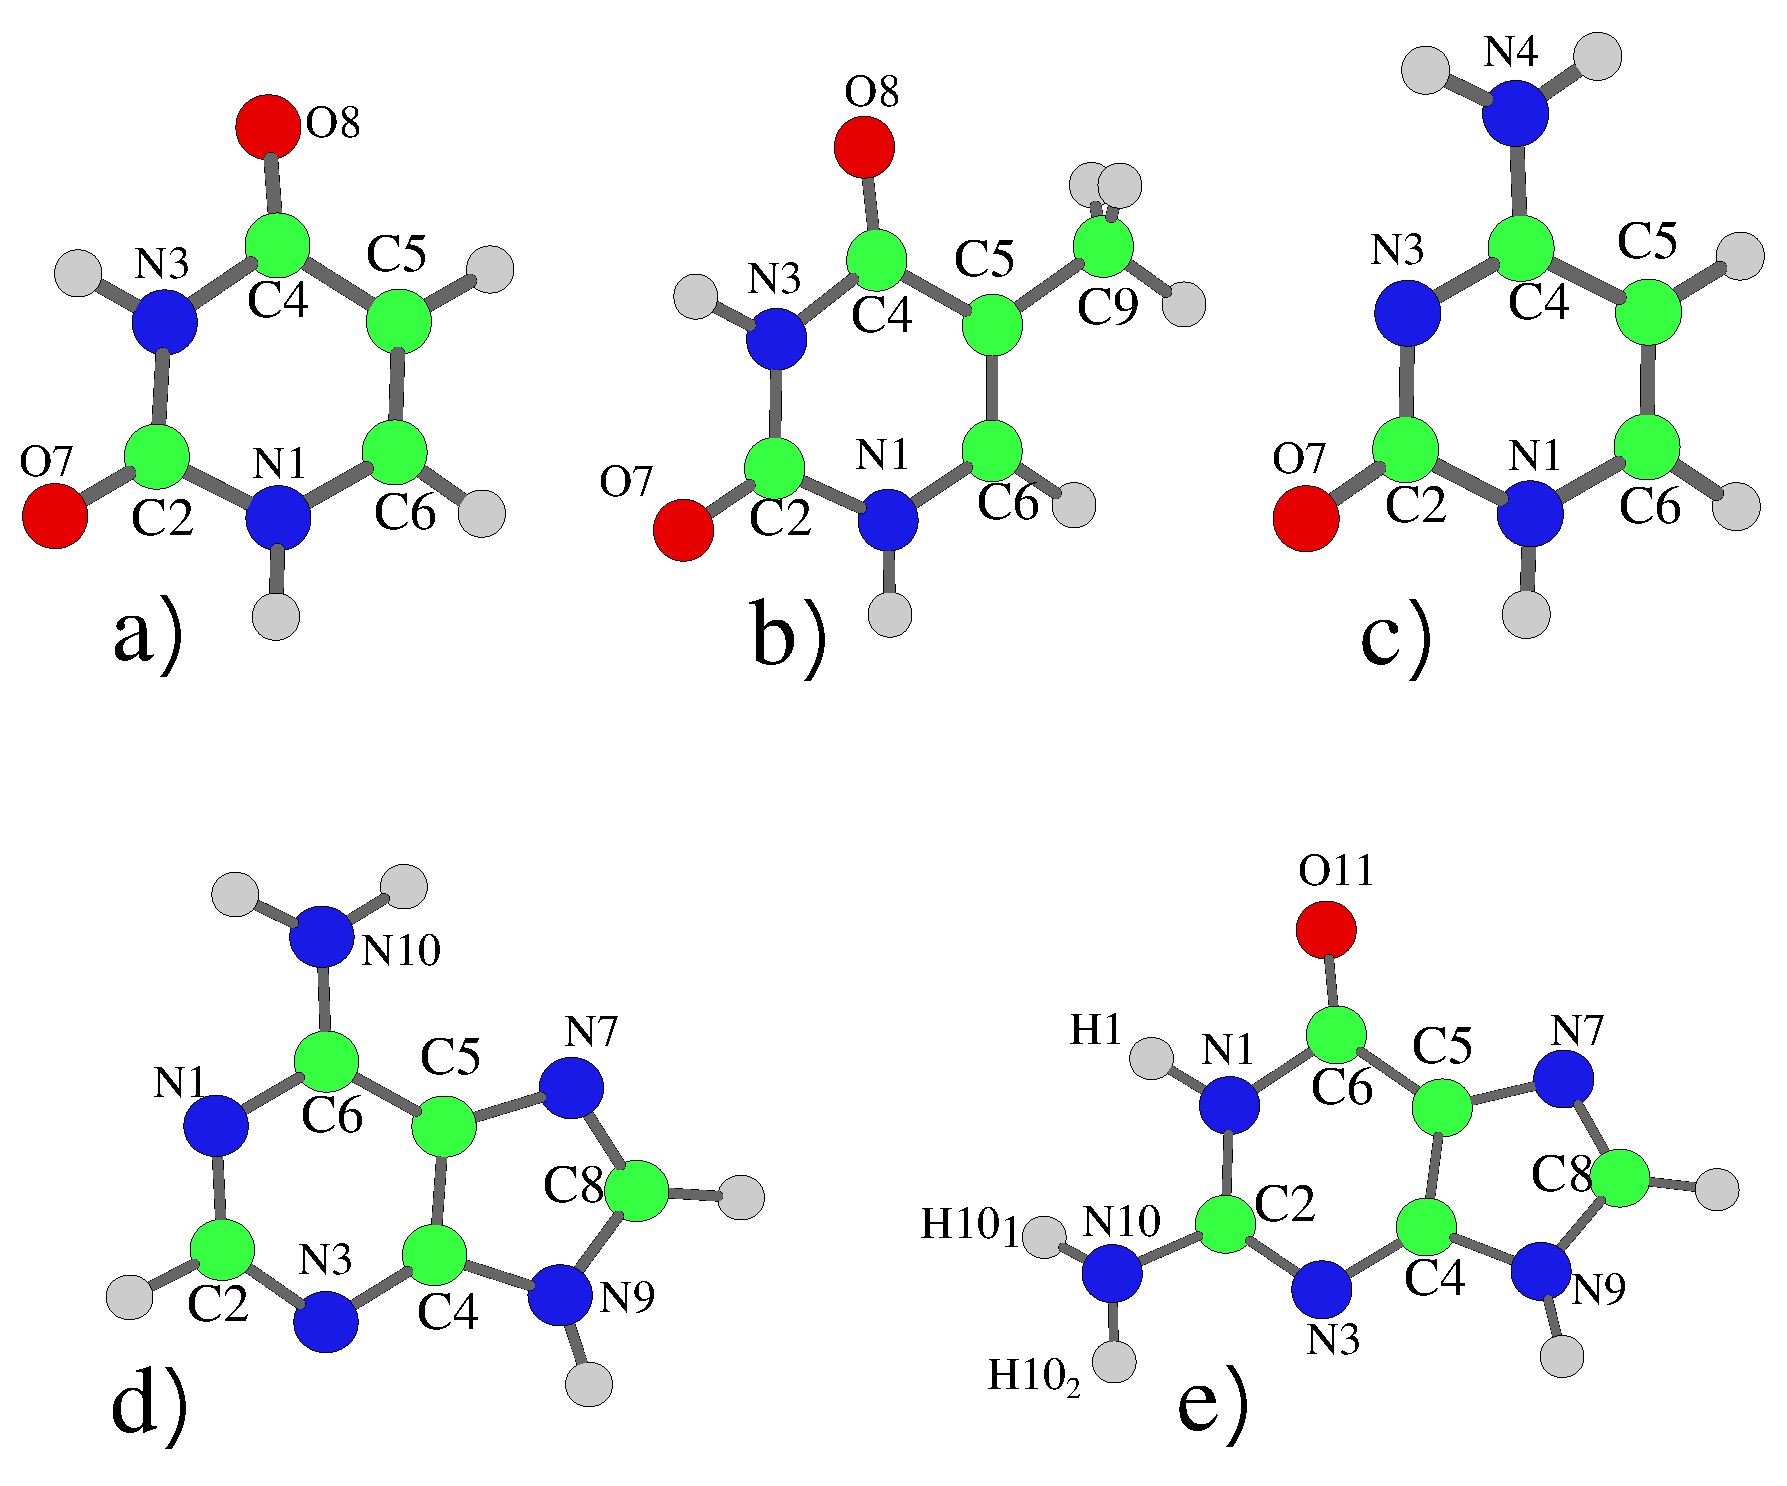
4.1. Pyrimidines
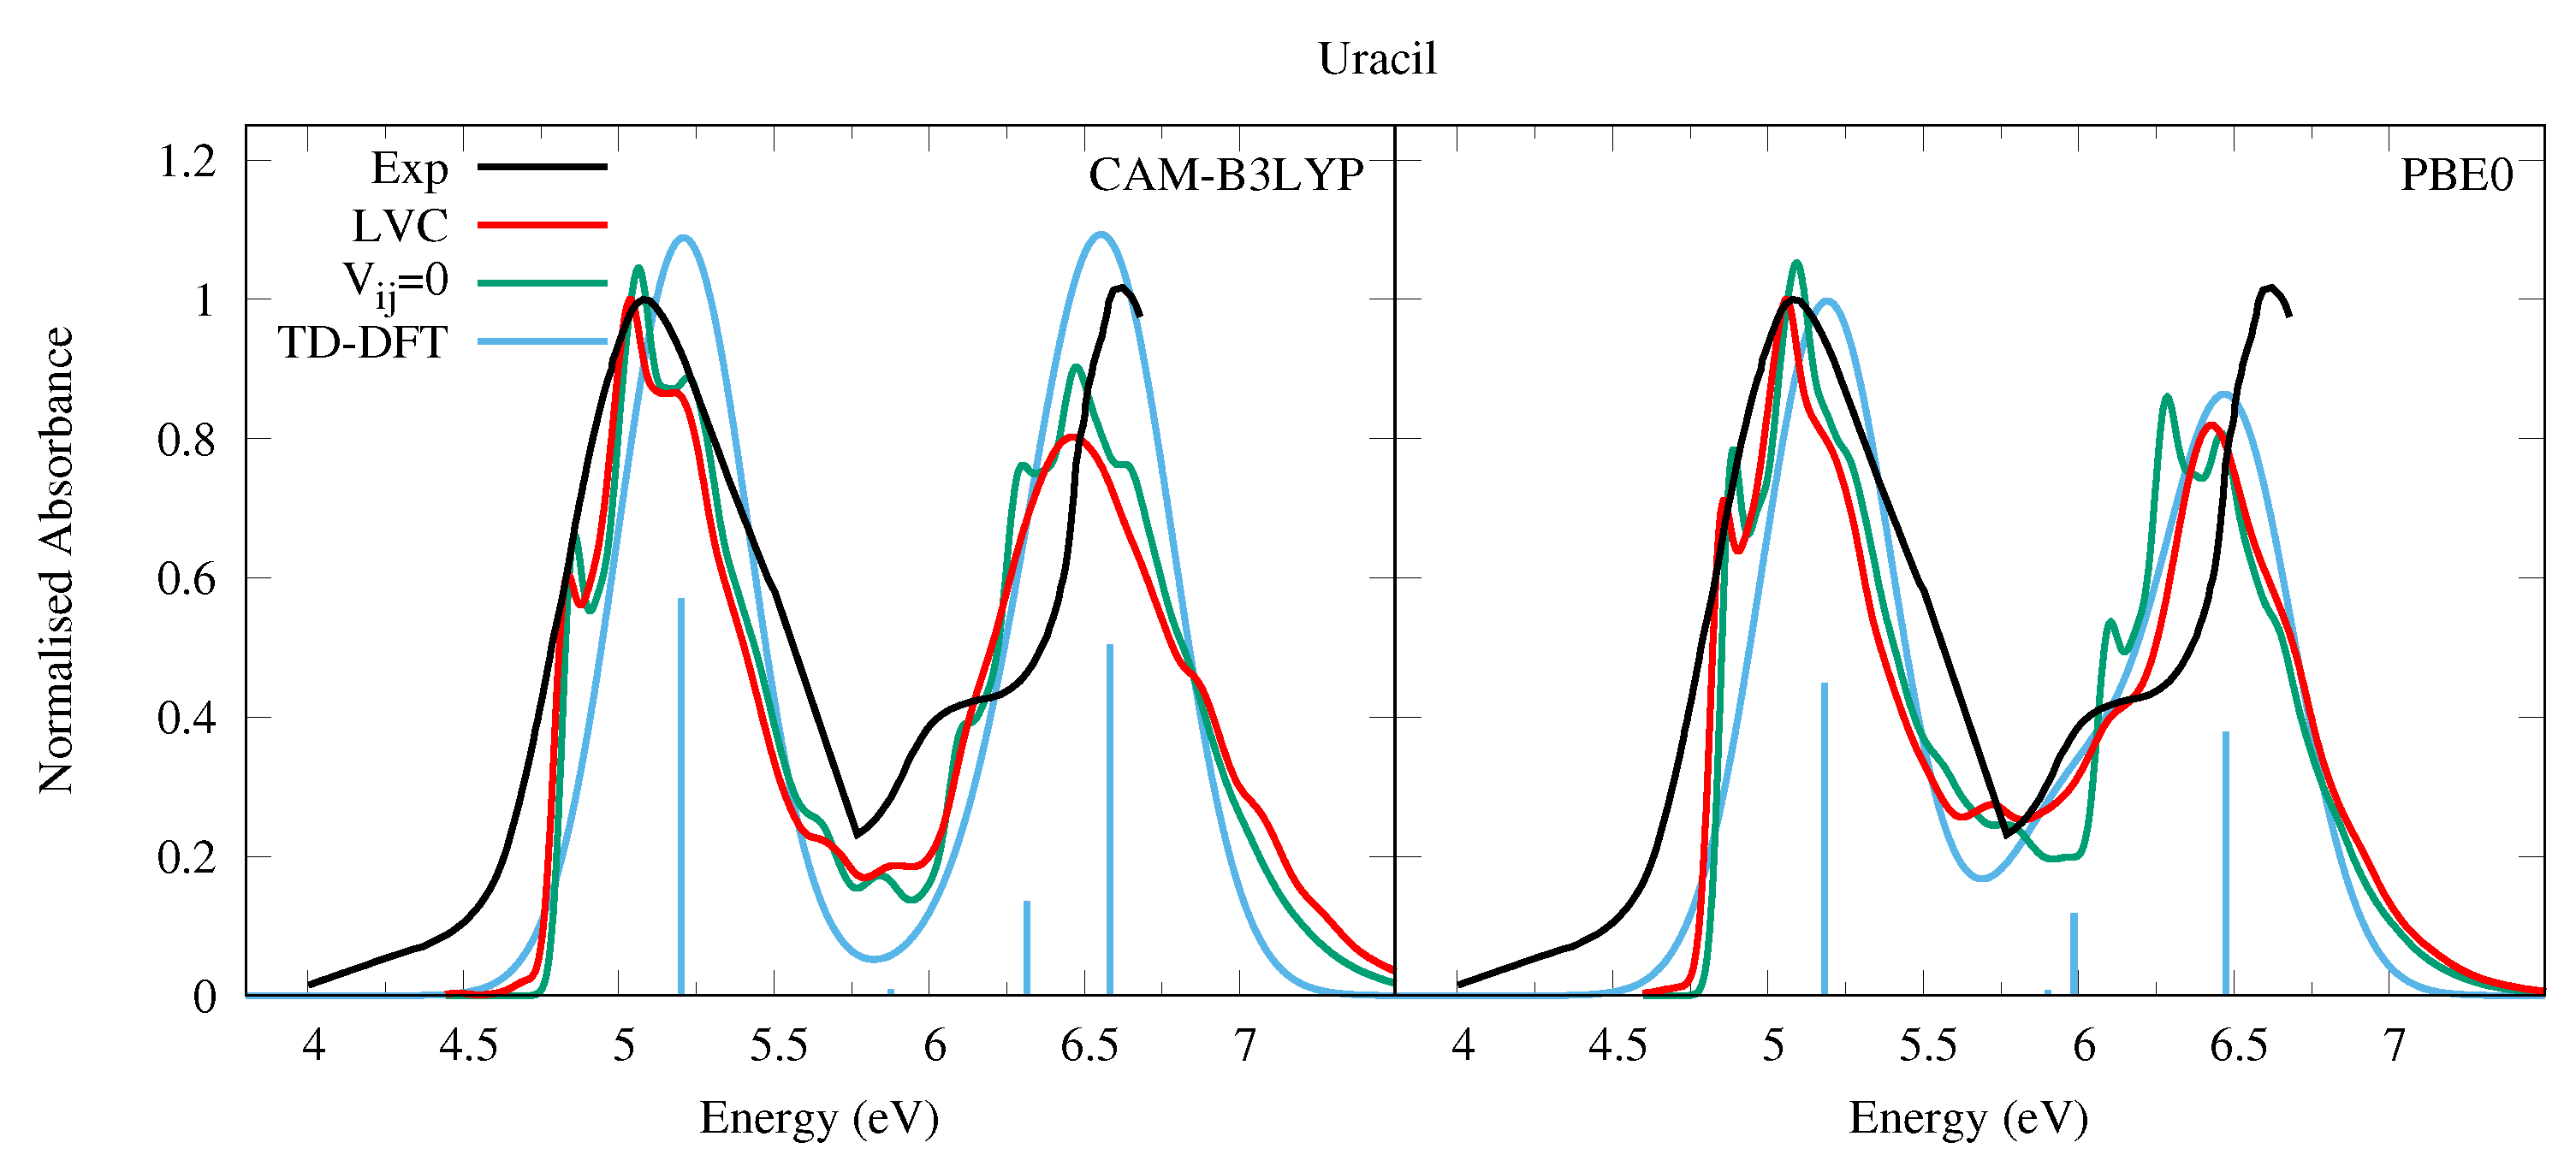
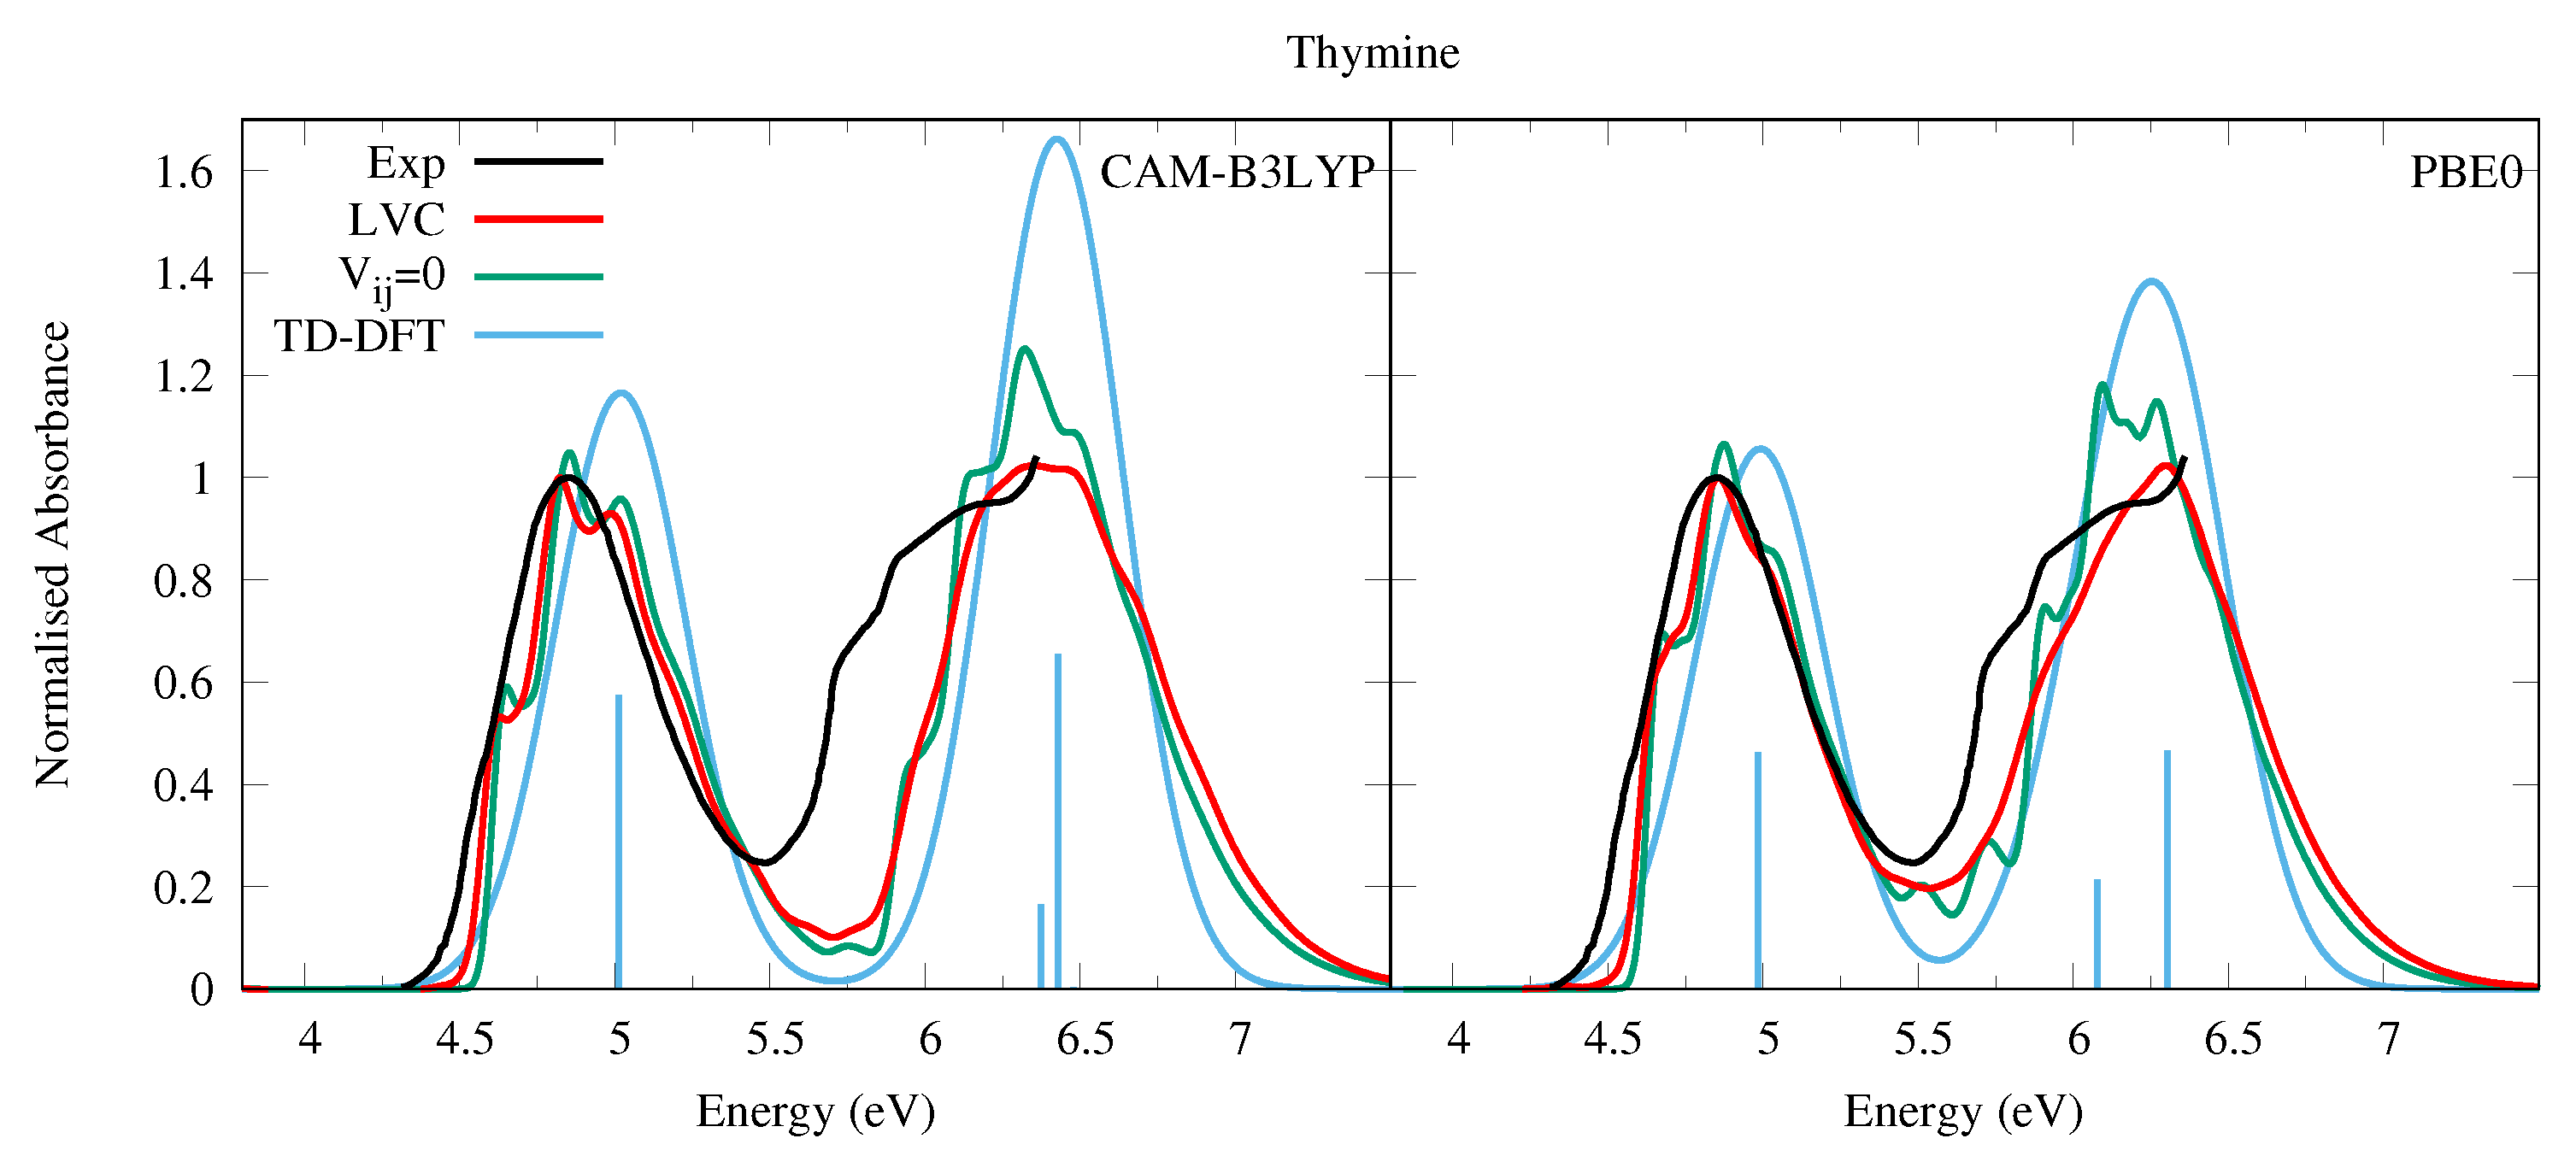
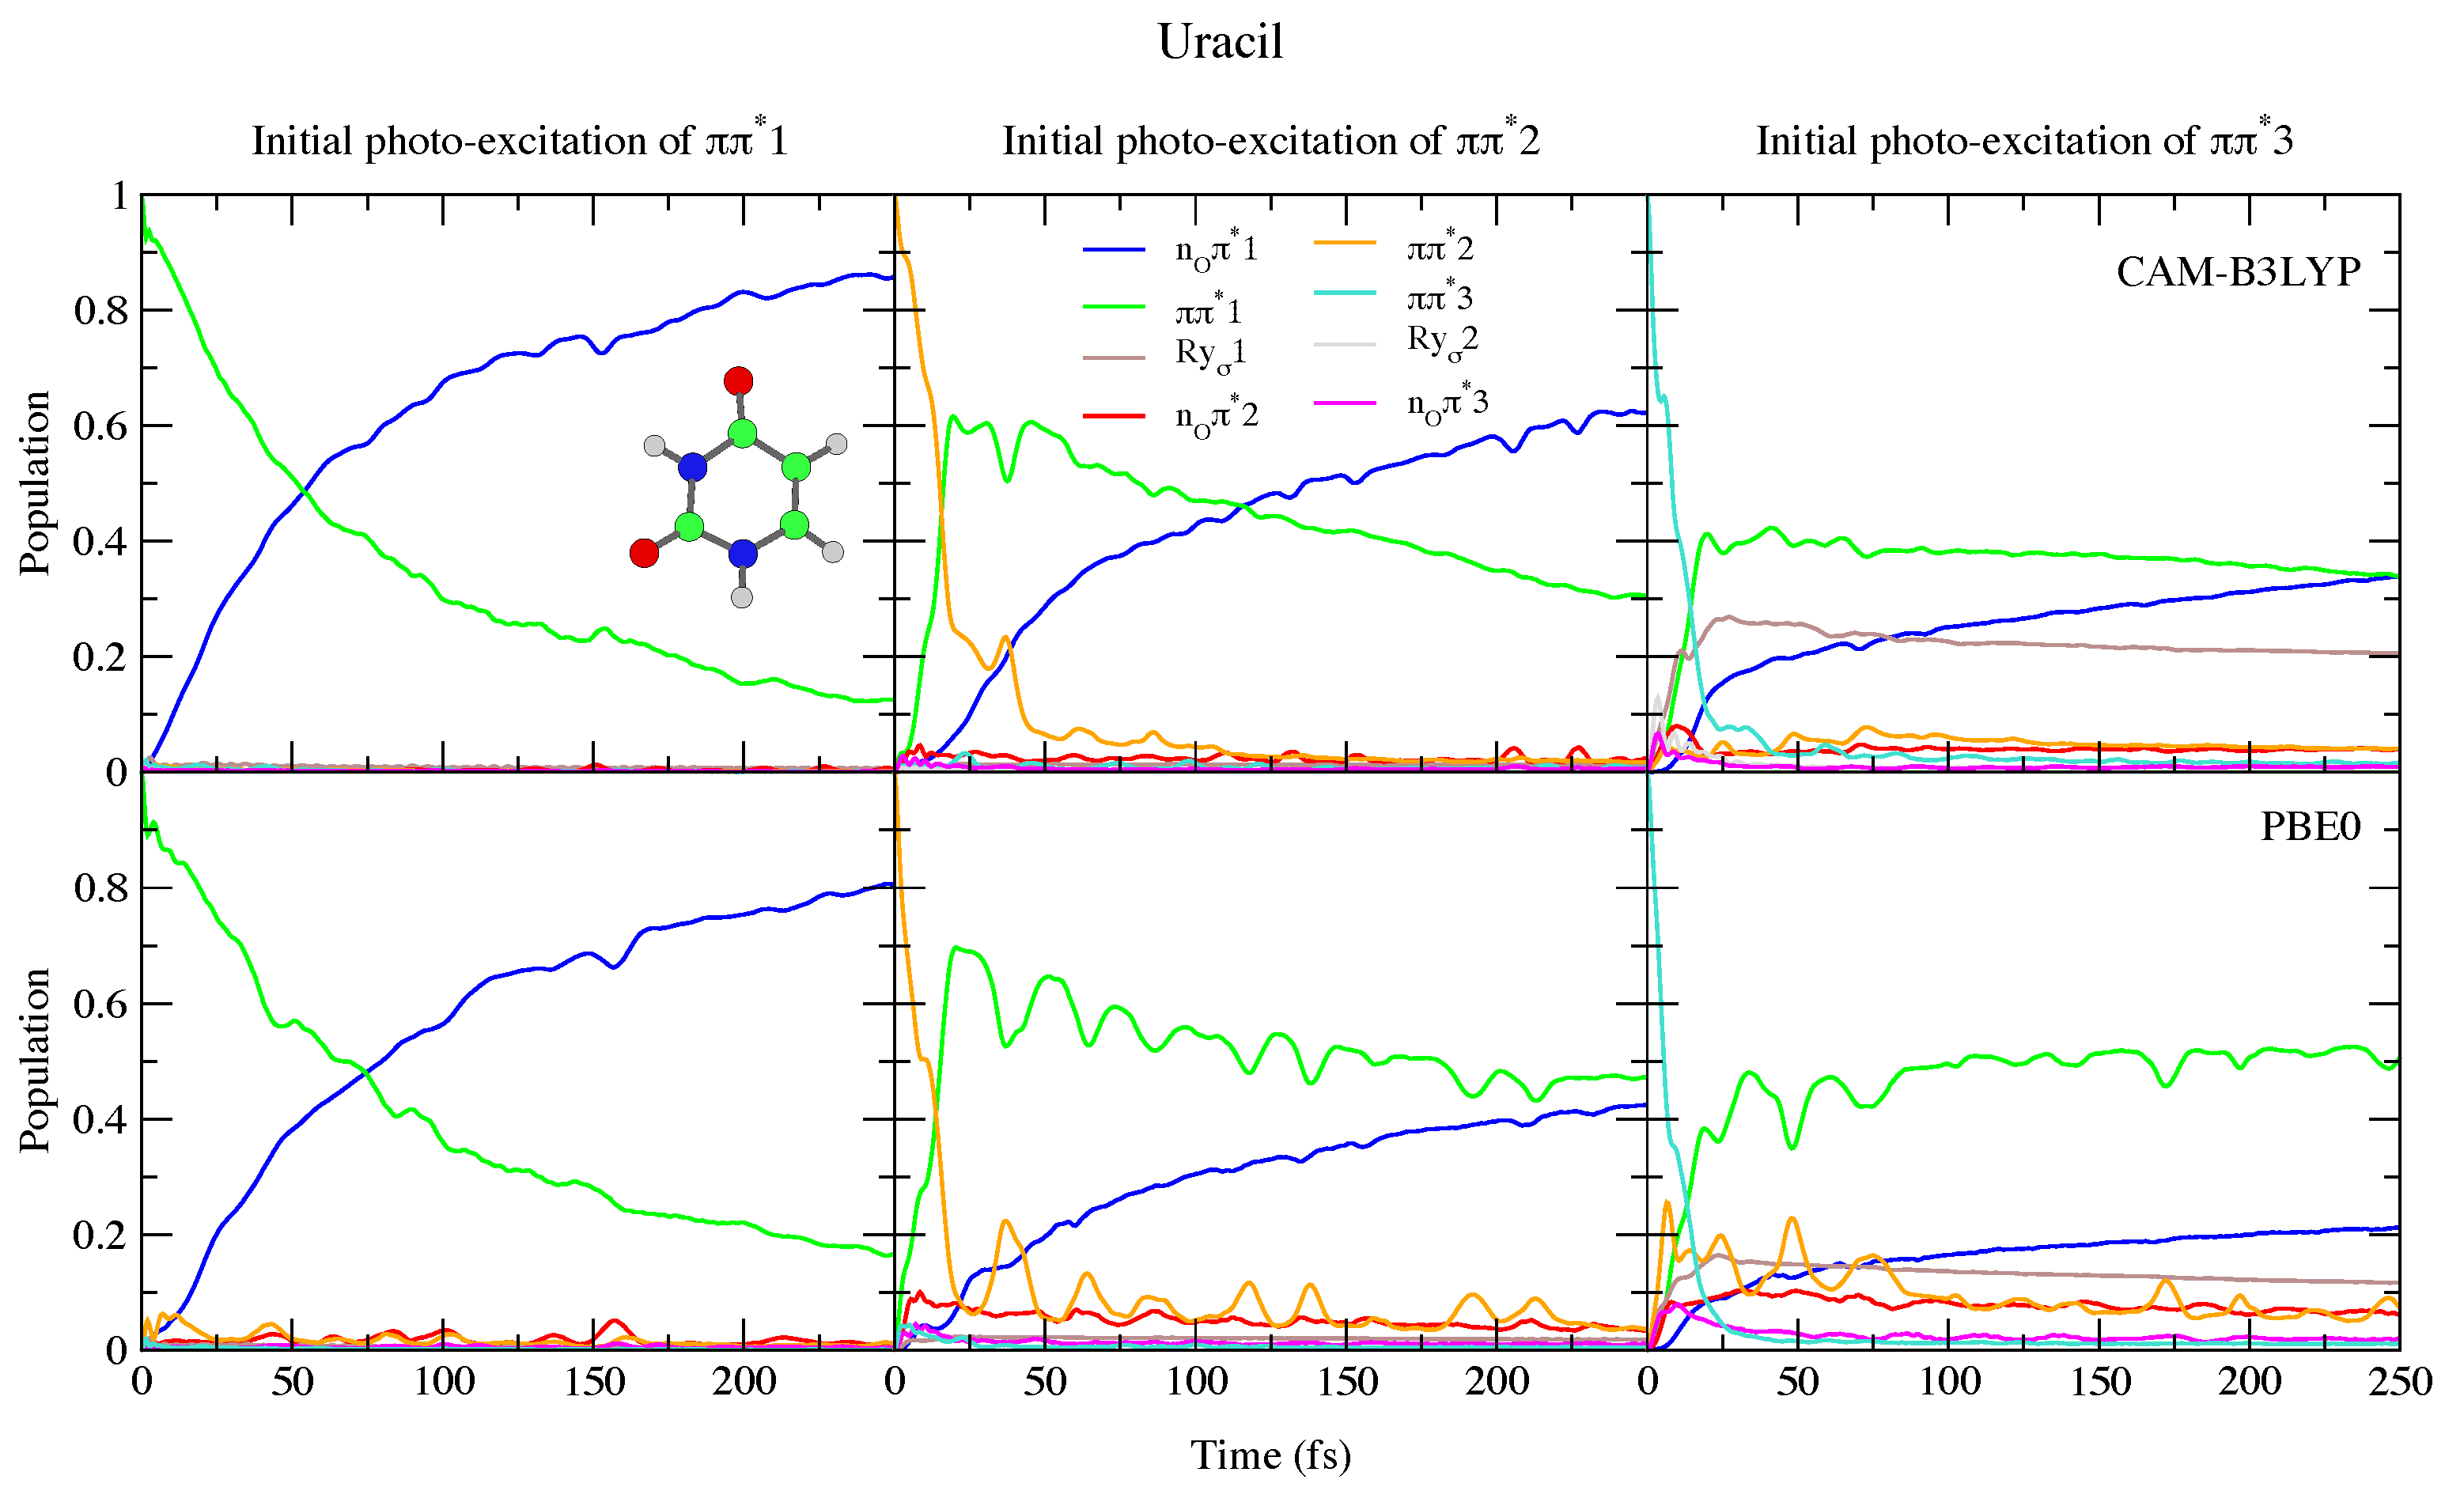
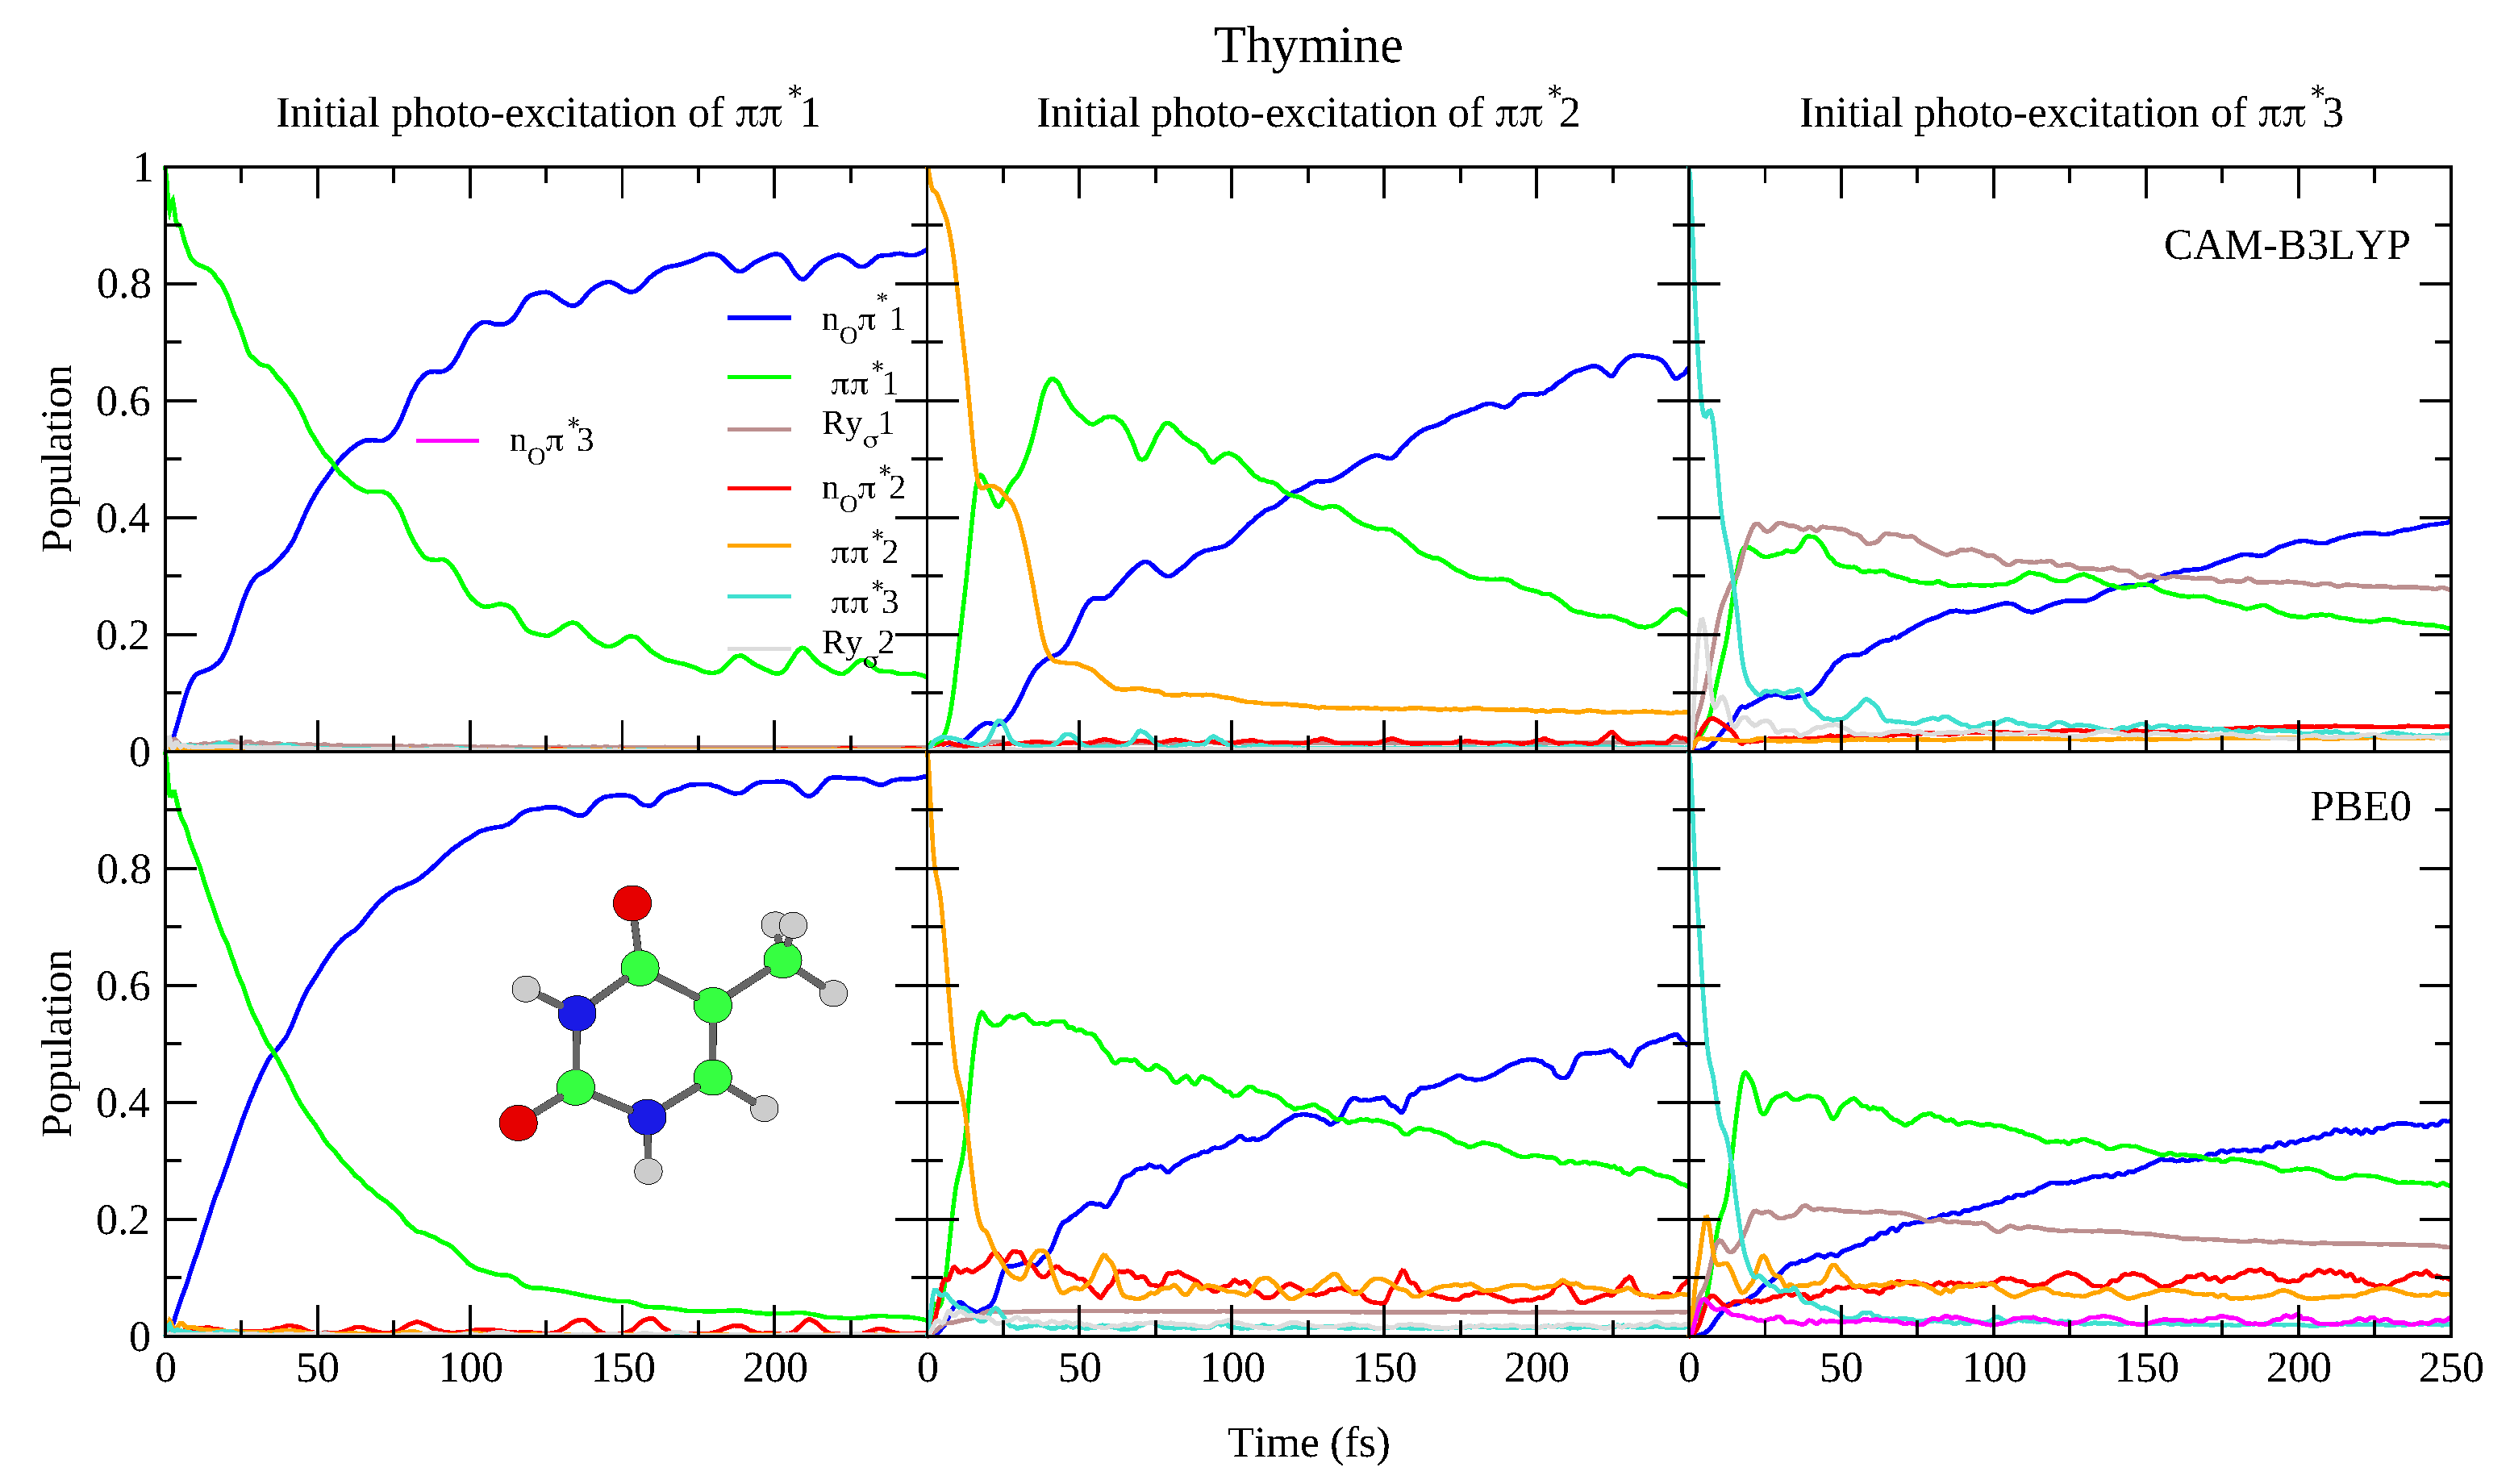
4.1.1. Uracil and Thymine
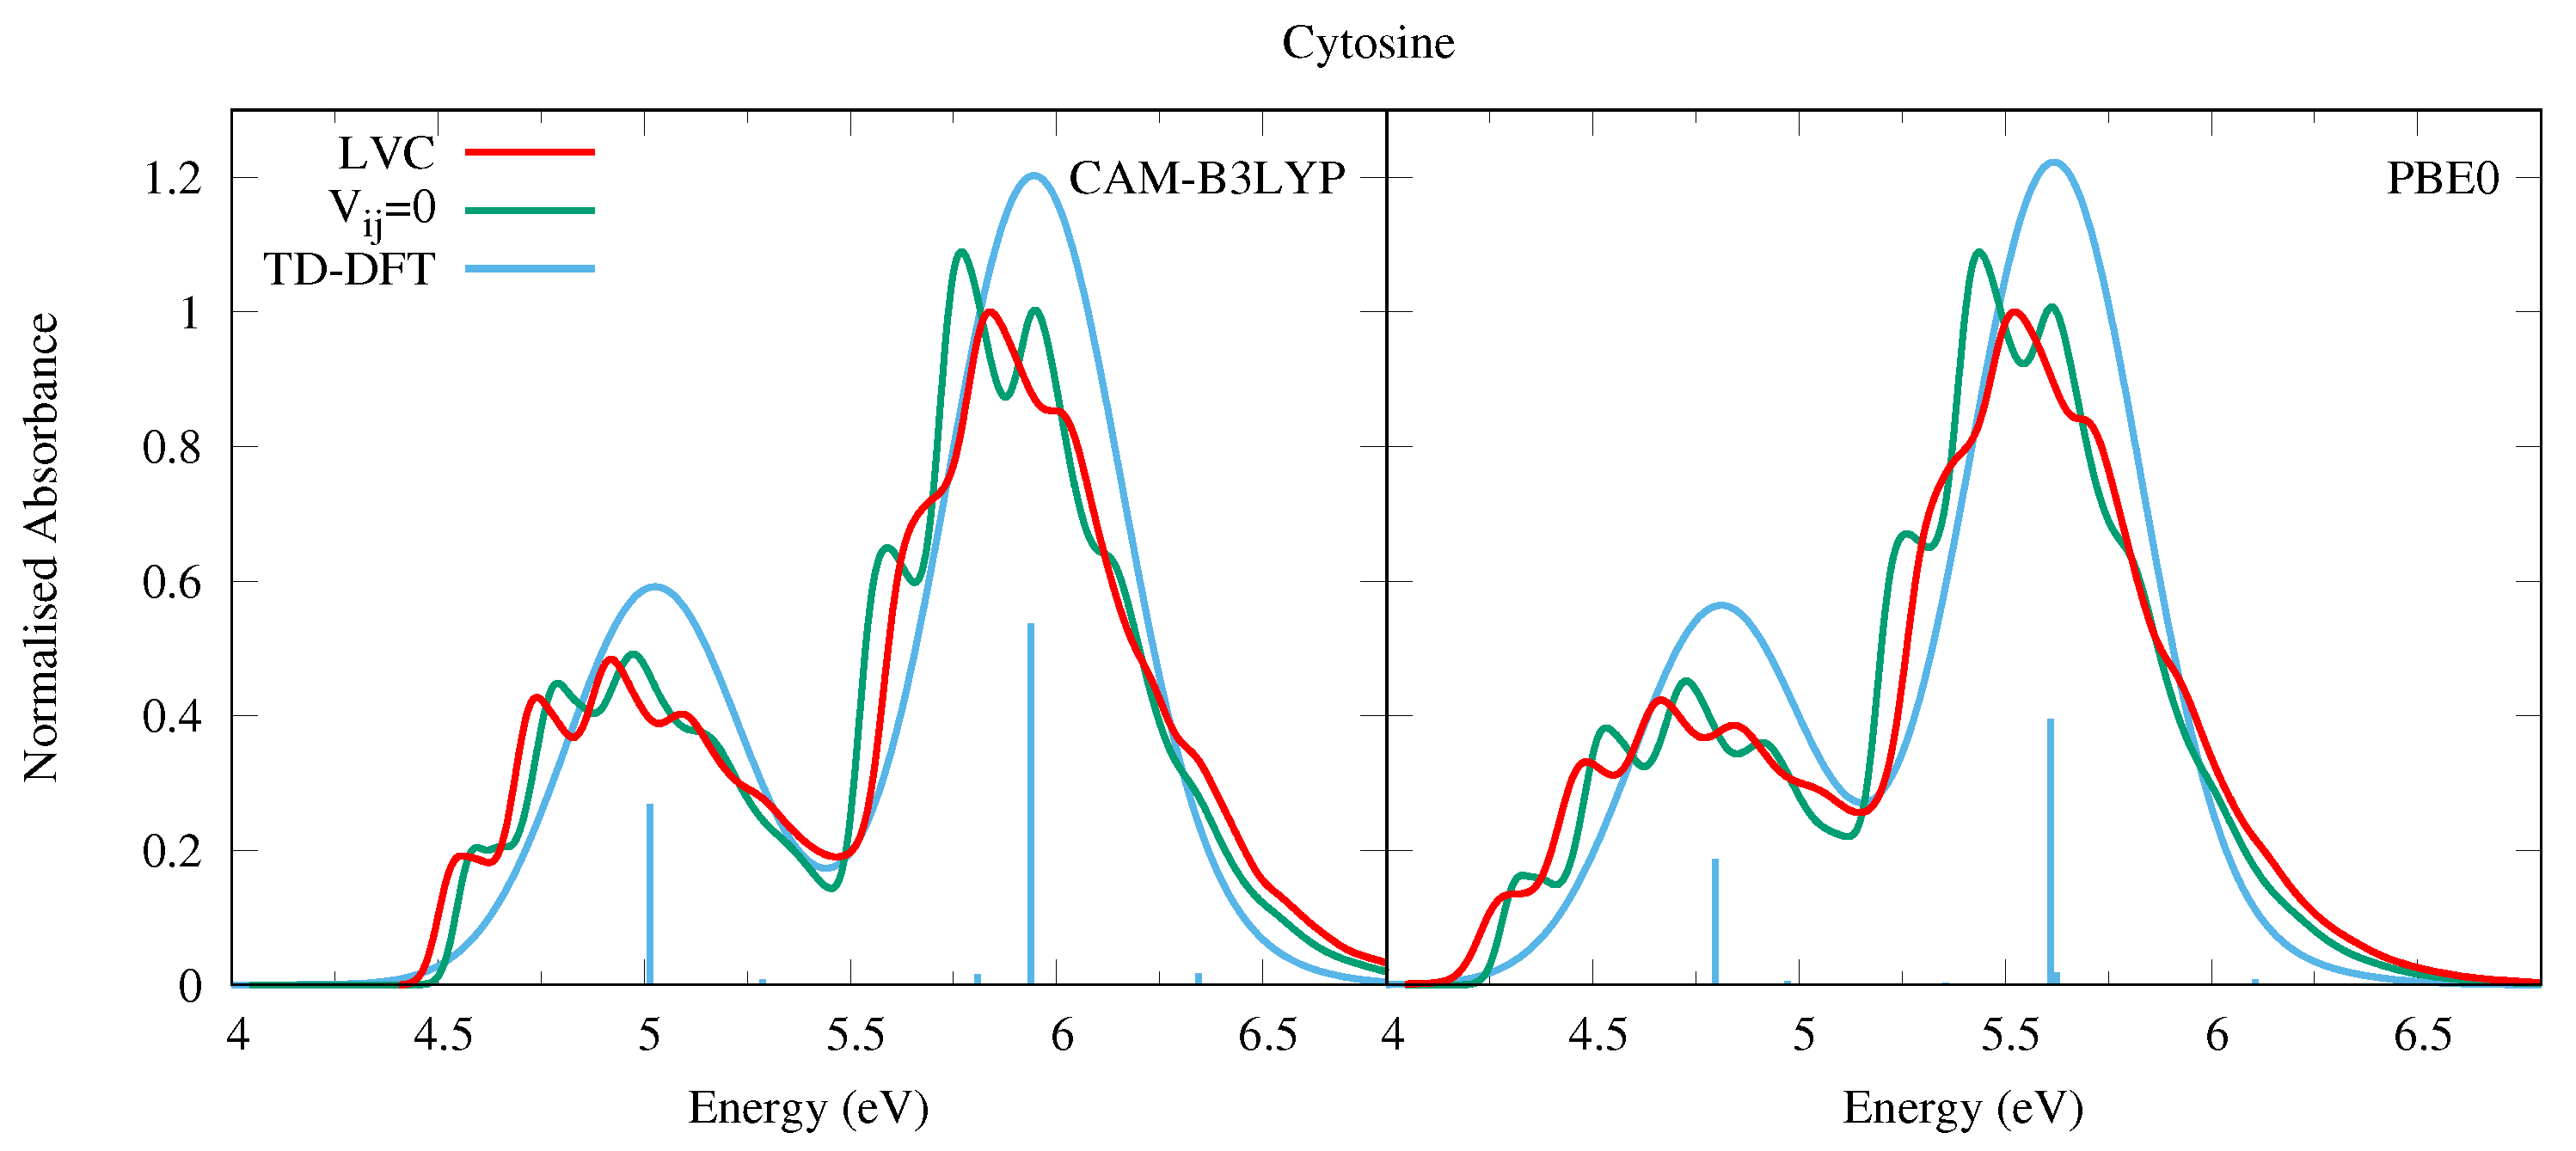
4.1.2. Cytosine
4.2. Purines
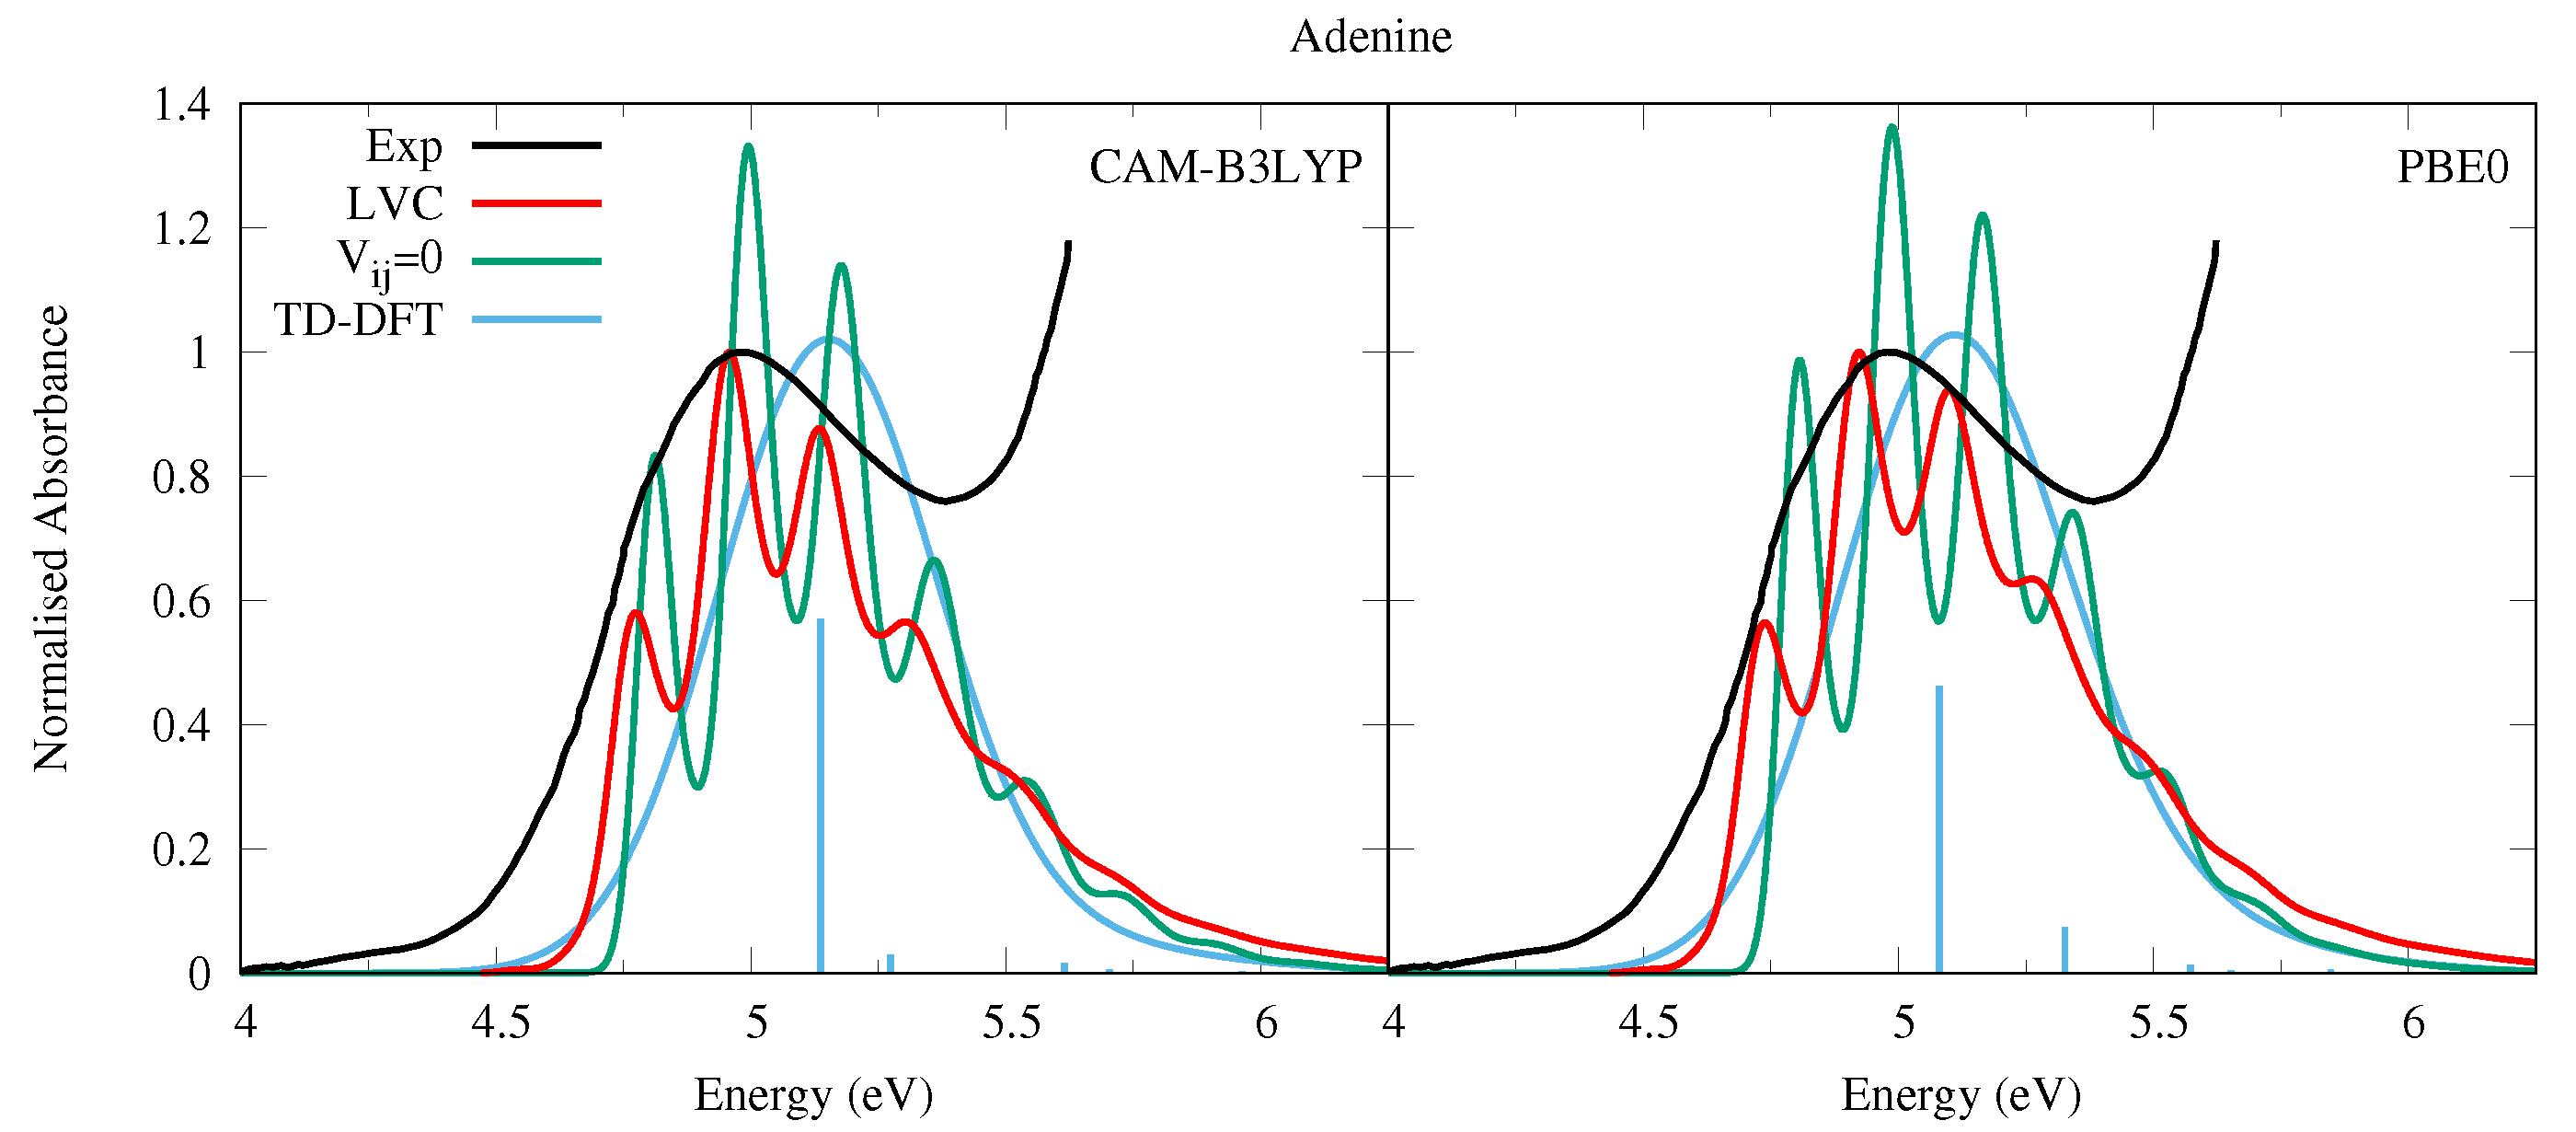
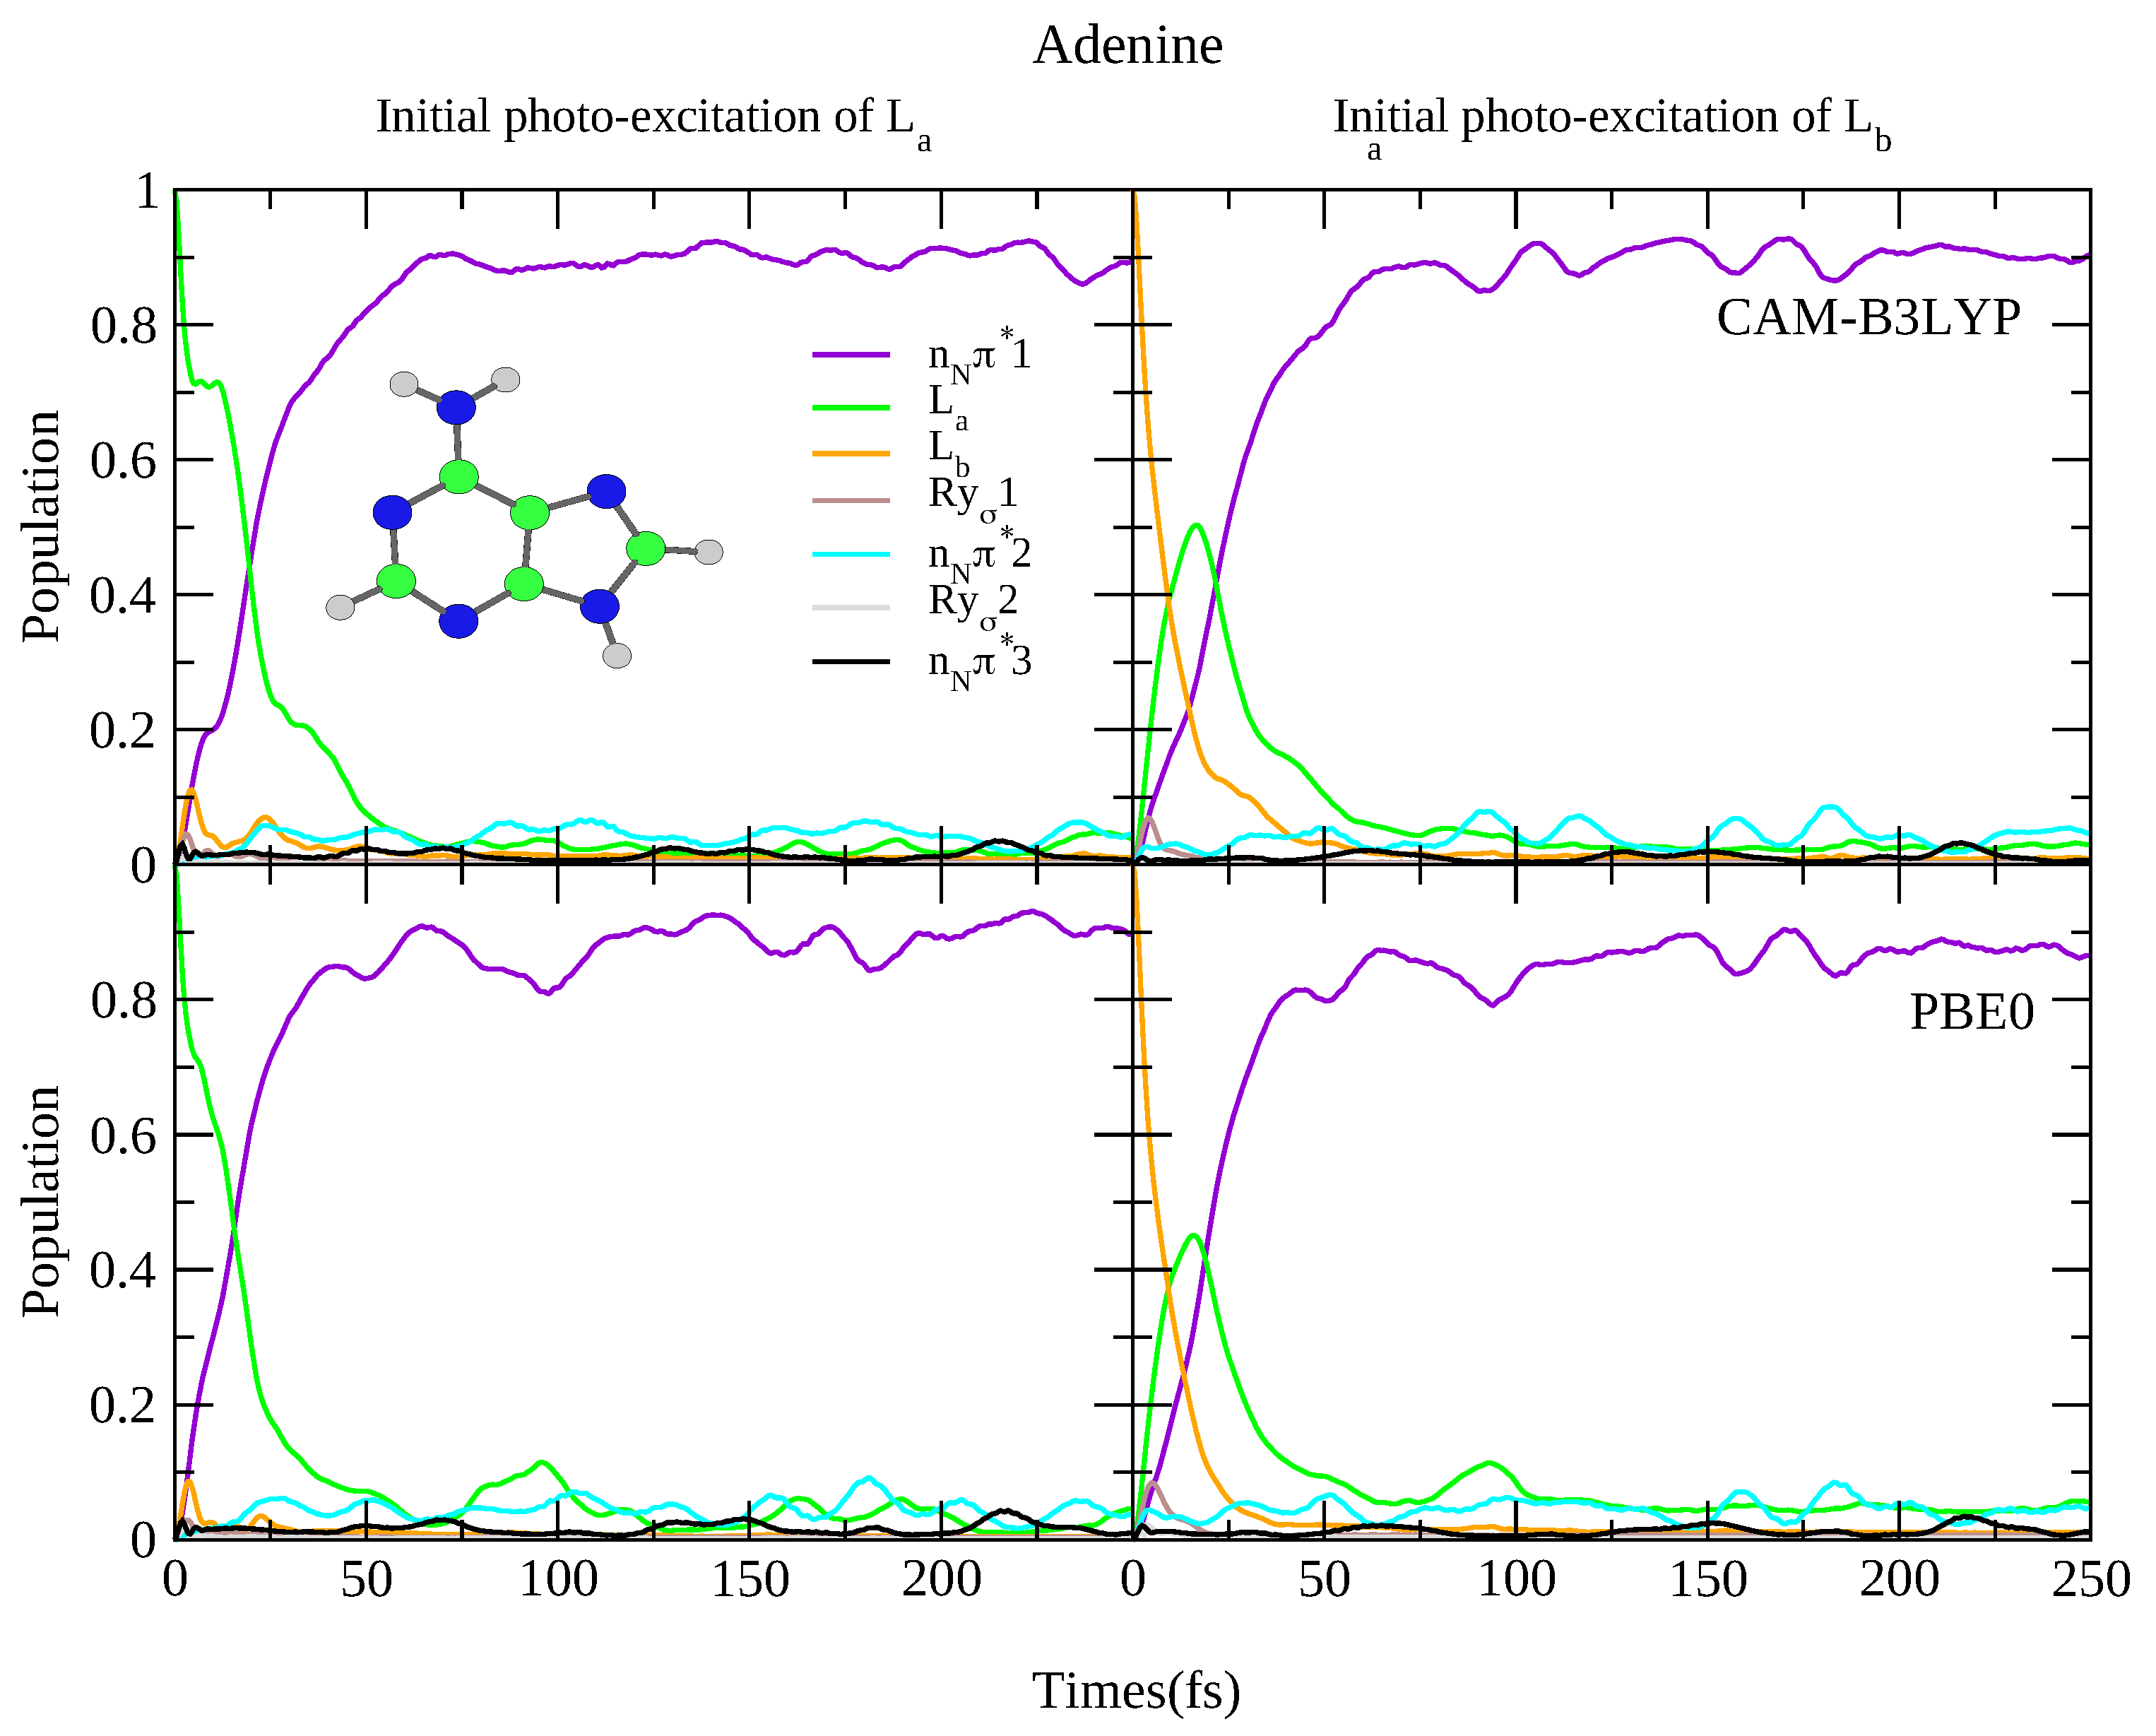
4.2.1. Adenine
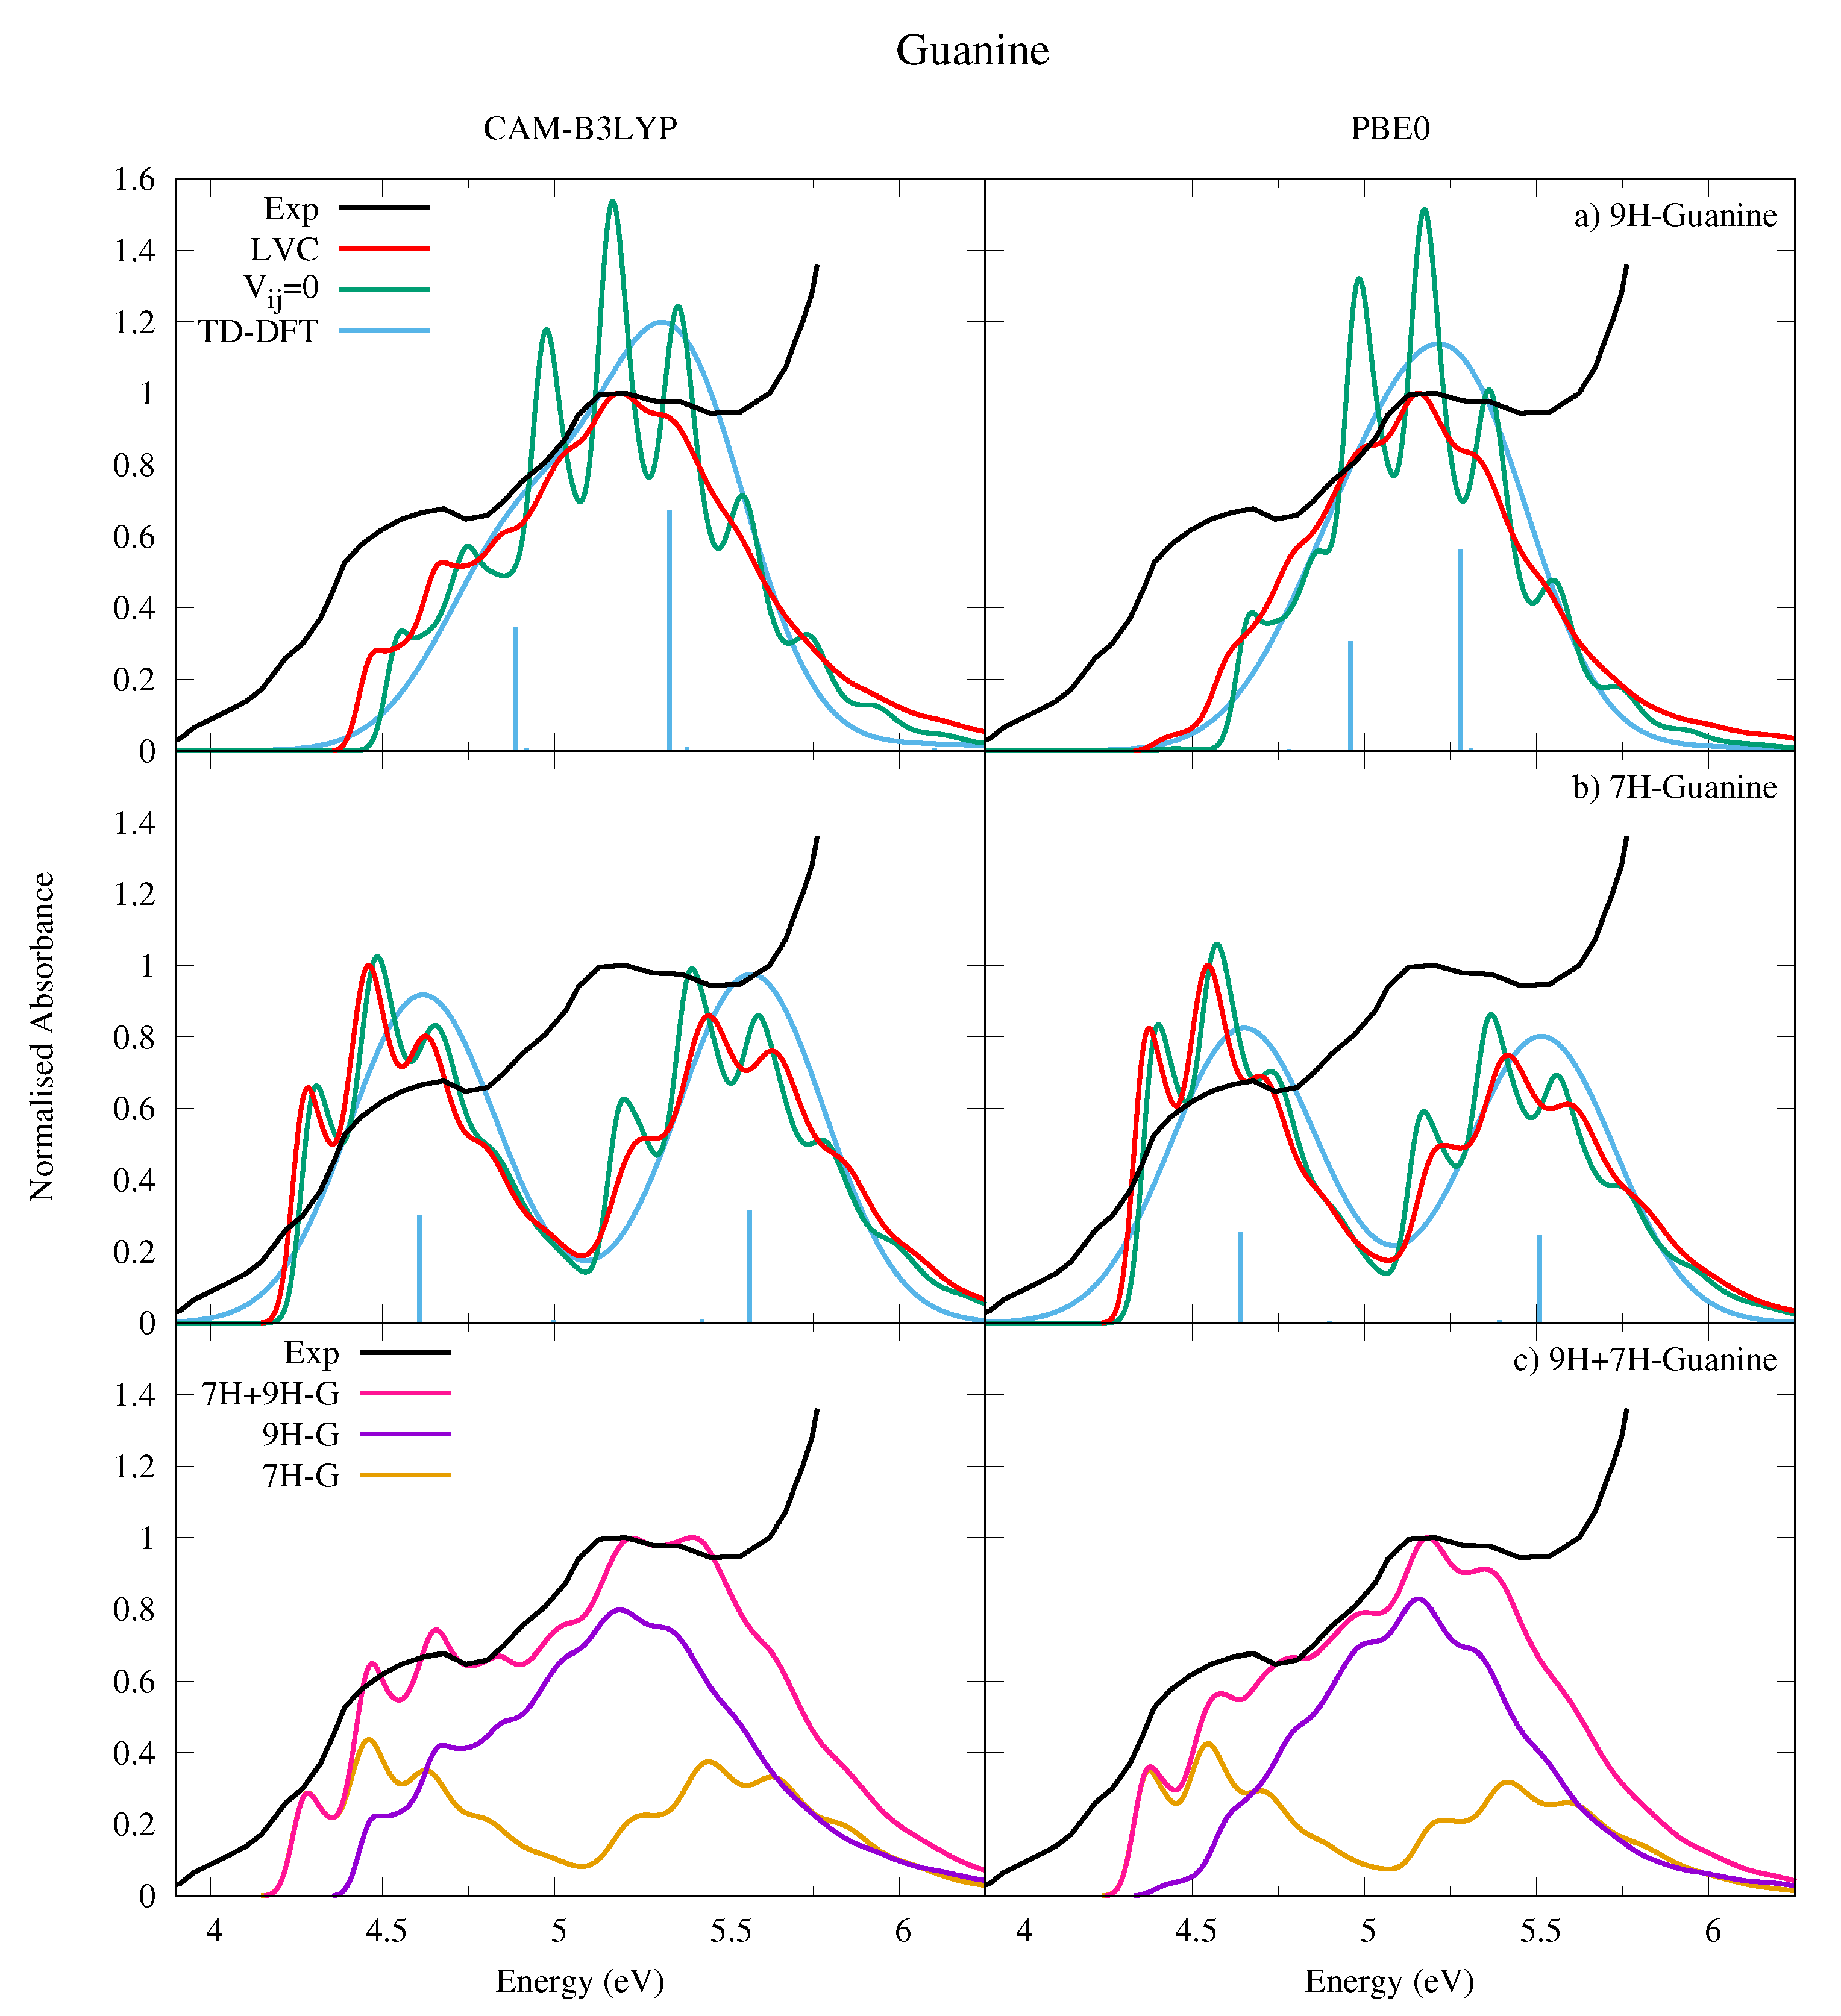
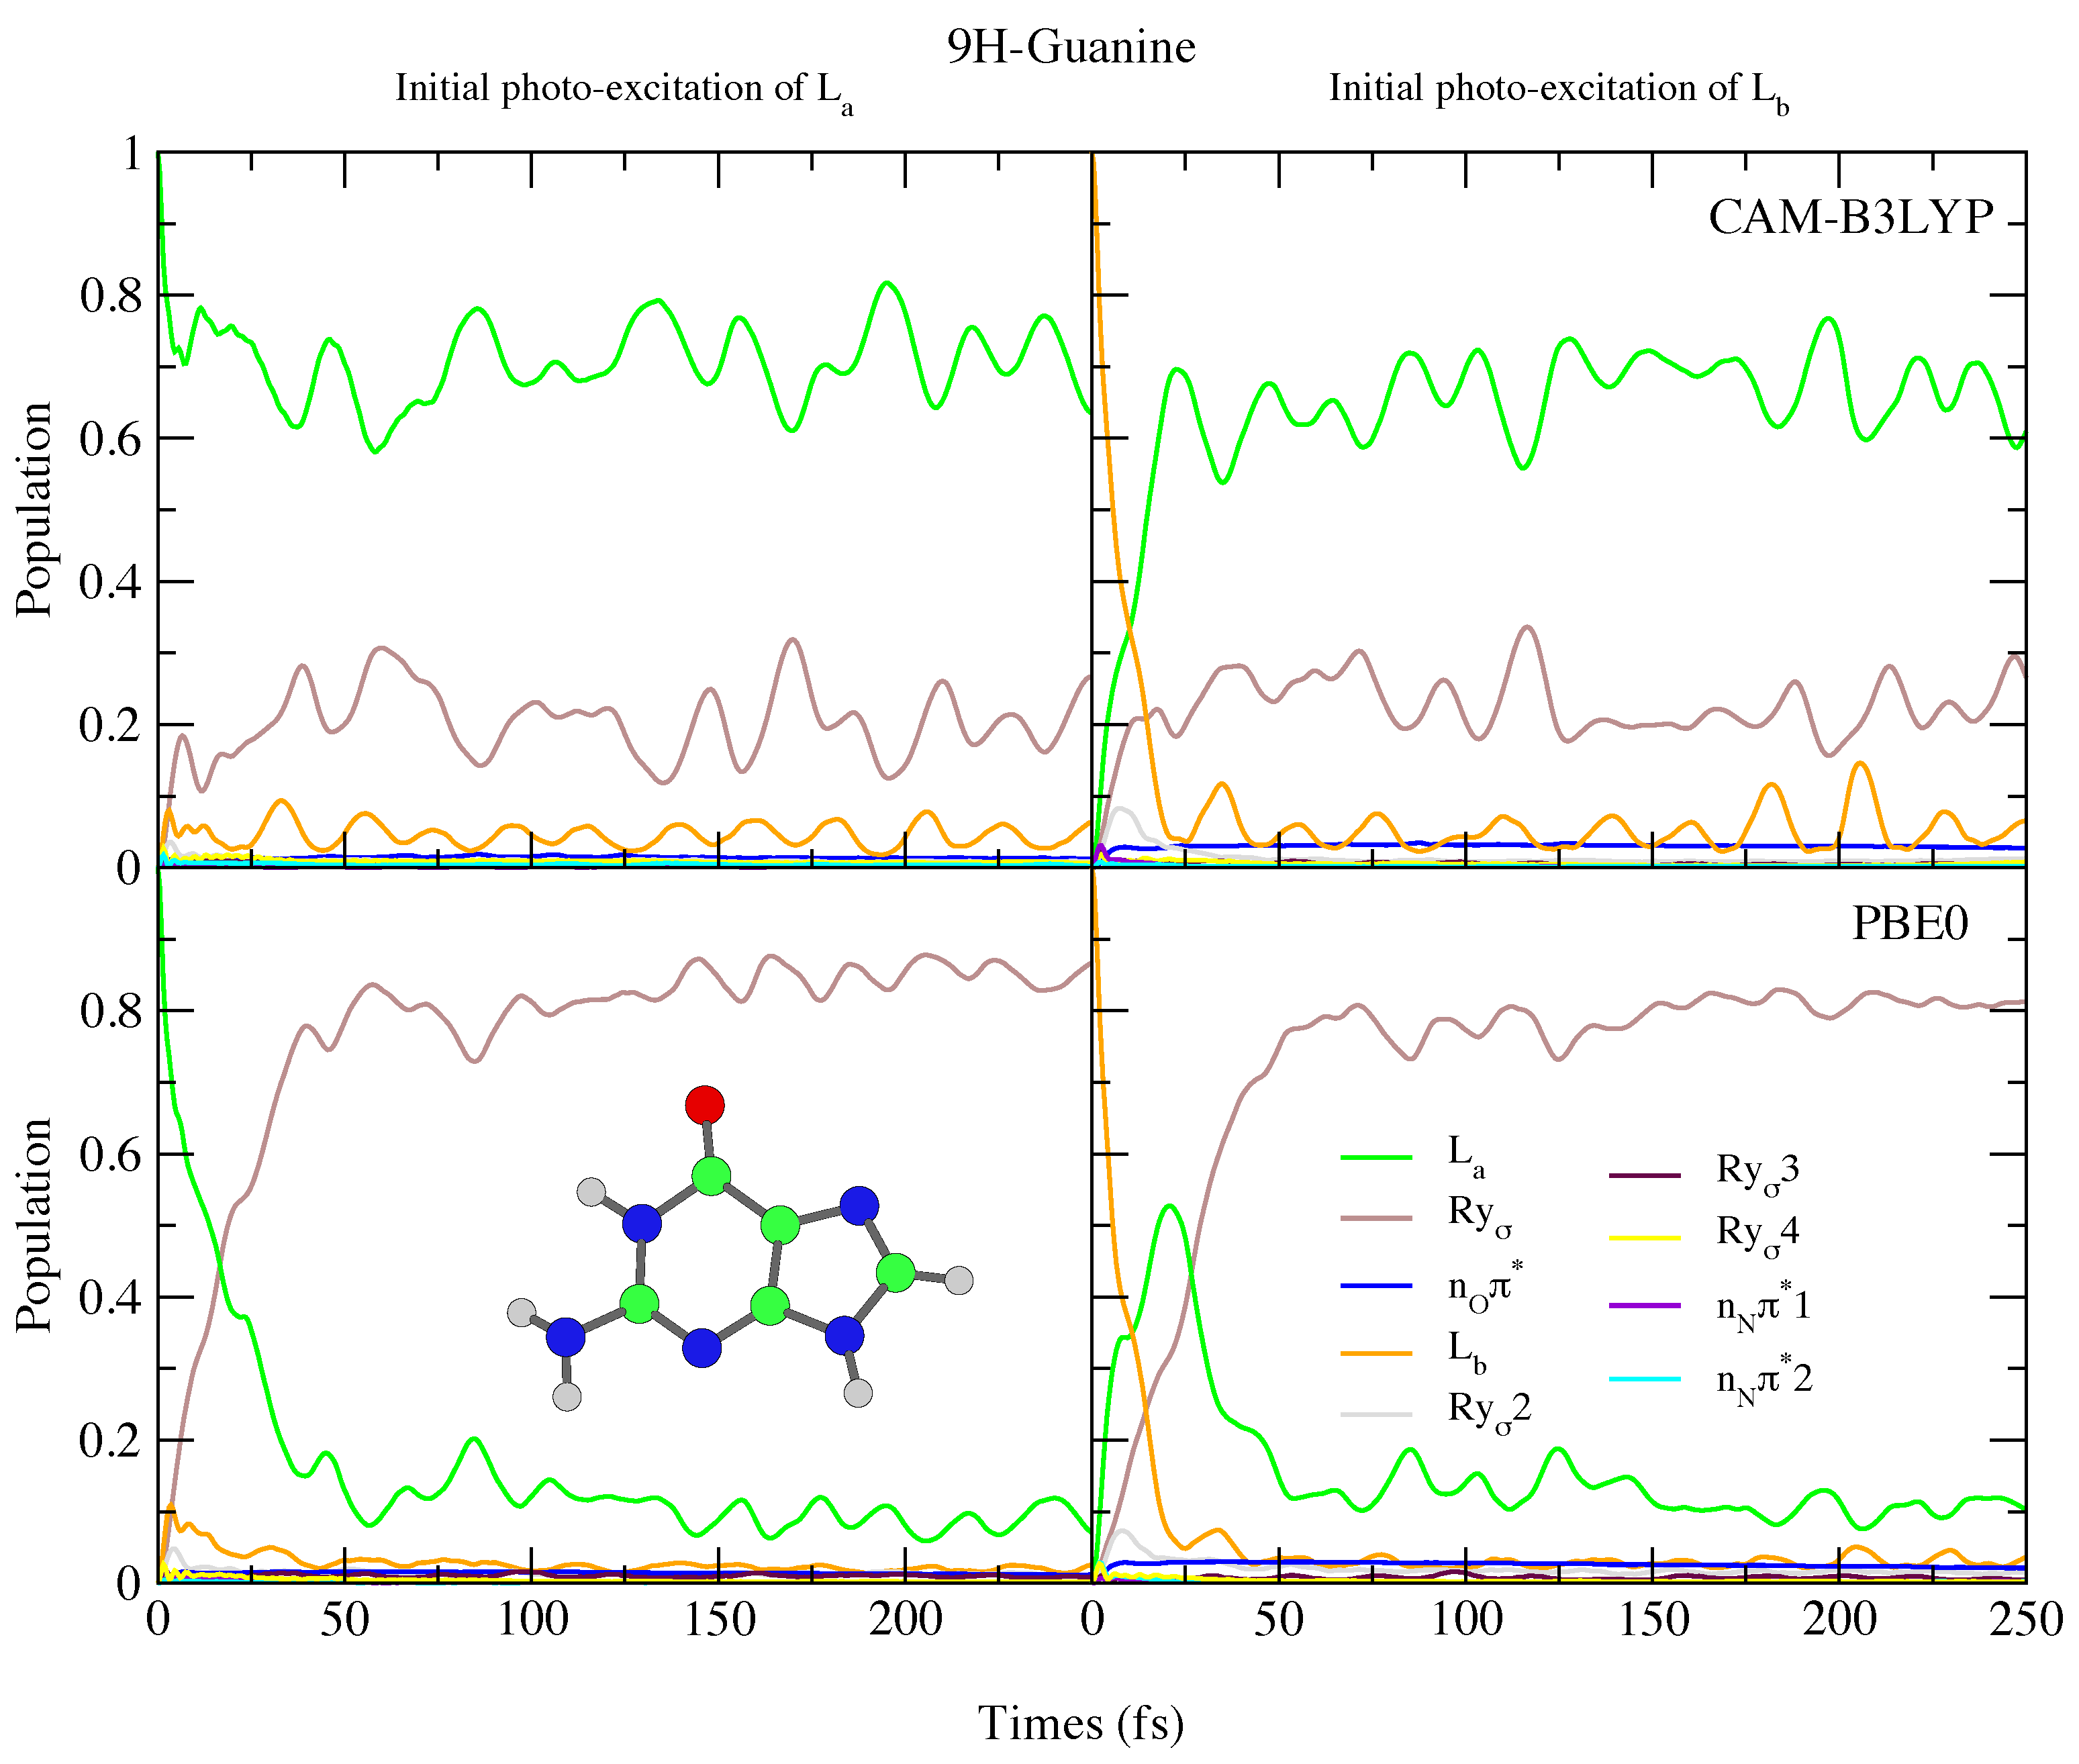
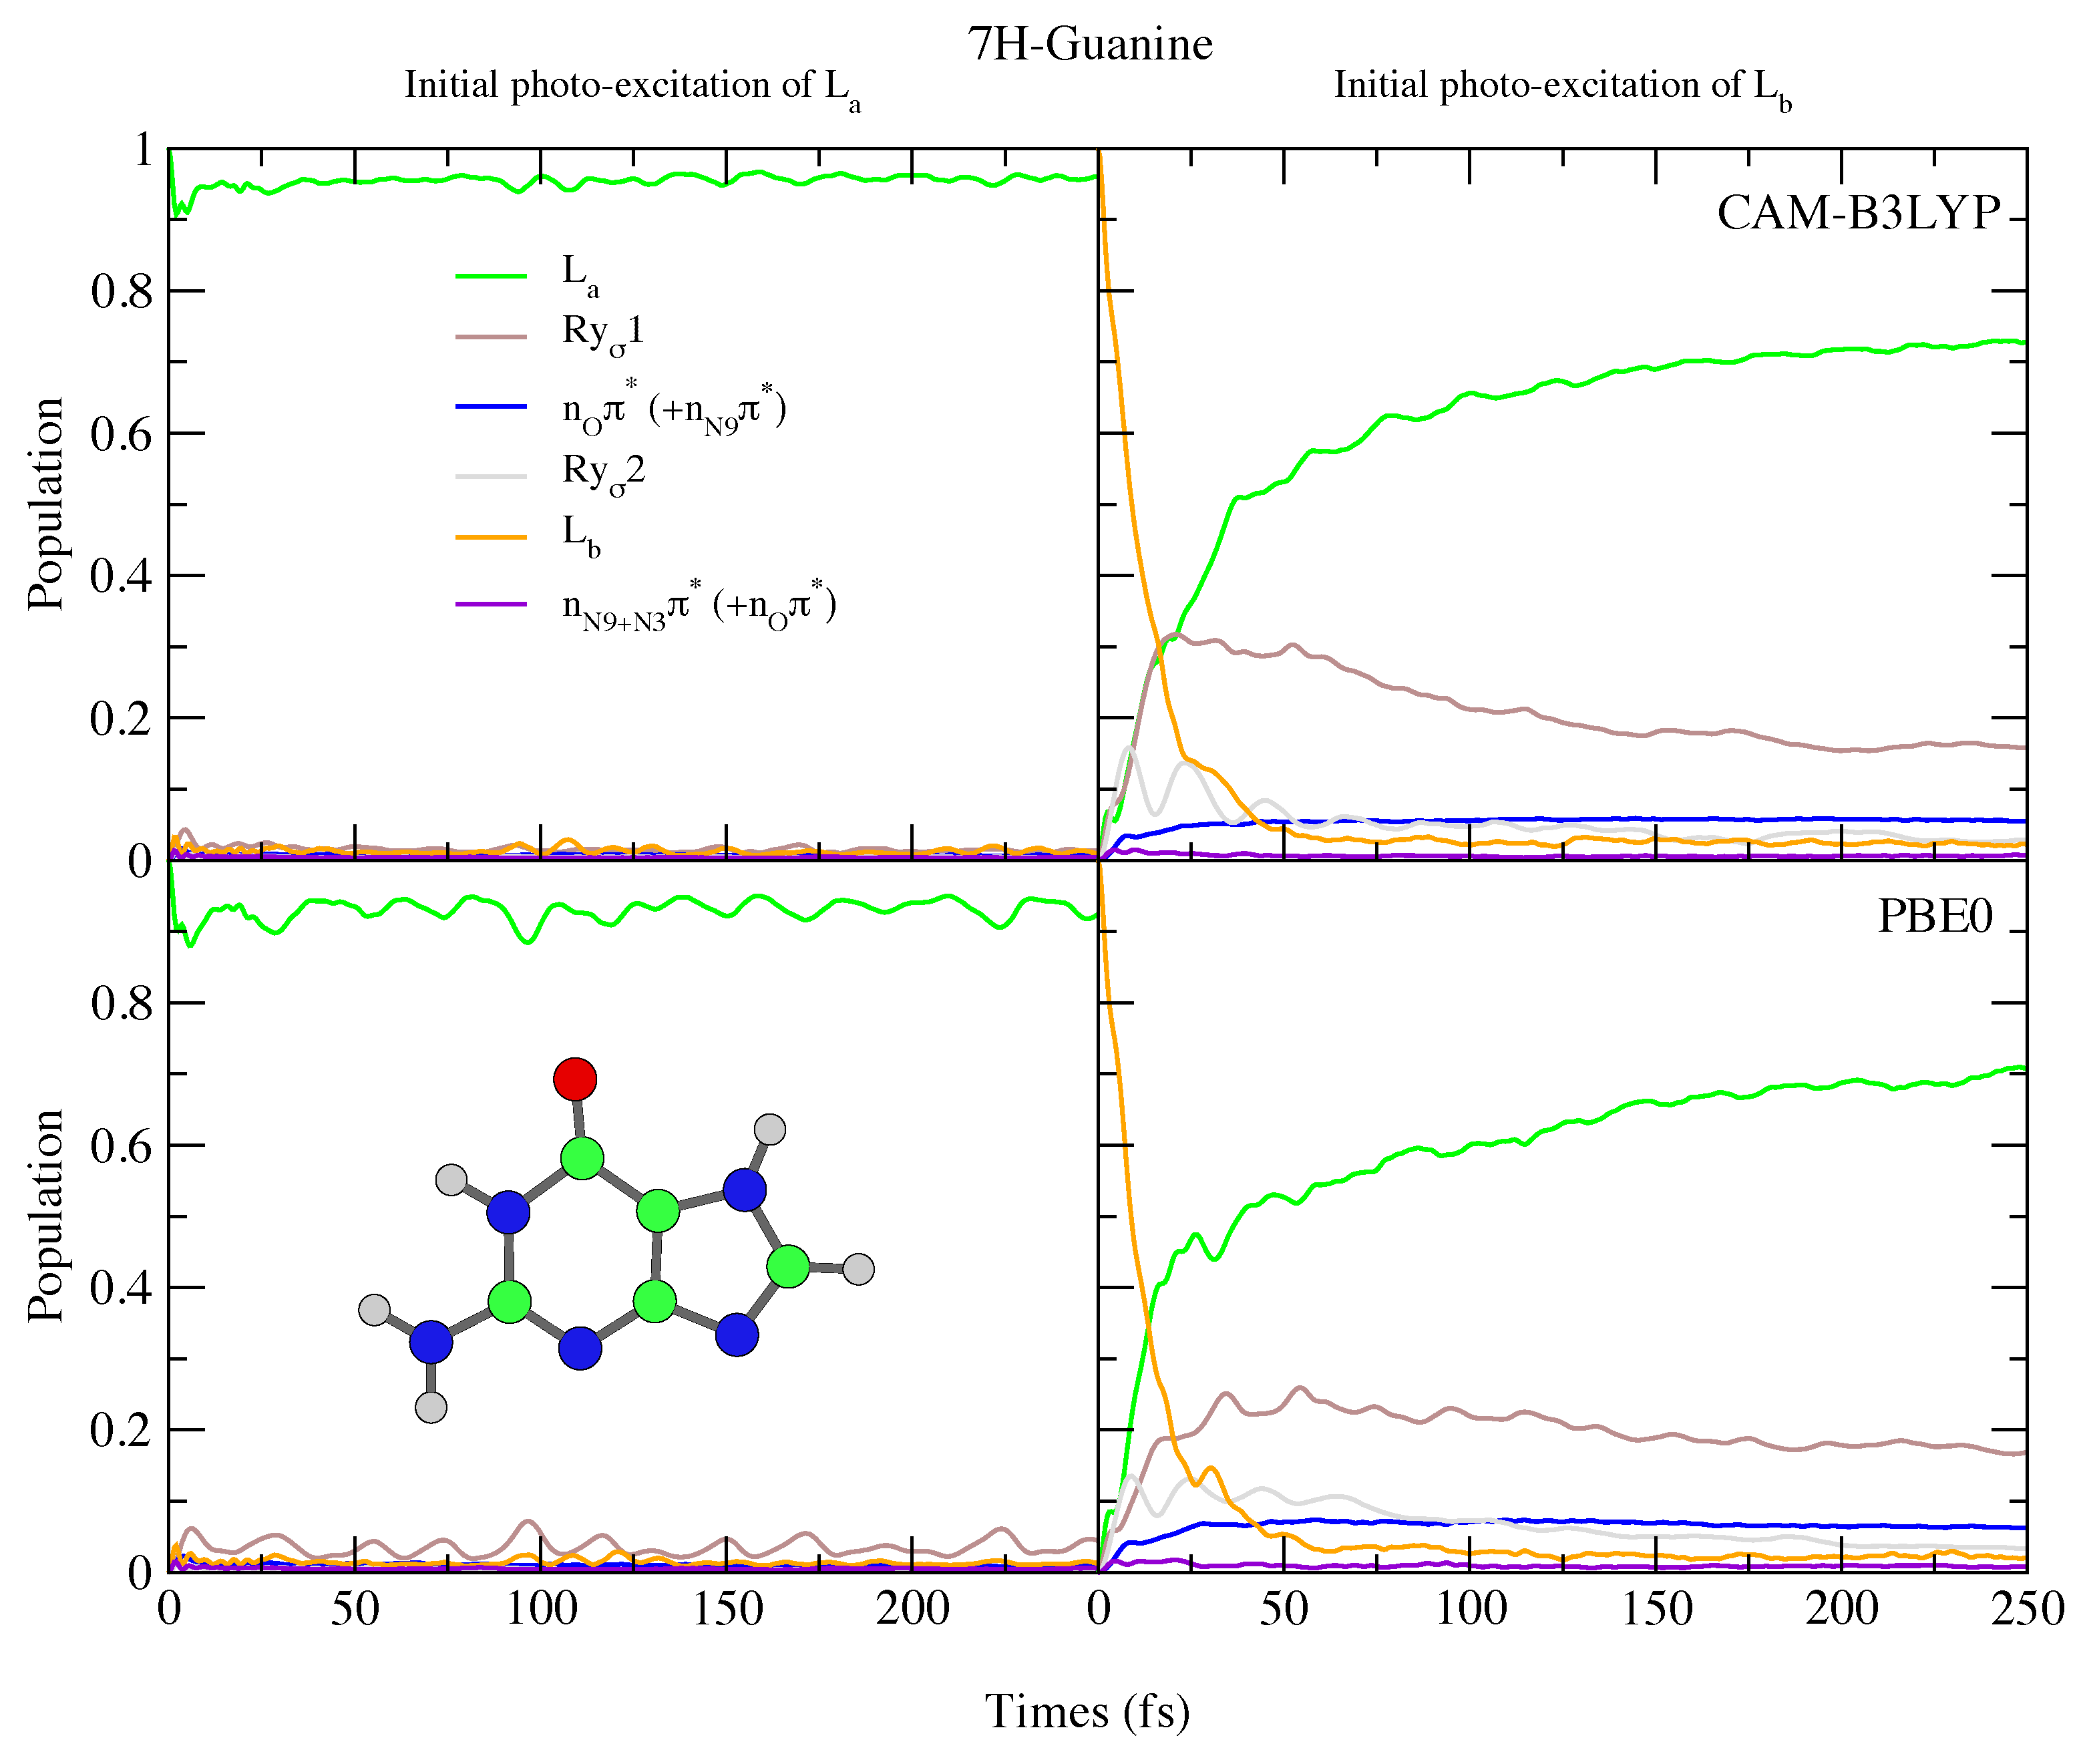
4.2.2. Guanine
5. Concluding Remarks
Supplementary Materials
Author Contributions
Funding
Institutional Review Board Statement
Informed Consent Statement
Data Availability Statement
Conflicts of Interest
References
- Improta, R.; Santoro, F.; Blancafort, L. Quantum mechanical studies on the Photophysics and the Photochemistry of nucleic acids and nucleobases. Chem. Rev. 2016, 116, 3540–3593. [Google Scholar] [CrossRef] [PubMed]
- Crespo-Hernández, C.E.; Cohen, B.; Hare, P.M.; Kohler, B. Ultrafast Excited-State Dynamics in Nucleic Acids. Chem. Rev. 2004, 104, 1977–2020. [Google Scholar] [CrossRef] [PubMed]
- Kleinermanns, K.; Nachtigallová, D.; de Vries, M.S. Excited state dynamics of DNA bases. Int. Rev. Phys. Chem. 2013, 32, 308–342. [Google Scholar] [CrossRef]
- Middleton, C.T.; de La Harpe, K.; Su, C.; Law, Y.K.; Crespo-Hernández, C.E.; Kohler, B. DNA Excited-State Dynamics: From Single Bases to the Double Helix. Ann. Rev. Phys. Chem. 2009, 60, 217–239. [Google Scholar] [CrossRef] [PubMed]
- Mai, S.; Richter, M.; Marquetand, P.; González, L. Excitation of Nucleobases from a Computational Perspective II: Dynamics. In Photoinduced Phenomena in Nucleic Acids I: Nucleobases in the Gas Phase and in Solvents; Barbatti, M., Borin, C.A., Ullrich, S., Eds.; Springer International Publishing: Cham, Switzerland, 2015; Volume 355, pp. 99–153. [Google Scholar]
- Liu, Y.; Martínez Fernández, L.; Cerezo, J.; Prampolini, G.; Improta, R.; Santoro, F. Multistate coupled quantum dynamics of photoexcited cytosine in gas-phase: Nonadiabatic absorption spectrum and ultrafast internal conversions. Chem. Phys. 2018, 515, 452–463. [Google Scholar] [CrossRef]
- Santoro, F.; Improta, R.; Lami, A.; Bloino, J.; Barone, V. Effective method to compute Franck-Condon integrals for optical spectra of large molecules in solution. J. Chem. Phys. 2007, 126, 084509. [Google Scholar] [CrossRef]
- Dierksen, M.; Grimme, S. An efficient approach for the calculation of Franck–Condon integrals of large molecules. J. Chem. Phys. 2005, 122, 244101. [Google Scholar] [CrossRef] [PubMed]
- Hazra, A.; Nooijen, M. Vibronic coupling in the excited cationic states of ethylene: Simulation of the photoelectron spectrum between 12 and 18 eV. J. Chem. Phys. 2005, 122, 204327. [Google Scholar] [CrossRef]
- Ianconescu, R.; Pollak, E. Photoinduced Cooling of Polyatomic Molecules in an Electronically Excited State in the Presence of Dushinskii Rotations. J. Phys. Chem. A 2004, 108, 7778–7784. [Google Scholar] [CrossRef]
- Peng, Q.; Niu, Y.; Deng, C.; Shuai, Z. Vibration correlation function formalism of radiative and non-radiative rates for complex molecules. Chem. Phys. 2010, 370, 215–222. [Google Scholar] [CrossRef]
- Baiardi, A.; Bloino, J.; Barone, V. General Time Dependent Approach to Vibronic Spectroscopy Including Franck-Condon, Herzberg-Teller, and Duschinsky Effects. J. Chem. Theory Comput. 2013, 9, 4097–4115. [Google Scholar] [CrossRef] [PubMed]
- Avila Ferrer, F.A.; Cerezo, J.; Soto, J.; Improta, R.; Santoro, F. First-principle computation of absorption and fluorescence spectra in solution accounting for vibronic structure, temperature effects and solvent inhomogenous broadening. Computat. Theor. Chem. 2014, 1040–1041, 328–337. [Google Scholar] [CrossRef]
- Borrelli, R.; Capobianco, A.; Peluso, A. Generating Function Approach to the Calculation of Spectral Band Shapes of Free-Base Chlorin Including Duschinsky and Herzberg-Teller Effects. J. Phys. Chem. A 2012, 116, 9934–9940. [Google Scholar] [CrossRef] [PubMed]
- Huh, J.; Berger, R. Coherent state-based generating function approach for Franck-Condon transitions and beyond. J. Phys. Conf. Ser. 2012, 380, 012019. [Google Scholar] [CrossRef]
- Köppel, H.; Domcke, W.; Cederbaum, L.S. Multi-mode Molecular Dynamics Beyond the Born-Oppenheimer Approximation. Adv. Chem. Phys. 1984, 57, 59. [Google Scholar]
- Köppel, H.; Domcke, W.; Cederbaum, L. The Multi-mode vibronic-coupling approach. In Conical Intersections, Electronic Structure, Dynamics and Spectroscopy; Domcke, W., Yarkony, R., Köppel, H., Eds.; World Scientific Publishing Co.: Singapore, 2004; pp. 323–368. [Google Scholar]
- Lehr, A.; Gómez, S.; Parkes, M.A.; Worth, G.A. The role of vibronic coupling in the electronic spectroscopy of maleimide: A multi-mode and multi-state quantum dynamics study. Phys. Chem. Chem. Phys. 2020, 22, 25272–25283. [Google Scholar] [CrossRef]
- Sala, M.; Lasorne, B.; Gatti, F.; Guérin, S. The role of the low-lying dark nπ* states in the photophysics of pyrazine: A quantum dynamics study. Phys. Chem. Chem. Phys. 2014, 16, 15957–15967. [Google Scholar] [CrossRef]
- Plasser, F.; Gómez, S.; Menger, M.F.S.J.; Mai, S.; González, L. Highly efficient surface hopping dynamics using a linear vibronic coupling model. Phys. Chem. Chem. Phys. 2019, 21, 57–69. [Google Scholar] [CrossRef]
- Aranda, D.; Santoro, F. Vibronic Spectra of π-Conjugated Systems with a Multitude of Coupled States. A Protocol Based on Linear Vibronic Coupling Models and Quantum Dynamics Tested on Hexahelicene. J. Chem. Theory Comput. 2021, 17, 1691–1700. [Google Scholar] [CrossRef]
- Penfold, T.J.; Gindensperger, E.; Daniel, C.; Marian, C.M. Spin-Vibronic Mechanism for Intersystem Crossing. Chem. Rev. 2018, 118, 6975–7025. [Google Scholar] [CrossRef]
- Fumanal, M.; Gindensperger, E.; Daniel, C. Ultrafast Intersystem Crossing vs. Internal Conversion in α-Diimine Transition Metal Complexes: Quantum Evidence. J. Phys. Chem. Lett. 2018, 9, 5189–5195. [Google Scholar] [CrossRef]
- Meyer, H.-D.; Gatti, F.; Worth, G.A. (Eds.) Multidimensional Quantum Dynamics: MCTDH Theory and Applications; Wiley-VCH: Weinheim, Germany, 2009. [Google Scholar]
- Beck, M.; Jäckle, A.; Worth, G.; Meyer, H.D. The multiconfiguration time-dependent Hartree (MCTDH) method: A highly efficient algorithm for propagating wavepackets. Phys. Rep. 2000, 324, 1–105. [Google Scholar] [CrossRef]
- Wang, H.; Thoss, M. Multilayer formulation of the multiconfiguration time-dependent Hartree theory. J. Chem. Phys. 2003, 119, 1289–1299. [Google Scholar] [CrossRef]
- Wang, H. Multilayer Multiconfiguration Time-Dependent Hartree Theory. J. Phys. Chem. A 2015, 119, 7951–7965. [Google Scholar] [CrossRef] [PubMed]
- Santoro, F.; Jacquemin, D. Going beyond the vertical approximation with time-dependent density functional theory. WIREs Comput. Mol. Sci. 2016, 6, 460–486. [Google Scholar] [CrossRef]
- Yaghoubi Jouybari, M.; Liu, Y.; Improta, R.; Santoro, F. Ultrafast Dynamics of the Two Lowest Bright Excited States of Cytosine and 1-Methylcytosine: A Quantum Dynamical Study. J. Chem. Theory Comput. 2020, 16, 5792–5808. [Google Scholar] [CrossRef] [PubMed]
- Liu, Y.; Cerezo, J.; Lin, N.; Zhao, X.; Improta, R.; Santoro, F. Comparison of the results of a mean-field mixed quantum/classical method with full quantum predictions for nonadiabatic dynamics: Application to the ππ*/nπ* decay of thymine. Theor. Chem. Acc. 2018, 137, 40. [Google Scholar] [CrossRef]
- Yaghoubi Jouybari, M.; Liu, Y.; Improta, R.; Santoro, F. Quantum dynamics of the ππ*/nπ* decay of the epigenetic nucleobase 1,5-dimethyl-cytosine in the gas phase. Phys. Chem. Chem. Phys. 2020, 22, 26525–26535. [Google Scholar] [CrossRef] [PubMed]
- Mai, S.; Marquetand, P.; Richter, M.; González-Vazquez, J.; González, L. Singlet and Triplet Excited-State Dynamics Study of the Keto and Enol Tautomers of Cytosine. ChemPhysChem 2013, 14, 2920–2931. [Google Scholar] [CrossRef] [PubMed]
- Richter, M.; Mai, S.; Marquetand, P.; González, L. Ultrafast intersystem crossing dynamics in uracil unravelled by ab initio molecular dynamics. Phys. Chem. Chem. Phys. 2014, 16, 24423–24436. [Google Scholar] [CrossRef]
- Mai, S.; Richter, M.; Marquetand, P.; González, L. The DNA nucleobase thymine in motion–Intersystem crossing simulated with surface hopping. Chem. Phys. 2017, 482, 9–15. [Google Scholar] [CrossRef]
- Yanai, T.; Tew, D.; Handy, N. A new hybrid exchange-correlation functional using the Coulomb-attenuating method (CAM-B3LYP). Chem. Phys. Lett. 2004, 393, 51. [Google Scholar] [CrossRef]
- Adamo, C.; Barone, V. Toward reliable density functional methods without adjustable parameters: The PBE0 model. J. Chem. Phys. 1999, 110, 6158. [Google Scholar] [CrossRef]
- Ernzerhof, M.; Scuseria, G.E. Assessment of the Perdew–Burke–Ernzerhof exchange-correlation functional. J. Chem. Phys. 1999, 110, 5029–5036. [Google Scholar] [CrossRef]
- Frisch, M.J.; Trucks, G.W.; Schlegel, H.B.; Scuseria, G.E.; Robb, M.A.; Cheeseman, J.R.; Scalmani, G.; Barone, V.; Petersson, G.A.; Nakatsuji, H.; et al. Gaussian~16 Revision B.01; Gaussian Inc.: Wallingford, CT, USA, 2016. [Google Scholar]
- Manthe, U. Layered discrete variable representations and their application within the multiconfigurational time-dependent Hartree approach. J. Chem. Phys. 2009, 130, 054109. [Google Scholar] [CrossRef]
- Vendrell, O.; Meyer, H.D. Multilayer multiconfiguration time-dependent Hartree method: Implementation and applications to a Henon-Heiles Hamiltonian and to pyrazine. J. Chem. Phys. 2011, 134, 044135. [Google Scholar] [CrossRef]
- Worth, G.A.; Giri, K.; Richings, G.W.; Beck, M.H.; Jäckle, A.; Meyer, H.D. The QUANTICS Package, Version 1.1; University of Birmingham: Birmingham, UK, 2015. [Google Scholar]
- Raab, A.; Worth, G.A.; Meyer, H.D.; Cederbaum, L.S. Molecular dynamics of pyrazine after excitation to the S2 electronic state using a realistic 24-mode model Hamiltonian. J. Chem. Phys. 1999, 110, 936–946. [Google Scholar] [CrossRef]
- Avila Ferrer, F.J.; Santoro, F. Comparison of Vertical and Adiabatic Harmonic Approaches for the Calculation of the Vibrational Structure of Electronic Spectra. Phys. Chem. Chem. Phys. 2012, 14, 13549–13563. [Google Scholar] [CrossRef] [PubMed]
- Lax, M. The Franck-Condon Principle and Its Application to Crystals. J. Chem. Phys. 1952, 20, 1752–1760. [Google Scholar] [CrossRef]
- Crespo-Otero, R.; Barbatti, M. Spectrum simulation and decomposition with nuclear ensemble: Formal derivation and application to benzene, furan and 2-phenylfuran. Theor. Chem. Acc. 2012, 131, 1237. [Google Scholar] [CrossRef]
- Zuehlsdorff, T.J.; Isborn, C.M. Combining the ensemble and Franck-Condon approaches for calculating spectral shapes of molecules in solution. J. Chem. Phys. 2018, 148, 024110. [Google Scholar] [CrossRef]
- Zuehlsdorff, T.J.; Napoli, J.A.; Milanese, J.M.; Markland, T.E.; Isborn, C.M. Unraveling electronic absorption spectra using nuclear quantum effects: Photoactive yellow protein and green fluorescent protein chromophores in water. J. Chem. Phys. 2018, 149, 024107. [Google Scholar] [CrossRef] [PubMed]
- Cerezo, J.; Aranda, D.; Avila Ferrer, F.J.; Prampolini, G.; Santoro, F. Adiabatic-Molecular Dynamics Generalized Vertical Hessian Approach: A Mixed Quantum Classical Method To Compute Electronic Spectra of Flexible Molecules in the Condensed Phase. J. Chem. Theory Comput. 2020, 16, 1215–1231. [Google Scholar] [CrossRef] [PubMed]
- Law, Y.K.; Hassanali, A.A. The importance of nuclear quantum effects in spectral line broadening of optical spectra and electrostatic properties in aromatic chromophores. J. Chem. Phys. 2018, 148, 102331. [Google Scholar] [CrossRef]
- Xue, B.X.; Barbatti, M.; Dral, P.O. Machine Learning for Absorption Cross Sections. J. Phys. Chem. A 2020, 124, 7199–7210. [Google Scholar] [CrossRef] [PubMed]
- Cerezo, J.; Santoro, F.; Prampolini, G. Comparing Classical Approaches with Empirical or Quantum-Mechanically Derived Force Fields for the Simulation Electronic Lineshapes: Application to Coumarin Dyes. Theor. Chem. Acc. 2016, 135, 1–21. [Google Scholar] [CrossRef]
- Clark, L.B.; Peschel, G.G.; Tinoco, I. Vapor Spectra and Heats of Vaporization of Some Purine and Pyrimidine Bases. J. Phys. Chem. 1965, 69, 3615–3618. [Google Scholar] [CrossRef]
- Polewski, K.; Zinger, D.; Trunk, J.; Monteleone, D.C.; Sutherland, J.C. Fluorescence of matrix isolated guanine and 7-methylguanine. J. Photochem. Photobiol. B 1994, 24, 169–177. [Google Scholar] [CrossRef]
- Clark, L.B.; Tinoco, I. Correlations in the Ultraviolet Spectra of the Purine and Pyrimidine Bases. J. Am. Chem. Soc. 1965, 87, 11–15. [Google Scholar] [CrossRef]
- Fedotov, D.A.; Paul, A.C.; Posocco, P.; Santoro, F.; Garavelli, M.; Koch, H.; Coriani, S.; Improta, R. Excited-State Absorption of Uracil in the Gas Phase: Mapping the Main Decay Paths by Different Electronic Structure Methods. J. Chem. Theory Comput. 2021, 17, 1638–1652. [Google Scholar] [CrossRef] [PubMed]
- Gustavsson, T.; Bányász, Á.; Lazzarotto, E.; Markovitsi, D.; Scalmani, G.; Frisch, M.J.; Barone, V.; Improta, R. Singlet Excited-State Behavior of Uracil and Thymine in Aqueous Solution: A Combined Experimental and Computational Study of 11 Uracil Derivatives. J. Am. Chem. Soc. 2006, 128, 607–619. [Google Scholar] [CrossRef] [PubMed]
- Improta, R.; Barone, V. Excited states behavior of nucleobases in solution: Insights from computational studies. In Photoinduced Phenomena in Nucleic Acids I: Nucleobases in the Gas Phase and in Solvents; Barbatti, M., Borin, C.A., Ullrich, S., Eds.; Springer International Publishing: Cham, Switzerland, 2015; Volume 355, pp. 329–358. [Google Scholar]
- Pepino, A.J.; Segarra-Martí, J.; Nenov, A.; Rivalta, I.; Improta, R.; Garavelli, M. UV-induced long-lived decays in solvated pyrimidine nucleosides resolved at the MS-CASPT2/MM level. Phys. Chem. Chem. Phys. 2018, 20, 6877–6890. [Google Scholar] [CrossRef]
- Sapunar, M.; Domcke, W.; Došlić, N. UV absorption spectra of DNA bases in the 350–190 nm range: Assignment and state specific analysis of solvation effects. Phys. Chem. Chem. Phys. 2019, 21, 22782–22793. [Google Scholar] [CrossRef] [PubMed]
- Milovanović, B.; Novak, J.; Etinski, M.; Domcke, W.; Došić, N. Simulation of UV absorption spectra and relaxation dynamics of uracil and uracil–water clusters. Phys. Chem. Chem. Phys. 2021, 23, 2594–2604. [Google Scholar] [CrossRef] [PubMed]
- Wolf, T.; Myhre, R.; Cryan, J.; Coriani, S.; Squibb, R.; Battistoni, A.; Berrah, N.; Bostedt, C.; Bucksbaum, P.; Coslovich, G.; et al. Probing ultrafast ππ*/nπ* internal conversion in organic chromophores via K-edge resonant absorption. Nat. Commun. 2017, 8, 29. [Google Scholar] [CrossRef]
- Barbatti, M.; Aquino, A.; Szymczak, J.; Nachtigallová, D.; Hobza, P.; Lischka, H. Relaxation Mechanisms of UV-Photoexcited DNA and RNA Nucleobases. Proc. Natl. Acad. Sci. USA 2010, 107, 21453–21458. [Google Scholar] [CrossRef]
- Kang, H.; Lee, K.T.; Jung, B.; Ko, Y.J.; Kim, S.K. Intrinsic Lifetimes of the Excited State of DNA and RNA Bases. J. Am. Chem. Soc. 2002, 124, 12958–12959. [Google Scholar] [CrossRef] [PubMed]
- Canuel, C.; Mons, M.; Piuzzi, F.; Tardivel, B.; Dimicoli, I.; Elhanine, M. Excited states dynamics of DNA and RNA bases: Characterization of a stepwise deactivation pathway in the gas phase. J. Chem. Phys. 2005, 122, 074316. [Google Scholar] [CrossRef]
- Ullrich, S.; Schultz, T.; Zgierski, M.Z.; Stolow, A. Electronic relaxation dynamics in DNA and RNA bases studied by time-resolved photoelectron spectroscopy. Phys. Chem. Chem. Phys. 2004, 6, 2796–2801. [Google Scholar] [CrossRef]
- Hudock, H.R.; Levine, B.G.; Thompson, A.L.; Satzger, H.; Townsend, D.; Gador, N.; Ullrich, S.; Stolow, A.; Martínez, T.J. Ab Initio Molecular Dynamics and Time-Resolved Photoelectron Spectroscopy of Electronically Excited Uracil and Thymine. J. Phys. Chem. A 2007, 111, 8500–8508. [Google Scholar] [CrossRef] [PubMed]
- González-Vázquez, J.; González, L.; Samoylova, E.; Schultz, T. Thymine relaxation after UV irradiation: The role of tautomerization and πσ* states. Phys. Chem. Chem. Phys. 2009, 11, 3927–3934. [Google Scholar] [CrossRef]
- He, Y.; Wu, C.; Kong, W. Decay Pathways of Thymine and Methyl-Substituted Uracil and Thymine in the Gas Phase. J. Phys. Chem. A 2003, 107, 5145–5148. [Google Scholar] [CrossRef]
- Szymczak, J.J.; Barbatti, M.; Soo Hoo, J.T.; Adkins, J.A.; Windus, T.L.; Nachtigallová, D.; Lischka, H. Photodynamics Simulations of Thymine: Relaxation into the First Excited Singlet State. J. Phys. Chem. A 2009, 113, 12686–12693. [Google Scholar] [CrossRef] [PubMed]
- Nachtigallová, D.; Aquino, A.J.A.; Szymczak, J.J.; Barbatti, M.; Hobza, P.; Lischka, H. Nonadiabatic Dynamics of Uracil: Population Split among Different Decay Mechanisms. J. Phys. Chem. A 2011, 115, 5247–5255. [Google Scholar] [CrossRef] [PubMed]
- Asturiol, D.; Lasorne, B.; Robb, M.A.; Blancafort, L. Photophysics of the ππ* and nπ* States of Thymine: MS-CASPT2 Minimum-Energy Paths and CASSCF on-the-Fly Dynamics. J. Phys. Chem. A 2009, 113, 10211–10218. [Google Scholar] [CrossRef]
- Asturiol, D.; Lasorne, B.; Worth, G.A.; Robb, M.A.; Blancafort, L. Exploring the Sloped-to-Peaked S2/S1 Seam of Intersection of Thymine with Electronic Structure and Direct Quantum Dynamics Calculations. Phys. Chem. Chem. Phys. 2010, 12, 4949–4958. [Google Scholar] [CrossRef]
- Picconi, D.; Barone, V.; Lami, A.; Santoro, F.; Improta, R. The Interplay between ππ*/nπ* Excited States in Gas-Phase Thymine: A Quantum Dynamical Study. ChemPhysChem 2011, 12, 1957–1968. [Google Scholar] [CrossRef]
- Picconi, D.; Lami, A.; Santoro, F. Hierarchical transformation of Hamiltonians with linear and quadratic couplings for nonadiabatic quantum dynamics: Application to the ππ*/nπ* internal conversion in thymine. J. Chem. Phys. 2012, 136, 244104. [Google Scholar] [CrossRef]
- Lan, Z.; Fabiano, E.; Thiel, W. Photoinduced Nonadiabatic Dynamics of Pyrimidine Nucleobases: On-the-Fly Surface-Hopping Study with Semiempirical Methods. J. Phys. Chem. B 2009, 113, 3548–3555. [Google Scholar] [CrossRef] [PubMed]
- Kosma, K.; Schröter, C.; Samoylova, E.; Hertel, I.V.; Schultz, T. Excited-State Dynamics of Cytosine Tautomers. J. Am. Chem. Soc. 2009, 131, 16939–16943. [Google Scholar] [CrossRef] [PubMed]
- Ho, J.W.; Yen, H.C.; Chou, W.K.; Weng, C.N.; Cheng, L.H.; Shi, H.Q.; Lai, S.H.; Cheng, P.Y. Disentangling Intrinsic Ultrafast Excited-State Dynamics of Cytosine Tautomers. J. Phys. Chem. A 2011, 115, 8406–8418. [Google Scholar] [CrossRef] [PubMed]
- Nakayama, A.; Harabuchi, Y.; Yamazaki, S.; Taketsugu, T. Photophysics of cytosine tautomers: New insights into the nonradiative decay mechanisms from MS-CASPT2 potential energy calculations and excited-state molecular dynamics simulations. Phys. Chem. Chem. Phys. 2013, 15, 12322–12339. [Google Scholar] [CrossRef] [PubMed]
- Hudock, H.R.; Martínez, T.J. Excited-State Dynamics of Cytosine Reveal Multiple Intrinsic Subpicosecond Pathways. ChemPhysChem 2008, 9, 2486–2490. [Google Scholar] [CrossRef]
- Barbatti, M.; Aquino, A.J.A.; Szymczak, J.J.; Nachtigallová, D.; Lischka, H. Photodynamical simulations of cytosine: Characterization of the ultrafast bi-exponential UV deactivation. Phys. Chem. Chem. Phys. 2011, 13, 6145–6155. [Google Scholar] [CrossRef]
- González-Vázquez, J.; González, L. A Time-Dependent Picture of the Ultrafast Deactivation of keto-Cytosine Including Three-State Conical Intersections. ChemPhysChem 2010, 11, 3617–3624. [Google Scholar] [CrossRef]
- Santoro, F.; Improta, R.; Fahleson, T.; Kauczor, J.; Norman, P.; Coriani, S. Relative Stability of the La and Lb Excited States in Adenine and Guanine: Direct Evidence from TD-DFT Calculations of MCD Spectra. J. Phys. Chem. Lett. 2014, 5, 1806–1811. [Google Scholar] [CrossRef] [PubMed]
- Fabiano, E.; Thiel, W. Nonradiative Deexcitation Dynamics of 9H-Adenine: An OM2 Surface Hopping Study. J. Phys. Chem. A 2008, 112, 6859–6863. [Google Scholar] [CrossRef]
- Barbatti, M.; Lischka, H. Nonadiabatic Deactivation of 9H-Adenine: A Comprehensive Picture Based on Mixed Quantum−Classical Dynamics. J. Am. Chem. Soc. 2008, 130, 6831–6839. [Google Scholar] [CrossRef]
- Mitrić, R.; Werner, U.; Wohlgemuth, M.; Seifert, G.; Bonačić-Koutecký, V. Nonadiabatic Dynamics within Time-Dependent Density Functional Tight Binding Method. J. Phys. Chem. A 2009, 113, 12700–12705. [Google Scholar] [CrossRef]
- Picconi, D.; Avila Ferrer, F.J.; Improta, R.; Lami, A.; Santoro, F. Quantum-classical effective-modes dynamics of the ππ*→ nπ* decay in 9H-adenine. A quadratic vibronic coupling model. Faraday Discuss. 2013, 163, 223–242. [Google Scholar] [CrossRef]
- Conti, I.; Altoè, P.; Stenta, M.; Garavelli, M.; Orlandi, G. Adenine deactivation in DNA resolved at the CASPT2//CASSCF/AMBER level. Phys. Chem. Chem. Phys. 2010, 12, 5016–5023. [Google Scholar] [CrossRef]
- Kánnár, D.; Szalay, P. Benchmarking coupled cluster methods on singlet excited states of nucleobases. J. Mol. Model. 2014, 20, 2503. [Google Scholar] [CrossRef]
- Barbatti, M.; Lan, Z.; Crespo-Otero, R.; Szymczak, J.J.; Lischka, H.; Thiel, W. Critical appraisal of excited state nonadiabatic dynamics simulations of 9H-adenine. J. Chem. Phys. 2012, 137, 22A503. [Google Scholar] [CrossRef]
- Szalay, P.G.; Watson, T.; Perera, A.; Lotrich, V.F.; Bartlett, R.J. Benchmark Studies on the Building Blocks of DNA. 1. Superiority of Coupled Cluster Methods in Describing the Excited States of Nucleobases in the Franck–Condon Region. J. Phys. Chem. A 2012, 116, 6702–6710. [Google Scholar] [CrossRef] [PubMed]
- Ovchinnikov, V.A.; Sundholm, D. Coupled-cluster and density functional theory studies of the electronic 0–0 transitions of the DNA bases. Phys. Chem. Chem. Phys. 2014, 16, 6931–6941. [Google Scholar] [CrossRef] [PubMed]
- Yamazaki, S.; Domcke, W.; Sobolewski, A.L. Nonradiative Decay Mechanisms of the Biologically Relevant Tautomer of Guanine. J. Phys. Chem. A 2008, 112, 11965–11968. [Google Scholar] [CrossRef] [PubMed]
- Chen, H.; Li, S. Ab initio study on deactivation pathways of excited 9H-guanine. J. Chem. Phys. 2006, 124, 154315. [Google Scholar] [CrossRef]
- Serrano-Andrés, L.; Merchán, M.; Borin, A.C. A Three-State Model for the Photophysics of Guanine. J. Am. Chem. Soc. 2008, 130, 2473–2484. [Google Scholar] [CrossRef] [PubMed]
- Lan, Z.; Fabiano, E.; Thiel, W. Photoinduced Nonadiabatic Dynamics of 9H-Guanine. ChemPhysChem 2009, 10, 1225–1229. [Google Scholar] [CrossRef] [PubMed]
- Barbatti, M.; Szymczak, J.J.; Aquino, A.J.A.; Nachtigallová, D.; Lischka, H. The decay mechanism of photoexcited guanine—A nonadiabatic dynamics study. J. Chem. Phys. 2011, 134, 014304. [Google Scholar] [CrossRef]
- Improta, R.; Barone, V.; Lami, A.; Santoro, F. Quantum Dynamics of the Ultrafast ππ*/nπ* Population Transfer in Uracil and 5-Fluoro-Uracil in Water and Acetonitrile. J. Phys. Chem. B 2009, 113, 14491–14503. [Google Scholar] [CrossRef]
- Banyasz, A.; Gustavsson, T.; Onidas, D.; Changenet-Barret, P.; Markovitsi, D.; Improta, R. Multi-Pathway Excited State Relaxation of Adenine Oligomers in Aqueous Solution: A Joint Theoretical and Experimental Study. Chem. Eur. J. 2013, 19, 3762–3774. [Google Scholar] [CrossRef]
- Erickson, B.A.; Heim, Z.N.; Pieri, E.; Liu, E.; Martinez, T.J.; Neumark, D.M. Relaxation Dynamics of Hydrated Thymine, Thymidine, and Thymidine Monophosphate Probed by Liquid Jet Time-Resolved Photoelectron Spectroscopy. J. Phys. Chem. A 2019, 123, 10676–10684. [Google Scholar] [CrossRef] [PubMed]
- Williams, H.L.; Erickson, B.A.; Neumark, D.M. Time-resolved photoelectron spectroscopy of adenosine and adenosine monophosphate photodeactivation dynamics in water microjets. J. Chem. Phys. 2018, 148, 194303. [Google Scholar] [CrossRef] [PubMed]
- Wang, X.; Zhou, Z.; Tang, Y.; Chen, J.; Zhong, D.; Xu, J. Excited State Decay Pathways of 2’-Deoxy-5-methylcytidine and Deoxycytidine Revisited in Solution: A Comprehensive Kinetic Study by Femtosecond Transient Absorption. J. Phys. Chem. B 2018, 122, 7027–7037. [Google Scholar] [CrossRef]
- Ghosh, S.; Verma, P.; Cramer, C.J.; Gagliardi, L.; Truhlar, D.G. Combining Wave Function Methods with Density Functional Theory for Excited States. Chem. Rev. 2018, 118, 7249–7292. [Google Scholar] [CrossRef] [PubMed]
- Park, J.W.; Al-Saadon, R.; MacLeod, M.K.; Shiozaki, T.; Vlaisavljevich, B. Multireference Electron Correlation Methods: Journeys along Potential Energy Surfaces. Chem. Rev. 2020, 120, 5878–5909. [Google Scholar] [CrossRef]
- Gonon, B.; Lasorne, B.; Karras, G.; Joubert-Doriol, L.; Lauvergnat, D.; Billard, F.; Lavorel, B.; Faucher, O.; Guérin, S.; Hertz, E.; et al. A generalized vibronic-coupling Hamiltonian for molecules without symmetry: Application to the photoisomerization of benzopyran. J. Chem. Phys. 2019, 150, 124109. [Google Scholar] [CrossRef]
- Aleotti, F.; Aranda, D.; Yaghoubi Jouybari, M.; Garavelli, M.; Nenov, A.; Santoro, F. Parameterization of a linear vibronic coupling model with multiconfigurational electronic structure methods to study the quantum dynamics of photoexcited pyrene. J. Chem. Phys. 2021, 154, 104106. [Google Scholar] [CrossRef]
- Madsen, D.; Christiansen, O.; Norman, P.; König, C. Vibrationally resolved emission spectra of luminescent conjugated oligothiophenes from anharmonic calculations. Phys. Chem. Chem. Phys. 2019, 21, 17410–17422. [Google Scholar] [CrossRef]
- Madsen, N.K.; Jensen, A.B.; Hansen, M.B.; Christiansen, O. A general implementation of time-dependent vibrational coupled-cluster theory. J. Chem. Phys. 2020, 153, 234109. [Google Scholar] [CrossRef] [PubMed]
- Marsili, E.; Olivucci, M.; Lauvergnat, D.; Agostini, F. Quantum and Quantum-Classical Studies of the Photoisomerization of a Retinal Chromophore Model. J. Chem. Theory Comput. 2020, 16, 6032–6048. [Google Scholar] [CrossRef] [PubMed]
- Cerezo, J.; Liu, Y.; Lin, N.; Zhao, X.; Improta, R.; Santoro, F. Mixed Quantum/Classical Method for Nonadiabatic Quantum Dynamics in Explicit Solvent Models: The ππ*/nπ* Decay of Thymine in Water as a Test Case. J. Chem. Theory Comput. 2018, 14, 820–832. [Google Scholar] [CrossRef] [PubMed]
Sample Availability: Samples of the compounds are not available from the authors. |


| Uracil | |||||||
| CAM-B3LYP | PBE0 | ||||||
| State | Char. | State | Char. | ||||
| S | 5.10 | 0.000 | n1 | S | 4.82 | 0.000 | n1 |
| S | 5.50 | 0.190 | 1 | S | 5.33 | 0.150 | 1 |
| S | 6.18 | 0.003 | Ry1 | S | 6.05 | 0.002 | Ry1 |
| S | 6.62 | 0.045 | 2 | S | 6.14 | 0.039 | 2 |
| S | 6.88 | 0.170 | 3 | S | 6.63 | 0.130 | 3 |
| Thymine | |||||||
| CAM-B3LYP | PBE0 | ||||||
| State | Char. | State | Char. | ||||
| S | 5.14 | 0.000 | n | S | 4.89 | 0.000 | n |
| S | 5.31 | 0.192 | S | 5.13 | 0.154 | ||
| S | 5.94 | 0.001 | S | 5.80 | 0.000 | ||
| S | 6.47 | 0.000 | n | S | 6.10 | 0.000 | n |
| S | 6.67 | 0.055 | S | 6.23 | 0.071 | ||
| S | 6.73 | 0.218 | S | 6.45 | 0.155 | ||
| Cytosine | |||||||
| CAM-B3LYP | PBE0 | ||||||
| State | Char. | State | Char. | ||||
| S | 5.01 | 0.067 | S | 4.79 | 0.047 | ||
| S | 5.29 | 0.002 | n | S | 4.97 | 0.001 | n + n |
| S | 5.91 | 0.000 | n | S | 5.36 | 0.001 | n − n |
| S | 5.94 | 0.134 | S | 5.61 | 0.099 | ||
| S | 6.13 | 0.000 | n | S | 5.84 | 0.000 | n |
| Adenine | |||||||
| CAM-B3LYP | PBE0 | ||||||
| State | Char. | State | Char. | ||||
| S | 5.37 | 0.000 | n | S | 5.11 | 0.001 | n |
| S | 5.39 | 0.286 | L | S | 5.16 | 0.231 | L |
| S | 5.52 | 0.015 | L | S | 5.41 | 0.037 | L |
| S | 5.87 | 0.009 | Ry1 | S | 5.65 | 0.007 | Ry1 |
| 9H-Guanine | |||||||
| CAM-B3LYP | PBE0 | ||||||
| State | Char. | State | Char. | ||||
| S | 5.18 | 0.173 | L | S | 4.86 | 0.002 | Ry1 |
| S | 5.22 | 0.003 | Ry1 | S | 5.04 | 0.153 | L |
| S | 5.61 | 0.000 | n1 | S | 5.36 | 0.282 | L |
| S | 5.63 | 0.336 | L | S | 5.47 | 0.000 | n1 |
| 7H-Guanine | |||||||
| CAM-B3LYP | PBE0 | ||||||
| State | Char. | State | Char. | ||||
| S | 4.91 | 0.151 | L | S | 4.72 | 0.127 | L |
| S | 5.30 | 0.004 | Ry1 | S | 4.98 | 0.003 | Ry1 |
| S | 5.51 | 0.000 | n1 (+n) | S | 5.25 | 0.000 | n1 (+n) |
| S | 5.87 | 0.158 | L | S | 5.59 | 0.122 | L |
Publisher’s Note: MDPI stays neutral with regard to jurisdictional claims in published maps and institutional affiliations. |
© 2021 by the authors. Licensee MDPI, Basel, Switzerland. This article is an open access article distributed under the terms and conditions of the Creative Commons Attribution (CC BY) license (http://creativecommons.org/licenses/by/4.0/).
Share and Cite
Green, J.A.; Jouybari, M.Y.; Aranda, D.; Improta, R.; Santoro, F. Nonadiabatic Absorption Spectra and Ultrafast Dynamics of DNA and RNA Photoexcited Nucleobases. Molecules 2021, 26, 1743. https://doi.org/10.3390/molecules26061743
Green JA, Jouybari MY, Aranda D, Improta R, Santoro F. Nonadiabatic Absorption Spectra and Ultrafast Dynamics of DNA and RNA Photoexcited Nucleobases. Molecules. 2021; 26(6):1743. https://doi.org/10.3390/molecules26061743
Chicago/Turabian StyleGreen, James A., Martha Yaghoubi Jouybari, Daniel Aranda, Roberto Improta, and Fabrizio Santoro. 2021. "Nonadiabatic Absorption Spectra and Ultrafast Dynamics of DNA and RNA Photoexcited Nucleobases" Molecules 26, no. 6: 1743. https://doi.org/10.3390/molecules26061743
APA StyleGreen, J. A., Jouybari, M. Y., Aranda, D., Improta, R., & Santoro, F. (2021). Nonadiabatic Absorption Spectra and Ultrafast Dynamics of DNA and RNA Photoexcited Nucleobases. Molecules, 26(6), 1743. https://doi.org/10.3390/molecules26061743